The Phosphate Outlook - FIRT · The Phosphate Outlook Corey Giasson, MBA Manager, Market Research...
44
The Phosphate Outlook The Phosphate Outlook Corey Corey Giasson Giasson , MBA , MBA Manager, Market Research Manager, Market Research PotashCorp PotashCorp 2007 Fertilizer Outlook and Technology Conference 2007 Fertilizer Outlook and Technology Conference Arlington, Virginia Arlington, Virginia November 7, 2006 November 7, 2006
Transcript of The Phosphate Outlook - FIRT · The Phosphate Outlook Corey Giasson, MBA Manager, Market Research...

The Phosphate OutlookThe Phosphate Outlook
Corey Corey GiassonGiasson, MBA, MBAManager, Market ResearchManager, Market Research
PotashCorpPotashCorp
2007 Fertilizer Outlook and Technology Conference2007 Fertilizer Outlook and Technology ConferenceArlington, VirginiaArlington, VirginiaNovember 7, 2006November 7, 2006

ForwardForward--Looking StatementsLooking StatementsThis presentation contains forwardThis presentation contains forward--looking statements. These statements are based on looking statements. These statements are based on certain factors and assumptions as set forth in this release inccertain factors and assumptions as set forth in this release including foreign exchange luding foreign exchange rates, expected growth, results of operations, performance and brates, expected growth, results of operations, performance and business prospects and usiness prospects and opportunities. While the company considers these factors and assopportunities. While the company considers these factors and assumptions to be umptions to be reasonable based on information currently available, they may prreasonable based on information currently available, they may prove to be incorrect. A ove to be incorrect. A number of factors could cause actual results to differ materiallnumber of factors could cause actual results to differ materially from those in the forwardy from those in the forward--looking statements, including, but not limited to: fluctuationslooking statements, including, but not limited to: fluctuations in supply and demand in in supply and demand in fertilizer, sulfur, transportation and petrochemical markets; chfertilizer, sulfur, transportation and petrochemical markets; changes in competitive anges in competitive pressures, including pricing pressures; risks associated with napressures, including pricing pressures; risks associated with natural gas and other hedging tural gas and other hedging activities; changes in capital markets; changes in currency and activities; changes in capital markets; changes in currency and exchange rates; exchange rates; unexpected geological or environmental conditions; and governmenunexpected geological or environmental conditions; and government policy changes. t policy changes. Additional risks and uncertainties can be found in our 2005 annuAdditional risks and uncertainties can be found in our 2005 annual report to shareholders al report to shareholders and in filings with the U.S. Securities and Exchange Commission and in filings with the U.S. Securities and Exchange Commission and Canadian provincial and Canadian provincial securities commissions. Forwardsecurities commissions. Forward--looking statements are given only as at the date of this looking statements are given only as at the date of this presentation and the company disclaims any obligation to update presentation and the company disclaims any obligation to update or revise the forwardor revise the forward--looking statements, whether as a result of new information, futulooking statements, whether as a result of new information, future events or otherwise. re events or otherwise.
The Phosphate Outlook The Phosphate Outlook
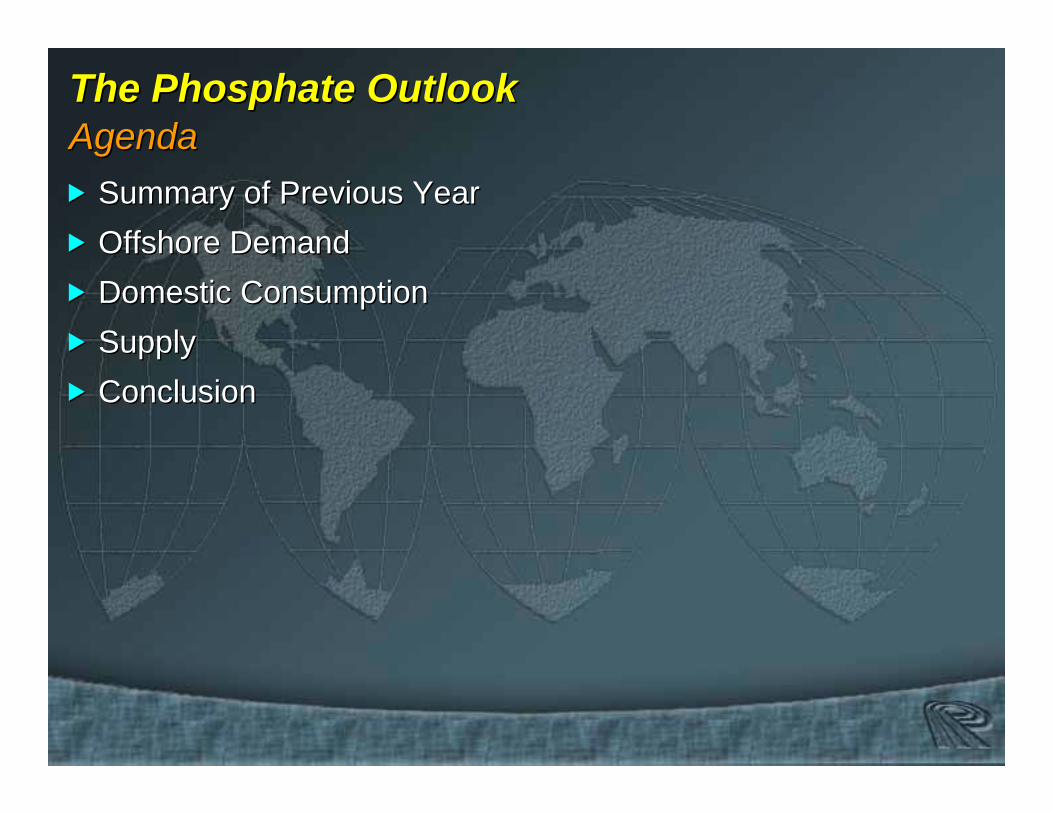
Summary of Previous YearSummary of Previous YearOffshore DemandOffshore DemandDomestic ConsumptionDomestic ConsumptionSupplySupplyConclusionConclusion
AgendaAgenda

The Phosphate Outlook The Phosphate Outlook
Summary of Previous YearSummary of Previous YearOffshore DemandOffshore DemandDomestic ConsumptionDomestic ConsumptionSupplySupplyConclusionConclusion
AgendaAgenda

Source: FerteconSource: Fertecon
FOB Tampa DAP PriceFOB Tampa DAP Price
100
150
200
250
300
Jan-00 Jul-00 Jan-01 Jul-01 Jan-02 Jul-02 Jan-03 Jul-03 Jan-04 Jul-04 Jan-05 Jul-05 Jan-06 Jul-06
FOB Tampa DAP Adjusted for Inflation
$US/Tonne FOB
$256*$256*
* Average for the month* Average for the month--toto--datedate
$212*$212*

Source: TFI, Fertecon, PotashCorpSource: TFI, Fertecon, PotashCorp
0
50
100
150
200
250
Jan-00 Jan-01 Jan-02 Jan-03 Jan-04 Jan-05 Jan-060
50
100
150
200
250
US DAP Cost US DAP Cost vsvs DAP PriceDAP Price
Cost ($US/Short Ton)Cost ($US/Short Ton)
Estimate for an AverageEstimate for an Average--Cost ProducerCost ProducerDAP FOB Tampa Price ($US/Short Ton)DAP FOB Tampa Price ($US/Short Ton)
Sulfur
Rock
Ammonia
Other
* Average for the month* Average for the month--toto--datedate

Source: TFI, Fertecon, PotashCorpSource: TFI, Fertecon, PotashCorp
US DAP Yearly Average DAP MarginUS DAP Yearly Average DAP Margin
-15
-10
-5
0
5
10
15
20
25
30
35
2000 2001 2002 2003 2004 2005 YTD 2006 7-YearAverage
-$12
+$32
+$4.7
$US/Short Ton
+$10
+$24
-$8 -$9
$0$0
Estimate for an AverageEstimate for an Average--Cost ProducerCost Producer

Source: TFI, Fertecon, PotashCorpSource: TFI, Fertecon, PotashCorp
DAP ROI at the Top of the CycleDAP ROI at the Top of the Cycle
1mmt of new P1mmt of new P22OO5 5 capacity (2.2mmt of DAP) capacity (2.2mmt of DAP) $1 Billion$1 BillionCost of New CapacityCost of New Capacity $ 460/mt$ 460/mt
Average Margin (JanAverage Margin (Jan--00 to present)00 to present) $ 5/mt$ 5/mtPayback Period Payback Period 92 years92 yearsROIROI 1%1%
Current Margin ($35/st)Current Margin ($35/st) $ 40/mt$ 40/mtPayback PeriodPayback Period ~12 years~12 yearsROIROI ~9%~9%
And it is currently considered the top of the market !?!And it is currently considered the top of the market !?!
DAP Price at a 15DAP Price at a 15--20% Return20% Return $293$293--320/mt320/mt

Source: British Sulphur, FerteconSource: British Sulphur, Fertecon
Global Net Change DAP/MAP CapacityGlobal Net Change DAP/MAP Capacity
Morocco Morocco +1.7M TPY+1.7M TPY
Other Asia Other Asia 0.0M TPY0.0M TPY
20002000--2006E 2006E
North America North America --5.8M TPY5.8M TPY
FSU FSU +2.0M TPY+2.0M TPY
Central America Central America --1.5M TPY1.5M TPY India India
+2.5M TPY+2.5M TPY
China China +9.8M TPY+9.8M TPY
Oceania Oceania +0.3M TPY+0.3M TPY
Other Africa Other Africa +0.3M TPY+0.3M TPYSouth America South America
--0.1M TPY0.1M TPY
Europe Europe --0.1M TPY0.1M TPY
Global Net Change in DAP/MAP Capacity Global Net Change in DAP/MAP Capacity +9.0M TPY+9.0M TPY
Global Net Change in DAP/MAP Consumption Global Net Change in DAP/MAP Consumption +7.4M TPY+7.4M TPY
Middle East Middle East --0.1M TPY0.1M TPY

Source: British Sulphur, PotashCorpSource: British Sulphur, PotashCorp
2
4
6
8
10
12
14
16
18
20
22
2005 2006E
Million Tonnes Product
US Phosphate Fertilizer CapacityUS Phosphate Fertilizer Capacity
-16%
EstimatedEstimated

Source: TFISource: TFI
US ProducersUS Producers’’ DAP/MAP Ending InventoryDAP/MAP Ending Inventory
0.8
1.0
1.2
1.4
1.6
1.8
Jan Feb Mar Apr May Jun Jul Aug Sep Oct Nov Dec
2005 2006 3-Year Average
Million Tons ProductMillion Tons Product
SeptSept--06 DAP/MAP ending inventory 06 DAP/MAP ending inventory was 1% above the 3was 1% above the 3--yr yr AvgAvg
Source: TFISource: TFI
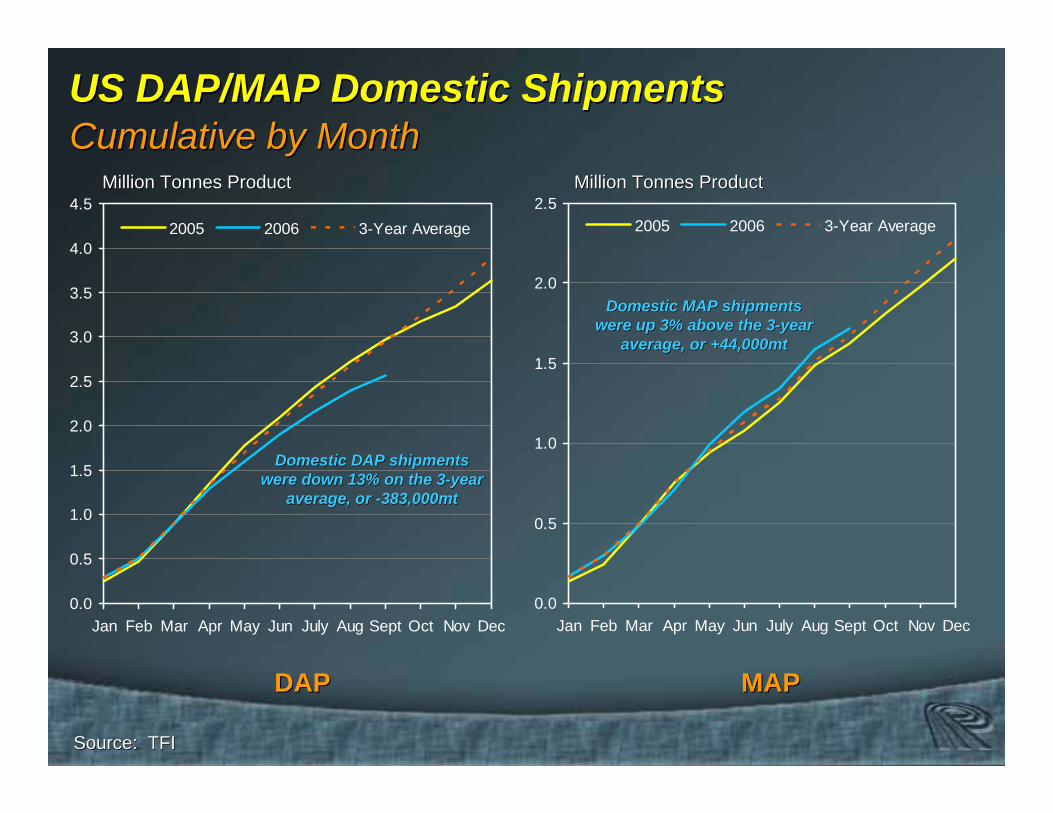
US DAP/MAP Domestic ShipmentsUS DAP/MAP Domestic Shipments
0.0
0.5
1.0
1.5
2.0
2.5
3.0
3.5
4.0
4.5
Jan Feb Mar Apr May Jun July Aug Sept Oct Nov Dec
2005 2006 3-Year Average
Million Tonnes ProductMillion Tonnes Product
Cumulative by MonthCumulative by Month
0.0
0.5
1.0
1.5
2.0
2.5
Jan Feb Mar Apr May Jun July Aug Sept Oct Nov Dec
2005 2006 3-Year Average
Million Tonnes ProductMillion Tonnes Product
DAPDAP MAPMAP
Domestic DAP shipments Domestic DAP shipments were down 13% on the 3were down 13% on the 3--year year
average, or average, or --383,000mt383,000mt
Domestic MAP shipments Domestic MAP shipments were up 3% above the 3were up 3% above the 3--year year
average, or +44,000mtaverage, or +44,000mt
Source: TFISource: TFI
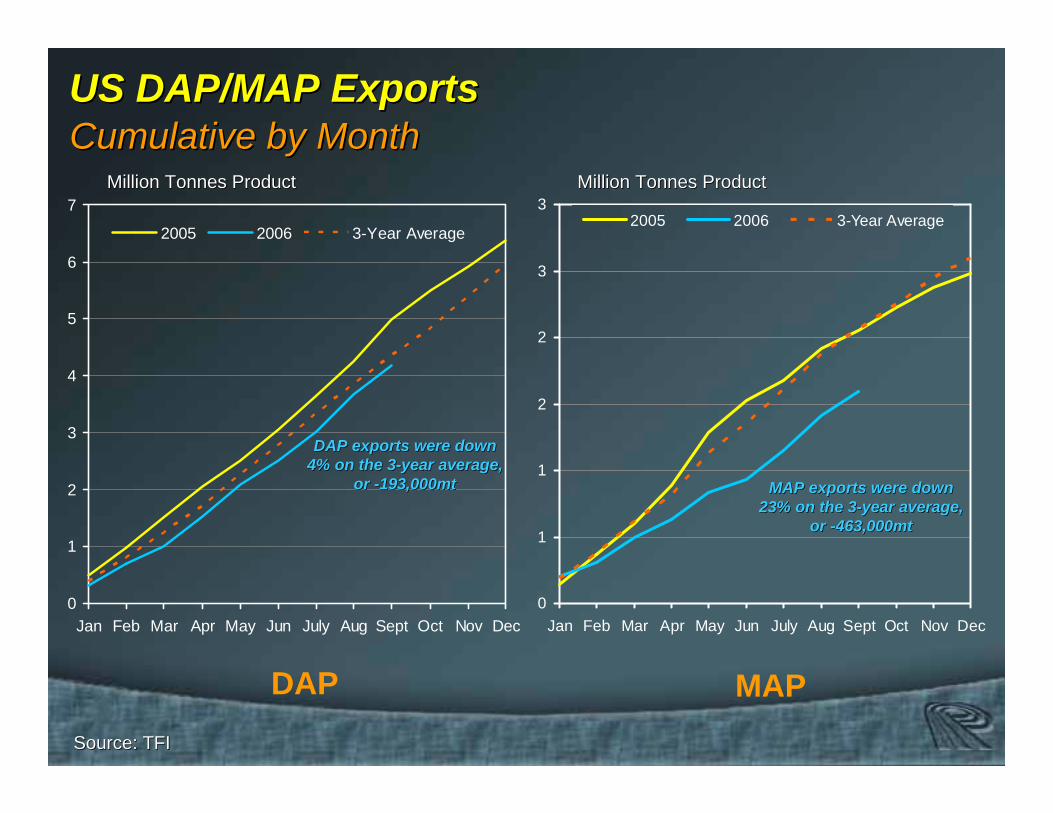
US DAP/MAP ExportsUS DAP/MAP Exports
0
1
2
3
4
5
6
7
Jan Feb Mar Apr May Jun July Aug Sept Oct Nov Dec
2005 2006 3-Year Average
0
1
1
2
2
3
3
Jan Feb Mar Apr May Jun July Aug Sept Oct Nov Dec
2005 2006 3-Year Average
Million Tonnes ProductMillion Tonnes Product Million Tonnes ProductMillion Tonnes Product
DAP MAP
DAP exports were down DAP exports were down 4% on the 34% on the 3--year average, year average,
or or --193,000mt193,000mt MAP exports were down MAP exports were down 23% on the 323% on the 3--year average, year average,
or or --463,000mt463,000mt
Cumulative by MonthCumulative by Month

The Phosphate Outlook The Phosphate Outlook
Summary of Previous YearSummary of Previous YearOffshore DemandOffshore DemandDomestic ConsumptionDomestic ConsumptionSupplySupplyConclusionConclusion
AgendaAgenda
Source: FerteconSource: Fertecon
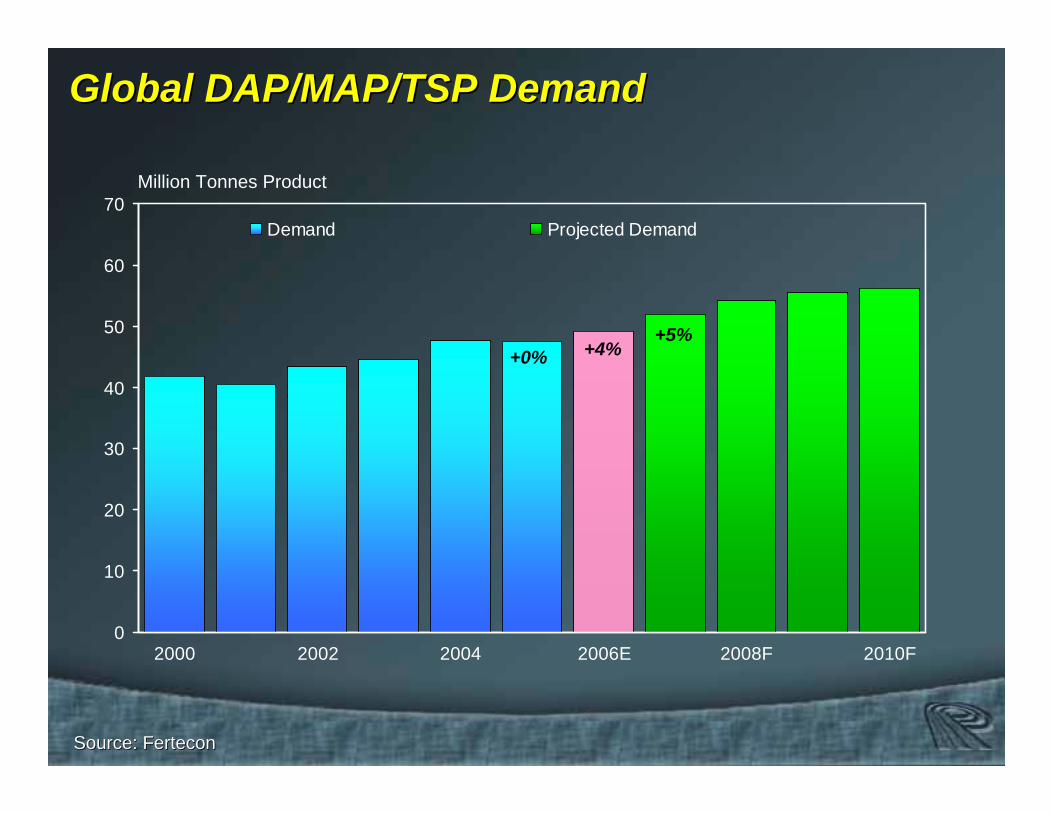
Global DAP/MAP/TSP DemandGlobal DAP/MAP/TSP Demand
0
10
20
30
40
50
60
70
2000 2002 2004 2006E 2008F 2010F
Demand Projected Demand
Million Tonnes Product
+4%+5%
+0%

Source: FerteconSource: Fertecon
Global DAP/MAP/TSP Demand and TradeGlobal DAP/MAP/TSP Demand and Trade
0
10
20
30
40
50
60
70
2000 2001 2002 2003 2004 2005 2006E 2007F 2008F 2009F 2010F0
10
20
30
40
50
60
70
80
90
100Demand Projected Demand Imports Imports as a % of Demand
Million Tonnes Product
--1%1% +3%+3%--2%2%
+4%+5%
+0%
-5% -1%-2%
Percent

Source: FerteconSource: Fertecon
China DAP/MAP/TSP DemandChina DAP/MAP/TSP Demand
0
2
4
6
8
10
12
14
16
2000 2001 2002 2003 2004 2005 2006E 2007F 2008F 2009F 2010F
Demand Projected Demand Imports Net Exports
Million Tonnes Product
--21%21% +6%+6%--23%23%
+4% +4%+14%

Source: British Suolphur, FerteconSource: British Suolphur, Fertecon
5+ Million Tonnes
1-5 Million Tonnes< 1 Million TonnesNo Phosphate Reserves
ChinaChina’’s Phosphate Rock Productions Phosphate Rock ProductionBy Province in Million TonnesBy Province in Million Tonnes

Source: Fertecon, PotashCorpSource: Fertecon, PotashCorp
India DAP/MAP DemandIndia DAP/MAP Demand
0
2
4
6
8
10
2000 2001 2002 2003 2004 2005 2006E 2007F 2008F 2009F 2010F
Demand Projected Demand Imports
Million Tonnes Product
0%0% --2%2%+313%+313%
+8%+7%
+19%
Source: FerteconSource: Fertecon
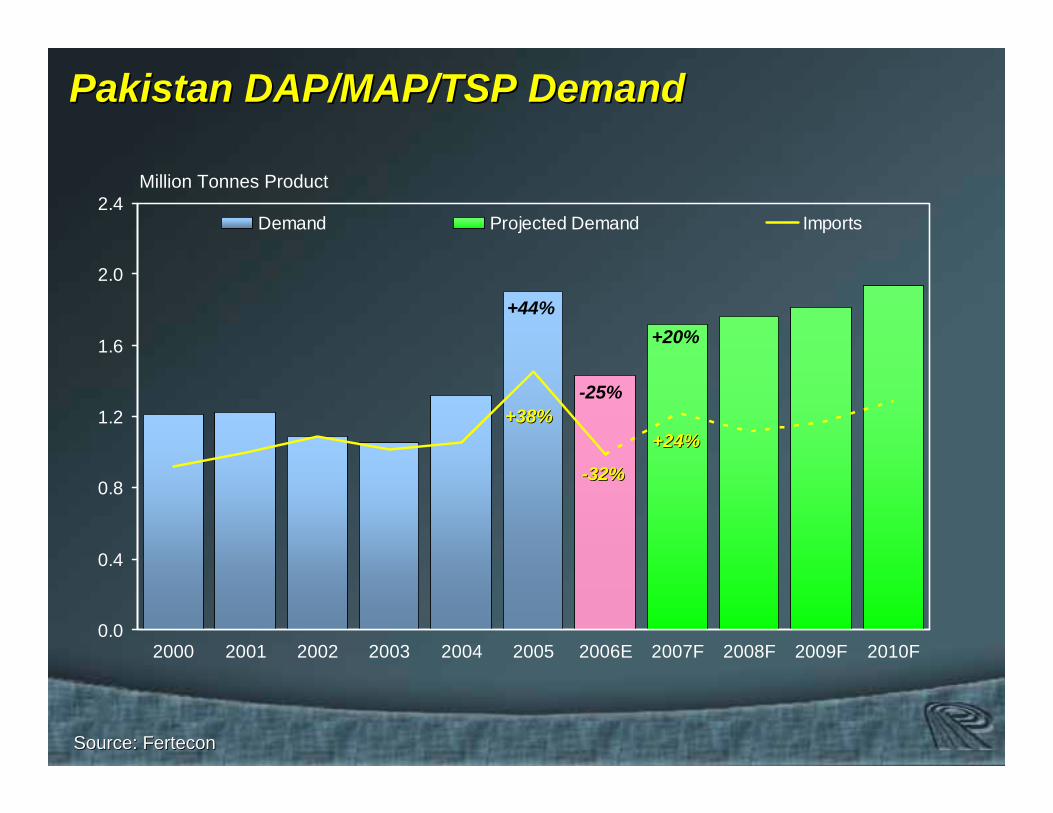
Pakistan DAP/MAP/TSP DemandPakistan DAP/MAP/TSP Demand
0.0
0.4
0.8
1.2
1.6
2.0
2.4
2000 2001 2002 2003 2004 2005 2006E 2007F 2008F 2009F 2010F
Demand Projected Demand Imports
Million Tonnes Product
--32%32%
+24%+24%+38%+38%
-25%
+20%+44%

Source: FerteconSource: Fertecon
Brazil DAP/MAP/TSP DemandBrazil DAP/MAP/TSP Demand
0.0
0.5
1.0
1.5
2.0
2.5
3.0
3.5
4.0
4.5
5.0
5.5
2000 2001 2002 2003 2004 2005 2006E 2007F 2008F 2009F 2010F
Demand Projected Demand Imports
Million Tonnes Product
--9%9% +6%+6%--28%28%
-3%
+12%-20%

Source: FerteconSource: Fertecon
Australia DAP/MAP/TSP Demand Australia DAP/MAP/TSP Demand
0.0
0.5
1.0
1.5
2.0
2000 2001 2002 2003 2004 2005 2006E 2007F 2008F 2009F 2010F
Demand Projected Demand Imports
Million Tonnes Product
--16%16%+20%+20%--18%18%
-10%
+12%-13%

The Phosphate Outlook The Phosphate Outlook
Summary of Previous YearSummary of Previous YearOffshore DemandOffshore DemandDomestic ConsumptionDomestic ConsumptionSupplySupplyConclusionConclusion
AgendaAgenda
Source: TFI/AAPFCO, PotashCorpSource: TFI/AAPFCO, PotashCorp
0
1
2
3
4
5
6
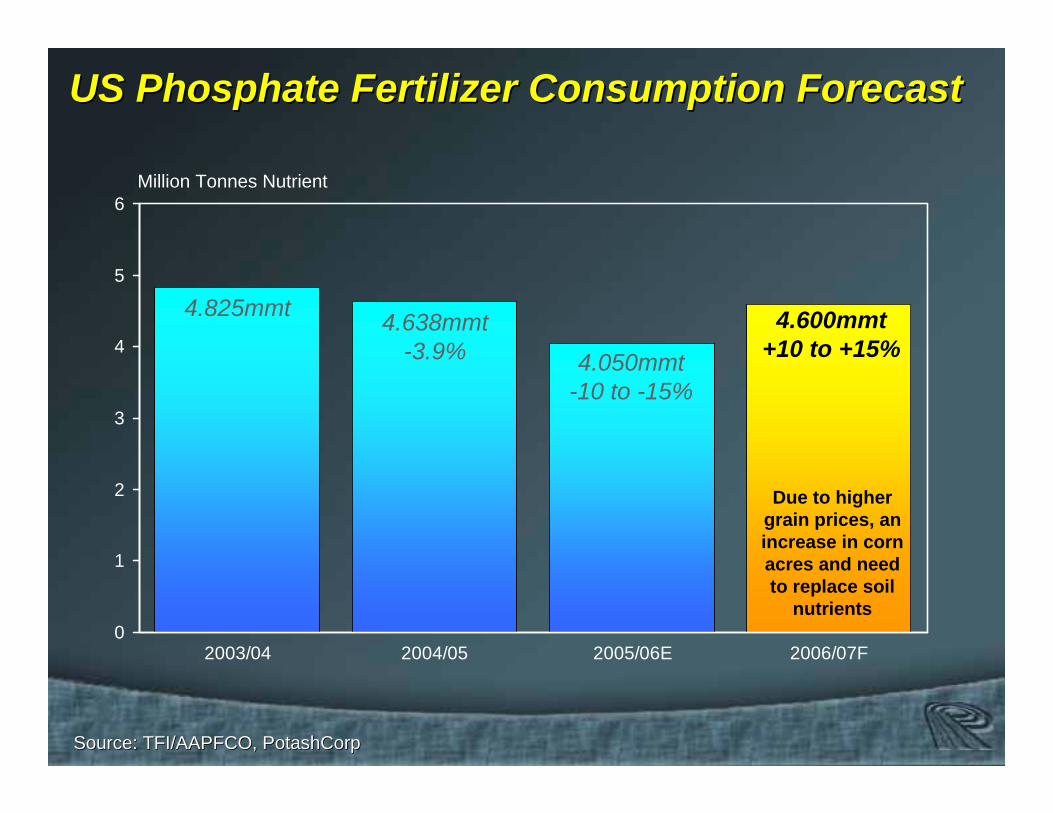
2003/04 2004/05 2005/06E 2006/07F
Million Tonnes Nutrient
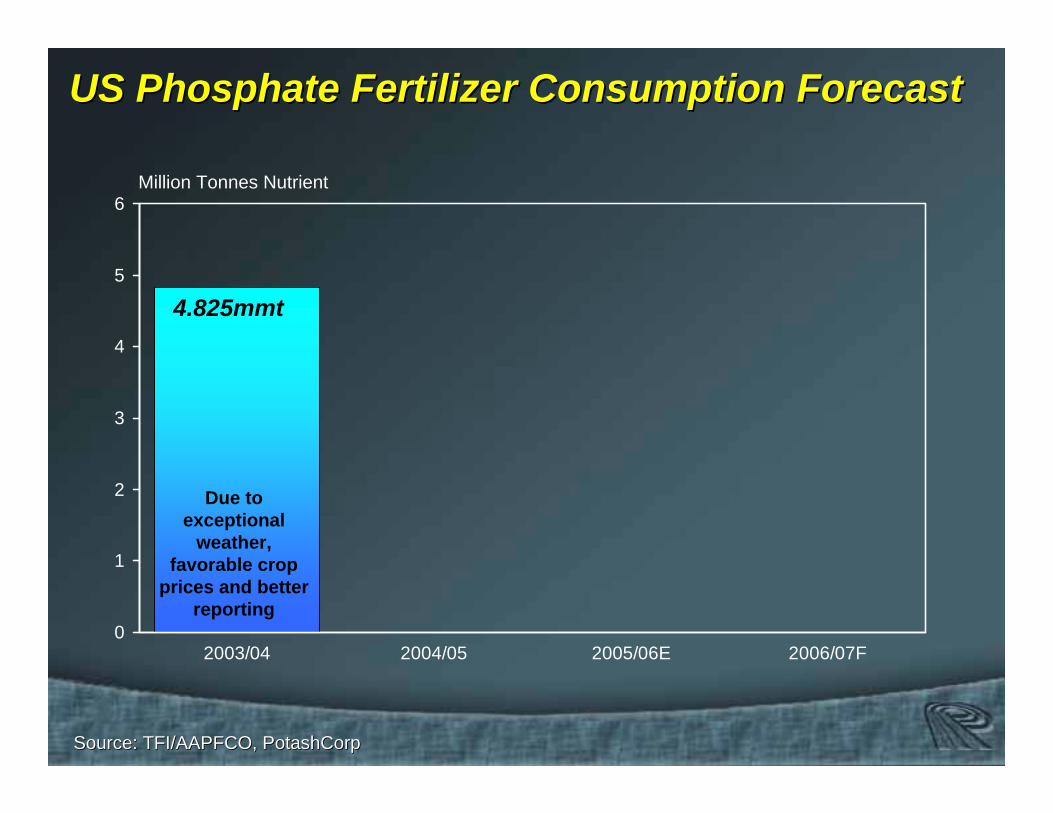
US Phosphate Fertilizer Consumption ForecastUS Phosphate Fertilizer Consumption Forecast
4.825mmt
Due to exceptional
weather, favorable crop
prices and better reporting

Source: TFI/AAPFCO, PotashCorpSource: TFI/AAPFCO, PotashCorp
0
1
2
3
4
5
6
2003/04 2004/05 2005/06E 2006/07F
4.638mmt-3.9%
4.825mmt
Million Tonnes Nutrient
US Phosphate Fertilizer Consumption ForecastUS Phosphate Fertilizer Consumption Forecast
Due to more normal weather and a decline in
commodity prices

Source: TFI/AAPFCO, PotashCorpSource: TFI/AAPFCO, PotashCorp
0
1
2
3
4
5
6
2003/04 2004/05 2005/06E 2006/07F
Million Tonnes Nutrient
US Phosphate Fertilizer Consumption ForecastUS Phosphate Fertilizer Consumption Forecast
Due to continued weakness in commodity
prices, higher energy input
costs and uncertainty about
planting decisions
4.050mmt-10 to -15%
4.638mmt-3.9%
4.825mmt
Source: TFI/AAPFCO, PotashCorpSource: TFI/AAPFCO, PotashCorp
0
1
2
3
4
5
6
2003/04 2004/05 2005/06E 2006/07F
Million Tonnes Nutrient
4.600mmt+10 to +15%4.050mmt
-10 to -15%
US Phosphate Fertilizer Consumption ForecastUS Phosphate Fertilizer Consumption Forecast
4.638mmt-3.9%
4.825mmt
Due to higher grain prices, an increase in corn acres and need to replace soil
nutrients

The Phosphate Outlook The Phosphate Outlook
Summary of Previous YearSummary of Previous YearOffshore DemandOffshore DemandDomestic ConsumptionDomestic ConsumptionSupplySupplySummarySummary
AgendaAgenda

Source: FerteconSource: Fertecon
Global DAP/MAP/TSP Production GrowthGlobal DAP/MAP/TSP Production Growth
Africa / Middle East Africa / Middle East +9% to 8.0mmt+9% to 8.0mmt
Asia Asia +11% to 19.8mmt+11% to 19.8mmt
2007E (Million Tonnes)2007E (Million Tonnes)
Europe Europe +8% to 1.9mmt+8% to 1.9mmtNorth America North America
+1% to 14.5mmt +1% to 14.5mmt
FSU FSU +4% to 5.2mmt+4% to 5.2mmt
South America South America +16% to 2.2mmt+16% to 2.2mmt Oceania Oceania
0% to 0.9mmt0% to 0.9mmt
Global Production GrowthGlobal Production Growth+5% to 51.9 Million Tonnes+5% to 51.9 Million Tonnes
Source: Fertecon, PotashCorpSource: Fertecon, PotashCorp
0
5
10
15
20
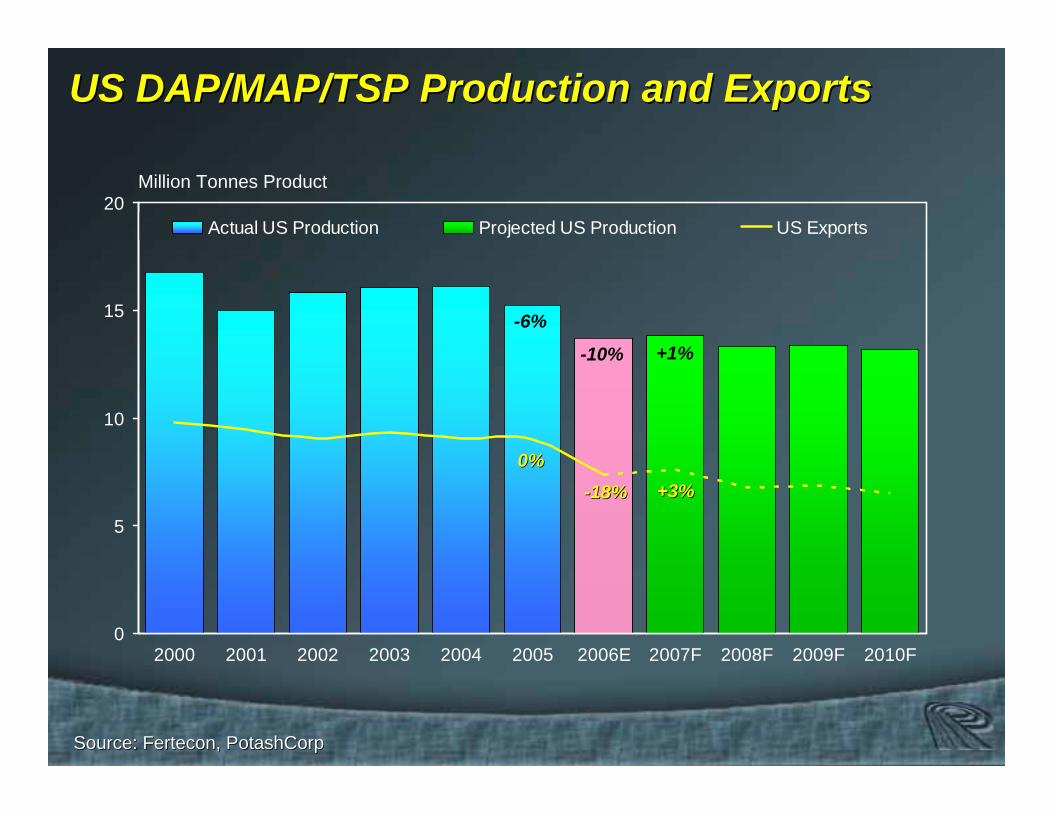
2000 2001 2002 2003 2004 2005 2006E 2007F 2008F 2009F 2010F
Actual US Production Projected US Production US Exports
Million Tonnes Product
US DAP/MAP/TSP Production and ExportsUS DAP/MAP/TSP Production and Exports
--18%18% +3%+3%0%0%
-10% +1%-6%

Source: FerteconSource: Fertecon
India DAP ProductionIndia DAP Production
0
1
2
3
4
5
6
7
2000 2001 2002 2003 2004 2005 2006E 2007F 2008F 2009F 2010F
Production Projected Production
Million Tonnes Product
+13%
+14%
-16%

Source: FerteconSource: Fertecon
Morocco DAP/MAP/TSP ProductionMorocco DAP/MAP/TSP Production
0.0
0.5
1.0
1.5
2.0
2.5
3.0
3.5
4.0
4.5
2000 2001 2002 2003 2004 2005 2006E 2007F 2008F 2009F 2010F0
10
20
30
40
50
60
70
80
90
100Production Projected Production Share of World Trade
Million Tonnes Product
+31%+31% +16%+16%--5%5%
+26%
+16%
0%
PercentPercent

Source: FerteconSource: Fertecon
China DAP/MAP/TSP ProductionChina DAP/MAP/TSP Production
0
2
4
6
8
10
12
14
16
2000 2001 2002 2003 2004 2005 2006E 2007F 2008F 2009F 2010F
Production Projected Production
Million Tonnes Product
+10%+6%
+19%

Source: British Sulphur, PotashCorpSource: British Sulphur, PotashCorp
Projected DAP/MAP/TSP Capacity ChangesProjected DAP/MAP/TSP Capacity Changes
Africa Africa 1.21.2
East Asia East Asia 6.06.0
Estimated 2006Estimated 2006--2010 (Million Tonnes Product)2010 (Million Tonnes Product)
Middle East Middle East 3.03.0
Net Capacity Additions = 10.9 Million TonnesNet Capacity Additions = 10.9 Million Tonnes
North America North America --3.23.2
South Asia South Asia 1.21.2
South East Asia South East Asia 0.20.2
South America South America 1.91.9
Oceania Oceania 0.00.0
Europe Europe 0.00.0
FSU FSU 0.10.1

Source: British Sulphur, PotashCorpSource: British Sulphur, PotashCorp
China DAP/MAP ProjectsChina DAP/MAP Projects
6.0 MillionTotal
2007-2010DAP/MAP3.5 MillionMiscellaneous
2006DAP0.9 MillionHubei - Yangfeng & Dayukouu
2008DAP/MAP0.8 MillionYunnan - NG Chemical Comples
2007MAP0.5 MillionGuizhou - Kaiyang
2008DAP0.3 Million Hubei - Yihua Group Corp
OperationalProductProductionLocation
Estimated 2006Estimated 2006--2010 (Million Tonnes Product)2010 (Million Tonnes Product)

Source: FerteconSource: Fertecon
ChinaChina’’s Low Analysis Phosphate Productions Low Analysis Phosphate Production
0
1
2
3
4
5
1980 1985 1990 1995 2000 2005 2010
SSP FMP
Million Tonnes PMillion Tonnes P22OO55
SSP & Fused Magnesium PhosphateSSP & Fused Magnesium Phosphate
Total reduction 2005Total reduction 2005--2010 = .5 million tonnes P2010 = .5 million tonnes P22OO55

Source: Ma'adenSource: Ma'aden
MaMa’’adenaden Phosphate ProjectPhosphate Project
JeddahJeddah
JawfJawf
HailHail
EshidiyaEshidiya
RiyadhRiyadh
DammanDammanRasRas AzAz ZawrZawr
AzAz ZabirahZabirah3.5 Mt/y3.5 Mt/y
Al Al JalamidJalamid4.5 Mt/y4.5 Mt/y
QurayyatQurayyat
BuraydaBurayda
CurrentCurrent
FutureFuture
Saudi ArabiaSaudi Arabia

Source: Ma'adenSource: Ma'aden
MaMa’’adenaden Phosphate Project Proposed MarketPhosphate Project Proposed Market
IranIran
IndiaIndia
PakistanPakistanChinaChina JapanJapan
Saudi ArabiaSaudi Arabia
IndonesiaIndonesia
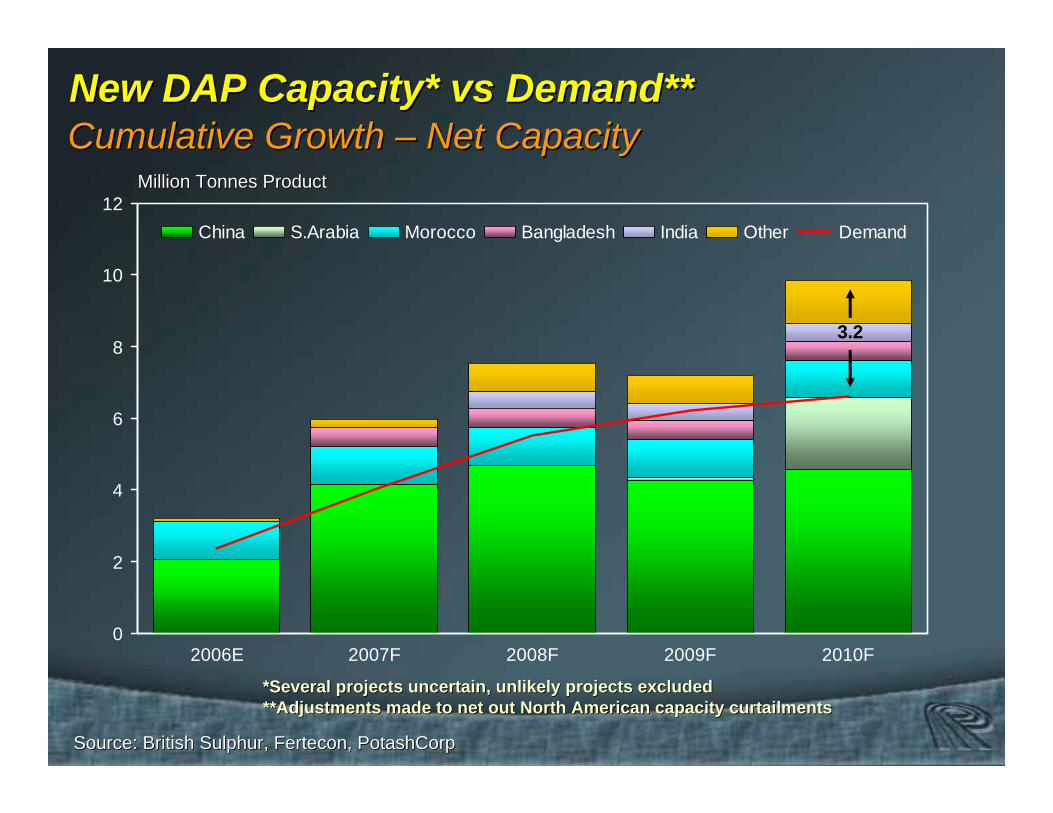
Source: British Sulphur, Fertecon, PotashCorpSource: British Sulphur, Fertecon, PotashCorp
0
2
4
6
8
10
12
2006E 2007F 2008F 2009F 2010F
China S.Arabia Morocco Bangladesh India Other Demand
Million Tonnes ProductMillion Tonnes Product
New DAP Capacity* vs Demand**New DAP Capacity* vs Demand**
*Several projects uncertain, unlikely projects excluded*Several projects uncertain, unlikely projects excluded**Adjustments made to net out North American capacity curtailmen**Adjustments made to net out North American capacity curtailmentsts
Cumulative Growth Cumulative Growth –– Net CapacityNet Capacity
3.2

The Phosphate Outlook The Phosphate Outlook
Summary of Previous YearSummary of Previous YearOffshore DemandOffshore DemandDomestic ConsumptionDomestic ConsumptionSupplySupplyConclusionConclusion
AgendaAgenda

Source: FerteconSource: Fertecon
Global DAP/MAP/TSP Demand and TradeGlobal DAP/MAP/TSP Demand and Trade
0
10
20
30
40
50
60
70
2000 2001 2002 2003 2004 2005 2006E 2007F 2008F 2009F 2010F0
10
20
30
40
50
60
70
80
90
100
Demand Projected Demand Imports Imports as a % of Demand
Million Tonnes ProductMillion Tonnes Product
--1%1% +3%+3%--2%2%
+4%+5%
+0%
-5% -1%-2%
PercentPercent

Source: TFI/AAPFCO, PotashCorpSource: TFI/AAPFCO, PotashCorp
0
1
2
3
4
5
6
2003/04 2004/05 2005/06E 2006/07F
Million Tonnes NutrientMillion Tonnes Nutrient
4.600mmt+10 to +15%4.050mmt
-10 to -15%
US Phosphate Fertilizer Consumption ForecastUS Phosphate Fertilizer Consumption Forecast
4.638mmt-3.9%
4.825mmt
Due to higher grain prices, an increase in corn acres and need to replace soil
nutrients

Source: British Sulphur, Fertecon, PotashCorpSource: British Sulphur, Fertecon, PotashCorp
0
2
4
6
8
10
12
2006E 2007F 2008F 2009F 2010F
China S.Arabia Morocco Bangladesh India Other Demand
Million Tonnes ProductMillion Tonnes Product
New DAP Capacity* vs Demand**New DAP Capacity* vs Demand**
*Several projects uncertain, unlikely projects excluded*Several projects uncertain, unlikely projects excluded**Adjustments made to net out North American capacity curtailmen**Adjustments made to net out North American capacity curtailmentsts
Cumulative Growth Cumulative Growth –– Net CapacityNet Capacity
3.2

ThankThank--YouYou