THE PHOENIX FIRE DEPARTMENTcsaexams.com/testinfo/V=IR report.pdf · THE PHOENIX FIRE DEPARTMENT ......
65
THE PHOENIX FIRE DEPARTMENT AND THE ARIZONA AUTOMATIC FIRE ALARM ASSOCIATION PRESENTS V=IR THE ACCURACY OF POINT-TO-POINT VOLTAGE DROP ON FIRE ALARM SYSTEMS Prepared By: Scott Lacey, CSP, EIT Fire Protection Engineer Phoenix Fire Department May 1, 2001 Second Draft (partial)
Transcript of THE PHOENIX FIRE DEPARTMENTcsaexams.com/testinfo/V=IR report.pdf · THE PHOENIX FIRE DEPARTMENT ......

THE
PHOENIX FIRE DEPARTMENT AND THE
ARIZONA AUTOMATIC FIRE ALARM ASSOCIATION
PRESENTS
V=IR THE ACCURACY OF POINT-TO-POINT
VOLTAGE DROP ON FIRE ALARM SYSTEMS
Prepared By: Scott Lacey, CSP, EIT
Fire Protection Engineer Phoenix Fire Department
May 1, 2001 Second Draft (partial)

2
Second Draft (Partial) May 1, 2001 Copies will be available from: Arizona Automatic Fire Alarm Association www.azafaa.org Phoenix Fire Department Oklahoma State University Fire Protection and Safety Alumni www.osufiret.com Email comments to [email protected] © 2001 Scott Lacey and The Phoenix Fire Department Duplication of this report is permitted without prior approval provided credit is given to the author and sponsoring organizations: Scott Lacey, CSP, EIT Phoenix Fire Department, and Arizona Automatic Fire Alarm Association Special thanks goes out to the following individuals and their companies who helped make this study possible: Barbara Koffron - Phoenix Fire Department Pat Bielecki - Phoenix Fire Department Dan Volcko - Phoenix Fire Department Cliff Ehlers - Norstan Communications Rocky LeBlanc – Norstan Communications Jim Scronic - Simplex Tom Nejman - Protection Systems Michael Harrington - Wheelock AZAFAA Jim Hook - DPR Construction Doug Newcomd - Sterling Randy Snow – Progressive Edge Earnie Bonham - Kearney Electric Dwight Havens - Phoenix Fire Department
Jim Rogers – Tri-Ed Dean Walker – Caesar Chavez High School Krista Cambern - Phoenix Fire Department Franky Pantoja- Phoenix Fire Department Pat Carns - Phoenix Fire Department Liz DeLaCruz - Phoenix Fire Department Don Cole – Sierra Fire & Communications Brian Hulbert – Sierra Fire & Communications Richard Bednarski - Phoenix Fire Department

3
Table of Contents
WHY ARE FIRE ALARMS INSTALLED? ..................................................................................................................... 4
WHAT GOES WRONG:........................................................................................................................................................ 4 Scenario 1: ................................................................................................................................................................... 4 Scenario 2: ................................................................................................................................................................... 5
BACKGROUND:................................................................................................................................................................. 5 Figure 1 - Class B Circuit ...........................................................................................................................................................7 Figure 2 - Class A Circuit ...........................................................................................................................................................7
SCOPE OF PROJECT: ...................................................................................................................................................... 8
HOW TO INTERPRET THE RESULTS: ........................................................................................................................ 8 Figure 3 - Volt Drop Calculation Sheet.......................................................................................................................................8 Figure 4 - Voltage Drop, Charted Result of One Test...............................................................................................................10
VALIDATION OF WIRE RESISTANCE ...................................................................................................................... 11 18 AWG FPL, solid, copper ...........................................................................................................................................11 14 AWG FPL, solid, copper ...........................................................................................................................................11 12 AWG, THHN, 19 strand............................................................................................................................................11
Figure 5 - Wire Resistance Values By Source (Ohm's).............................................................................................................11
PRELIMINARY INTERPRETATION OF TEST RESULTS:..................................................................................... 11
HOW TO USE THE INFORMATION: .......................................................................................................................... 12
A FEW RESULTS:............................................................................................................................................................ 13
EXCEL SHEETS AND CHARTS.................................................................................................................................... 13
TEST PROCEDURES: ..................................................................................................................................................... 65

4
Why are Fire Alarms Installed?
Millions of dollars are spent each year installing fire alarm systems. From the houses we live in, to the office buildings we work in. From the malls we shop in, to the stadiums we are entertained in. Fire alarm systems are all around us. As technology evolves, so does the complexity. Questions we have to ask include will they work? Will they protect our property? Will they alert us of an emergency with enough time to escape a burning building unharmed? Fire alarm
systems are specified with these objectives in mind. So what can go wrong? Fire alarm systems are included into building specifications for a number of reasons. Some of which include: • Building and Fire Code requirements. • Licensing agency requirements such as day care and health care. • Insurance discounts, or insurance requirements. • To satisfy Occupational Safety and Health Administration (OSHA) requirements for notification
of employees. • American with Disabilities Act (ADA) guidelines of notifying those who may not possess the
same sensory detection as others. • High-risk materials or processes. • An employer's vested interest in extra protection for its employees and property.
For whatever reasons a system is specified, it must be able to perform. The laws of conservation provide that whatever goes in, must come out. However, if a system is not designed or installed appropriately, what comes out may not equal the expectations that went in. Experience has also shown that if the system is not thoroughly and regularly tested, usually by a third party such as an Authority Having Jurisdiction (AHJ) or an insurance evaluator, the owner might as well have invested their money into string and cans.
What Goes Wrong:
Although many systems are well designed in the beginning, any expansion or changes to the system can lead to failure. In order to gain a better appreciation of how simple changes can lead to disaster, lets look at two scenarios.
Scenario 1:
A new shell three story and non-sprinklered office building is being built which is equipped with a state of the art fire alarm system and notification devices. Because it is new, the tenant spaces have not been designed into the system. Soon, small tenants began to lease and build out their spaces. This particular AHJ does not require design documents (including voltage calculations) for small additions to the fire alarm system. As a result the contractor/designer fails to invest the extra effort to evaluate the existing system or impact of the new project. Purchase orders are issued and the contractor installs the

5
systems. When done, the installers initiate the circuit for a short time. There is sound, and the strobes flash. It looks good, so the installers go home.
The next tenant (located on the third floor) needs two devices installed. Because this is such a quick project, the contractor does not want to install and test the devices after hours or obtain an installation permit. Thus, they avoid creating a nuisance for the existing tenants by not setting off the alarms. So the devices are installed and the respective tenant moves in.
One month later, a fire starts in a first floor office space. A first floor tenant activates a fire alarm initiating device (pull station). However, only the notification appliances in a small section of the second floor operate. Many of the remaining occupants are not aware of the fire until the fire department shows up. By this time there is heavy smoke in the atrium style lobby and light smoke in the corridors of the building. Several occupants are overcome by smoke and require medical treatment. Taking the extra time to check the circuit voltage, evaluate the existing circuit loads, or calculating the new loads all could have avoided occupant injury and possibly reduced property loss.
Scenario 2:
A fire alarm system is designed using point-to-point calculations (Note; with this design, it is very important the wiring and circuit path be installed in accordance with the approved plans). The contractor pulling the cable is used to running 110-volt AC circuits where wire route is generally not considered critical. Therefore, the cable is pulled to notification devices in no particular sequence, and not even to the devices calculated to be on the same circuit. Once all the devices are installed (usually the day before the tenant wants to occupy the space) an inspection is called for. Because of delays in getting the contracts signed and plans submitted, there has not been enough time to pre-test the system. The tenant is ready to move in, the inspector arrives, the system is activated, and the strobes flash. Once! Yes, the horns sound, but the strobes only flashed one time. What could be wrong?
Background:
Voltage drop is becoming a well-known problem in low-voltage, higher current circuits. For our purposes, higher current means in the range of amps as opposed to micro or milli amps. For the purpose of fire alarm design, this condition is especially critical on notification circuits. Such appliances include the more common horn/strobe devices as well as voice/speaker circuits. One reason for the elevated awareness of this issue results from the increased current-draw from brighter visual notification devices.
It is not the scope of this report to teach voltage drop calculation. Our scope is to evaluate test results of the different methods used in calculating the drop. However, if you do not have a basic understanding of how to calculate for voltage drop and the different methods available, then you will not understand how to apply the results of this project. As a result, we will try to explain it in the simplest form. Additional information on calculating voltage drop along with tips and tricks will be provided at the end of this report.

6
1 To guide designers and installers of fire alarm systems so that the system will deliver audible and visible information with appropriate intensity, the nameplate must state the capabilities of the appliance, as determined through tests conducted by the listing organization. The nameplate information also assists inspectors in verifying compliance with approved documents.
Notification appliance circuits require special treatment to ensure that all the connected appliances will operate under adverse (low) voltage conditions. Low voltage, which is outside the operating range of the appliance, can cause the appliances to produce lower visible signal intensities or sound pressure levels (SPLs) {in many cases the strobes will fail all together}. Voltage at any appliance on the Notification Appliance Circuit (NAC) should not drop below the limits of the appliance design to ensure correct intensity and audibility. The designer of the notification appliance circuit should consider these interrelated questions: How
many appliances can be connected to the NAC? What is the size of the field-wiring conductors? What is the total length of the NAC? It is therefore apparent that voltage drop calculations must be made.
2 There are several methods to calculate voltage drop for a circuit.
The simplest is to calculate the entire load at the end of a class “B” circuit (lump sum) (See Figure 1). This approach should guarantee the system will work but will result in additional circuits and increased cost (very conservative). The most accurate method would be to calculate the actual losses between each device based on actual wire routing (point-to-point). This would make the most cost-effective use of the circuits and wire but has been considered time consuming and the wire is rarely run exactly as it was drawn on the plans. A third option is load centering where the entire load is calculated to be in the center of the circuit. This provides a rough average and works most of the time. A forth, but less common approach is to use current and distance averaging. Since the current difference between strobe only and horn/strobe is small (the strobes are the current hogs) this method distributes the load and any differences are 2-3 decimal places out.
As with any calculation they must be used correctly to provide the accurate results. Load centering and load averaging work well unless the NAC is extremely long and/or the devices are not somewhat evenly placed. If the actual start of device placement is some distance from the power source (I.E., 300-ft underground run to another building) this will impact the calculation unless taken into account.
1 Copied from the 1999 NFPA 72 (National Fire Alarm Code) Handbook p.p. 168. 2 Extracted from "Indicating Device Appliance Circuits, Voltage Drop Facts & Fiction" by Arizona Automatic Fire Alarm Association August 12, 1998 Authored by Cliff Ehlers C.E.T

7
NEMA Training Manual on Fire Alarm Systems, 1997
Figure 1 - Class B Circuit
2There are two ways to evaluate a class “A” circuit. Essentially you calculate it the same as
a class “B” circuit. The only difference is establishing where to start. The correct method depends on how the wire is to be run for the circuit. First, is if the circuit starts at the source and goes through all the devices on the circuit. The circuit is then returned back to the source from the
furthest end of the circuit. This would provide an extreme voltage drop concern if the break were at or close to terminals 1 or 2 (See Figure 2). {In Figure 2, assuming a break between terminal 1 and device 1, start your measurement from terminal 3 and go through device 1 and back to terminal 4.} All the circuit current would have to travel to the far end of the circuit then start powering devices on the return to the source. Thus, point-to-point calculations would have to start at points 3 & 4.
A second way to run the circuit would be to make a loop with the devices connected as to distribute the load and create a circuit that is approximately equal in length and load from either end. In this case the voltage drop should be calculated from the end with the devices farthest from the source. {Similar to
Figure 2, except that the load would be almost evenly distributed and you would calculate the longest length of the two.} It may be necessary to calculate both directions. This would be especially critical if using point-to-point calculations.
NEMA Training Manual on Fire Alarm Systems, 1997
/
Calculate longest wire lengthSource
Potential Break
#1
Figure 2 - Class A Circuit
2 Extracted from "Indicating Device Appliance Circuits, Voltage Drop Facts & Fiction" by Arizona Automatic Fire Alarm Association August 12, 1998 Authored by Cliff Ehlers C.E.T

8
Scope of Project:
This report summarizes the results of a voltage drop study that was conducted by the Phoenix Fire Department and the Arizona Automatic Fire Alarm Association during the summer of 2000. This stage of our study was limited to identifying the limits and accuracy of using point-to-point calculations for fire alarm horn/strobe notification circuits. In evaluating the accuracy of point-to-point calculations, comparisons are made to two other calculation methods (lump sum and center load).
How to Interpret the Results:
In order to document and evaluate the test results, a previously developed AZAFAA Microsoft
Excel voltage drop calculator was modified (Figure 3). This spreadsheet allows for direct point-to-point entry of a notification circuit. In addition to providing point-to-point results, it provides lump sum and load-centering results. Thus, by entering the circuit once, we were able to obtain all three calculated results.
Project Name Gentex (AFP-200 w/CBC - PL) Calculation method FAILEDDateCircuit Number 14-2 Using actual voltageNotes Battery power with no standby time 18=7.77 16=4.89 14=3.07 12=1.98 10=1.24Actual System Voltage 24.63 Actual = see notes When entering your measured value. Use the resistance measured for Minimum Device Voltage 21 one way on the circuit or 1/2 the total resistance out and backTotal Circuit Current 1.437 Wire Ohm's
Gauge Per 1000Distance from source to 1st device 100 14 3.07 Voltage VoltageWire Gauge for balance of circuit 14 3.07 Current Distance Drop Current Distance Drop
Distance Calculated 1.437 435 3.838 1.437 435 1.919Listed from Actual 1.575 435 4.207 1.575 435 2.103
Device Device previous At Drop from Percent Device Manufacture: GentexNumber Current device Device source Drop Current Distance Voltage Model Numbers:
Device 1 0.093 100 23.75 0.88 3.58% 0.105 100 23.52 GXSDevice 2 0.108 45 23.38 1.25 5.09% 0.110 45 23.37 GX-90SDevice 3 0.093 10 23.30 1.33 5.40% 0.107 10 23.16 GXSDevice 4 0.108 15 23.20 1.43 5.83% 0.113 15 23.06 GX-90SDevice 5 0.093 30 23.00 1.63 6.60% 0.104 30 22.88 GXSDevice 6 0.108 25 22.86 1.77 7.19% 0.123 25 22.73 GX-90SDevice 7 0.093 50 22.60 2.03 8.23% 0.106 50 22.47 GXSDevice 8 0.108 20 22.51 2.12 8.60% 0.114 20 22.37 GX-90SDevice 9 0.108 35 22.38 2.25 9.15% 0.115 35 22.23 GX-90SDevice 10 0.108 10 22.34 2.29 9.28% 0.113 10 22.20 GX-90SDevice 11 0.093 40 22.24 2.39 9.69% 0.111 40 22.09 GXSDevice 12 0.108 30 22.18 2.45 9.94% 0.121 30 22.01 GX-90SDevice 13 0.108 5 22.18 2.45 9.96% 0.118 5 21.99 GX-90SDevice 14 0.108 20 22.16 2.47 10.02% 0.115 20 21.96 GX-90SEND 22.16 2.47 10.02%END 22.16 2.47 10.02%END 22.16 2.47 10.02%END 22.16 2.47 10.02%END 22.16 2.47 10.02%END 22.16 2.47 10.02%Totals 1.437 435 1.575 435Actual voltage was 1% below calculated voltage throught test. Calculation method FAILED.Notes: Start voltage 24.63 at 1.63A, 8 minutes into test 24.39 volts at 1.63A, 16 minutes into test 24.35 volts at 1.62A.
Actual V drop of 2.67 / lump sum V drop of 4.21 = +36% variation: Actual V drop of 2.67 / load centering V drop of 2.10 = -27% variation: using actual currents.
POINT-POINT LIMITS MEET
TotalsLump-Sum Method
Standard Wire Resistance per 1000
Actual Measurements
Alternate CalculationsLoad Centering Method
Totals
Voltage
Figure 3 - Volt Drop Calculation Sheet

9
On the upper left section of the calculation (calc) sheet you will find some general information about the circuit. This includes: • The project name, which is the device used in the test. This may include a power source model
#. • The circuit number, which is coded using the wire size and test number for that set of devices. • The nominal and/or actual voltage used to base the calculation on (will vary by form).
• Calculations were performed using the ‘nominal” starting voltage of 24 volts DC or direct current as would be submitted for review. Then the “actual” voltage as measured at the power supply was inserted into the spreadsheet to more accurately evaluate the true voltage drop compared to the calculated voltage drop. This approach allows the reader to ascertain any potential cushion factor from a higher actual voltage versus a lower nominal voltage.
• The minimum device voltage, which is the minimum voltage listed in product specifications • The total circuit current based on the sum of the listed device currents. • An actual current which was measured by meter at the power supply. • Wire size and distance. This sheet allows for one size wire from the source to first device, and
for another size wire throughout the remainder of the circuit. • Wire resistance per 1,000' is automatically calculated based on size (AWG) and is from the
National Electrical Code (NEC) Chapter 9, Table 8. Actual manufacturer resistance could be entered and may be used to recalculate our tests at a later phase in this report. Actual wire resistance was measured and results can be found under the “validation of wire resistance” section later in this report.
The upper right section of the worksheet contains standard reference text and includes the
alternate calculation methods. The top line also indicates results of the test. As an example, Figure 3 indicates that the “Point-Point Limits Meet.” This text is automatically displayed by the formula within the spreadsheet. In this case, the calculated point-to-point voltage is above the device limits entered in the “Minimum Device Limit” field. However, the nest cell to the right indicates that the “calculation method failed.” This text was manually entered to indicate that although the point-to-point limits were meet, the actual voltage drop was greater than the calculated voltage drop. Thus, the end of line voltage was lower than the design and therefore provided no safety factor. Alternate method fields are automatically calculated based on circuit information entered into the point-to-point fields making up the lower portion of the worksheet.
The lower left half of the worksheet consists of standard information found on the AZAFAA calculation sheet. The lower right half was added specifically for the purpose of this project. This allows the actual test measurements to be entered where they can be charted against the design measurements (Figure 4).
The calculation sheets representing the “actual source voltage” will include a note section on the right-center of the page indicating the percent of variation between the measured end-of-line voltage and the calculated voltages of lump sum and center load methods. This information on variance allows us to evaluate any potential safety factor between each calculation method. A note at the bottom of this sheet also indicates the percent variation between the actual versus the calculated point-to-point voltage. Again, the sheet in example 3 indicates the actual voltage was 1% below the calculated voltage.

10
Gentex 14-2, battery, using actual voltage (1% variation) [point-point calculation method failed]
21.00
21.50
22.00
22.50
23.00
23.50
24.00
Volta
ge
0.000
0.020
0.040
0.060
0.080
0.100
0.120
0.140
Cur
rent
in A
mps
Calc. voltage 23.75 23.38 23.30 23.20 23.00 22.86 22.60 22.51 22.38 22.34 22.24 22.18 22.18 22.16
Actual voltage 23.52 23.37 23.16 23.06 22.88 22.73 22.47 22.37 22.23 22.20 22.09 22.01 21.99 21.96
Listed current 0.093 0.108 0.093 0.108 0.093 0.108 0.093 0.108 0.108 0.108 0.093 0.108 0.108 0.108
Actual current 0.105 0.110 0.107 0.113 0.104 0.123 0.106 0.114 0.115 0.113 0.111 0.121 0.118 0.115
Device 1
Device 2
Device 3
Device 4
Device 5
Device 6
Device 7
Device 8
Device 9
Device 10
Device 11
Device 12
Device 13
Device 14
Figure 4 - Voltage Drop, Charted Result of One Test
Figure 4 graphically represents the point-to-point results for the calculations of Figure 3. The diamond (◆) and square (■) lines represent the actual field measured device voltage against the calculated device voltage respectively. While the "X" and triangular (▲) lines represent the actual field measured device current against the manufacturers advertised device current. As indicated on both "y" axis, the voltage is on the left, and the current in amps is on the right. The data summary across the bottom provides the actual numerical value for each data point indicated. It should be noted that the source voltage is not represented on the chart. All charted points start at device number 1. The actual and nominal voltages can be found on the respective data sheets (Figure 3). The chart title provides a basic logic to the respective test. For example, the title in Figure 4 indicates that this test involved Gentex brand horn/strobe devices. The "14-2" indicates that this was the second design scenario using all 14 AWG (American Wire Gauge) cable. This test was conducted on battery power and was charted against the “actual” source voltage spreadsheet. The “actual” voltage charts will also indicate (in parentheses) the percent variation between the calculated voltage drop and the actual measured voltage drop. This is used to evaluate any potential safety factor within the point-to-point calculation method. This percent variation is the backbone to our study in validating the accuracy of the point-to-point calculation method. Throughout the report, the nominal source voltage calculations and charts will usually be presented ahead of the actual source voltage calculations and charts for each test.

11
Validation of Wire Resistance A critical step in this study was to evaluate the actual wire resistance with respect to the wire resistance as published by the manufacturer and as provided in the 1999 National Electrical Code, Chapter 9, Table 8. The following table provides a comparison for various wire lengths. An important factor to consider is how the respective values were established. NEC values are based on a temperature of 75○C (167○F). Manufacturer values are established by averaging the resistance in continuous 1,000 foot sections of wire at 27○C (80○F). Our field measurements were made after joining various lengths of wire together with wire nuts. Most wire lengths ranged from 20’ to 80’. We believe that such tests provided for a more accurate representation of field conditions. The wire nuts simulated actual field terminations to notification appliances. Resistance measurements could not be taken with the wire connected to the appliances as any extra resistance within the devices would not reflect wire-only resistance. 18 AWG FPL, solid, copper 14 AWG FPL, solid, copper 12 AWG, THHN, 19 strand Wire Length
NEC Mfg. Actual NEC Mfg. Actual NEC Mfg. Actual
200’ 1.55 1.3 1.4 0.61 0.52 0.5 0.40 0.35 0.4 400’ 3.11 2.60 2.8 1.23 1.04 1.1 0.79 0.70 0.7 600’ 4.66 3.90 4.2 1.84 1.56 1.6 1.19 1.04 1.1 800’ 6.22 5.20 5.6 2.46 2.08 2.0 1.58 1.39 1.4 960’ 7.46 6.24 6.8 - - - - - - 1000’ 7.77 6.50 - 3.07 2.60 2.6 1.98 1.74 1.8 NEC = National Electrical Code values from Chapter 9, Table 8, solid, uncoated (18AWG=7.77/kft, 14AWG=3.07/kft, 12AWG=1.98/kft). It should be noted that NEC values are based on elevated temperatures of 75○C (167○F). Mfg. = Published values from the manufacturer (18AWG=6.50/kft, 14AWG=2.60/kft, 12AWG=1.74/kft. Actual = Actual wire resistance measured in test without devices installed, including wire nut connections between variable lengths.
Figure 5 - Wire Resistance Values By Source (Ohm's)
Preliminary Interpretation of Test Results: As of this preliminary draft copy, final conclusions have not been reached. Several tests including actual building tests have yet to be compiled. However, a few noticeable points can be made. • The point-to-point method of calculating voltage drop using the wire resistance tables found in
the NEC is extremely close when installed as designed. As you can see with the “validation of wire resistance” section, our field tests resulted in significantly higher resistance values then both NEC and Mfg. values. Noting that the manufacturers published resistance is lower than the NEC values there is valid concern that using the manufacturers published wire resistance figures may not provide satisfactory results. An important issue to consider was that our actual resistance values included various wire lengths connected with wire nuts to create the respective lengths. These results would therefore represent actual field installations including wire terminations at

12
devices, versus measuring one 1,000 foot continuous length of wire. For clarification, all wire was uncoiled during use in all of our tests.
• Using the conservative (higher) published currents is very important. Many manufacturers now publish the device current at each of three voltages. The upper specification voltage, the nominal voltage, and the minimum specification voltage (i.e. 30vdc, 24vdc, 20vdc). The higher current, which corresponds to the lower voltage, should be used. It is important to note that as voltage decreases, current increases. This is defined by Ohm’s Law of I=V/R and was validated in our tests as represented on the charts.
• The effect of running alarms off of batteries, versus running alarms off of primary power does have an impact. All system tests should be conducted on battery power and voltage readings taken. Battery life and voltage must be considered in designing a system. However, at this time and pending further testing which was not a part of this project, it is not the authors' opinion that battery life should be compensated for in voltage drop calculations. That is, we should not compensate for bad batteries in our voltage drop design. Safety factors for batteries should be incorporated into the standby battery calculations.
• Wire size plays a critical role in the limits of a circuit. Careful consideration should be used in determining wire size. The author recommends that 14 AWG and 12 AWG wires be used conservatively. Larger gauge wire should be used for long home runs reducing voltage loss from resistance.
How to Use the Information:
It is the objective of this report to provide sufficient information so that the user can learn from, and appreciate the efforts of this project. We hope that this information will help each individual involved in the design and installation of fire alarm systems to better understand the evaluation and impact of voltage drop.
Our tests validate the accuracy of Ohm’s Law. We have validated the accuracy of point-to-point calculations. We confirmed our suspicion that lump sum calculations are conservative and do provide a significant margin of safety for the initially calculated system. However, this margin of safety can be significantly compromised when additional devices are added to a circuit without performing new calculations.
If point-to-point calculations are to be used, it is imperative that designers thoroughly evaluate the exact routing that the wire shall be installed. Installers must not deviate wire routing in a manner that will increase the wire resistance of a circuit.
As margins of safety continue to be narrowed through such approaches as performance based design and value engineering, early and effective notification of occupants will become more critical. Authorities Having Jurisdiction must require that field measurements be conducted as part of any system inspection. All such inspection must be conducted using the lowest voltage power source for the system. In most cases this will be the standby batteries. However, if the systems secondary power supply is generators, this voltage could be slightly higher or lower than the primary power supply. This will also depend on regulated power supply of the fire alarm system.

13
A Few Results: The calculation sheets and charts included in this report represent tests that were conducted. A few tests are still being evaluated and may not be included. The final report will incorporate the results of all tests conducted. Although some tests were identified as inconclusive for drawing conclusions, they were still able to validate the accuracy of the point-to-point calculation method. These tests only provide validation to one issue involving fire alarm systems. Some additional testing that we would like to see conducted includes: • Voltage and resistance drop evaluation on speaker circuits. • Battery life. • Additional evaluation of circuit design versus real-life installation. • Temperature effects on circuit resistance and components (outdoor installations). A description of the test procedures is included at the end of the report.
Excel Sheets and Charts

14
Project Name GentexDateCircuit Number 18-1Notes 110vac, Solid tone, strobes not synched 18=7.77 16=4.89 14=3.07 12=1.98 10=1.24Nominal System Voltage 24 Actual = 25.60 When entering your measured value. Use the resistance measured for Minimum Device Voltage 21 one way on the circuit or 1/2 the total resistance out and backTotal Circuit Current 1.437 Wire Ohm'sActual current 1.66 Gauge Per 1000Distance from source to 1st device 40 18 7.77 Voltage VoltageWire Gauge for balance of circuit 18 7.77 Current Distance Drop Current Distance Drop
Distance Calculated 1.437 375 8.374 1.437 375 4.187Listed from Actual 1.617 375 9.423 1.617 375 4.712
Device Device previous At Drop from Percent Device Manufacture: GentexNumber Current device Device source Drop Current Distance Voltage Model Numbers:
Device 1 0.093 40 23.11 0.89 3.72% 0.10 40.00 24.55 GXSDevice 2 0.108 45 22.17 1.83 7.64% 0.11 45.00 23.66 GX-90SDevice 3 0.093 10 21.97 2.03 8.44% 0.11 10.00 23.42 GXSDevice 4 0.108 15 21.71 2.29 9.55% 0.11 15.00 23.15 GX-90SDevice 5 0.093 30 21.23 2.77 11.56% 0.11 30.00 22.65 GXSDevice 6 0.108 25 20.86 3.14 13.08% 0.13 25.00 22.28 GX-90SDevice 7 0.093 50 20.21 3.79 15.78% 0.11 50.00 21.62 GXSDevice 8 0.108 20 19.98 4.02 16.74% 0.12 20.00 21.39 GX-90SDevice 9 0.108 35 19.64 4.36 18.18% 0.12 35.00 21.02 GX-90SDevice 10 0.108 10 19.56 4.44 18.52% 0.12 10.00 20.96 GX-90SDevice 11 0.093 40 19.30 4.70 19.60% 0.12 40.00 20.65 GXSDevice 12 0.108 30 19.15 4.85 20.23% 0.11 30.00 20.50 GX-90SDevice 13 0.108 5 19.13 4.87 20.30% 0.13 5.00 20.50 GX-90SDevice 14 0.108 20 19.10 4.90 20.44% 0.12 20.00 20.49 GX-90SEND 19.10 4.90 20.44%END 19.10 4.90 20.44%END 19.10 4.90 20.44%END 19.10 4.90 20.44%END 19.10 4.90 20.44%END 19.10 4.90 20.44%Totals 1.437 375 1.617 375
TotalsLump-Sum Method
Standard Wire Resistance per 1000
Actual Measurements
Alternate Calculations
July 18, 2000
Load Centering MethodTotals
Voltage
EXCEEDS DEVICE LIMITS

15
Gentex 18/1 using nominal voltage
0.00
5.00
10.00
15.00
20.00
25.00
30.00
Volta
ge
0.000
0.020
0.040
0.060
0.080
0.100
0.120
0.140
Cur
rent
in A
mps
Calculated voltage 23.11 22.17 21.71 21.23 20.21 19.98 19.64 19.30 19.15 19.10
Actual measured voltage 24.55 23.66 23.15 22.65 21.62 21.39 21.02 20.65 20.50 20.49
Manufacturer listed current 0.093 0.108 0.108 0.093 0.093 0.108 0.108 0.093 0.108 0.108
Actual measured current 0.10 0.11 0.11 0.11 0.11 0.12 0.12 0.12 0.11 0.12
Device 1
Device 2
Device 4
Device 5
Device 7
Device 8
Device 9
Device 11
Device 12
Device 14

16
Project Name GentexDate Point to Point Calculation method FAILEDCircuit Number 18-1 using actual voltageNotes 110vac, Solid tone, strobes not synched 18=7.77 16=4.89 14=3.07 12=1.98 10=1.24Actual System Voltage 25.6 When entering your measured value. Use the resistance measured for Minimum Device Voltage 21 one way on the circuit or 1/2 the total resistance out and backTotal Circuit Current 1.437 Wire Ohm'sActual current 1.66 Gauge Per 1000Distance from source to 1st device 40 18 7.77 Voltage VoltageWire Gauge for balance of circuit 18 7.77 Current Distance Drop Current Distance Drop
Distance Calculated 1.437 375 8.374 1.437 375 4.187Listed from Actual 1.617 375 9.423 1.617 375 4.712
Device Device previous At Drop from Percent Device Manufacture: GentexNumber Current device Device source Drop Current Distance Voltage Model Numbers:
Device 1 0.093 40 24.71 0.89 3.49% 0.10 40.00 24.55 GXSDevice 2 0.108 45 23.77 1.83 7.16% 0.11 45.00 23.66 GX-90SDevice 3 0.093 10 23.57 2.03 7.91% 0.11 10.00 23.42 GXSDevice 4 0.108 15 23.31 2.29 8.95% 0.11 15.00 23.15 GX-90SDevice 5 0.093 30 22.83 2.77 10.84% 0.11 30.00 22.65 GXSDevice 6 0.108 25 22.46 3.14 12.27% 0.13 25.00 22.28 GX-90SDevice 7 0.093 50 21.81 3.79 14.80% 0.11 50.00 21.62 GXSDevice 8 0.108 20 21.58 4.02 15.70% 0.12 20.00 21.39 GX-90SDevice 9 0.108 35 21.24 4.36 17.04% 0.12 35.00 21.02 GX-90SDevice 10 0.108 10 21.16 4.44 17.36% 0.12 10.00 20.96 GX-90SDevice 11 0.093 40 20.90 4.70 18.37% 0.12 40.00 20.65 GXSDevice 12 0.108 30 20.75 4.85 18.96% 0.11 30.00 20.50 GX-90SDevice 13 0.108 5 20.73 4.87 19.03% 0.13 5.00 20.50 GX-90SDevice 14 0.108 20 20.70 4.90 19.16% 0.12 20.00 20.49 GX-90SEND 20.70 4.90 19.16%END 20.70 4.90 19.16%END 20.70 4.90 19.16%END 20.70 4.90 19.16%END 20.70 4.90 19.16%END 20.70 4.90 19.16%Totals 1.437 375 1.617 375Actual voltage was under the calculated voltage by 1%. Point to Point calculation method FAILED.
Actual V drop of 5.11 / lump sum V drop of 9.42 = +46% variation: Actual V drop of 5.11 / load centering V drop of 4.71 = --8% variation: using actual currents.
Actual Measurements
Alternate Calculations
July 18, 2000
Load Centering MethodTotals
Voltage
EXCEEDS DEVICE LIMITS
TotalsLump-Sum Method
Standard Wire Resistance per 1000

17
Gentex 18-1 using actual voltage (Calculation failed by a 1% variation)
0.00
5.00
10.00
15.00
20.00
25.00
30.00
Volta
ge
0.000
0.020
0.040
0.060
0.080
0.100
0.120
0.140
Cur
rent
in A
mps
Calc. voltage 24.71 23.77 23.57 23.31 22.83 22.46 21.81 21.58 21.24 21.16 20.90 20.75 20.73 20.70
Actual voltage 24.55 23.66 23.42 23.15 22.65 22.28 21.62 21.39 21.02 20.96 20.65 20.50 20.50 20.49
Listed current 0.093 0.108 0.093 0.108 0.093 0.108 0.093 0.108 0.108 0.108 0.093 0.108 0.108 0.108
Actual current 0.10 0.11 0.11 0.11 0.11 0.13 0.11 0.12 0.12 0.12 0.12 0.11 0.13 0.12
Device 1
Device 2
Device 3
Device 4
Device 5
Device 6
Device 7
Device 8
Device 9
Device 10
Device 11
Device 12
Device 13
Device 14

18
Project Name GentexDateCircuit Number 18-2Notes Battery power with no standby time 18=7.77 16=4.89 14=3.07 12=1.98 10=1.24Nominal System Voltage 24 Actual = 24.47 When entering your measured value. Use the resistance measured for Minimum Device Voltage 21 one way on the circuit or 1/2 the total resistance out and backTotal Circuit Current 1.437 Wire Ohm's
Gauge Per 1000Distance from source to 1st device 40 18 7.77 Voltage VoltageWire Gauge for balance of circuit 18 7.77 Current Distance Drop Current Distance Drop
Distance Calculated 1.437 375 8.374 1.437 375 4.187Listed from Actual 1.709 375 9.959 1.709 375 4.980
Device Device previous At Drop from Percent Device Manufacture: GentexNumber Current device Device source Drop Current Distance Voltage Model Numbers:
Device 1 0.093 40 23.11 0.89 3.72% 0.103 40.00 23.59 GXSDevice 2 0.108 45 22.17 1.83 7.64% 0.113 45.00 22.34 GX-90SDevice 3 0.093 10 21.97 2.03 8.44% 0.109 10.00 22.34 GXSDevice 4 0.108 15 21.71 2.29 9.55% 0.116 15.00 21.90 GX-90SDevice 5 0.093 30 21.23 2.77 11.56% 0.109 30.00 21.50 GXSDevice 6 0.108 25 20.86 3.14 13.08% 0.131 25.00 20.90 GX-90SDevice 7 0.093 50 20.21 3.79 15.78% 0.116 50.00 20.37 GXSDevice 8 0.108 20 19.98 4.02 16.74% 0.125 20.00 19.99 GX-90SDevice 9 0.108 35 19.64 4.36 18.18% 0.128 35.00 19.45 GX-90SDevice 10 0.108 10 19.56 4.44 18.52% 0.128 10.00 19.34 GX-90SDevice 11 0.093 40 19.30 4.70 19.60% 0.128 40.00 19.32 GXSDevice 12 0.108 30 19.15 4.85 20.23% 0.136 30.00 19.13 GX-90SDevice 13 0.108 5 19.13 4.87 20.30% 0.134 5.00 18.90 GX-90SDevice 14 0.108 20 19.10 4.90 20.44% 0.133 20.00 18.82 GX-90SEND 19.10 4.90 20.44%END 19.10 4.90 20.44%END 19.10 4.90 20.44%END 19.10 4.90 20.44%END 19.10 4.90 20.44%END 19.10 4.90 20.44%Totals 1.437 375 1.709 375
Addit. Notes: Start voltage at panel = 24.47, eight minutes into test = 24.35vdc, at end of test 16 minutes = 24.13vdc at 1.83amps.
TotalsLump-Sum Method
Standard Wire Resistance per 1000
Actual Measurements
Alternate Calculations
July 18, 2000
Load Centering MethodTotals
Voltage
EXCEEDS DEVICE LIMITS

19
Gentex 18/2, using nominal voltage
0.00
5.00
10.00
15.00
20.00
25.00
Volta
ge
0.000
0.020
0.040
0.060
0.080
0.100
0.120
0.140
0.160
Cur
rent
in A
mps
Calculated voltage 23.11 22.17 21.97 21.23 20.86 20.21 19.98 19.64 19.56 19.15 19.13 19.10
Actual measured voltage 23.59 22.34 22.34 21.50 20.90 20.37 19.99 19.45 19.34 19.13 18.90 18.82
Manufacturer listed current 0.093 0.108 0.093 0.093 0.108 0.093 0.108 0.108 0.108 0.108 0.108 0.108
Actual measured current 0.103 0.113 0.109 0.109 0.131 0.116 0.125 0.128 0.128 0.136 0.134 0.133
Device 1
Device 2
Device 3
Device 5
Device 6
Device 7
Device 8
Device 9
Device 10
Device 12
Device 13
Device 14

20
Project Name GentexDate Point to Point Calculation Considered FAILEDCircuit Number 18-2 using actual voltageNotes Battery power with no standby time 18=7.77 16=4.89 14=3.07 12=1.98 10=1.24Actual System Voltage 24.47 Actual=see notes When entering your measured value. Use the resistance measured for Minimum Device Voltage 21 one way on the circuit or 1/2 the total resistance out and backTotal Circuit Current 1.437 Wire Ohm's
Gauge Per 1000Distance from source to 1st device 40 18 7.77 Voltage VoltageWire Gauge for balance of circuit 18 7.77 Current Distance Drop Current Distance Drop
Distance Calculated 1.437 375 8.374 1.437 375 4.187Listed from Actual 1.709 375 9.959 1.709 375 4.980
Device Device previous At Drop from Percent Device Manufacture: GentexNumber Current device Device source Drop Current Distance Voltage Model Numbers:
Device 1 0.093 40 23.58 0.89 3.65% 0.103 40.00 23.59 GXSDevice 2 0.108 45 22.64 1.83 7.49% 0.113 45.00 22.34 GX-90SDevice 3 0.093 10 22.44 2.03 8.28% 0.109 10.00 22.34 GXSDevice 4 0.108 15 22.18 2.29 9.36% 0.116 15.00 21.90 GX-90SDevice 5 0.093 30 21.70 2.77 11.34% 0.109 30.00 21.50 GXSDevice 6 0.108 25 21.33 3.14 12.83% 0.131 25.00 20.90 GX-90SDevice 7 0.093 50 20.68 3.79 15.48% 0.116 50.00 20.37 GXSDevice 8 0.108 20 20.45 4.02 16.42% 0.125 20.00 19.99 GX-90SDevice 9 0.108 35 20.11 4.36 17.83% 0.128 35.00 19.45 GX-90SDevice 10 0.108 10 20.03 4.44 18.16% 0.128 10.00 19.34 GX-90SDevice 11 0.093 40 19.77 4.70 19.22% 0.128 40.00 19.32 GXSDevice 12 0.108 30 19.62 4.85 19.84% 0.136 30.00 19.13 GX-90SDevice 13 0.108 5 19.60 4.87 19.91% 0.134 5.00 18.90 GX-90SDevice 14 0.108 20 19.57 4.90 20.04% 0.133 20.00 18.82 GX-90SEND 19.57 4.90 20.04%END 19.57 4.90 20.04%END 19.57 4.90 20.04%END 19.57 4.90 20.04%END 19.57 4.90 20.04%END 19.57 4.90 20.04%Totals 1.437 375 1.709 375Actual voltage started at 0% varience and immediately went below calculated to a variance of 4%. Calculation considered FAILED.Addit. Notes: Start voltage at panel = 24.47, eight minutes into test = 24.35vdc, at end of test 16 minutes = 24.13vdc at 1.83amps.
Actual V drop of 5.65 / lump sum V drop of 9.96 = +43% variation: Actual V drop of 5.65 / load centering V drop of 4.98 = --13% variation : using actual currents.
Actual Measurements
Alternate Calculations
July 18, 2000
Load Centering MethodTotals
Voltage
EXCEEDS DEVICE LIMITS
TotalsLump-Sum Method
Standard Wire Resistance per 1000

21
Gentex 18-2, battery, using actual voltage (Failed by 3% variation)
0.00
5.00
10.00
15.00
20.00
25.00
Volta
ge
0.000
0.020
0.040
0.060
0.080
0.100
0.120
0.140
0.160
Cur
rent
in A
mps
Calc. voltage 23.58 22.64 22.44 22.18 21.70 21.33 20.68 20.45 20.11 20.03 19.77 19.62 19.60 19.57
Actual voltage 23.59 22.34 22.34 21.90 21.50 20.90 20.37 19.99 19.45 19.34 19.32 19.13 18.90 18.82
Listed current 0.093 0.108 0.093 0.108 0.093 0.108 0.093 0.108 0.108 0.108 0.093 0.108 0.108 0.108
Actual current 0.103 0.113 0.109 0.116 0.109 0.131 0.116 0.125 0.128 0.128 0.128 0.136 0.134 0.133
Device 1
Device 2
Device 3
Device 4
Device 5
Device 6
Device 7
Device 8
Device 9
Device 10
Device 11
Device 12
Device 13
Device 14

22
Project Name GentexDate Point to Point calculation FAILEDCircuit Number 18-3 Using actual voltageNotes Configuration of 18-1 with 100' home run 18=7.77 16=4.89 14=3.07 12=1.98 10=1.24Actual System Voltage 25.5 When entering your measured value. Use the resistance measured for Minimum Device Voltage 21 one way on the circuit or 1/2 the total resistance out and backTotal Circuit Current 1.437 Wire Ohm's
Gauge Per 1000Distance from source to 1st device 100 18 7.77 Voltage VoltageWire Gauge for balance of circuit 18 7.77 Current Distance Drop Current Distance Drop
Distance Calculated 1.437 435 9.714 1.437 435 4.857Listed from Actual * 435 #VALUE! * 435 #VALUE!
Device Device previous At Drop from Percent Device Manufacture: GentexNumber Current device Device source Drop Current Distance Voltage Model Numbers:
Device 1 0.093 100 23.27 2.23 8.76% 0.104 100.00 23.17 GXSDevice 2 0.108 45 22.33 3.17 12.44% 45.00 GX-90SDevice 3 0.093 10 22.13 3.37 13.20% 10.00 GXSDevice 4 0.108 15 21.87 3.63 14.24% 15.00 GX-90SDevice 5 0.093 30 21.39 4.11 16.13% 30.00 GXSDevice 6 0.108 25 21.02 4.48 17.57% 25.00 GX-90SDevice 7 0.093 50 20.37 5.13 20.11% 50.00 GXSDevice 8 0.108 20 20.14 5.36 21.01% 20.00 GX-90SDevice 9 0.108 35 19.80 5.70 22.36% 35.00 GX-90SDevice 10 0.108 10 19.72 5.78 22.68% 10.00 GX-90SDevice 11 0.093 40 19.46 6.04 23.70% 40.00 GXSDevice 12 0.108 30 19.31 6.19 24.29% 30.00 GX-90SDevice 13 0.108 5 19.29 6.21 24.36% 5.00 GX-90SDevice 14 0.108 20 19.26 6.24 24.49% 0.133 20.00 18.72 GX-90SEND 19.26 6.24 24.49%END 19.26 6.24 24.49%END 19.26 6.24 24.49%END 19.26 6.24 24.49%END 19.26 6.24 24.49%END 19.26 6.24 24.49%Totals 1.437 435 * 435
*Actual measured current total = 1.82AActual voltage went below calculated by 3% variation. Point to Point calculation Failed.
July 18, 2000
Load Centering MethodTotals
Voltage
EXCEEDS DEVICE LIMITS
Actual V drop of 6.78 was not compared to lump sum or load centering since all actual current readings were not taken. This test was done to compare extra resistance of home run with respect to circuit 18-2. No chart was generated for this test.
TotalsLump-Sum Method
Standard Wire Resistance per 1000
Actual Measurements
Alternate Calculations
23
No Chart for This Sheet.
Circuit 18-3 is similar to 18-1. Exception: 18-3 has 100’ home run causing its actual end of line voltage to be
3% below calculated. Circuit 18-1 with a 40’ home run had an actual end of line voltage of 1%
below calculated.

24
Project Name Gentex (AFP-200 w/CBC - PL)DateCircuit Number 14-1 (compare to Gentex 18-3 & 18-4) ActualNotes 110 vac, solid tone, strobes not synched 18=7.77 16=4.89 14=3.07 12=1.98 10=1.24Actual System Voltage 25.62 When entering your measured value. Use the resistance measured for Minimum Device Voltage 21 one way on the circuit or 1/2 the total resistance out and backTotal Circuit Current 1.437 Wire Ohm'sTotal actual current = 1.55A Gauge Per 1000Distance from source to 1st device 100 14 3.07 Voltage VoltageWire Gauge for balance of circuit 14 3.07 Current Distance Drop Current Distance Drop
Distance Calculated 1.437 435 3.838 1.437 435 1.919Listed from Actual 1.507 435 4.025 1.507 435 2.013
Device Device previous At Drop from Percent Device Manufacture: GentexNumber Current device Device source Drop Current Distance Voltage Model Numbers:
Device 1 0.093 100 24.74 0.88 3.44% 0.099 100 24.77 GXSDevice 2 0.108 45 24.37 1.25 4.89% 0.107 45 24.43 GX-90SDevice 3 0.093 10 24.29 1.33 5.19% 0.101 10 24.36 GXSDevice 4 0.108 15 24.19 1.43 5.60% 0.108 15 24.27 GX-90SDevice 5 0.093 30 23.99 1.63 6.34% 0.099 30 24.09 GXSDevice 6 0.108 25 23.85 1.77 6.91% 0.118 25 23.93 GX-90SDevice 7 0.093 50 23.59 2.03 7.91% 0.100 50 23.73 GXSDevice 8 0.108 20 23.50 2.12 8.26% 0.110 20 23.64 GX-90SDevice 9 0.108 35 23.37 2.25 8.79% 0.110 35 23.53 GX-90SDevice 10 0.108 10 23.33 2.29 8.92% 0.109 10 23.49 GX-90SDevice 11 0.093 40 23.23 2.39 9.32% 0.106 40 23.40 GXSDevice 12 0.108 30 23.17 2.45 9.55% 0.116 30 23.34 GX-90SDevice 13 0.108 5 23.17 2.45 9.58% 0.112 5 23.33 GX-90SDevice 14 0.108 20 23.15 2.47 9.63% 0.112 20 23.33 GX-90SEND 23.15 2.47 9.63%END 23.15 2.47 9.63%END 23.15 2.47 9.63%END 23.15 2.47 9.63%END 23.15 2.47 9.63%END 23.15 2.47 9.63%Totals 1.437 435 1.507 435Actual voltage is above calculated by <1%.
Load Centering MethodTotals
Voltage
Actual V drop of 2.29 / lump sum V drop of 4.00 = +43% variation: Actual V drop of 2.29 / load centering V drop of 2.01 = +14% variation: using actual currents.
POINT-POINT LIMITS MEET
TotalsLump-Sum Method
Standard Wire Resistance per 1000
Actual Measurements
Alternate Calculations

25
Gentex 14-1 using actual voltage (<1% variation)
22.00
22.50
23.00
23.50
24.00
24.50
25.00
Volta
ge
0.000
0.020
0.040
0.060
0.080
0.100
0.120
0.140
Cur
rent
in A
mps
Calc. voltage 24.74 24.37 24.29 24.19 23.99 23.85 23.59 23.50 23.37 23.33 23.23 23.17 23.17 23.15
Actual voltage 24.77 24.43 24.36 24.27 24.09 23.93 23.73 23.64 23.53 23.49 23.40 23.34 23.33 23.33
Listed current 0.093 0.108 0.093 0.108 0.093 0.108 0.093 0.108 0.108 0.108 0.093 0.108 0.108 0.108
Actual current 0.099 0.107 0.101 0.108 0.099 0.118 0.100 0.110 0.110 0.109 0.106 0.116 0.112 0.112
1 2 3 4 5 6 7 8 9 10 11 12 13 14

26
Project Name Gentex (AFP-200 w/CBC - PL)DateCircuit Number 14-2Notes Batterypower with no standby time 18=7.77 16=4.89 14=3.07 12=1.98 10=1.24Nominal System Voltage 24 Actual = see notes When entering your measured value. Use the resistance measured for Minimum Device Voltage 21 one way on the circuit or 1/2 the total resistance out and backTotal Circuit Current 1.437 Wire Ohm's
Gauge Per 1000Distance from source to 1st device 100 14 3.07 Voltage VoltageWire Gauge for balance of circuit 14 3.07 Current Distance Drop Current Distance Drop
Distance Calculated 1.437 435 3.838 1.437 435 1.919Listed from Actual 1.575 435 4.207 1.575 435 2.103
Device Device previous At Drop from Percent Device Manufacture: GentexNumber Current device Device source Drop Current Distance Voltage Model Numbers:
Device 1 0.093 100 23.12 0.88 3.68% 0.105 100 23.52 GXSDevice 2 0.108 45 22.75 1.25 5.22% 0.110 45 23.37 GX-90SDevice 3 0.093 10 22.67 1.33 5.54% 0.107 10 23.16 GXSDevice 4 0.108 15 22.57 1.43 5.98% 0.113 15 23.06 GX-90SDevice 5 0.093 30 22.37 1.63 6.77% 0.104 30 22.88 GXSDevice 6 0.108 25 22.23 1.77 7.38% 0.123 25 22.73 GX-90SDevice 7 0.093 50 21.97 2.03 8.44% 0.106 50 22.47 GXSDevice 8 0.108 20 21.88 2.12 8.82% 0.114 20 22.37 GX-90SDevice 9 0.108 35 21.75 2.25 9.39% 0.115 35 22.23 GX-90SDevice 10 0.108 10 21.71 2.29 9.52% 0.113 10 22.20 GX-90SDevice 11 0.093 40 21.61 2.39 9.95% 0.111 40 22.09 GXSDevice 12 0.108 30 21.55 2.45 10.20% 0.121 30 22.01 GX-90SDevice 13 0.108 5 21.55 2.45 10.23% 0.118 5 21.99 GX-90SDevice 14 0.108 20 21.53 2.47 10.28% 0.115 20 21.96 GX-90SEND 21.53 2.47 10.28%END 21.53 2.47 10.28%END 21.53 2.47 10.28%END 21.53 2.47 10.28%END 21.53 2.47 10.28%END 21.53 2.47 10.28%Totals 1.437 435 1.575 435
Notes: Start voltage 24.63 at 1.63A, 8 minutes into test 24.39 volts at 1.63A, 16 minutes into test 24.35 volts at 1.62A.
POINT-POINT LIMITS MEET
TotalsLump-Sum Method
Standard Wire Resistance per 1000
Actual Measurements
Alternate CalculationsLoad Centering Method
Totals
Voltage

27
Gentex 14/2 battery, using nominal voltage
20.50
21.00
21.50
22.00
22.50
23.00
23.50
24.00
Volta
ge
0.000
0.020
0.040
0.060
0.080
0.100
0.120
0.140
Cur
rent
in A
mps
Calculated voltage 23.12 22.75 22.67 22.37 22.23 21.97 21.88 21.75 21.71 21.55 21.55 21.53
Actual measured voltage 23.52 23.37 23.16 22.88 22.73 22.47 22.37 22.23 22.20 22.01 21.99 21.96
Manufacturer listed current 0.093 0.108 0.093 0.093 0.108 0.093 0.108 0.108 0.108 0.108 0.108 0.108
Actual measured current 0.105 0.110 0.107 0.104 0.123 0.106 0.114 0.115 0.113 0.121 0.118 0.115
Device 1
Device 2
Device 3
Device 5
Device 6
Device 7
Device 8
Device 9
Device 10
Device 12
Device 13
Device 14

28
Project Name Gentex (AFP-200 w/CBC - PL) Calculation method FAILEDDateCircuit Number 14-2 Using actual voltageNotes Battery power with no standby time 18=7.77 16=4.89 14=3.07 12=1.98 10=1.24Actual System Voltage 24.63 Actual = see notes When entering your measured value. Use the resistance measured for Minimum Device Voltage 21 one way on the circuit or 1/2 the total resistance out and backTotal Circuit Current 1.437 Wire Ohm's
Gauge Per 1000Distance from source to 1st device 100 14 3.07 Voltage VoltageWire Gauge for balance of circuit 14 3.07 Current Distance Drop Current Distance Drop
Distance Calculated 1.437 435 3.838 1.437 435 1.919Listed from Actual 1.575 435 4.207 1.575 435 2.103
Device Device previous At Drop from Percent Device Manufacture: GentexNumber Current device Device source Drop Current Distance Voltage Model Numbers:
Device 1 0.093 100 23.75 0.88 3.58% 0.105 100 23.52 GXSDevice 2 0.108 45 23.38 1.25 5.09% 0.110 45 23.37 GX-90SDevice 3 0.093 10 23.30 1.33 5.40% 0.107 10 23.16 GXSDevice 4 0.108 15 23.20 1.43 5.83% 0.113 15 23.06 GX-90SDevice 5 0.093 30 23.00 1.63 6.60% 0.104 30 22.88 GXSDevice 6 0.108 25 22.86 1.77 7.19% 0.123 25 22.73 GX-90SDevice 7 0.093 50 22.60 2.03 8.23% 0.106 50 22.47 GXSDevice 8 0.108 20 22.51 2.12 8.60% 0.114 20 22.37 GX-90SDevice 9 0.108 35 22.38 2.25 9.15% 0.115 35 22.23 GX-90SDevice 10 0.108 10 22.34 2.29 9.28% 0.113 10 22.20 GX-90SDevice 11 0.093 40 22.24 2.39 9.69% 0.111 40 22.09 GXSDevice 12 0.108 30 22.18 2.45 9.94% 0.121 30 22.01 GX-90SDevice 13 0.108 5 22.18 2.45 9.96% 0.118 5 21.99 GX-90SDevice 14 0.108 20 22.16 2.47 10.02% 0.115 20 21.96 GX-90SEND 22.16 2.47 10.02%END 22.16 2.47 10.02%END 22.16 2.47 10.02%END 22.16 2.47 10.02%END 22.16 2.47 10.02%END 22.16 2.47 10.02%Totals 1.437 435 1.575 435Actual voltage was 1% below calculated voltage throught test. Calculation method FAILED.Notes: Start voltage 24.63 at 1.63A, 8 minutes into test 24.39 volts at 1.63A, 16 minutes into test 24.35 volts at 1.62A.
Load Centering MethodTotals
Voltage
Actual V drop of 2.67 / lump sum V drop of 4.21 = +36% variation: Actual V drop of 2.67 / load centering V drop of 2.10 = --27% variation: using actual currents.
POINT-POINT LIMITS MEET
TotalsLump-Sum Method
Standard Wire Resistance per 1000
Actual Measurements
Alternate Calculations

29
Gentex 14-2, battery, using actual voltage (1% variation) [point-point calculation method failed]
21.00
21.50
22.00
22.50
23.00
23.50
24.00
Volta
ge
0.000
0.020
0.040
0.060
0.080
0.100
0.120
0.140
Cur
rent
in A
mps
Calc. voltage 23.75 23.38 23.30 23.20 23.00 22.86 22.60 22.51 22.38 22.34 22.24 22.18 22.18 22.16
Actual voltage 23.52 23.37 23.16 23.06 22.88 22.73 22.47 22.37 22.23 22.20 22.09 22.01 21.99 21.96
Listed current 0.093 0.108 0.093 0.108 0.093 0.108 0.093 0.108 0.108 0.108 0.093 0.108 0.108 0.108
Actual current 0.105 0.110 0.107 0.113 0.104 0.123 0.106 0.114 0.115 0.113 0.111 0.121 0.118 0.115
Device 1
Device 2
Device 3
Device 4
Device 5
Device 6
Device 7
Device 8
Device 9
Device 10
Device 11
Device 12
Device 13
Device 14

30
Project Name Gentex (AFP-200 w/CBC - PL)DateCircuit Number 14-3 (Compare to Gentex 18-3)Notes 110 vac, solid tone, not synched. 18=7.77 16=4.89 14=3.07 12=1.98 10=1.24Nominal System Voltage 24 Actual = 25.62 When entering your measured value. Use the resistance measured for Minimum Device Voltage 21 one way on the circuit or 1/2 the total resistance out and backTotal Circuit Current 1.437 Wire Ohm'sActual total current 1.52A Gauge Per 1000Distance from source to 1st device 40 14 3.07 Voltage VoltageWire Gauge for balance of circuit 14 3.07 Current Distance Drop Current Distance Drop
Distance Calculated 1.437 375 3.309 1.437 375 1.654Listed from Actual 1.480 435 3.953 1.480 435 1.976
Device Device previous At Drop from Percent Device Manufacture: GentexNumber Current device Device source Drop Current Distance Voltage Model Numbers:
Device 1 0.093 100 23.65 0.35 1.47% 0.098 100 25.27 GXSDevice 2 0.108 45 23.28 0.72 3.02% 0.105 45 24.93 GXS-90SDevice 3 0.093 10 23.20 0.80 3.33% 0.099 10 24.85 GXSDevice 4 0.108 15 23.09 0.91 3.77% 0.108 15 24.24 GX-90SDevice 5 0.093 30 22.90 1.10 4.57% 0.097 30 24.58 GXSDevice 6 0.108 25 22.76 1.24 5.17% 0.116 25 24.44 GX-90SDevice 7 0.093 50 22.50 1.50 6.24% 0.098 50 24.23 GXSDevice 8 0.108 20 22.41 1.59 6.62% 0.109 20 24.14 GX-90SDevice 9 0.108 35 22.28 1.72 7.18% 0.109 35 24.02 GX-90SDevice 10 0.108 10 22.24 1.76 7.32% 0.106 10 23.99 GX-90SDevice 11 0.093 40 22.14 1.86 7.74% 0.103 40 23.90 GXSDevice 12 0.108 30 22.08 1.92 7.99% 0.114 30 23.84 GX-90SDevice 13 0.108 5 22.08 1.92 8.02% 0.110 5 23.84 GX-90SDevice 14 0.108 20 22.06 1.94 8.07% 0.108 20 23.80 GX-90SEND 22.06 1.94 8.07%END 22.06 1.94 8.07%END 22.06 1.94 8.07%END 22.06 1.94 8.07%END 22.06 1.94 8.07%END 22.06 1.94 8.07%Totals 1.437 375 1.480 435
Actual Measurements
Alternate CalculationsLoad Centering Method
Totals
Voltage
POINT-POINT LIMITS MEET
TotalsLump-Sum Method
Standard Wire Resistance per 1000

31
Gentex 14/3
20.00
21.00
22.00
23.00
24.00
25.00
26.00Vo
ltage
0.000
0.020
0.040
0.060
0.080
0.100
0.120
0.140
Cur
rent
in m
illia
mps
Calculated voltage 23.65 23.28 23.20 22.90 22.76 22.50 22.41 22.28 22.24 22.08 22.08 22.06
Actual measured voltage 25.27 24.93 24.85 24.58 24.44 24.23 24.14 24.02 23.99 23.84 23.84 23.80
Manufacturer listed current 0.093 0.108 0.093 0.093 0.108 0.093 0.108 0.108 0.108 0.108 0.108 0.108
Actual measured current 0.098 0.105 0.099 0.097 0.116 0.098 0.109 0.109 0.106 0.114 0.110 0.108
Device 1
Device 2
Device 3
Device 5
Device 6
Device 7
Device 8
Device 9
Device 10
Device 12
Device 13
Device 14

32
Project Name Gentex (AFP-200 w/CBC - PL)DateCircuit Number 14-3 (Compare to Gentex 18-3)Notes Battery power with no standby time 18=7.77 16=4.89 14=3.07 12=1.98 10=1.24Nominal System Voltage 24 Actual = see notes When entering your measured value. Use the resistance measured for Minimum Device Voltage 21 one way on the circuit or 1/2 the total resistance out and backTotal Circuit Current 1.437 Wire Ohm's
Gauge Per 1000Distance from source to 1st device 40 14 3.07 Voltage VoltageWire Gauge for balance of circuit 14 3.07 Current Distance Drop Current Distance Drop
Distance Calculated 1.437 375 3.309 1.437 375 1.654Listed from Actual 1.534 435 4.097 1.534 435 2.049
Device Device previous At Drop from Percent Device Manufacture: GentexNumber Current device Device source Drop Current Distance Voltage Model Numbers:
Device 1 0.093 100 23.65 0.35 1.47% 0.100 100 24.62 GXSDevice 2 0.108 45 23.28 0.72 3.02% 0.107 45 24.22 GXS-90SDevice 3 0.093 10 23.20 0.80 3.33% 0.101 10 24.14 GXSDevice 4 0.108 15 23.09 0.91 3.77% 0.109 15 24.00 GX-90SDevice 5 0.093 30 22.90 1.10 4.57% 0.100 30 23.80 GXSDevice 6 0.108 25 22.76 1.24 5.17% 0.120 25 23.61 GX-90SDevice 7 0.093 50 22.50 1.50 6.24% 0.102 50 23.32 GXSDevice 8 0.108 20 22.41 1.59 6.62% 0.113 20 23.02 GX-90SDevice 9 0.108 35 22.28 1.72 7.18% 0.113 35 22.83 GX-90SDevice 10 0.108 10 22.24 1.76 7.32% 0.112 10 22.76 GX-90SDevice 11 0.093 40 22.14 1.86 7.74% 0.110 40 22.64 GXSDevice 12 0.108 30 22.08 1.92 7.99% 0.117 30 22.57 GX-90SDevice 13 0.108 5 22.08 1.92 8.02% 0.116 5 22.53 GX-90SDevice 14 0.108 20 22.06 1.94 8.07% 0.114 20 22.51 GX-90SEND 22.06 1.94 8.07%END 22.06 1.94 8.07%END 22.06 1.94 8.07%END 22.06 1.94 8.07%END 22.06 1.94 8.07%END 22.06 1.94 8.07%Totals 1.437 375 1.534 435
Notes: Start voltage 25.45 at 1.53A, 8 minutes into test 24.67 volts at 1.56A, end of test 24.35volts at 1.59A.
Actual Measurements
Alternate CalculationsLoad Centering Method
Totals
Voltage
POINT-POINT LIMITS MEET
TotalsLump-Sum Method
Standard Wire Resistance per 1000

33
Gentex 14/3a battery
20.50
21.00
21.50
22.00
22.50
23.00
23.50
24.00
24.50
25.00
Volta
ge
0.000
0.020
0.040
0.060
0.080
0.100
0.120
0.140
Cur
rent
in m
illia
mps
Calculated voltage 23.65 23.28 23.20 22.90 22.76 22.50 22.41 22.28 22.24 22.08 22.08 22.06
Actual measured voltage 24.62 24.22 24.14 23.80 23.61 23.32 23.02 22.83 22.76 22.57 22.53 22.51
Manufacturer listed current 0.093 0.108 0.093 0.093 0.108 0.093 0.108 0.108 0.108 0.108 0.108 0.108
Actual measured current 0.100 0.107 0.101 0.100 0.120 0.102 0.113 0.113 0.112 0.117 0.116 0.114
Device 1
Device 2
Device 3
Device 5
Device 6
Device 7
Device 8
Device 9
Device 10
Device 12
Device 13
Device 14

34
Project Name GentexDateCircuit Number 14-4Notes 110 Vac, solid tone, strobes not synched 18=7.77 16=4.89 14=3.07 12=1.98 10=1.24Nominal System Voltage 24 Actual = 25.53 When entering your measured value. Use the resistance measured for Minimum Device Voltage 21 one way on the circuit or 1/2 the total resistance out and backTotal Circuit Current 1.761 Wire Ohm'sActual measured current = 1.80 Gauge Per 1000Distance from source to 1st device 50 14 3.07 Voltage VoltageWire Gauge for balance of circuit 14 3.07 Current Distance Drop Current Distance Drop
Distance Calculated 1.761 450 4.866 1.761 450 2.433Listed from Actual 1.821 500 5.590 1.821 500 2.795
Device Device previous At Drop from Percent Device Manufacture: GentexNumber Current device Device source Drop Current Distance Voltage Model Numbers:
Device 1 0.093 100 23.46 0.54 2.25% 0.099 100 25.01 GXSDevice 2 0.108 45 23.00 1.00 4.17% 0.106 45 24.62 GXS-90SDevice 3 0.093 10 22.90 1.10 4.57% 0.099 10 24.57 GXSDevice 4 0.108 15 22.77 1.23 5.13% 0.108 15 24.44 GX-90SDevice 5 0.093 30 22.52 1.48 6.18% 0.098 30 24.24 GXSDevice 6 0.108 25 22.32 1.68 6.99% 0.107 25 24.12 GX-90SDevice 7 0.093 50 21.97 2.03 8.47% 0.098 50 23.85 GXSDevice 8 0.108 20 21.84 2.16 9.01% 0.110 20 23.72 GX-90SDevice 9 0.108 35 21.63 2.37 9.87% 0.107 35 23.56 GX-90SDevice 10 0.108 10 21.58 2.42 10.09% 0.107 10 23.52 GX-90SDevice 11 0.093 40 21.40 2.60 10.85% 0.099 40 23.37 GXSDevice 12 0.108 30 21.28 2.72 11.34% 0.110 30 23.28 GX-90SDevice 13 0.108 5 21.26 2.74 11.41% 0.113 5 23.18 GX-90SDevice 14 0.108 20 21.21 2.79 11.63% 0.111 20 23.17 GX-90SDevice 15 0.108 15 21.18 2.82 11.76% 0.117 15 23.09 GX-90SDevice 16 0.108 30 21.14 2.86 11.92% 0.115 30 23.05 GX-90SDevice 17 0.108 20 21.13 2.87 11.98% 0.117 20 23.04 GX-90SEND 21.13 2.87 11.98%END 21.13 2.87 11.98%END 21.13 2.87 11.98%Totals 1.761 450 1.821 500
POINT-POINT LIMITS MEET
TotalsLump-Sum Method
Standard Wire Resistance per 1000
Actual Measurements
Alternate CalculationsLoad Centering Method
Totals
Voltage

35
Gentex 14-4 using nominal voltage
19.00
20.00
21.00
22.00
23.00
24.00
25.00
26.00
Volta
ge
0.000
0.020
0.040
0.060
0.080
0.100
0.120
0.140
Cur
rent
in A
mps
Calculated voltage 23.46 23.00 22.77 22.52 21.97 21.84 21.58 21.40 21.28 21.21 21.18 21.13
Actual measured voltage 25.01 24.62 24.44 24.24 23.85 23.72 23.52 23.37 23.28 23.17 23.09 23.04
Manufacturer listed current 0.093 0.108 0.108 0.093 0.093 0.108 0.108 0.093 0.108 0.108 0.108 0.108
Actual measured current 0.099 0.106 0.108 0.098 0.098 0.110 0.107 0.099 0.110 0.111 0.117 0.117
Device 1
Device 2
Device 4
Device 5
Device 7
Device 8
Device 10
Device 11
Device 12
Device 14
Device 15
Device 17

36
Project Name GentexDateCircuit Number 14-4 using actual voltageNotes 110 Vac, solid tone, strobes not synched 18=7.77 16=4.89 14=3.07 12=1.98 10=1.24Actual System Voltage 25.53 When entering your measured value. Use the resistance measured for Minimum Device Voltage 21 one way on the circuit or 1/2 the total resistance out and backTotal Circuit Current 1.761 Wire Ohm'sActual measured current = 1.80 Gauge Per 1000Distance from source to 1st device 50 14 3.07 Voltage VoltageWire Gauge for balance of circuit 14 3.07 Current Distance Drop Current Distance Drop
Distance Calculated 1.761 450 4.866 1.761 450 2.433Listed from Actual 1.821 500 5.590 1.821 500 2.795
Device Device previous At Drop from Percent Device Manufacture: GentexNumber Current device Device source Drop Current Distance Voltage Model Numbers:
Device 1 0.093 100 24.99 0.54 2.12% 0.099 100 25.01 GXSDevice 2 0.108 45 24.53 1.00 3.92% 0.106 45 24.62 GXS-90SDevice 3 0.093 10 24.43 1.10 4.30% 0.099 10 24.57 GXSDevice 4 0.108 15 24.30 1.23 4.83% 0.108 15 24.44 GX-90SDevice 5 0.093 30 24.05 1.48 5.81% 0.098 30 24.24 GXSDevice 6 0.108 25 23.85 1.68 6.57% 0.107 25 24.12 GX-90SDevice 7 0.093 50 23.50 2.03 7.96% 0.098 50 23.85 GXSDevice 8 0.108 20 23.37 2.16 8.47% 0.110 20 23.72 GX-90SDevice 9 0.108 35 23.16 2.37 9.28% 0.107 35 23.56 GX-90SDevice 10 0.108 10 23.11 2.42 9.48% 0.107 10 23.52 GX-90SDevice 11 0.093 40 22.93 2.60 10.20% 0.099 40 23.37 GXSDevice 12 0.108 30 22.81 2.72 10.66% 0.110 30 23.28 GX-90SDevice 13 0.108 5 22.79 2.74 10.73% 0.113 5 23.18 GX-90SDevice 14 0.108 20 22.74 2.79 10.94% 0.111 20 23.17 GX-90SDevice 15 0.108 15 22.71 2.82 11.05% 0.117 15 23.09 GX-90SDevice 16 0.108 30 22.67 2.86 11.21% 0.115 30 23.05 GX-90SDevice 17 0.108 20 22.66 2.87 11.26% 0.117 20 23.04 GX-90SEND 22.66 2.87 11.26%END 22.66 2.87 11.26%END 22.66 2.87 11.26%Totals 1.761 450 1.821 500Actual voltage has up to a 2% variation.
Load Centering MethodTotals
Voltage
Actual V drop of 2.49 / lump sum V drop of 5.59 = +55% variation: Actual V drop of 2.49 / load centering V drop of 2.79 = +11% variation: using actual currents.
POINT-POINT LIMITS MEET
TotalsLump-Sum Method
Standard Wire Resistance per 1000
Actual Measurements
Alternate Calculations

37
Gentex 14-4 using actual voltage (2% variation)
21.00
21.50
22.00
22.50
23.00
23.50
24.00
24.50
25.00
25.50
Volta
ge
0.000
0.020
0.040
0.060
0.080
0.100
0.120
0.140
Cur
rent
in A
mps
Calc. voltage 24.99 24.53 24.43 24.05 23.85 23.50 23.37 23.11 22.93 22.81 22.79 22.74 22.67 22.66
Actual voltage 25.01 24.62 24.57 24.24 24.12 23.85 23.72 23.52 23.37 23.28 23.18 23.17 23.05 23.04
Listed current 0.093 0.108 0.093 0.093 0.108 0.093 0.108 0.108 0.093 0.108 0.108 0.108 0.108 0.108
Actual current 0.099 0.106 0.099 0.098 0.107 0.098 0.110 0.107 0.099 0.110 0.113 0.111 0.115 0.117
Device 1
Device 2
Device 3
Device 5
Device 6
Device 7
Device 8
Device 10
Device 11
Device 12
Device 13
Device 14
Device 16
Device 17

38
Project Name GentexDateCircuit Number 14-5 (compare to 14-4)Notes Battery power, with no standby time 18=7.77 16=4.89 14=3.07 12=1.98 10=1.24Nominal System Voltage 24 Actual = see notes When entering your measured value. Use the resistance measured for Minimum Device Voltage 21 one way on the circuit or 1/2 the total resistance out and backTotal Circuit Current 1.761 Wire Ohm's
Gauge Per 1000Distance from source to 1st device 50 14 3.07 Voltage VoltageWire Gauge for balance of circuit 14 3.07 Current Distance Drop Current Distance Drop
Distance Calculated 1.761 450 4.866 1.761 450 2.433Listed from Actual 1.943 500 5.965 1.943 500 2.983
Device Device previous At Drop from Percent Device Manufacture: GentexNumber Current device Device source Drop Current Distance Voltage Model Numbers:
Device 1 0.093 100 23.46 0.54 2.25% 0.101 100 23.81 GXSDevice 2 0.108 45 23.00 1.00 4.17% 0.110 45 23.45 GXS-90SDevice 3 0.093 10 22.90 1.10 4.57% 0.104 10 23.38 GXSDevice 4 0.108 15 22.77 1.23 5.13% 0.111 15 23.24 GX-90SDevice 5 0.093 30 22.52 1.48 6.18% 0.103 30 23.01 GXSDevice 6 0.108 25 22.32 1.68 6.99% 0.121 25 22.80 GX-90SDevice 7 0.093 50 21.97 2.03 8.47% 0.106 50 22.49 GXSDevice 8 0.108 20 21.84 2.16 9.01% 0.115 20 22.34 GX-90SDevice 9 0.108 35 21.63 2.37 9.87% 0.114 35 22.16 GX-90SDevice 10 0.108 10 21.58 2.42 10.09% 0.115 10 22.09 GX-90SDevice 11 0.093 40 21.40 2.60 10.85% 0.113 40 21.88 GXSDevice 12 0.108 30 21.28 2.72 11.34% 0.122 30 21.77 GX-90SDevice 13 0.108 5 21.26 2.74 11.41% 0.119 5 21.73 GX-90SDevice 14 0.108 20 21.21 2.79 11.63% 0.118 20 21.33 GX-90SDevice 15 0.108 15 21.18 2.82 11.76% 0.125 15 21.30 GX-90SDevice 16 0.108 30 21.14 2.86 11.92% 0.123 30 21.24 GX-90SDevice 17 0.108 20 21.13 2.87 11.98% 0.123 20 21.19 GX-90SEND 21.13 2.87 11.98%END 21.13 2.87 11.98%END 21.13 2.87 11.98%Totals 1.761 450 1.943 500
Notes: Start voltage 24.22 at 1.89A, Mid (13 min) 24.17 volts at 1.803A, end (26 min) 24.10 volts at 1.91A.
POINT-POINT LIMITS MEET
TotalsLump-Sum Method
Standard Wire Resistance per 1000
Actual Measurements
Alternate CalculationsLoad Centering Method
Totals
Voltage

39
Gentex 14-5 battery, using nominal voltage
19.50
20.00
20.50
21.00
21.50
22.00
22.50
23.00
23.50
24.00
24.50
Volta
ge
0.000
0.020
0.040
0.060
0.080
0.100
0.120
0.140
Cur
rent
in A
mps
Calculated voltage 23.46 23.00 22.77 22.52 21.97 21.84 21.58 21.40 21.28 21.21 21.18 21.13
Actual measured voltage 23.81 23.45 23.24 23.01 22.49 22.34 22.09 21.88 21.77 21.33 21.30 21.19
Manufacturer listed current 0.093 0.108 0.108 0.093 0.093 0.108 0.108 0.093 0.108 0.108 0.108 0.108
Actual measured current 0.101 0.110 0.111 0.103 0.106 0.115 0.115 0.113 0.122 0.118 0.125 0.123
Device 1
Device 2
Device 4
Device 5
Device 7
Device 8
Device 10
Device 11
Device 12
Device 14
Device 15
Device 17

40
Project Name GentexDateCircuit Number 14-5 (compare to 14-4) Actual voltageNotes Battery power, with no standby time 18=7.77 16=4.89 14=3.07 12=1.98 10=1.24Actual System Voltage 24.22 Actual = see notes When entering your measured value. Use the resistance measured for Minimum Device Voltage 21 one way on the circuit or 1/2 the total resistance out and backTotal Circuit Current 1.761 Wire Ohm's
Gauge Per 1000Distance from source to 1st device 50 14 3.07 Voltage VoltageWire Gauge for balance of circuit 14 3.07 Current Distance Drop Current Distance Drop
Distance Calculated 1.761 450 4.866 1.761 450 2.433Listed from Actual 1.943 500 5.965 1.943 500 2.983
Device Device previous At Drop from Percent Device Manufacture: GentexNumber Current device Device source Drop Current Distance Voltage Model Numbers:
Device 1 0.093 100 23.68 0.54 2.23% 0.101 100 23.81 GXSDevice 2 0.108 45 23.22 1.00 4.13% 0.110 45 23.45 GXS-90SDevice 3 0.093 10 23.12 1.10 4.53% 0.104 10 23.38 GXSDevice 4 0.108 15 22.99 1.23 5.09% 0.111 15 23.24 GX-90SDevice 5 0.093 30 22.74 1.48 6.12% 0.103 30 23.01 GXSDevice 6 0.108 25 22.54 1.68 6.92% 0.121 25 22.80 GX-90SDevice 7 0.093 50 22.19 2.03 8.39% 0.106 50 22.49 GXSDevice 8 0.108 20 22.06 2.16 8.93% 0.115 20 22.34 GX-90SDevice 9 0.108 35 21.85 2.37 9.78% 0.114 35 22.16 GX-90SDevice 10 0.108 10 21.80 2.42 10.00% 0.115 10 22.09 GX-90SDevice 11 0.093 40 21.62 2.60 10.75% 0.113 40 21.88 GXSDevice 12 0.108 30 21.50 2.72 11.24% 0.122 30 21.77 GX-90SDevice 13 0.108 5 21.48 2.74 11.31% 0.119 5 21.73 GX-90SDevice 14 0.108 20 21.43 2.79 11.53% 0.118 20 21.33 GX-90SDevice 15 0.108 15 21.40 2.82 11.65% 0.125 15 21.30 GX-90SDevice 16 0.108 30 21.36 2.86 11.82% 0.123 30 21.24 GX-90SDevice 17 0.108 20 21.35 2.87 11.87% 0.123 20 21.19 GX-90SEND 21.35 2.87 11.87%END 21.35 2.87 11.87%END 21.35 2.87 11.87%Totals 1.761 450 1.943 500Actual voltage maintained a 1% variation until device 14 about 20 minutes into test. Since the change occurred so late into test, results are considered as passed.Notes: Start voltage 24.22 at 1.89A, Mid (13 min) 24.17 volts at 1.803A, end (26 min) 24.10 volts at 1.91A.
Actual V drop of 3.03 / lump sum V drop of 5.96 = +49% variation: Actual V drop of 3.03 / load centering V drop of 2.98 = +2% variation: using actual currents.
Actual Measurements
Alternate CalculationsLoad Centering Method
Totals
Voltage
POINT-POINT LIMITS MEET
TotalsLump-Sum Method
Standard Wire Resistance per 1000

41
Gentex 14-5 battery using actual voltage (1% variation)
19.50
20.00
20.50
21.00
21.50
22.00
22.50
23.00
23.50
24.00
24.50
Volta
ge
0.000
0.020
0.040
0.060
0.080
0.100
0.120
0.140
Cur
rent
in A
mps
Calc. voltage 23.68 23.22 23.12 22.74 22.54 22.19 22.06 21.80 21.62 21.50 21.48 21.43 21.36 21.35
Actual voltage 23.81 23.45 23.38 23.01 22.80 22.49 22.34 22.09 21.88 21.77 21.73 21.33 21.24 21.19
Listed current 0.093 0.108 0.093 0.093 0.108 0.093 0.108 0.108 0.093 0.108 0.108 0.108 0.108 0.108
Actual current 0.101 0.110 0.104 0.103 0.121 0.106 0.115 0.115 0.113 0.122 0.119 0.118 0.123 0.123
Device 1
Device 2
Device 3
Device 5
Device 6
Device 7
Device 8
Device 10
Device 11
Device 12
Device 13
Device 14
Device 16
Device 17

42
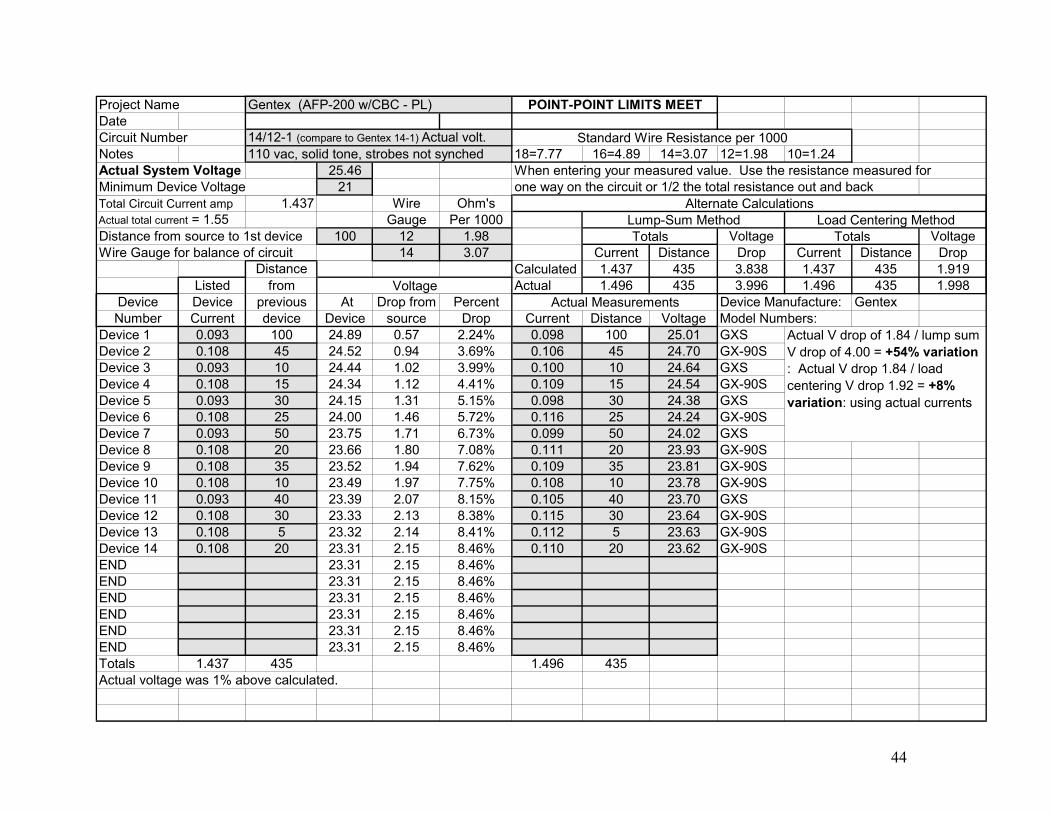
Project Name Gentex (AFP-200 w/CBC - PL)DateCircuit Number 14/12-1 (compare to Gentex 14-1)Notes 110 vac, solid tone, strobes not synched 18=7.77 16=4.89 14=3.07 12=1.98 10=1.24Nominal System Voltage 24 Actual = 25.46 When entering your measured value. Use the resistance measured for Minimum Device Voltage 21 one way on the circuit or 1/2 the total resistance out and backTotal Circuit Current amp 1.437 Wire Ohm'sActual total current = 1.55 Gauge Per 1000Distance from source to 1st device 100 12 1.98 Voltage VoltageWire Gauge for balance of circuit 14 3.07 Current Distance Drop Current Distance Drop
Distance Calculated 1.437 435 3.838 1.437 435 1.919Listed from Actual 1.496 435 3.996 1.496 435 1.998
Device Device previous At Drop from Percent Device Manufacture: GentexNumber Current device Device source Drop Current Distance Voltage Model Numbers:
Device 1 0.093 100 23.43 0.57 2.37% 0.098 100 25.01 GXSDevice 2 0.108 45 23.06 0.94 3.92% 0.106 45 24.70 GX-90SDevice 3 0.093 10 22.98 1.02 4.23% 0.100 10 24.64 GXSDevice 4 0.108 15 22.88 1.12 4.67% 0.109 15 24.54 GX-90SDevice 5 0.093 30 22.69 1.31 5.47% 0.098 30 24.38 GXSDevice 6 0.108 25 22.54 1.46 6.07% 0.116 25 24.24 GX-90SDevice 7 0.093 50 22.29 1.71 7.14% 0.099 50 24.02 GXSDevice 8 0.108 20 22.20 1.80 7.52% 0.111 20 23.93 GX-90SDevice 9 0.108 35 22.06 1.94 8.08% 0.109 35 23.81 GX-90SDevice 10 0.108 10 22.03 1.97 8.22% 0.108 10 23.78 GX-90SDevice 11 0.093 40 21.93 2.07 8.64% 0.105 40 23.70 GXSDevice 12 0.108 30 21.87 2.13 8.89% 0.115 30 23.64 GX-90SDevice 13 0.108 5 21.86 2.14 8.92% 0.112 5 23.63 GX-90SDevice 14 0.108 20 21.85 2.15 8.98% 0.110 20 23.62 GX-90SEND 21.85 2.15 8.98%END 21.85 2.15 8.98%END 21.85 2.15 8.98%END 21.85 2.15 8.98%END 21.85 2.15 8.98%END 21.85 2.15 8.98%Totals 1.437 435 1.496 435
POINT-POINT LIMITS MEET
TotalsLump-Sum Method
Standard Wire Resistance per 1000
Actual Measurements
Alternate CalculationsLoad Centering Method
Totals
Voltage
43
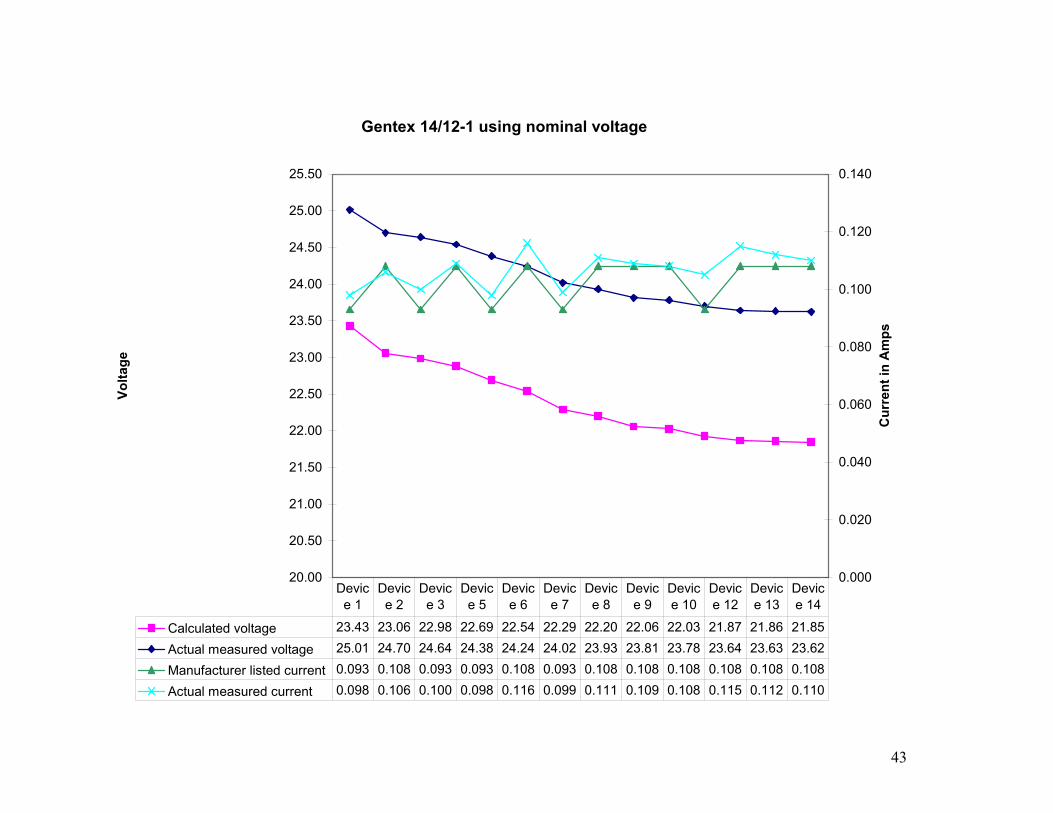
Gentex 14/12-1 using nominal voltage
20.00
20.50
21.00
21.50
22.00
22.50
23.00
23.50
24.00
24.50
25.00
25.50
Volta
ge
0.000
0.020
0.040
0.060
0.080
0.100
0.120
0.140
Cur
rent
in A
mps
Calculated voltage 23.43 23.06 22.98 22.69 22.54 22.29 22.20 22.06 22.03 21.87 21.86 21.85
Actual measured voltage 25.01 24.70 24.64 24.38 24.24 24.02 23.93 23.81 23.78 23.64 23.63 23.62
Manufacturer listed current 0.093 0.108 0.093 0.093 0.108 0.093 0.108 0.108 0.108 0.108 0.108 0.108
Actual measured current 0.098 0.106 0.100 0.098 0.116 0.099 0.111 0.109 0.108 0.115 0.112 0.110
Device 1
Device 2
Device 3
Device 5
Device 6
Device 7
Device 8
Device 9
Device 10
Device 12
Device 13
Device 14
44
Project Name Gentex (AFP-200 w/CBC - PL)DateCircuit Number 14/12-1 (compare to Gentex 14-1) Actual volt.Notes 110 vac, solid tone, strobes not synched 18=7.77 16=4.89 14=3.07 12=1.98 10=1.24Actual System Voltage 25.46 When entering your measured value. Use the resistance measured for Minimum Device Voltage 21 one way on the circuit or 1/2 the total resistance out and backTotal Circuit Current amp 1.437 Wire Ohm'sActual total current = 1.55 Gauge Per 1000Distance from source to 1st device 100 12 1.98 Voltage VoltageWire Gauge for balance of circuit 14 3.07 Current Distance Drop Current Distance Drop
Distance Calculated 1.437 435 3.838 1.437 435 1.919Listed from Actual 1.496 435 3.996 1.496 435 1.998
Device Device previous At Drop from Percent Device Manufacture: GentexNumber Current device Device source Drop Current Distance Voltage Model Numbers:
Device 1 0.093 100 24.89 0.57 2.24% 0.098 100 25.01 GXSDevice 2 0.108 45 24.52 0.94 3.69% 0.106 45 24.70 GX-90SDevice 3 0.093 10 24.44 1.02 3.99% 0.100 10 24.64 GXSDevice 4 0.108 15 24.34 1.12 4.41% 0.109 15 24.54 GX-90SDevice 5 0.093 30 24.15 1.31 5.15% 0.098 30 24.38 GXSDevice 6 0.108 25 24.00 1.46 5.72% 0.116 25 24.24 GX-90SDevice 7 0.093 50 23.75 1.71 6.73% 0.099 50 24.02 GXSDevice 8 0.108 20 23.66 1.80 7.08% 0.111 20 23.93 GX-90SDevice 9 0.108 35 23.52 1.94 7.62% 0.109 35 23.81 GX-90SDevice 10 0.108 10 23.49 1.97 7.75% 0.108 10 23.78 GX-90SDevice 11 0.093 40 23.39 2.07 8.15% 0.105 40 23.70 GXSDevice 12 0.108 30 23.33 2.13 8.38% 0.115 30 23.64 GX-90SDevice 13 0.108 5 23.32 2.14 8.41% 0.112 5 23.63 GX-90SDevice 14 0.108 20 23.31 2.15 8.46% 0.110 20 23.62 GX-90SEND 23.31 2.15 8.46%END 23.31 2.15 8.46%END 23.31 2.15 8.46%END 23.31 2.15 8.46%END 23.31 2.15 8.46%END 23.31 2.15 8.46%Totals 1.437 435 1.496 435Actual voltage was 1% above calculated.
Actual V drop of 1.84 / lump sum V drop of 4.00 = +54% variation : Actual V drop 1.84 / load centering V drop 1.92 = +8% variation: using actual currents
Actual Measurements
Alternate CalculationsLoad Centering Method
Totals
Voltage
POINT-POINT LIMITS MEET
TotalsLump-Sum Method
Standard Wire Resistance per 1000

45
Gentex 14/12-1 using actual voltage (1% variation)
22.00
22.50
23.00
23.50
24.00
24.50
25.00
25.50
Volta
ge
0.000
0.020
0.040
0.060
0.080
0.100
0.120
0.140
Cur
rent
in A
mps
Calc. voltage 24.89 24.52 24.44 24.34 24.15 24.00 23.75 23.66 23.52 23.49 23.39 23.33 23.32 23.31
Actual voltage 25.01 24.70 24.64 24.54 24.38 24.24 24.02 23.93 23.81 23.78 23.70 23.64 23.63 23.62
Listed current 0.093 0.108 0.093 0.108 0.093 0.108 0.093 0.108 0.108 0.108 0.093 0.108 0.108 0.108
Actual current 0.098 0.106 0.100 0.109 0.098 0.116 0.099 0.111 0.109 0.108 0.105 0.115 0.112 0.110
Device 1
Device 2
Device 3
Device 4
Device 5
Device 6
Device 7
Device 8
Device 9
Device 10
Device 11
Device 12
Device 13
Device 14

46
Project Name Gentex (AFP-200 w/CBC - PL)DateCircuit Number 14/12-2 (added devices to 14/12-1)Notes 110 vac, solid tone, strobes not synched 18=7.77 16=4.89 14=3.07 12=1.98 10=1.24Nominal System Voltage 24 Actual = 25.58 When entering your measured value. Use the resistance measured for Minimum Device Voltage 21 one way on the circuit or 1/2 the total resistance out and backTotal Circuit Current amp 1.653 Wire Ohm'sActual total current = 1.802 Gauge Per 1000Distance from source to 1st device 100 12 1.98 Voltage VoltageWire Gauge for balance of circuit 14 3.07 Current Distance Drop Current Distance Drop
Distance Calculated 1.653 480 4.872 1.653 480 2.436Listed from Actual 1.740 480 5.128 1.740 480 2.564
Device Device previous At Drop from Percent Device Manufacture: GentexNumber Current device Device source Drop Current Distance Voltage Model Numbers:
Device 1 0.093 100 23.35 0.65 2.73% 0.099 100 24.95 GXSDevice 2 0.108 45 22.91 1.09 4.52% 0.106 45 24.55 GX-90SDevice 3 0.093 10 22.83 1.17 4.89% 0.100 10 24.47 GXSDevice 4 0.108 15 22.70 1.30 5.42% 0.108 15 24.34 GX-90SDevice 5 0.093 30 22.47 1.53 6.38% 0.098 30 24.14 GXSDevice 6 0.108 25 22.29 1.71 7.12% 0.118 25 23.95 GX-90SDevice 7 0.093 50 21.97 2.03 8.46% 0.100 50 23.66 GXSDevice 8 0.108 20 21.85 2.15 8.95% 0.111 20 23.56 GX-90SDevice 9 0.108 35 21.67 2.33 9.71% 0.111 35 23.40 GX-90SDevice 10 0.108 10 21.62 2.38 9.90% 0.110 10 23.36 GX-90SDevice 11 0.093 40 21.47 2.53 10.55% 0.107 40 23.22 GXSDevice 12 0.108 30 21.37 2.63 10.96% 0.117 30 23.11 GX-90SDevice 13 0.108 5 21.36 2.64 11.02% 0.114 5 23.10 GX-90SDevice 14 0.108 20 21.32 2.68 11.18% 0.111 20 23.05 GX-90SDevice 15 0.108 30 21.28 2.72 11.35% 0.116 30 23.02 GX-90SDevice 16 0.108 15 21.27 2.73 11.39% 0.114 15 23.01 GX-90SEND 21.27 2.73 11.39% END 21.27 2.73 11.39%END 21.27 2.73 11.39%END 21.27 2.73 11.39%Totals 1.653 480 1.740 480
POINT-POINT LIMITS MEET
TotalsLump-Sum Method
Standard Wire Resistance per 1000
Actual Measurements
Alternate CalculationsLoad Centering Method
Totals
Voltage

47
Gentex 14/12-2 using nominal voltage
19.00
20.00
21.00
22.00
23.00
24.00
25.00
26.00
Volta
ge
0.000
0.020
0.040
0.060
0.080
0.100
0.120
0.140
Cur
rent
in A
mps
Calculated voltage at device 23.35 22.91 22.70 22.47 22.29 21.85 21.67 21.62 21.37 21.36 21.32 21.27
Actual measured voltage 24.95 24.55 24.34 24.14 23.95 23.56 23.40 23.36 23.11 23.10 23.05 23.01
Manufacturer listed current 0.093 0.108 0.108 0.093 0.108 0.108 0.108 0.108 0.108 0.108 0.108 0.108
Actual measured current 0.099 0.106 0.108 0.098 0.118 0.111 0.111 0.110 0.117 0.114 0.111 0.114
Device 1
Device 2
Device 4
Device 5
Device 6
Device 8
Device 9
Device 10
Device 12
Device 13
Device 14
Device 16

48
Project Name Gentex (AFP-200 w/CBC - PL)DateCircuit Number 14/12-2 (added devices to 14/12-1) Actual volt.Notes 110 vac, solid tone, strobes not synched 18=7.77 16=4.89 14=3.07 12=1.98 10=1.24Actual System Voltage 25.58 When entering your measured value. Use the resistance measured for Minimum Device Voltage 21 one way on the circuit or 1/2 the total resistance out and backTotal Circuit Current amp 1.653 Wire Ohm'sActual total current = 1.802 Gauge Per 1000Distance from source to 1st device 100 12 1.98 Voltage VoltageWire Gauge for balance of circuit 14 3.07 Current Distance Drop Current Distance Drop
Distance Calculated 1.653 480 4.872 1.653 480 2.436Listed from Actual 1.740 480 5.128 1.740 480 2.564
Device Device previous At Drop from Percent Device Manufacture: GentexNumber Current device Device source Drop Current Distance Voltage Model Numbers:
Device 1 0.093 100 24.93 0.65 2.56% 0.099 100 24.95 GXSDevice 2 0.108 45 24.49 1.09 4.24% 0.106 45 24.55 GX-90SDevice 3 0.093 10 24.41 1.17 4.59% 0.100 10 24.47 GXSDevice 4 0.108 15 24.28 1.30 5.08% 0.108 15 24.34 GX-90SDevice 5 0.093 30 24.05 1.53 5.98% 0.098 30 24.14 GXSDevice 6 0.108 25 23.87 1.71 6.68% 0.118 25 23.95 GX-90SDevice 7 0.093 50 23.55 2.03 7.94% 0.100 50 23.66 GXSDevice 8 0.108 20 23.43 2.15 8.40% 0.111 20 23.56 GX-90SDevice 9 0.108 35 23.25 2.33 9.11% 0.111 35 23.40 GX-90SDevice 10 0.108 10 23.20 2.38 9.29% 0.110 10 23.36 GX-90SDevice 11 0.093 40 23.05 2.53 9.90% 0.107 40 23.22 GXSDevice 12 0.108 30 22.95 2.63 10.28% 0.117 30 23.11 GX-90SDevice 13 0.108 5 22.94 2.64 10.34% 0.114 5 23.10 GX-90SDevice 14 0.108 20 22.90 2.68 10.49% 0.111 20 23.05 GX-90SDevice 15 0.108 30 22.86 2.72 10.65% 0.116 30 23.02 GX-90SDevice 16 0.108 15 22.85 2.73 10.69% 0.114 15 23.01 GX-90SEND 22.85 2.73 10.69% END 22.85 2.73 10.69%END 22.85 2.73 10.69%END 22.85 2.73 10.69%Totals 1.653 480 1.740 480Actual voltage was 1% above calculated voltage.
Load Centering MethodTotals
Voltage
Actual V drop of 2.57 / lump sum V drop of 5.13 = +50% variation: Actual V drop of 2.57 / load centering V drop of 2.56 = --0% variation: using actual currents.
POINT-POINT LIMITS MEET
TotalsLump-Sum Method
Standard Wire Resistance per 1000
Actual Measurements
Alternate Calculations

49
Gentex 14/12-2 using actual voltage (up to 1% variation)
21.50
22.00
22.50
23.00
23.50
24.00
24.50
25.00
25.50
Volta
ge
0.000
0.020
0.040
0.060
0.080
0.100
0.120
0.140
Cur
rent
in A
mps
Calc. voltage 24.93 24.49 24.41 24.28 23.87 23.55 23.43 23.25 23.20 23.05 22.95 22.90 22.86 22.85
Actual voltage 24.95 24.55 24.47 24.34 23.95 23.66 23.56 23.40 23.36 23.22 23.11 23.05 23.02 23.01
Listed current 0.093 0.108 0.093 0.108 0.108 0.093 0.108 0.108 0.108 0.093 0.108 0.108 0.108 0.108
Actual current 0.099 0.106 0.100 0.108 0.118 0.100 0.111 0.111 0.110 0.107 0.117 0.111 0.116 0.114
Device 1
Device 2
Device 3
Device 4
Device 6
Device 7
Device 8
Device 9
Device 10
Device 11
Device 12
Device 14
Device 15
Device 16

50
Project Name Simplex (Power supply = DateCircuit Number 14-1 Notes 110 vac, solid tone, strobes not synched 18=7.77 16=4.89 14=3.07 12=1.98 10=1.24Nominal System Voltage 24 Actual = 27.7 When entering your measured value. Use the resistance measured for Minimum Device Voltage 22 one way on the circuit or 1/2 the total resistance out and backTotal Circuit Current 1.323 Wire Ohm'sTotal actual current = 1.160 Gauge Per 1000Distance from source to 1st device 100 14 3.07 Voltage VoltageWire Gauge for balance of circuit 14 3.07 Current Distance Drop Current Distance Drop
Distance Calculated 1.323 340 2.762 1.323 340 1.381Listed from Actual 1.176 340 2.455 1.176 340 1.228
Device Device previous At Drop from Percent Device Manufacture: SimplexNumber Current device Device source Drop Current Distance Voltage Model Numbers:
Device 1 0.063 100 23.19 0.81 3.38% 0.062 100 27.34 4903-9425Device 2 0.150 45 22.84 1.16 4.84% 0.117 45 27.05 4903-9426Device 3 0.207 10 22.77 1.23 5.12% 0.186 10 26.94 4903-9427Device 4 0.063 15 22.69 1.31 5.47% 0.062 15 26.91 4903-9425Device 5 0.150 30 22.53 1.47 6.11% 0.134 30 26.85 4903-9426Device 6 0.207 25 22.43 1.57 6.55% 0.167 25 26.64 4903-9427Device 7 0.063 50 22.28 1.72 7.17% 0.061 50 26.67 4903-9425Device 8 0.150 20 22.23 1.77 7.38% 0.136 20 26.54 4903-9426Device 9 0.207 35 22.17 1.83 7.63% 0.187 35 26.50 4903-9427Device 10 0.063 10 22.17 1.83 7.64% 0.064 10 26.49 4903-9425END 22.17 1.83 7.64%END 22.17 1.83 7.64%END 22.17 1.83 7.64%END 22.17 1.83 7.64%END 22.17 1.83 7.64%END 22.17 1.83 7.64%END 22.17 1.83 7.64%END 22.17 1.83 7.64%END 22.17 1.83 7.64%END 22.17 1.83 7.64%Totals 1.323 340 1.176 340
POINT-POINT LIMITS MEET
TotalsLump-Sum Method
Standard Wire Resistance per 1000
Actual Measurements
Alternate CalculationsLoad Centering Method
Totals
Voltage

51
Simplex 14/1, using nominal voltage (look closely at scales)
0.00
5.00
10.00
15.00
20.00
25.00
30.00
Volta
ge
0.000
0.050
0.100
0.150
0.200
0.250
Cur
rent
in A
mps
Calculated voltage at device 23.19 22.84 22.77 22.69 22.53 22.43 22.28 22.23 22.17 22.17
Actual measured voltage 27.34 27.05 26.94 26.91 26.85 26.64 26.67 26.54 26.50 26.49
Manufacturer listed current 0.063 0.150 0.207 0.063 0.150 0.207 0.063 0.150 0.207 0.063
Actual measured current 0.062 0.117 0.186 0.062 0.134 0.167 0.061 0.136 0.187 0.064
Device 1
Device 2
Device 3
Device 4
Device 5
Device 6
Device 7
Device 8
Device 9
Device 10

52
Project Name Simplex (Power supply = DateCircuit Number 14-1 Using actual voltageNotes 110 vac, solid tone, strobes not synched 18=7.77 16=4.89 14=3.07 12=1.98 10=1.24Actual System Voltage 27.7 When entering your measured value. Use the resistance measured for Minimum Device Voltage 22 one way on the circuit or 1/2 the total resistance out and backTotal Circuit Current 1.323 Wire Ohm'sTotal actual current = 1.160 Gauge Per 1000Distance from source to 1st device 100 14 3.07 Voltage VoltageWire Gauge for balance of circuit 14 3.07 Current Distance Drop Current Distance Drop
Distance Calculated 1.323 340 2.762 1.323 340 1.381Listed from Actual 1.176 340 2.455 1.176 340 1.228
Device Device previous At Drop from Percent Device Manufacture: SimplexNumber Current device Device source Drop Current Distance Voltage Model Numbers:
Device 1 0.063 100 26.89 0.81 2.93% 0.062 100 27.34 4903-9425Device 2 0.150 45 26.54 1.16 4.19% 0.117 45 27.05 4903-9426Device 3 0.207 10 26.47 1.23 4.44% 0.186 10 26.94 4903-9427Device 4 0.063 15 26.39 1.31 4.74% 0.062 15 26.91 4903-9425Device 5 0.150 30 26.23 1.47 5.29% 0.134 30 26.85 4903-9426Device 6 0.207 25 26.13 1.57 5.68% 0.167 25 26.64 4903-9427Device 7 0.063 50 25.98 1.72 6.21% 0.061 50 26.67 4903-9425Device 8 0.150 20 25.93 1.77 6.40% 0.136 20 26.54 4903-9426Device 9 0.207 35 25.87 1.83 6.61% 0.187 35 26.50 4903-9427Device 10 0.063 10 25.87 1.83 6.62% 0.064 10 26.49 4903-9425END 25.87 1.83 6.62%END 25.87 1.83 6.62%END 25.87 1.83 6.62%END 25.87 1.83 6.62%END 25.87 1.83 6.62%END 25.87 1.83 6.62%END 25.87 1.83 6.62%END 25.87 1.83 6.62%END 25.87 1.83 6.62%END 25.87 1.83 6.62%Totals 1.323 340 1.176 340Actual voltage was 2% above calculated.
Actual V drop of 1.21 / lump sum V drop of 2.46 = +51% variation: Actual V drop of 1.21 / load centering V drop of 1.23 = +2% variation: using actual currents.
Actual Measurements
Alternate CalculationsLoad Centering Method
Totals
Voltage
POINT-POINT LIMITS MEET
TotalsLump-Sum Method
Standard Wire Resistance per 1000

53
Simplex 14-1 using actual voltage (2 %variation) (look closely at scales)
25.00
25.50
26.00
26.50
27.00
27.50
Volta
ge
0.000
0.050
0.100
0.150
0.200
0.250
Cur
rent
in A
mps
Calc. voltage 26.89 26.54 26.47 26.39 26.23 26.13 25.98 25.93 25.87 25.87
Actual voltage 27.34 27.05 26.94 26.91 26.85 26.64 26.67 26.54 26.50 26.49
Listed current 0.063 0.150 0.207 0.063 0.150 0.207 0.063 0.150 0.207 0.063
Actual current 0.062 0.117 0.186 0.062 0.134 0.167 0.061 0.136 0.187 0.064
Device 1 Device 2 Device 3 Device 4 Device 5 Device 6 Device 7 Device 8 Device 9 Device 10

54
Project Name Simplex (Power supply = DateCircuit Number 14-3Notes battery, not synched 18=7.77 16=4.89 14=3.07 12=1.98 10=1.24Nominal System Voltage 24 Actual = see notes When entering your measured value. Use the resistance measured for Minimum Device Voltage 22 one way on the circuit or 1/2 the total resistance out and backTotal Circuit Current 1.323 Wire Ohm'sActual total current = see notes Gauge Per 1000Distance from source to 1st device 100 14 3.07 Voltage VoltageWire Gauge for balance of circuit 14 3.07 Current Distance Drop Current Distance Drop
Distance Calculated 1.323 340 2.762 1.323 340 1.381Listed from Actual 1.294 340 2.701 1.294 340 1.351
Device Device previous At Drop from Percent Device Manufacture: SimplexNumber Current device Device source Drop Current Distance Voltage Model Numbers:
Device 1 0.063 100 23.19 0.81 3.38% 0.064 100 23.83 4903-9425Device 2 0.150 45 22.84 1.16 4.84% 0.145 45 23.80 4903-9426Device 3 0.207 10 22.77 1.23 5.12% 0.205 10 23.79 4903-9427Device 4 0.063 15 22.69 1.31 5.47% 0.065 15 23.74 4903-9425Device 5 0.150 30 22.53 1.47 6.11% 0.142 30 23.50 4903-9426Device 6 0.207 25 22.43 1.57 6.55% 0.179 25 23.45 4903-9427Device 7 0.063 50 22.28 1.72 7.17% 0.064 50 23.42 4903-9425Device 8 0.150 20 22.23 1.77 7.38% 0.146 20 23.30 4903-9426Device 9 0.207 35 22.17 1.83 7.63% 0.217 35 23.27 4903-9427Device 10 0.063 10 22.17 1.83 7.64% 0.067 10 23.26 4903-9425END 22.17 1.83 7.64%END 22.17 1.83 7.64%END 22.17 1.83 7.64%END 22.17 1.83 7.64%END 22.17 1.83 7.64%END 22.17 1.83 7.64%END 22.17 1.83 7.64%END 22.17 1.83 7.64%END 22.17 1.83 7.64%END 22.17 1.83 7.64%Totals 1.323 340 1.294 340
Notes: Start voltage 24.29 at 1.29A, mid 24.46 volts at 1.28A, end 24.44 volts at 1.28A.
POINT-POINT LIMITS MEET
TotalsLump-Sum Method
Standard Wire Resistance per 1000
Actual Measurements
Alternate CalculationsLoad Centering Method
Totals
Voltage

55
Simplex 14/3, using nominal voltage (look closely at scales)
21.00
21.50
22.00
22.50
23.00
23.50
24.00
Volta
ge
0.000
0.050
0.100
0.150
0.200
0.250
Cur
rent
in A
mps
Calc. voltage 23.19 22.84 22.77 22.69 22.53 22.43 22.28 22.23 22.17 22.17
Actual voltage 23.83 23.80 23.79 23.74 23.50 23.45 23.42 23.30 23.27 23.26
Listed current 0.063 0.150 0.207 0.063 0.150 0.207 0.063 0.150 0.207 0.063
Actual current 0.064 0.145 0.205 0.065 0.142 0.179 0.064 0.146 0.217 0.067
Device 1 Device 2 Device 3 Device 4 Device 5 Device 6 Device 7 Device 8 Device 9 Device 10

56
Project Name Simplex (Power supply = DateCircuit Number 14-3 using actual voltageNotes battery, not synched 18=7.77 16=4.89 14=3.07 12=1.98 10=1.24Actual System Voltage 24.48 Actual = see notes When entering your measured value. Use the resistance measured for Minimum Device Voltage 22 one way on the circuit or 1/2 the total resistance out and backTotal Circuit Current 1.323 Wire Ohm'sActual total current = see notes Gauge Per 1000Distance from source to 1st device 100 14 3.07 Voltage VoltageWire Gauge for balance of circuit 14 3.07 Current Distance Drop Current Distance Drop
Distance Calculated 1.323 340 2.762 1.323 340 1.381Listed from Actual 1.294 340 2.701 1.294 340 1.351
Device Device previous At Drop from Percent Device Manufacture: SimplexNumber Current device Device source Drop Current Distance Voltage Model Numbers:
Device 1 0.063 100 23.67 0.81 3.32% 0.064 100 23.83 4903-9425Device 2 0.150 45 23.32 1.16 4.74% 0.145 45 23.80 4903-9426Device 3 0.207 10 23.25 1.23 5.02% 0.205 10 23.79 4903-9427Device 4 0.063 15 23.17 1.31 5.36% 0.065 15 23.74 4903-9425Device 5 0.150 30 23.01 1.47 5.99% 0.142 30 23.50 4903-9426Device 6 0.207 25 22.91 1.57 6.42% 0.179 25 23.45 4903-9427Device 7 0.063 50 22.76 1.72 7.03% 0.064 50 23.42 4903-9425Device 8 0.150 20 22.71 1.77 7.24% 0.146 20 23.30 4903-9426Device 9 0.207 35 22.65 1.83 7.48% 0.217 35 23.27 4903-9427Device 10 0.063 10 22.65 1.83 7.49% 0.067 10 23.26 4903-9425END 22.65 1.83 7.49%END 22.65 1.83 7.49%END 22.65 1.83 7.49%END 22.65 1.83 7.49%END 22.65 1.83 7.49%END 22.65 1.83 7.49%END 22.65 1.83 7.49%END 22.65 1.83 7.49%END 22.65 1.83 7.49%END 22.65 1.83 7.49%Totals 1.323 340 1.294 340Actual voltage was 1% over calculated at beginning, 2% in middle and 3% over at end of test. Based on beginning voltage used.Notes: Start voltage 24.29 at 1.29A, mid 24.46 volts at 1.28A, end 24.44 volts at 1.28A. Used 24.48 for starting voltage in calcs.
Actual V drop of 1.22 / lump sum V drop of 2.70 = +55% variation: Actual V drop of 1.22 / load centering V drop of 1.35 = +10% variation: using actual currents.
Actual Measurements
Alternate CalculationsLoad Centering Method
Totals
Voltage
POINT-POINT LIMITS MEET
TotalsLump-Sum Method
Standard Wire Resistance per 1000

57
Simplex 14-3, battery, using actual voltage (1% - 3% variation) (look closely at scales)
22.00
22.20
22.40
22.60
22.80
23.00
23.20
23.40
23.60
23.80
24.00
Volta
ge
0.000
0.050
0.100
0.150
0.200
0.250
Cur
rent
in A
mps
Calc. voltage 23.67 23.32 23.25 23.17 23.01 22.91 22.76 22.71 22.65 22.65
Actual voltage 23.83 23.80 23.79 23.74 23.50 23.45 23.42 23.30 23.27 23.26
Listed current 0.063 0.150 0.207 0.063 0.150 0.207 0.063 0.150 0.207 0.063
Actual current 0.064 0.145 0.205 0.065 0.142 0.179 0.064 0.146 0.217 0.067
Device 1 Device 2 Device 3 Device 4 Device 5 Device 6 Device 7 Device 8 Device 9 Device 10

58
Project Name Simplex (Power supply = DateCircuit Number 14/12-1 Notes 110 vac, solid tone, not synched 18=7.77 16=4.89 14=3.07 12=1.98 10=1.24Nominal System Voltage 24 Actual = 26.94 When entering your measured value. Use the resistance measured for Minimum Device Voltage 22 one way on the circuit or 1/2 the total resistance out and backTotal Circuit Current 1.323 Wire Ohm'sActual total current = 1.182 Gauge Per 1000Distance from source to 1st device 100 12 1.98 Voltage VoltageWire Gauge for balance of circuit 14 3.07 Current Distance Drop Current Distance Drop
Distance Calculated 1.323 340 2.762 1.323 340 1.381Listed from Actual 1.164 340 2.430 1.164 340 1.215
Device Device previous At Drop from Percent Device Manufacture: SimplexNumber Current device Device source Drop Current Distance Voltage Model Numbers:
Device 1 0.063 100 23.48 0.52 2.18% 0.060 100 26.72 4903-9425Device 2 0.150 45 23.13 0.87 3.63% 0.128 45 26.36 4903-9426Device 3 0.207 10 23.06 0.94 3.92% 0.188 10 26.11 4903-9427Device 4 0.063 15 22.98 1.02 4.26% 0.060 15 26.19 4903-9425Device 5 0.150 30 22.82 1.18 4.91% 0.129 30 25.96 4903-9426Device 6 0.207 25 22.72 1.28 5.35% 0.154 25 25.83 4903-9427Device 7 0.063 50 22.57 1.43 5.97% 0.061 50 25.83 4903-9425Device 8 0.150 20 22.52 1.48 6.18% 0.130 20 25.78 4903-9426Device 9 0.207 35 22.46 1.54 6.42% 0.191 35 25.64 4903-9427Device 10 0.063 10 22.45 1.55 6.44% 0.063 10 25.63 4903-9425END 22.45 1.55 6.44%END 22.45 1.55 6.44%END 22.45 1.55 6.44%END 22.45 1.55 6.44%END 22.45 1.55 6.44%END 22.45 1.55 6.44%END 22.45 1.55 6.44%END 22.45 1.55 6.44%END 22.45 1.55 6.44%END 22.45 1.55 6.44%Totals 1.323 340 1.164 340
Actual Measurements
Alternate CalculationsLoad Centering Method
Totals
Voltage
POINT-POINT LIMITS MEET
TotalsLump-Sum Method
Standard Wire Resistance per 1000

59
Simplex 14/12-1, using nominal voltage (look closely at scales)
20.00
21.00
22.00
23.00
24.00
25.00
26.00
27.00
28.00
Volta
ge
0.000
0.050
0.100
0.150
0.200
0.250
Cur
rent
in A
mps
Calculated voltage 23.48 23.13 23.06 22.98 22.82 22.72 22.57 22.52 22.46 22.45
Actual measured voltage 26.72 26.36 26.11 26.19 25.96 25.83 25.83 25.78 25.64 25.63
Manufacturer listed current 0.063 0.150 0.207 0.063 0.150 0.207 0.063 0.150 0.207 0.063
Actual measured current 0.060 0.128 0.188 0.060 0.129 0.154 0.061 0.130 0.191 0.063
Device 1
Device 2
Device 3
Device 4
Device 5
Device 6
Device 7
Device 8
Device 9
Device 10

60
Project Name Simplex (Power supply = DateCircuit Number 14/12-1 Using actual voltageNotes 110 vac, solid tone, not synched 18=7.77 16=4.89 14=3.07 12=1.98 10=1.24Actual System Voltage 26.94 When entering your measured value. Use the resistance measured for Minimum Device Voltage 22 one way on the circuit or 1/2 the total resistance out and backTotal Circuit Current 1.323 Wire Ohm'sActual total current = 1.182 Gauge Per 1000Distance from source to 1st device 100 12 1.98 Voltage VoltageWire Gauge for balance of circuit 14 3.07 Current Distance Drop Current Distance Drop
Distance Calculated 1.323 340 2.762 1.323 340 1.381Listed from Actual 1.164 340 2.430 1.164 340 1.215
Device Device previous At Drop from Percent Device Manufacture: SimplexNumber Current device Device source Drop Current Distance Voltage Model Numbers:
Device 1 0.063 100 26.42 0.52 1.94% 0.060 100 26.72 4903-9425Device 2 0.150 45 26.07 0.87 3.24% 0.128 45 26.36 4903-9426Device 3 0.207 10 26.00 0.94 3.49% 0.188 10 26.11 4903-9427Device 4 0.063 15 25.92 1.02 3.80% 0.060 15 26.19 4903-9425Device 5 0.150 30 25.76 1.18 4.37% 0.129 30 25.96 4903-9426Device 6 0.207 25 25.66 1.28 4.77% 0.154 25 25.83 4903-9427Device 7 0.063 50 25.51 1.43 5.32% 0.061 50 25.83 4903-9425Device 8 0.150 20 25.46 1.48 5.51% 0.130 20 25.78 4903-9426Device 9 0.207 35 25.40 1.54 5.72% 0.191 35 25.64 4903-9427Device 10 0.063 10 25.39 1.55 5.74% 0.063 10 25.63 4903-9425END 25.39 1.55 5.74%END 25.39 1.55 5.74%END 25.39 1.55 5.74%END 25.39 1.55 5.74%END 25.39 1.55 5.74%END 25.39 1.55 5.74%END 25.39 1.55 5.74%END 25.39 1.55 5.74%END 25.39 1.55 5.74%END 25.39 1.55 5.74%Totals 1.323 340 1.164 340Actual voltage was 1% above calculated voltage.
Actual V drop of 1.31 / lump sum V drop of 2.43 = +46% variation: Actual V drop of 1.31 / load centering V drop of 1.22 = +7% variation: using actual currents.
POINT-POINT LIMITS MEET
TotalsLump-Sum Method
Standard Wire Resistance per 1000
Actual Measurements
Alternate CalculationsLoad Centering Method
Totals
Voltage

61
Simplex 14/12-1 using actual voltage (1% variation) (look closely at scales)
24.50
25.00
25.50
26.00
26.50
27.00
Volta
ge
0.000
0.050
0.100
0.150
0.200
0.250
Cur
rent
in A
mps
Calculated voltage 26.42 26.07 26.00 25.92 25.76 25.66 25.51 25.46 25.40 25.39
Measured voltage 26.72 26.36 26.11 26.19 25.96 25.83 25.83 25.78 25.64 25.63
Listed Current 0.063 0.150 0.207 0.063 0.150 0.207 0.063 0.150 0.207 0.063
Actual current 0.060 0.128 0.188 0.060 0.129 0.154 0.061 0.130 0.191 0.063
Device 1
Device 2
Device 3
Device 4
Device 5
Device 6
Device 7
Device 8
Device 9
Device 10

62

63


65
Test Procedures: Most of our tests were conducted in a controlled environment. A 4' x 8' piece of 1/2" plywood was mounted vertically onto an inverted "T" base frame. 4" square mud rings (normally used on 4" x 4" electrical boxes) were mounted on one half (4'x4') of the plywood. The center of the mud rings was then cut out to allow for mounting of the notification devices. The second half of the plywood was used to mount the control/power panels. A 1,000' spool of 14 AWG FPL wire, a 500' spool of 18 AWG FPL wire, and 12 AWG THHN were pre-cut and labeled into various lengths (5', 10', 15', 20', etc.). After reviewing miscellaneous previously permitted fire alarm plans, various wiring scenarios were established. To assure that electromagnetic fields did not affect the wire resistance, all circuit wiring was stretched out (was rolled up for storage). The tests were conducted inside of a small air-conditioned warehouse. We wanted to make sure that the environmental temperature of the tests were representative of the average alarmed building. Temperature has an impact on the resistance of the wire, and can have an effect on device and battery performance. Because this space consisted of brick walls and concrete floors, a heavyweight flannel sleeping bag was draped over the devices once they were mounted. This significantly reduced the sound level and limited strobe flashes for the individuals conducting the large number of tests. Ear Muff hearing protection was also used. Fire alarm power supplies were pig-tailed and plugged into standard, non-isolated receptacles for the test. A Radio Shack model 22-186A LCD digital multimeter was used to monitor voltage, while a Craftsman model 82026 LCD digital multimeter was used to monitor current. Once the circuit was calculated based on the point-to-point drop, the test circuit was assembled on the test board. The actual results were then taken reading the current and voltage simultaneously at each device. "T" tapped circuits were used in many cases at the devices to facilitate better control of the measurements (understanding that this wiring method is not allowed by code due to supervisory reasons, but had no detectable impact on our voltage or current readings). Approximately four inches of 14 AWG wire was used for the taps. Two field studies within existing buildings were conducted. The high school was about one year old, while the telecommunication facility was new. As of this first draft, these results have not been finalized or charted.