The PHO View
19
The PHO View John Wilkinson
-
Upload
whistler-zachery -
Category
Documents
-
view
24 -
download
0
description
John Wilkinson. The PHO View. APHO. Cancer Registry. Core Funding Health Profiles Occasional Papers Website. PHINE. Drug & alcohol monitoring. Maternal & Infant Health. HES & Commissioning. Mental Health Observatory. National Library for Public Health. EU - PowerPoint PPT Presentation
Transcript of The PHO View

The PHO View
John Wilkinson

APHO
Mental Health Observatory
Core FundingHealth ProfilesOccasional PapersWebsite
Drug &
alcohol monitoring
Maternal &
Infant Health
HES & Commissioning
National Library for Public Health
EU Commission
PHINECancer Registry

Competency 5 – Manage knowledge and assess needs – some examples
• Joint Strategic Needs Assessment • Health Profiles• SHAPE • Mental Health Observatory• Drugs and Alcohol• Cancer data• National Library for Public Health • Regional Maternity Survey Office:• HES Service• Europe

Big Picture
• PHO delivers a number of non core functions
• Core functions now accounts for 25% of annual income
• More capacity and greater skill set in NEPHO
• PHINE

National Library for Public Health
• Single source for evidence for public health workforce
• Evidence-based resources from around the world, UK policy and guidance, news & events, etc. www.library.nhs.uk/publichealth

Drugs and alcohol
• Monthly (about 6 weeks after month end), quarterly and annual outputs to commissioners
• Used by DATs to commission, decommission and performance manage agencies
• Used by NTA and Healthcare Commission to manage whole system
• Alcohol data from April 2008 for PCTs

Training and Development
NEPHO run workshops, teaching training and advice in
areas such as:
• The development of profiles, indicators performance measures and targets
• Health Needs Assessment• Health Equity Audit• Health Impact Assessment• Ethnic (and diversity) monitoring
Example analysesNEPHO Life Expectancy reports
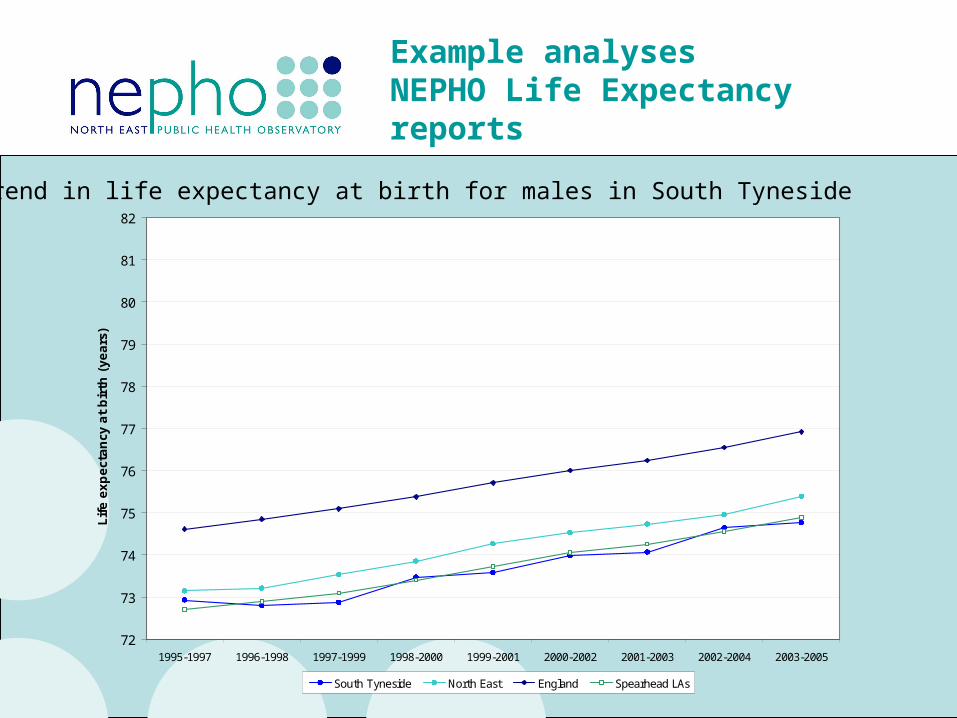
Trend in life expectancy at birth for males in South Tyneside
72
73
74
75
76
77
78
79
80
81
82
1995-1997 1996-1998 1997-1999 1998-2000 1999-2001 2000-2002 2001-2003 2002-2004 2003-2005
Life
expect
ancy
at
bir
th (
years
)
South Tyneside North East England Spearhead LAs

Example analysesNEPHO Life Expectancy reports
L.E. at birth for males in South Tyneside, projected against target
69
70
71
72
73
74
75
76
77
78
79
80
1995
-199
7
1996
-199
8
1997
-199
9
1998
-200
0
1999
-200
1
2000
-200
2
2001
-200
3
2002
-200
4
2003
-200
5
2004
-200
6
2005
-200
7
2006
-200
8
2007
-200
9
2008
-201
0
2009
-201
1
Life
Expect
ancy
at
Bir
th (
Years
)
South Tyneside ENGLAND Target trajectory Linear (South Tyneside) Linear (ENGLAND)

Example analysesNEPHO Life Expectancy reports
Scenario modelling, males in South Tyneside
73
74
75
76
77
78
79
80
81
82
83
84
40%
red
uctio
n in
circ
ulat
ory
deat
hsat
age
s <
75
20%
red
uctio
n in
canc
er m
orta
lity
atag
es <
75
20%
red
uctio
n in
acci
dent
mor
talit
yat
all
ages
20%
red
uctio
n in
suic
ide
at a
ll ag
es
All
four
tar
gets
Life
Expect
ancy
at
Bir
th (
Years
)
PSA target for England (2009/2011) = 78.6 years
South Tyneside target (2009/2011) = 77.0 years
South Tyneside 2003/2005 = 74.8 years

Mental Health - Discharge to first contact
•Key indicator of post-discharge follow up
•Important for suicide prevention
•Collected through the Mental Health Minimum Dataset
•Data shown are for 2005/6
•Available in the NEPHO Mental Health Workbook

Interval between discharge and first clinical contact(Patients of all ages - 2005/6)
England
0%
10%
20%
30%
40%
50%
60%
70%
80%
Mental Health Local Implementation Areas
Pro
po
rtio
n o
f p
atie
nts
co
nta
cted
By 27th day
By 20th day
By 13th day
By 6th day
North East
0%
10%
20%
30%
40%
50%
60%
70%
80%
Darlin
gton
Co. D
urha
m
Hartle
pool
Gat
eshea
d
Redca
r and
Cle
vela
nd
Stock
ton
Mid
dlesb
roug
h
South
Tyn
eside
Newca
stle
North
Tyn
eside
North
umbe
rland
Sunde
rland

RMSO data
J un-05Mar-03Dec-00Sep-98J un-96Mar-94Dec-91Sep-89J un-87Mar-85
0.0012
0.0010
0.0008
0.0006
0.0004
0.0002
0.0000
Quarter
Rate
1
1
Rate of gastroschisis by quarter of LMP


Europe
• “We want our region to perform best of all the regions in Europe” (SE Coast - Darzi Report)
Percentage of obese persons
0
5
10
15
20
25
Régions
% o
f o
bes
e p
erso
ns
Germany United-Kingdom Austria Belgium Spain France Luxembourg Netherlands
Sweden Estonia Hungary Latvia Malta 1st quartile 3rd quartile Median
Source: ISARE Data Set

SHAPE

Local ProvisionAdmissions to Trusts for PCT A (2004/05)
60.9%
11.8%
11.5%
7.5%
4.6%
1.2%
0.3% 0.3%
0.8%
0.2%0.1%
0.1%
0.7% Trust 1 Trust 2
Trust 3 Trust 4
Trust 5 Trust 6
Trust 7 Trust 8
Trust 9 Trust 10
Trust 11 Trust 12
OTHER

High Volume Emergency HRGs and ALOS
HRG35 HRG LabelNat
ALOS Trust1 Trust2 Trust3 Trust4 Trust5
1 E36 Chest Pain <70 w/o cc 1.62 1.13 1.40 1.11 0.69 3.67
2 F47 General Abdominal Disorders <70 w/o cc 2.36 1.90 2.87 2.41 2.94 0.83
3 P03 Upper Respiratory Tract Disorders 0.88 0.63 1.31 0.80 1.69 0.17
4 M09 Threatened or Spontaneous Abortion 0.57 0.46 0.82 0.62 0.00
5 S16 Poisoning, Toxic, Environmental and Unspecified 1.96 1.43 1.07 1.26 0.73 0.00
6 P13 Other Gastrointestinal or Metabolic Disorders 1.49 1.10 1.62 1.14 3.03
7 D40 COPD or Bronchitis w/o cc 7.39 6.76 5.37 6.55 0.00
8 E35 Chest Pain >69 or w cc 3.49 2.44 3.76 2.21 1.00 0.75
9 P06 Minor Infections (including Immune Disorders) 1.44 0.84 1.00 1.23 2.44 1.67
10 P26 Infectious and Non-Infectious Gastroenteritis 1.07 0.76 1.50 0.88 2.79 1.00
11 E12 Acute Myocardial Infarction w/o cc 7.53 6.56 7.97 6.31 4.00 7.75
12 D99 Complex Elderly with a Respiratory System P.D 16.63 16.18 15.75 11.88 2.00
13 F46 General Abdominal Disorders >69 or w cc 6.13 4.64 5.15 3.85 7.59 1.50
14 D41 Unspecified Acute Lower Respiratory Infection 9.6 9.49 6.12 7.83 5.75 9.00
15 E31 Syncope or Collapse >69 or w cc 7.65 6.66 6.70 5.90 8.67 3.00
16 E22 Ischaemic Heart Disease without intervention 6.32 3.66 4.78 3.23 3.50 13.00
17 P01 Asthma or Wheezing 1.24 0.81 1.21 1.25 2.00
18 E29 Arrhythmia or Conduction Disorders >69 or w cc 7.32 5.49 5.96 5.64 3.67 10.00
19 L09 Kidney or Urinary Tract Infections >69 or w cc 13.97 13.23 10.80 8.24 7.50 5.00
20 E23 IHD without intervention <70 w/o cc 3.67 2.77 3.09 2.41 1.00 2.50

Future?
• PHINE• PCT chief executives development group• What support is needed?• What could we do better?• What could we do less of?