The Pharmacy Quality Alliance: Promoting High-Value Health ...
42
1 The Pharmacy Quality Alliance: Promoting High-Value Health Care via Transparency in Pharmacy Performance Dave Domann, MS, R.Ph Johnson & Johnson
Transcript of The Pharmacy Quality Alliance: Promoting High-Value Health ...

1
The Pharmacy Quality Alliance: Promoting High-Value Health Care
via Transparency in Pharmacy Performance
Dave Domann, MS, R.Ph
Johnson & Johnson

2
OBJECTIVES::
Describe PQA’s mission and its stakeholders
Discuss the status of PQA initiatives to develop and test performance measures for pharmacies
Delineate various uses of the PQA measures
3
Ensuring Quality in Healthcare
“The fundamental challenge in health care is how to jump-start a new kind of competition –
competition on results in improving health and serving patients.”
Redefining Health Care –Michael Porter, Elizabeth Olmsted Teisberg
Porter ME, Teisberg EO, Redefining Health Care: Creating Value-Based Competition on Results. Harvard Business School Press, Boston Massachusetts, 2006.

4
The Mission of the PQA is to:
Improve health care quality and patient safety through a collaborative process in which key stakeholders agree on a strategy for measuring performance at the pharmacy and pharmacist- levels; collecting data in the least burdensome way; and reporting meaningful information to consumers, pharmacists, employers, health insurance plans, and other healthcare decision- makers to help make informed choices, improve outcomes and stimulate the development of new payment models.
5
Who’s at the PQA Table?

Pharmacy Quality Alliance (PQA)
•
PQA was formed in April 2006
•
CMS was instrumental in creation of PQA, but does not control PQA
•
Self-sustaining through dues of > 60 member organizations
6
7
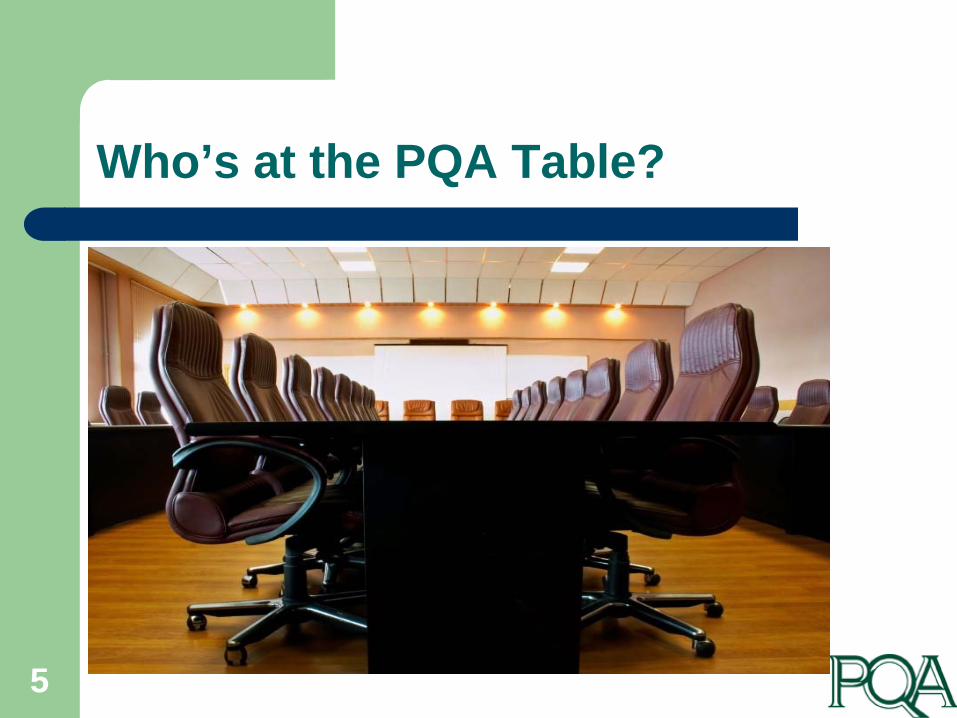
Steering Committee Organizations
Agency for Healthcare Research and Quality (AHRQ) The Brookings InstitutionAARPAcademy of Managed Care Pharmacy (AMCP) American Society of Consultant PharmacistsAmerica’s Health Insurance Plans (AHIP) American Pharmacists Association (APhA)Centers for Medicare & Medicaid Services, (CMS)Express Scripts, Inc. GlaxoSmithKline National Alliance of State Pharmacy AssociationsNational Association of Chain Drug Stores (NACDS) National Community Pharmacists Association (NCPA) Pitney BowesTeva Pharmaceuticals USA

8
Pharmacy Quality Alliance’s Four Primary Groups
Director
Quality Metrics ResearchCoordinating Council
Data Aggregationand Reporting
Director of PracticeImprovement
Education &Communications

9
PQA Activities - 2006
PQA formed in April 2006From April through November 2006:
–
Conducted environmental scan for existing measures of pharmacy performance
–
Developed guidelines for public reports, and pharmacy feedback reports, about pharmacy performance
–
Formed workgroups and cluster groups to develop measure concepts
–
Endorsed 37 measure concepts–
Developed plans for further development and testing of measures

10
PQA Activities - 2007
Contracted with NCQA and APC to develop specifications for claims-based measures of performance and pilot test the measures.
Contracted with American Institutes for Research (AIR) and UNC School of Pharmacy to develop and pilot-test a questionnaire for consumers (CAHPS-Pharmacy)
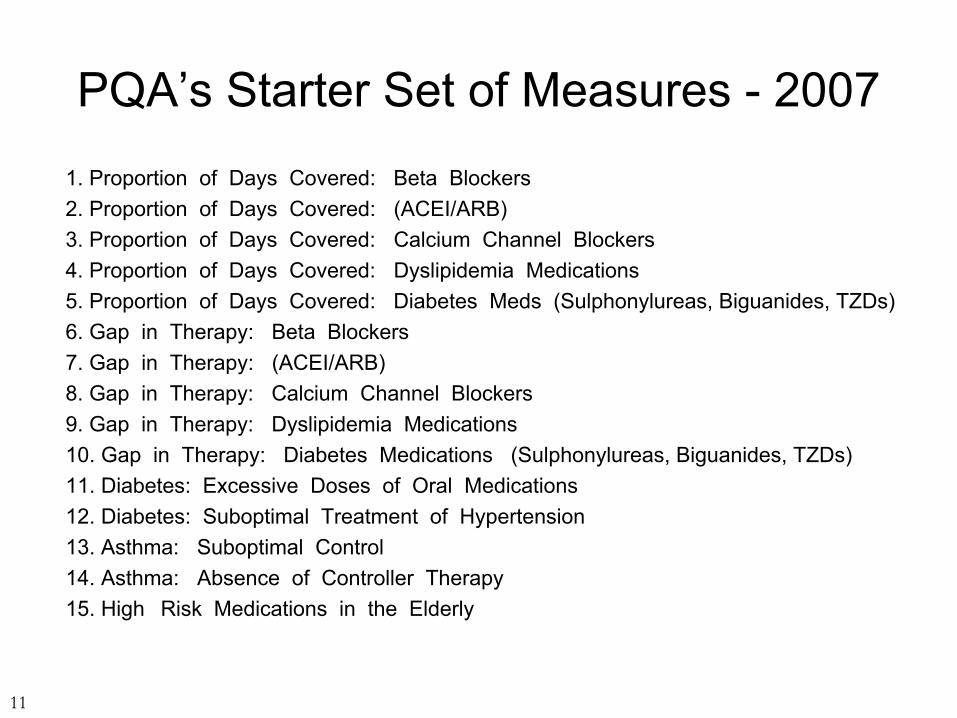
PQA’s Starter Set of Measures -
2007
11
1. Proportion of Days Covered: Beta Blockers 2. Proportion of Days Covered: (ACEI/ARB) 3. Proportion of Days Covered: Calcium Channel Blockers 4. Proportion of Days Covered: Dyslipidemia Medications 5. Proportion of Days Covered: Diabetes Meds (Sulphonylureas, Biguanides, TZDs) 6. Gap in Therapy: Beta Blockers 7. Gap in Therapy: (ACEI/ARB) 8. Gap in Therapy: Calcium Channel Blockers 9. Gap in Therapy: Dyslipidemia Medications 10. Gap in Therapy: Diabetes Medications (Sulphonylureas, Biguanides, TZDs) 11. Diabetes: Excessive Doses of Oral Medications 12. Diabetes: Suboptimal Treatment of Hypertension 13. Asthma: Suboptimal Control 14. Asthma: Absence of Controller Therapy 15. High�Risk Medications in the Elderly

12
PQA Adherence / Persistence Measures
•
A significant gap is defined as 30 days or greater
•
Individual measures focus on a specific drug class (e.g., beta blockers)
Measure Title
Measure Description/Definition
Gap in Therapy
Percentage of prevalent users who experienced a significant gap in medication therapy.

13
Single Gap
Index Fill Refill DueActual
Refill Date
Single Gap = 37 days
90 day supply
Jan 15 Apr 15 May 22

14
PQA Appropriateness Measure: Suboptimal Treatment of HT in Diabetes
Suboptimal treatment:Diabetes
Percentage of patients dispensed medications for diabetes and hypertension who are not receiving an ACEI or ARB.
Measure Title Measure Description/Definition

15
ConsumerAssessment ofHealthcareProviders andSystems
Developed by American Institutes for Research –
University of North Carolina
CAHPS Pharmacy Survey
CAHPS results are used toAssess the patient-
centeredness and quality of care from the patient’s perspective, Facilitate consumer choice; and Improve quality of care.

What’s Next for PQA ?
Demonstration Projects–
Phase I 2008-09–
Phase II 2009-11
Selection of Generation II measures
Educational programs for pharmacists, students, and other stakeholders
Participation in Quality Alliance Steering Committee (QASC)
16

17
Demonstration Projects
Phase I demonstration projects will focus on determining:Resource requirements for aggregating dataGenerating pharmacy performance reportsGaining feedback about the reports from pharmacy personnel

18
Demonstration Projects
Four Project AreasHealth Plan, or Prescription Drug Plan (PDP), generating performance reports for its network of pharmacy providers
A coalition of Health Plans, or PDPs, that work together to create aggregate performance reports for pharmacies in a geographic region
Community pharmacy corporation that creates an internal performance report system
Other models for pharmacy performance report generation and dissemination
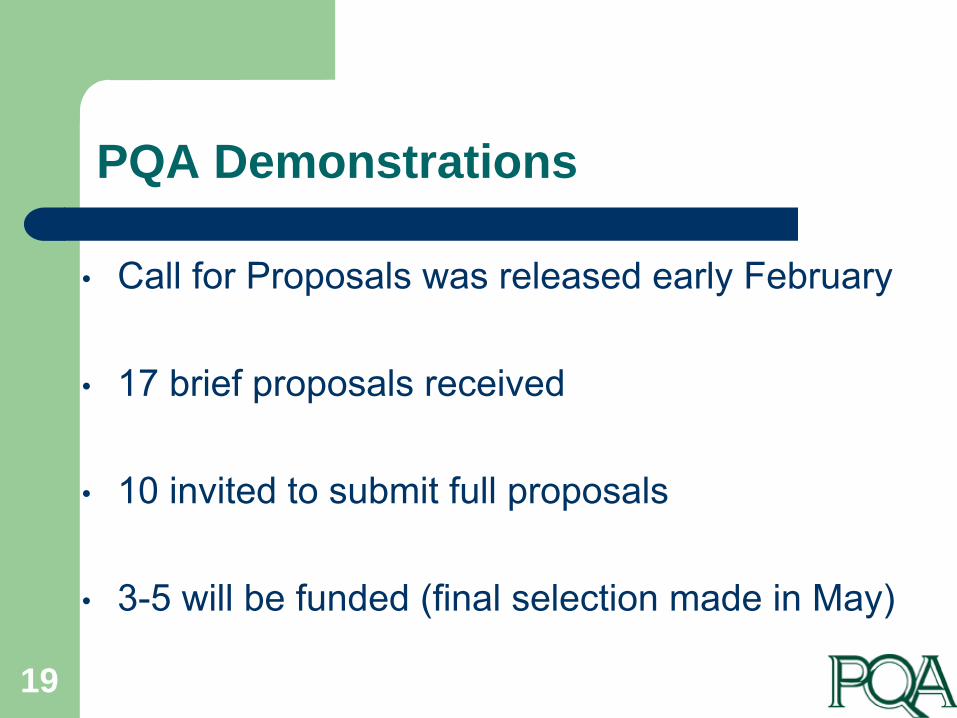
PQA Demonstrations
•
Call for Proposals was released early February
•
17 brief proposals received
•
10 invited to submit full proposals
•
3-5 will be funded (final selection made in May)
19

PQA Demonstrations
•
NCQA will provide technical assistance
•
AHRQ will fund an “evaluation contractor”
•
Phase I should be completed in mid-2009, and Phase II should start soon after
•
Phase II will focus on performance improvement20

Cluster Groups - 2008
Cardiovascular DisordersConsumer Feedback and AssessmentCost of CareDiabetesRespiratory DisordersMedication Adherence
Medication ReconciliationMental HealthMTM ServicesPatient Safety / e-prescribingPrevention and Wellness

Educational Programs
Educational Modules for Pharmacy School Curricula
Continuing Education Programs for Pharmacists
PQA Speakers Bureau to Communicate Pharmacy Quality Measurement to Quality Improvement Audiences

How will PQA measures be used?
23
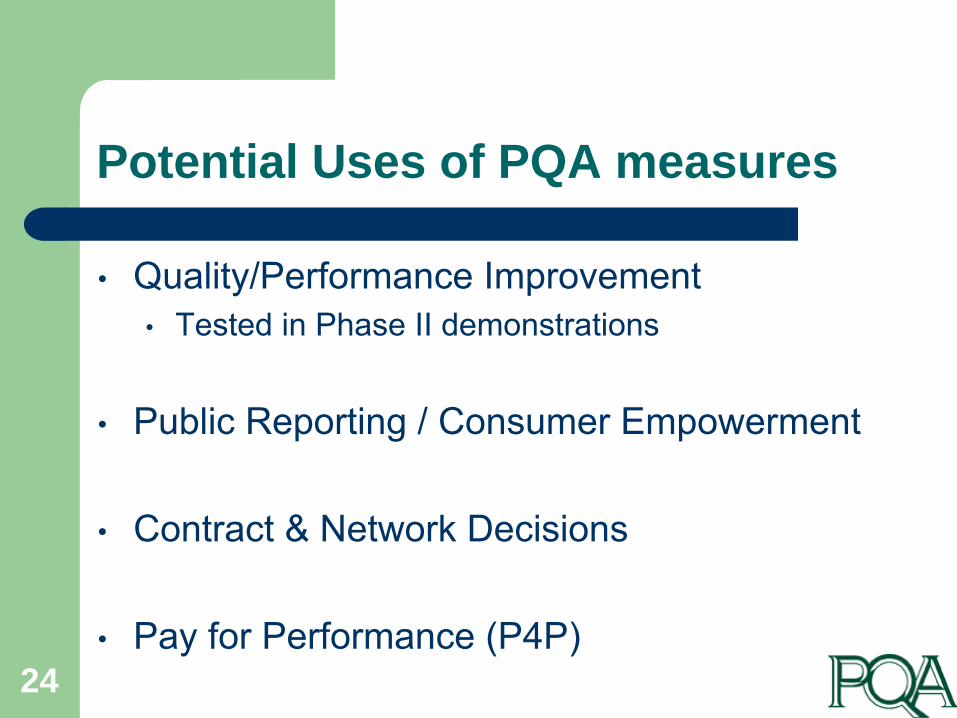
Potential Uses of PQA measures
•
Quality/Performance Improvement•
Tested in Phase II demonstrations
•
Public Reporting / Consumer Empowerment
•
Contract & Network Decisions
•
Pay for Performance (P4P)24

Public Reports
•
Information on hospital and physician quality is increasingly available to the public.
•
CMS may provide expanded performance information on drug plan finder in 2008
•
Drug plans, or regional coalitions, may start providing pharmacy reports in near future.
25

26
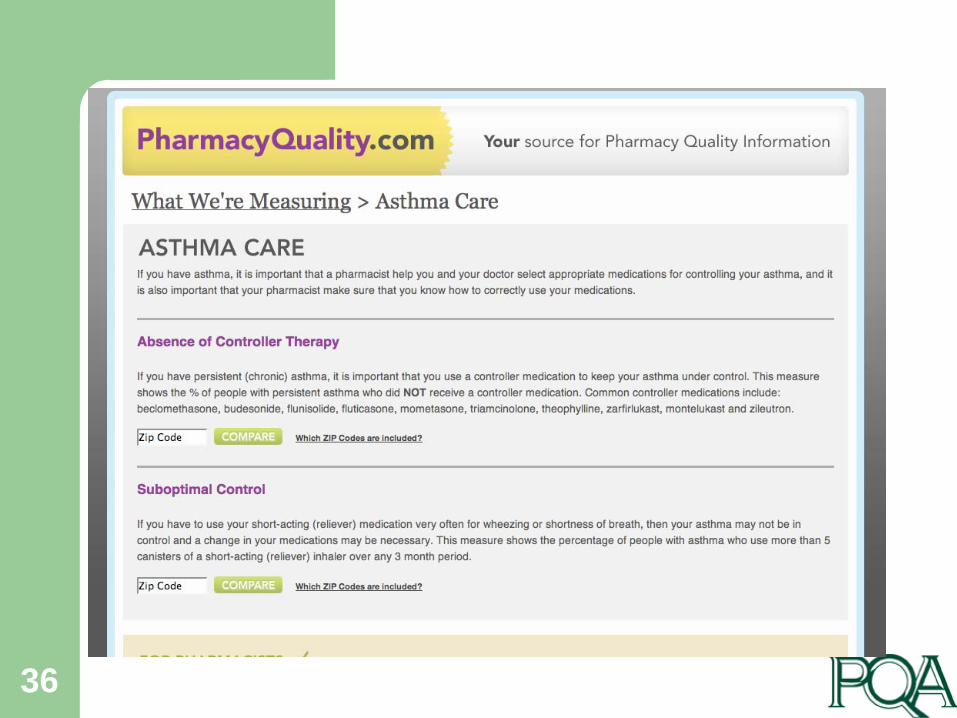
Public reports could be embedded in drug plan websites…

27
PharmacyQuality.comPharmacy Performance:
What’s Your Grade?
28
Compare Pharmacies

29

30

31
Find My Pharmacy

32

33

34

35
36

Network Decisions
•
Pharmacies that score above a threshold of quality could be included in a high performance network for a health plan (with higher payment for products / services)
•
Pharmacies that consistently perform poorly could be eliminated from the network (risk adjustment will be crucial for this decision).
37

38
Will PQA lead us to P4P Models in Pharmacy?
In P4P, financial incentives are linked to quality measures. Thus, potentially, pharmacies that score higher on PQA measures could get a bonus or higher dispensing fees, under a different financial model.
Hospitals, physicians, and home health have all been testing P4P models of payment, but the results have been mixed. P4P appears to stimulate improvement in some indicators but not all, and the long-term effect on health outcomes is not yet known.

Pharmacy P4P Example: Current Performance
MedicationAdherence
MedicationSafety
Appropriateness:Asthma / Diabetes
# of patients 200 300 100
# Quality measures 7 3 4
Composite Quality Score
60% (120 adherent pts)
90% (270 pts meet criteria)
93%(93 pts meet criteria)
Incentive $ 10/pt (for adherent pts)
$ 2/pt $ 3/pt
Bonus Payment $10 x 120 = $ 1,200 $4 x 270 = $ 1,080 $3 x 93 = $ 279
This example is presented for illustration only!
PQA has not endorsed any model for pharmacy P4P

Pharmacy P4P Example: Improvement Model
MedicationAdherence
MedicationSafety
Appropriateness:Asthma / Diabetes
# of patients 200 300 100
Score in 2006 60% 90% 93%
Score in 2007 70% 93% 92%
Incentive $ 1/ pt / 1% increase $ 0.50 / pt / 1% inc $ 2 / pt / 1% increase
Bonus Payment $1 x 200 x 10 = $2000
$0.5 x 300 x 3 = $ 450
$ 2 x 100 x 0 = $ 0
This example is presented for illustration only!
PQA has not endorsed any model for pharmacy P4P

41
Implications
“I don't fear pay for performance. I fear pay for performance for measures that don't really matter.”
Benjamin Brewer, MDWall Street Journal, January 29, 2008
–
What are “quality”
quality measures?–
Who is responsible/accountable for the care?–
Who is the quality “attributable”
to? Physician, Nurse, Patient, Pharmacist, Health Plan, PBM?

42
Questions??....Always welcomed!
For more information:www.pqaalliance.org