
The Performance of Separate Accounts and Collective ... copy available at: 2089044 The Performance...
38
Electronic copy available at: http://ssrn.com/abstract=2089044 The Performance of Separate Accounts and Collective Investment Trusts Elton, Gruber and Blake – June 21, 2012 The Performance of Separate Accounts and Collective Investment Trusts by Edwin J. Elton* Martin J. Gruber** Christopher R. Blake*** * Nomura Professor of Finance, Stern School of Business, New York University, 44 West 4 th Street, New York, NY 10012, USA; phone 212-998-0361; fax 212-995-4233; e-mail: [email protected] ** Professor Emeritus and Scholar in Residence, Stern School of Business, New York University, 44 West 4 th Street, New York, NY 10012, USA; phone 212-998-0333; fax 212-995-4233; e-mail: [email protected] *** Joseph Keating, S.J., Distinguished Professor, Graduate School of Business Administration, Fordham University, 113 West 60 th Street, New York, NY 10023, USA; phone 212-636-6750; fax 212-765-5573; email: [email protected] We would like to thank the UAI Foundation and Inquire Europe for financial support for this project.
Transcript of The Performance of Separate Accounts and Collective ... copy available at: 2089044 The Performance...

Electronic copy available at: http://ssrn.com/abstract=2089044
The Performance of Separate Accounts and Collective Investment Trusts Elton, Gruber and Blake – June 21, 2012
The Performance of Separate Accounts and Collective Investment Trusts
by
Edwin J. Elton*
Martin J. Gruber**
Christopher R. Blake***
* Nomura Professor of Finance, Stern School of Business, New York University, 44 West 4th Street, New York, NY 10012, USA; phone 212-998-0361; fax 212-995-4233; e-mail: [email protected]
** Professor Emeritus and Scholar in Residence, Stern School of Business, New York
University, 44 West 4th Street, New York, NY 10012, USA; phone 212-998-0333; fax 212-995-4233; e-mail: [email protected] *** Joseph Keating, S.J., Distinguished Professor, Graduate School of Business
Administration, Fordham University, 113 West 60th Street, New York, NY 10023, USA; phone 212-636-6750; fax 212-765-5573; email: [email protected]
We would like to thank the UAI Foundation and Inquire Europe for financial support for this project.

Electronic copy available at: http://ssrn.com/abstract=2089044
The Performance of Separate Accounts and Collective Investment Trusts Elton, Gruber and Blake – June 21, 2012
Abstract Despite the size and importance of separately managed accounts and collective
investment trusts, their characteristics and performance have not been previously studied in the
financial economics literature. In this paper, we show that, using the Fama-French-Carhart 4-
factor model, on average separate account performance is similar to that of index funds and
superior to that of actively managed mutual funds. Management supplies a benchmark for each
of those accounts. When the management-selected benchmark rather than the single index that
best fits the return pattern of the account or the Fama-French-Carhart 4-factor model is used to
measure performance, performance is significantly overstated. We also examine and find a set of
variables that explains (at a statistically significant level) both the cross section of alphas and the
cross section of cash flows. In addition to the set of variables that have been used to explain
those phenomena in mutual funds, a set of organizational variables such as partnership form or
corporate form are found to have a statistically significant impact on alphas and cash flows.

The Performance of Separate Accounts and Collective Investment Trusts Page 1 Elton, Gruber and Blake – June 21, 2012
I. Introduction
In this paper we study Separately Managed Accounts (SMA) and Collective Investment
Trusts (CIT). These vehicles represent alternatives to mutual funds for investment by wealthy
individuals and institutional investors, including pension plans and endowments. A separately
managed account is a portfolio of assets managed by a professional management firm. Unlike
mutual funds, the securities held in the account are directly owned by the customer, the fees are
negotiable, and the account can be customized to reflect the customer’s tax or social concerns.
Separately managed accounts generally have minimum initial investments which in most cases
range from $100,000 to $5 million. Separately managed accounts are not regulated, although the
manager is often a registered investment advisor subject to the Investment Advisor Act of 1940.
In 2007 Money Management estimated the amount invested in SMAs was $808 billion, and in
2008 Reuters estimated that financial advisers with accounts over $2 million allocated 18% to
SMAs compared to 28% to mutual funds.
Collective Investment Trusts (CIT) are co-mingled accounts offered by banks or trust
companies for qualified pension plans, defined benefit plans, defined contribution plans, and
certain government pension plans. Like SMAs, they are unregistered, but they are regulated by
the Office of the Controller of the Currency. The implication of their being unregistered is that
they are not required to disclose performance data. About 40% of pension plans hold collective
investment trusts.
Despite the fact that SMAs and CITs are important investment vehicles, they have not
been examined in the literature of financial economics. In this paper we examine several aspects
of their performance. Almost all SMAs and CITs supply a benchmark against which they wish to
The Performance of Separate Accounts and Collective Investment Trusts Page 2 Elton, Gruber and Blake – June 21, 2012
be judged. We show that they choose benchmarks such that their performance is vastly
overstated when compared with the single index benchmark that best describes their return
behavior and versus the multi-index models most often used in the literature. The performance of
separate accounts when properly managed is very close to that of index funds and better than a
matched sample of mutual funds.
We also study the determinants of both cross-sectional differences in the returns of
separate accounts and cross-sectional differences in cash flows to these accounts. The variables
tested include, in addition to a set of variables that have been found to explain performance in
mutual funds (e.g., expenses, turnover, and lagged performance), a set of organizational variables
such as how income is distributed, limited liability, size of the minimum initial purchase, and
the existence of pending lawsuits. Statistically significant relationships are found.
SMAs and CITs supposedly have a cost advantage over mutual funds in that they have
less required reporting, lower marketing costs, smaller support staffs to handle customer
inquiries, and no independent boards. In addition, they have flexibility in fees, and portfolios can
be customized to meet a client’s objectives.
SMA and CIT data, like hedge fund data, are self-reported. Morningstar collects return
and other data on both SMAs and CITs. SMA data is reported on a pooled basis; that is, the
performance and characteristics are reported for the aggregate of all accounts with the same
investment objective (e.g., large growth). Most follow standards set by the industry in how they
aggregate return data, and thus return is usually reported by weighting account returns by the
proportion that accounts represent of the aggregate. Like data on the returns of hedge funds, the
return data on SMAs and CITs are likely to be upward-biased. Morningstar retains data on SMAs

The Performance of Separate Accounts and Collective Investment Trusts Page 3 Elton, Gruber and Blake – June 21, 2012
or CITs up to the time the firm stops reporting, so there is little survivorship bias. However, for
hedge funds we know that funds stop reporting after a bad return and the last bad return or series
of bad returns often doesn’t appear in the data set. This could introduce some bias in the data.
In addition, there may be a bias in favor of higher returns caused by self-selection of
those managers who choose to start reporting. However, this is mitigated by the belief that to be
considered by a new investor they need to be in one of the large databases.1
This paper is organized as follows: In Section II we present some more information on
our sample. In Section III we present the methodology used in measuring performance. In
Section IV we examine performance. In Section V we compare the performance of SMAs and
CITs with the performance of mutual funds. In Section VI we analyze the determinants of the
performance of separate accounts. In Section VII we analyze the determinants of cash flow to
separate accounts. Our conclusions are presented in section VIII.
II. Sample
We initially selected all surviving and non-surviving accounts from the Morningstar
Direct Database that were listed as United States Separate Accounts or United States Co-
Mingled Investment Trusts and that were categorized as Equity Accounts (3,716 accounts).
We then eliminated:
1. All funds which were identified as index accounts, specialty accounts (e.g., REITs, tech
1 Some of the very early data was purchased by Morningstar from other vendors. In
some of the purchased data, accounts that ceased reporting might not be included and some accounts might have initially entered with a history. To check whether this biases the results we deleted the first few years for each account and repeated our analysis. This resulted in minimal changes in our results. Since data from outside suppliers was only present in the initial years of our study, this should not be an issue.

The Performance of Separate Accounts and Collective Investment Trusts Page 4 Elton, Gruber and Blake – June 21, 2012
funds, etc.) or were heavily invested in bonds or foreign securities.
2. Any accounts that had less than 24 months of data by the end of our sample period.
We collected monthly gross return and net return data for this sample of funds from July 2000 to
December 2010.2 We eliminated funds where the return series was clearly implausible or where
the relationship between gross and net return was implausible over long periods of time and
therefore we could not identify which was accurate. This left us with a combined sample of
2,627 accounts consisting of 2,277 separately managed accounts and 350 collective investment
trusts. We refer to the total of these two samples as combined separate accounts.
We next drew a comparison sample of mutual funds. The principal characteristics of
SMAs and CITs are that they are designed for institutional customers or high-net-worth
individuals. As a comparison sample we selected all mutual funds listed on Morningstar that
required a minimum investment of $1,000,000 or more. Only 442 of the SMAs and CITs had
minimum investment less than $1,000,000.
Table 1, Panel A shows the distribution of minimum investment in an account for the
combined SMAs and CITs and the mutual fund sample. The median minimum investment for the
combined sample is $5 million, where the median for the mutual fund sample is $1 million. In
addition, the minimum for the upper part of the distribution is much higher for the combined
sample than for the mutual fund sample. As shown in Panel B, there is no difference in the
median minimum investment for SMAs and CITs.
How does the combined sample compare to the mutual fund sample on other
2 This date was selected because it is the first date for which the Russell Micro-Cap
Index is available. The reason for employing the Micro-Cap Index will be explained shortly.

The Performance of Separate Accounts and Collective Investment Trusts Page 5 Elton, Gruber and Blake – June 21, 2012
characteristics? As shown in Table 1, the median mutual fund is more than 2 1/2 times larger
than the median combined separate accounts (SMA's and CIT's). The difference in size is
especially large for the lower part of the distribution, while for the largest accounts there is very
little difference in size. Comparing SMAs to CITs shows that the median SMA is about three
times larger than the CITs. When we look at the number of stocks held by the combined separate
account sample and the mutual fund sample we see very little difference. The mutual funds
sample holds slightly more stocks, which is consistent with mutual funds being larger and the
tendency of mutual funds to add additional stocks slowly as fund size grows (see Pollet and
Wilson (2008)). Even with the larger number of stocks held by mutual funds, the concentration
in the top 10 stocks is similar for the combined separate account sample and the mutual fund
sample.
Morningstar collects data on return both pre-expenses and post-expenses. We used the
difference in the return series to estimate the expense ratios for the combined sample. If
Morningstar does not receive data on both pre- and post-expense return, it calculates the return
data it doesn't have using a representative fee from the firm supplying the data. If they don't have
a representative fee, they use the maximum fee from the firm's schedule. However, if they don't
have a representative fee they rarely have a fee schedule. Finally, if they don't have any fee data
they leave the return series that is not reported blank.
Some fees were reported quarterly and some monthly. In all cases we converted fees to
annual fees. The data on fees is reported in Table 1. In preparing the data we did an extensive
amount of data checking. On occasion the differential between pre- and post-expenses was so
large, and the numbers were such that there appeared to be an error in entering the data, these

The Performance of Separate Accounts and Collective Investment Trusts Page 6 Elton, Gruber and Blake – June 21, 2012
were not included in the calculations. A large differential could occasionally be caused by a
bonus being paid to the manager, and our discarding these could be inappropriate. Including or
excluding observations that would bias the results upward (when Morningstar uses maximum
fees) or downward (eliminating extremes that were possibly a bonus) had little effect on our
findings. Nevertheless, since there is some arbitrariness in identifying and classifying these
correctly, and since questionable observations tend to be in the tails, we reported the medium
expense ratio and points on the distribution rather than means which are sensitive to tails and any
misclassification. The expenses on the CITs and SMAs ranged from a low of 4 b.p. to a high of
3.77%. The median was 81 b.p. This is lower than our comparison samples of mutual funds,
where the median fee is 93 b.p. In addition, for all points on the distribution shown in Table 1
except for the 90% breakpoint, CIT and SMA fees are lower than those for mutual funds.3
Trading costs are costs that lower returns but are not included in the expense ratio. If we use
turnover as a proxy for trading costs, we see that median turnover and all points in the
distribution shown in Table 1 are higher for mutual funds. Thus total expenses (expense ratio and
trading costs) are higher for mutual funds. Lower costs are frequently cited as a reason why
institutions and high-net-worth individuals use SMAs or CITs rather than mutual funds that cater
to these clients.
Another supposed advantage of SMAs is that they need less support staff to handle
customer inquiries. Table 1 shows the median number of customers following any strategy is 12.
However, since each individual account is customized, each account may require more attention
by management.
3 A few of the separate accounts were wrap accounts, and this accounts for the higher
upper-end expenses.

The Performance of Separate Accounts and Collective Investment Trusts Page 7 Elton, Gruber and Blake – June 21, 2012
III. Methodology
The performance of any separate account was measured using several single- and multi-
index models. The general form is
it
J
j
jtijiit IR εβα ++= ∑=1
where
Rit = the monthly excess return (over the riskless rate) on account i for month t;
Ijt = index j of an appropriate set of indexes (each defined as the return on a zero-investment
portfolio) for month t;
βij = the sensitivity of account i to index j;
αi = the risk-adjusted return (using the included indexes) of account i;
εit = the residual return of account i in month t not explained by the index.
The initial models used were single-index models. The first model compares the
performance of each account with the benchmark that management selected as most relevant for
that account. In our sample of 2,627 accounts, management supplied benchmarks for 2,319
accounts, or 88% of the sample. Management used 51 different benchmarks. Of the 51
benchmarks, 29 were selected in total by only 70 of the 2,319 accounts. These 29 benchmarks
were primarily a composite of two or more indexes.4 There were 22 remaining benchmarks.
4 These benchmarks are included when we examine alpha in Table 2, though they are
excluded when we examine the reason for differences in alpha between the management- preferred benchmark and a more complete model.

The Performance of Separate Accounts and Collective Investment Trusts Page 8 Elton, Gruber and Blake – June 21, 2012
Examination of the remaining 22 benchmarks showed that for reporting summary statistics they
could be grouped into nine categories, though all 22 indexes were retained for purposes of
computing alpha. The nine categories of benchmarks can be identified as large-cap, mid-cap and
small-cap, with each group divided into growth, blend and value.
Thus the first performance measure used was simply the alpha from a regression of each
account against the management-declared benchmark. For purposes of computing alpha against
management's preferred benchmark, we used whatever management chose. However, for
reporting purposes we used the nine categories described above plus another category for 29
benchmarks that did not fit those nine categories.
For the second model we used the single index that best explained the behavior of each
account. Four of the 22 indexes were essentially identical to one of the remaining 18 (e.g.,S&P
Midcap and Russell Midcap). Thus for the stepwise procedures we used 18 indexes. The best
index was selected via a stepwise procedure from the 18 possible indexes. The alpha from this
procedure was computed, and this alpha is called the “best-fit alpha.”
We next examined performance using a multi-index model. The base model used is the
Fama-French model with the addition of the Carhart momentum index. We regressed all of the
Russell indexes against this model and found that the alpha on small and micro-cap growth
indexes was significant. In addition, examining the composition of the accounts in our sample
showed that many hold a large portion of their portfolio in very small stocks. For these two
reasons an additional variable was defined and added to the Fama-French-Carhart model. We
defined a micro index as the orthogonalized value of the Russell micro-cap index in excess
return form. The index was formulated by regressing the excess return of the Russell micro-cap

The Performance of Separate Accounts and Collective Investment Trusts Page 9 Elton, Gruber and Blake – June 21, 2012
index on the Carhart model and replacing the excess return on the index with the alpha plus the
appropriate month’s residual from this regression. While we will emphasize the Carhart model
throughout the rest of the paper, we will occasionally refer to the model which in addition to the
four variables in the Carhart model adds the orthoganized version of the Russell micro-cap
index. We refer to these models as the four-factor and five-factor model respectively.
IV. Performance
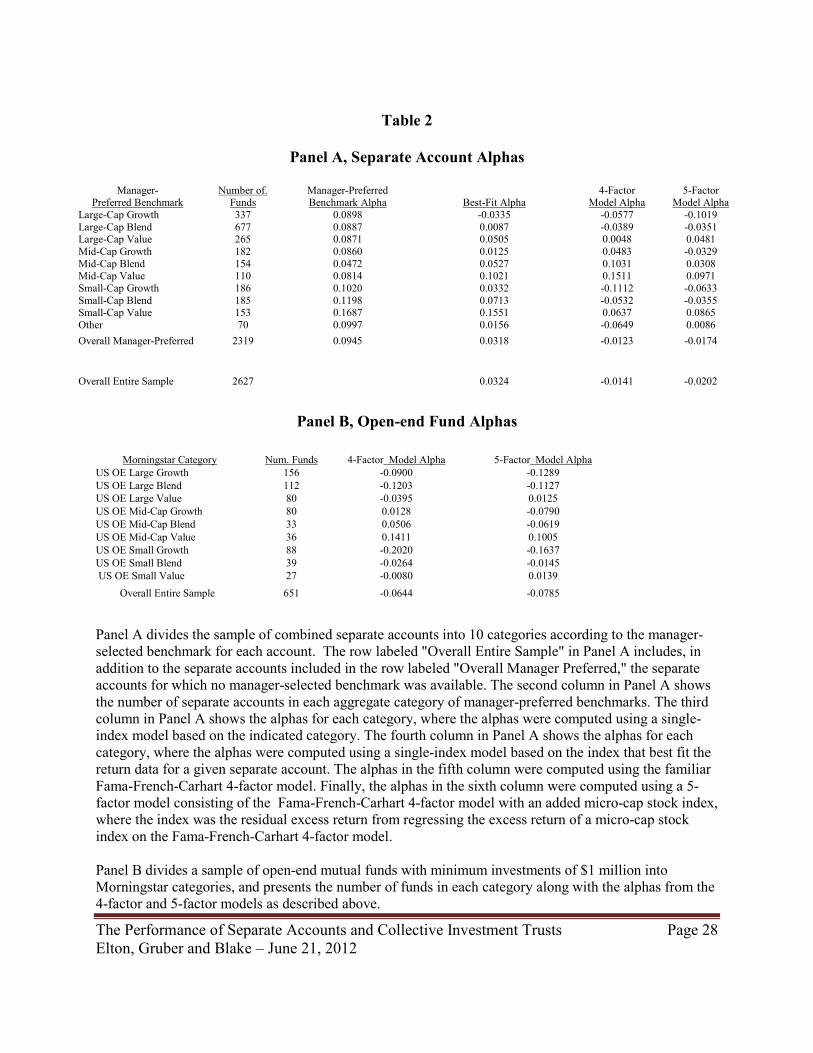
In Table 2 we examine the alphas from each of the index models described earlier. The
accounts are grouped for purposes of presentation into nine groups by the manager's preferred
benchmark, and into a group labeled ‘other,’ combining the 70 funds that used indexes that
could not be placed into any of the nine groups.
The first comparison to note is how much lower the best-fit alpha is than the alpha based
on the benchmark the manager has selected. The average difference is 6.3 basis points per month
or approximately 76 basis points per year. Furthermore, the best-fit alpha is lower in 8 of the 10
categories.
When we examine individual categories we see that the biggest differences in alpha occur
in the management benchmark growth categories, while only the mid-size blend and value
categories have benchmark alphas below those produced by the best-fit index.
There is definitely a difference between the alphas produced by the benchmarks selected
by management and the benchmarks selected by a best-fit criterion. Management appears to be
selecting benchmarks that make their performance look good. We can gain more insight into this
by examining differences in classification between the best-fit benchmarks and the benchmarks
selected by managers and the impact on alpha for funds that are classified differently.

The Performance of Separate Accounts and Collective Investment Trusts Page 10 Elton, Gruber and Blake – June 21, 2012
Why is there a difference in average alpha when it is computed using the manager's
chosen benchmark and when it is computed using the index that best describes the return
pattern? Obviously, if the manager's benchmark and the best-fit index are the same, there is no
difference in the computed alphas. Thus the difference comes about because the managers
choose to use a benchmark other than the one that best described the performance of the account
they managed.
Table 3 shows the difference between the manager's choice and the benchmark that best
explains the return pattern for the nine indexes. The manager's choices are shown in the columns
and the indexes that best explain return are shown in the rows. Table 4 shows the alpha which
arises from the difference in classifications presented in Table 3.
For example, from Table 3 we see that for 69 of the 337 managers who choose to be
categorized as large-cap growth, the most representative benchmark was large-cap blend. The
impact of this can be seen from Table 4. The average increase in alpha attributed to each of these
69 funds is 21 basis points per month.5
Some clear patterns arise from Table 3. Note that the principal differences occur because
of a different classification by size and different classification within the blend categories.
Examining the large-cap blend category shows that, of the accounts categorized as large blend by
management, 92 behaved more like a mid-cap account, while 181 behaved more like a growth or
value account. Across all managers who chose a blend benchmark, there were 279 cases where
5 Observations with less than five entries have been deleted in Table 4 to better examine
the factors influencing differential alpha. There are some minor values on the main diagonal that have been zeroed out. These occur because the index the manager chooses and the best-fit index, while in the same one of the nine cells, can be slightly different (e.g., Russell and S&P midcap indexes).

The Performance of Separate Accounts and Collective Investment Trusts Page 11 Elton, Gruber and Blake – June 21, 2012
managers selected a blend benchmark where the return pattern was more like a value or growth
account. A large part of this arose from managers selecting the S&P 500 index as their
benchmark, when for 142 of these cases the return pattern was better described by either a
growth or value index.
When we examine the manager's choice of the size criteria we also find large differences
between the manager's choice of an index and the best-fit index. From Table 3, 193 of the
managers who chose a large stock-index had returns which looked like they were investing in
smaller stocks. Finally, some managers who chose a small-stock index had returns that looked
like they were investing in mid-cap stocks.
Table 4 makes it clear that the choice of a benchmark by managers results in a higher
alpha than that produced by the best-fit index. Note that almost all entries in this table are
positive. In only six cells in this matrix are the alpha differentials negative, while in 20 cases
they are positive. Managers are almost uniformly making choices that increase this alpha over
using a more appropriate index. In addition, note in general that the further the manager's chosen
benchmark is from the best-fit alpha, the greater the differential alpha. The impact on average
alpha of a manager classifying an account differently from what best explains his investment
behavior is due to both the number of accounts misclassified and the differential alpha on the
misclassified funds. The net result is presented in the bottom row of Table 4. The numbers in this
row represent the average increase in alpha associated with all accounts for which management
has selected a different benchmark than the one shown in the column. This is computed by
taking the sum of all differential alphas where the best-fit index differs from the management-
declared benchmark and then dividing by the number of observations. We see that for nine of the

The Performance of Separate Accounts and Collective Investment Trusts Page 12 Elton, Gruber and Blake – June 21, 2012
benchmarks selected by management, eight show a higher alpha than they would show using the
best-fit benchmark. The one category that shows a lower value is the mid-cap value account
category. Many of these accounts should have been categorized as mid-cap blend.
In summary, judicious choices of indexes by management resulted in high alphas because
of their tendency to choose benchmarks more appropriate for managers selecting large stocks
and balanced portfolios.
Returning to Table 2, when we examine multi-index models compared to manager-
selected benchmarks we see a large difference in alphas. As stated earlier, we employ two multi-
index models. The first is the Fama-French-Carhart model. The second adds the excess return on
the Russell micro-cap index (orthoganalized to the Fama-French-Carhart model) to the Fama-
French-Carhart model. The difference between the four- and five-factor models for accounts
where the manager has a declared benchmark is 0.0051 b.p. per month. This difference comes
about because some of the accounts in our sample hold micro-cap stocks, often in large amounts.
Thus the inclusion of a micro-cap index seems appropriate. The alpha from the five-factor model
across all accounts is minus 24 basis points per year while it is minus 17 basis points for the
four-factor model. In the following section we will compare these numbers with those found for
our sample of mutual funds.
Why do we find differences in alphas from a multi-index model and from simply using
the management-preferred benchmark? Note that any benchmark can be explained in part by a
multi-index model. When an account is regressed on a single benchmark to obtain alpha, the
relative sensitivity to the various factors in the multiple-factor model is determined in part by the
sensitivity of the single index on each of the factors in the multi-factor model. When a multi-

The Performance of Separate Accounts and Collective Investment Trusts Page 13 Elton, Gruber and Blake – June 21, 2012
factor model is used directly, the relative sensitivity to the various factors is determined by
whatever sensitivity best explains the return pattern of the accounts. Thus differences in the
alphas computed from using the manager's benchmark and from using a multi-index model are
determined by differences in the betas on the multi-factor model and the implicit betas when the
benchmark is used. The implicit beta is the product of the account’s beta with the benchmark and
the beta of the benchmark with the factor.
Table 5 shows the implicit manager-benchmark beta less the beta on the multi-index model
for each index in the multi-index model. All of the beta differentials on the market are negative,
indicating that accounts have more market sensitivity than would be indicated by computing
alpha using the manager's benchmark. Over this period the excess return on the market was
positive, causing alphas to be higher when the manager's benchmark is used. The return on the
small-minus-big (SMB) factor is positive in this period, which decreases the alphas for accounts
tilted more towards large stocks and increases them for accounts tilted more toward small stocks
relative to what would be inferred from the benchmark. The differential betas on the high-minus-
low (HML) factor are positive for accounts designated as value, indicating that they have a lower
value tilt than that indicated by the multi-index model. Likewise, the accounts designated as
growth are more value-tilted than would be indicated by the manager's benchmark. The index
had a positive value in this period, increasing the alpha on growth accounts and decreasing it for
value accounts. The differential beta on the momentum factor is large and negative for growth
accounts, indicating that growth accounts follow more of a momentum strategy than their
benchmark (which should be on average zero). Since the return on this factor is positive, growth
accounts will have a higher alpha when their benchmark index is used to compute alpha. For

The Performance of Separate Accounts and Collective Investment Trusts Page 14 Elton, Gruber and Blake – June 21, 2012
other types of accounts the differential beta is small enough to have little impact on differential
alpha. Aggregating across all four factors, the difference in betas leads to a larger alpha when the
manager's benchmark is used to compute alphas. When the five-factor model is used, the pattern
of alphas on the first four factors is the same, and the differential alpha on the fifth factor is small
enough to have little influence on differential alpha.
V. Comparison with Mutual Funds
Table 2, Panel B, shows the performance of our stratified sample of mutual funds. How
does its performance compare to our sample of separate accounts? The average alpha from the
four-factor model for mutual funds is −75 b.p. per year while it is −86 b.p. per year using the
five-index model. The expense ratio for the sample was 94 b.p. per year. The return is of the
general order of magnitude found in other mutual fund studies, while the expense ratio is
somewhat lower. The lower expense ratio is to be expected given the large size of initial
investment.
For our separate account sample, we find that the average alpha from the four-index
model is −17 b.p. per year, while from the five-index model it is −24 b.p. per year. The
differences in performance for separate accounts and mutual funds is between 58 and 61 b.p. per
year, depending on the model used. Examining the difference in expense ratios still indicates that
separate accounts managers outperform mutual fund managers by about 46 b.p. per year before
expenses.6
Separate account performance is biased upward. Funds can voluntarily stop reporting
6 This was computed for the non-wrap accounts. Wrap account expenses include trading
costs that are not included in expenses for mutual funds. Including wrap accounts would raise average expenses by 2 b.p.

The Performance of Separate Accounts and Collective Investment Trusts Page 15 Elton, Gruber and Blake – June 21, 2012
data to Morningstar whenever they wish to do so. This can lead to several sources of bias. The
most serious source of bias, which is found in many data sources, is survivorship bias. This
occurs when funds that do not survive (or in this case cease to report data to Morningstar) have
their past records removed from the database. Fortunately, this is not a problem with Morningstar
because during our sample period they maintained the history of funds that stopped reporting
data.7
The size of the bias that would be present if accounts had their history removed can be
determined by examining the history of accounts that stopped reporting. The average alpha for
the funds that stopped reporting is −0.1226 per month or about −1.35% a year. The performance
is even worse in the last year before they cease reporting. The alpha in the last year is −0.1777
per month or −2.3% per year, where a fund’s alpha is computed as the last year's average
residual plus the fund’s overall alpha.
While survivorship bias is not present in the Morningstar database, there is a form of bias
associated with voluntary reporting that is present. Data are reported to Morningstar with a lag of
up to six months. If a fund has bad performance in a month or two, it might delay supplying data
to Morningstar up to the six-month period to see if results are positive. If results are not
satisfactory, it may stop reporting and one would not observe the last six-month results.8 This
means that the returns we see could be upward-biased.
7 There is some evidence that Morningstar has recently changed its policy and is now
removing past data on an account if a manager of that account requests them to do so. Based on several telephone conversations with Morningstar and examination of the number of funds with history that terminated earlier, it appears to be a recent phenomenon.
8 Elton, Gruber and Rentzler (1987) were able to obtain data on commodity funds after they stopped reporting and found that our conjecture of negative returns after they stop reporting was present for that sample.

The Performance of Separate Accounts and Collective Investment Trusts Page 16 Elton, Gruber and Blake – June 21, 2012
This might not be as serious a bias as it first appears, for two reasons. First, the number of
funds that stopped reporting is not large. On average, 48 funds a year stop reporting in our
sample of 2,627 separate accounts. Second, it is important for an account to be included in the
database because the database is used by investors choosing among account managers. Thus a
manager with a few months of bad performance has to balance the cost of revealing that bad
performance against the cost of not being included in the database.9 Nevertheless, this presents a
potential source of upward bias, the magnitude of which cannot be estimated.
There is another potential source of upward bias. Since separate account managers supply
data to Morningstar on a voluntary basis, the data are likely to suffer from self-selected bias. If
an account is started and is performing badly, it is not likely to supply data to Morningstar. If it
does well it is likely to supply data. This should be mitigated by the fact that Morningstar does
not allow accounts to enter with past data. In addition, there was almost no change in results
when we did not include the first year of account data.
All of the influences are likely to impart an upward bias to estimates of alpha for
separately managed accounts. Given that bias exists, what can be said about performance? A
performance of between −15 and −21 b.p. per year is consistent with, but slightly below, the
performance of institutional index funds. The performance of the lowest cost institutional index
funds (depending on the index chosen) tends to be in the range of −3 to −25 b.p. per year. In the
absence of bias, separate accounts tend to produce about the same performance as index funds.
Given the biases inherent in separate account data, it appears that separate accounts
underperform index funds.
9 While it is possible to drop out of the database for a period of time and re-enter later,
this is an extremely rare event.

The Performance of Separate Accounts and Collective Investment Trusts Page 17 Elton, Gruber and Blake – June 21, 2012
Returning to the comparison with mutual funds, separate accounts have alphas after
expenses 49 b.p. higher than mutual funds. Are these differences real, or are they due to the
biases in the data discussed above? While part of this difference is no doubt due to bias, more
accurate estimates of the relative performance of mutual funds and separate accounts will have to
await the development of better data.
In addition to alpha we also examined the risk of mutual funds compared to separate
accounts. For each sample we computed both the standard deviation of total returns and the
standard deviation of residuals. Mutual funds and separate accounts were then grouped into the
nine groups shown in Table 2 and then an overall standard deviation was computed. Total risk of
separate accounts was 2% less than mutual funds and residual risk was 6% higher. These
differences are not economically meaningful and not statistically significant. Thus along risk
dimensions mutual funds and separate accounts are virtually identical.
VI. Performance and Account Characteristics
One of the interesting issues is what characterizes accounts that perform well and those
that perform poorly. In our choice of potential variables we will draw heavily from the mutual
fund literature. One of the characteristics of better-performing mutual funds is they have lower
expenses (see Brown and Goetzmann (1995), Grinblatt and Titman (1992), Elton, Gruber and
Blake (1996b) and Carhart (1997). Total expenses consist of two components: direct charges and
trading expenses. We do not have a direct measure of trading costs. However, we do have a good
proxy: turnover. Thus the first two variables we will examine are expense ratios and turnover.
We expect similar results to the mutual fund literature, namely that higher expenses, whether
direct charges or trading expenses, are negatively related to alpha. The third variable we

The Performance of Separate Accounts and Collective Investment Trusts Page 18 Elton, Gruber and Blake – June 21, 2012
examine is log of initial purchase. Larger initial commitments are likely to involve greater
diligence on the part of the investor, and are more likely to mean that the investor is an
institution or a very wealthy individual who employs professional guidance and thus is more
sophisticated and better able to select superior funds. Thus we would expect a positive
relationship between the size of the initial purchase and alpha.10
The next two variables we examine measure the concentration of the portfolio. These
variables are the percentage of the portfolio in the top ten securities and the number of securities
held long. Although both are measures of concentration, they measure different aspects of
concentration and are weakly negatively correlated. A positive coefficient for percentage of
securities in top ten holdings and a negative coefficient for number of securities held long would
indicate that managers place larger amounts in the securities they are most optimistic about. If
there is skill in selecting account managers, we would expect a positive relationship with
percentage in top ten securities and negative with number of securities held long.
The next set of variables we examine measures size: the log of assets in a single SMA or
CIT, and the log of assets across all accounts in the managing firm. Berk and Green (2004) argue
that successful mutual funds grow, and when the fund grows, superior performance disappears. If
this hypothesis held for separate accounts, we would expect to see a negative relationship
between assets in a single separate account and alpha. Separate accounts that are members of
large families have access to more research, and this should improve performance (see Gasper,
Massa and Matos (2006) for mutual funds). Thus we would expect a positive sign for this
variable.
10 Larger initial purchase also means lower expense ratios. The correlation between
expenses and initial purchase size is negative but small.

The Performance of Separate Accounts and Collective Investment Trusts Page 19 Elton, Gruber and Blake – June 21, 2012
Our last variable is the absolute value of the cash flow into an account. This is measured
as the absolute value of total net assets at t minus the quantity of total net assets at t − 1 times the
return over the year, all divided by total net assets at t − 1. Thus it measures the absolute value of
the percentage change in total net assets not accounted for by earnings on existing assets. We
would expect that large changes in assets are disruptive to performance and would thus cause
this variable to be negatively related to performance.
In addition to the quantitative data discussed above, Morningstar reports a number of
descriptive variables. These include indicators of the type of legal organization (e.g., corporation
or partnership), the type of business supervising the account (e.g., bank) , whether there is
pending litigation against the firm, whether the product is primarily an institutional or retail
product, and whether or not the account is a CIT or SMA.
The legal structure of the firm offering separate accounts might well have implications
for the performance of separate accounts they manage. While there are data placing any firm
managing separate accounts into one of six categories by organizational structure, these
categories have two interesting dimensions: whether the income to the supervising firm is taxed
as a corporation or as a partnership, and whether the investors in the firm have limited liability or
not. These choices have major implications for the partners or stockholders in the firm managing
the separate account, and that, no doubt, affects the choice of tax treatment and limited liability.
These same influences could also have implications for the type of investments the firm chooses
for any account.
If owners are taxed as a partnership, the profits from running the business flow through
directly to them and they may be more motivated to work harder and increase returns. Thus

The Performance of Separate Accounts and Collective Investment Trusts Page 20 Elton, Gruber and Blake – June 21, 2012
when we introduce a dummy variable to represent those accounts where profits flow directly to
managers, we expect the sign to be positive. Similarly, when the partner or stockholder has
limited liability we would expect that this allows investment managers to select from a wider
range of investment alternatives and this might improve performance. Here we introduce a
dummy variable for limited liability, and we expect it to enter a regression with a positive sign.11
The next discrete variable we examine is the type of sponsoring organization. Separate
accounts may be run by banks, brokers, consultants and independent investment advisors. We
have no priors as to which type of sponsor is superior, so we don't formulate any hypothesis
about the difference in performance, but we do examine it.
There are three other discrete variables that might affect performance. The first is a
pending lawsuit against the organization sponsoring the separate accounts. We would expect that
funds that had a lawsuit outstanding would have, in general, poor governance and would perform
worse than funds that had no lawsuits outstanding.12
The next variable we examine is whether the account is a retail account, an institutional
account, or both. While we do not have a strong theory, we would expect institutional accounts
to be better run simply because they are bought by more knowledgeable investors with the help
of a research staff. Finally, we examine the impact on alpha of the classification of an account as
a separate account or a CIT.
Table 6 presents our results.13 Two regressions are presented, one with dummies and one
11 Note that there are forms of organizations that are taxed as partnerships but have
limited liability. Thus the dummy variables take on different values and they are not redundant. 12 See Brown, Goetzmann, Liang and Schwarz (2011). 13 The sample sizes are much smaller since many separate accounts do not have data on
all the variables. The principal variable missing data is turnover. Re-estimating the regressions

The Performance of Separate Accounts and Collective Investment Trusts Page 21 Elton, Gruber and Blake – June 21, 2012
without. Examining the two regressions shows that the inclusion of dummies does not affect the
sign or significance of any of the non-dummy variables. However, the inclusion of dummies
does increase the explanatory power and the significance of the variables.
Examining the expense variables, we see that they have the expected sign. Both higher
turnover and higher expenses are associated with lower alpha. Both coefficients are highly
significant, and the results are consistent with the mutual fund literature. The log of minimum
initial purchase is positive and highly significant. This is consistent with more sophisticated
investors selecting better-performing funds. The concentration measures are also significant. An
increase in the percentage in the top 10 assets or a decrease in number of holdings leads to an
increase in alpha. Both are highly significant and consistent with concentration improving
performance. The two size variables and the cash flow variable discussed earlier are not included
in Table 6. While all three variables had the expected sign, none of the three variables were close
to significant. Thus there is no evidence for separate accounts that account size, the size of the
family they belong to or changes in assets under management affect alpha.
The impact of the discrete variables on performance is shown in the top regression in
Table 6. When we examine the form of the organization for the firms managing separate
accounts, we study two aspects of the organizational structure: limited liability and taxed as a
partnership or corporate entity. We hypothesized that limited liability would give management
the ability to have more freedom and be more adventuresome in the assets they choose. Thus the
coefficient on the dummy associated with limited liability should be positive and statistically
without this variable (and thus having a much larger sample) does not affect the sign or significance of the other variables and the magnitude is virtually unchanged.

The Performance of Separate Accounts and Collective Investment Trusts Page 22 Elton, Gruber and Blake – June 21, 2012
significant, and it is.
We hypothesize that, if sponsoring firms are taxed as partnerships, it will lead to greater
effort by the managers and a smaller and more sophisticated ownership structure. We use a
dummy variable for sponsors that are taxed on a flow-through basis. The coefficient of the
dummy variables is positive and statistically significant at the 5% level.
The next set of variables we examined was the primary business of the sponsoring
organization. We used individual dummies for banks, brokers, consultants and independent
investment advisors. The null was firms that signified they were “other.” By far the bulk of the
accounts were managed by independent investment advisors. They also had the largest positive
impact on alpha, though the impact was not statistically significant. All of the other categories
had negative dummy variable coefficients, with only the broker dummy variable being close to
statistically significant.
Two other results were not significant and so the results are not reported in Table 6. We
found no statistical significance difference in performance where a fund was a CIT or a managed
account. Finally, we found no relationship between pending lawsuits and performance of the
separate accounts.
VII. Cash Flow Determinants
In the last section we reviewed the determinants of alpha in a cross section of the funds in
our sample. In this section we examine cash flow to see if we can establish the variables that
affect cash flow. While the methodology we use is different from that used in the previous
section, many of the variables we examine are the same.
Since the cash flow variable is available on a yearly basis and since some of the variables

The Performance of Separate Accounts and Collective Investment Trusts Page 23 Elton, Gruber and Blake – June 21, 2012
determining cash flow are available on a yearly basis, we performed yearly cross-sectional
regressions and used the standard Fama-MacBeth (1973) methodology to determine the
significance of the independent variables across our yearly cross-sectional regressions.
The dependent variable for each cross-sectional regression was the annual cash flow for
that year for each fund. For cash flow we use the definition described earlier as the end-of-year
asset value minus the quantity the beginning-of-year asset value times the rate of return for the
year, all divided by the beginning of the year asset value.
The first independent variable examined is the lagged performance of each account.
There is an extensive literature for mutual funds that shows that cash flow is positively related to
past performance.14 We expect to see a similar relationship for separate accounts. The
performance measure we used was the alpha from our four-index model (over the full time
period for which we had data) plus the sum of the monthly residuals for the year in question.15
Examining Table 7 shows that cash flow is positively related to past performance and the
relationship is statistically significant at the 0.01 level.
The next variable we introduced was the natural logarithm of total asset value. Alpha was
not related to this variable, while here we find cash flow is negatively related to size at a
statistically significant level. Why might this occur? Cash flow is computed as a percent of
assets under management. It is extremely difficult for a very large firm to grow at the same
percentage rate as a small firm.16
14 For example, see Gruber (1996). 15 Given the number of variables in the time series estimation of alpha, separately
computing alpha for each year would not be an efficient way of estimating performance. 16 Reformulating the cash flow variable as dollar cash flow reversed the sign of the

The Performance of Separate Accounts and Collective Investment Trusts Page 24 Elton, Gruber and Blake – June 21, 2012
As discussed in the last section, expenses are negatively related to performance. Thus we
would expect that higher expenses lead to lower cash flows. However, investor expenses also
represent the investment managers' profit and provide funds for marketing effort. Thus higher
expense funds provide the investment manager with a greater incentive to aggressively pursue
new business and the revenue to do so. These two factors work in opposite directions. As shown
in Table 7, cash flows are positively related to expenses. Thus for this set of investment products
the incentive influence seems to dominate. This is consistent with the results found in previous
research on mutual funds provided by Sirri and Tufano (1998) and Elton, Gruber and Blake
(2003).
Pending litigation is a dummy variable that is 1 if there is pending litigation. We find no
effect on cash flows for this variable. Pending litigation could come about because the
investment manager is pushing the limit on types of investments or because of practices that
could harm the investor. It seems that pending litigation does not affect cash flows.
The next variable we examined was whether cash flows to combined separate accounts
were affected by which customers they were appealing to. There are three possibilities: a retail
focus, an institutional focus, or both. When we included either the institutional or both as a
dummy variable, the result was that neither was significant and both had coefficients close to
zero. Retail focus comes in with a positive sign and a significance close to the 5% level.
Including a second dummy for another focus variable did not affect its magnitude. If any focus
affects cash flow, it is a retail focus.
The next variable we examined was whether the combined separate account was a CIT.
relationship.

The Performance of Separate Accounts and Collective Investment Trusts Page 25 Elton, Gruber and Blake – June 21, 2012
This variable is highly negatively significant, implying that CITs get fewer cash flows than
SMAs.
The last two variables measure corporate structure: first, whether it has limited liability,
and second, whether income is distributed as a partnership. Both affect cash flows positively and
significantly at better than the 1% level. As shown earlier, both of these are positively related to
alpha. In addition, partnership structure likely affects investment manager effort.
VIII. Conclusion
Despite the size and important of separate accounts, there has been no study of separate
accounts in the literature. The principal reason for this is the lack of data on separate accounts. In
this paper we analyze a ten-year span of data on 2,627 separate accounts. We find that separate
accounts perform no better and perhaps worse than index funds but can be more attractive than a
matched sample of mutual funds. This is true when performance is judged by the four-factor
Fama-French-Carhart model or by a five-factor model that adds a micro stock index. A caution
is in order, for while our sample is corrected for survivorship bias, there may still be some bias
due to accounts not reporting the last few months of data when they disappear from the database.
Performance can also be judged by using the benchmark which management selects as
most appropriate for each account. It is clear that management exhibits some ability to select
benchmarks which make their performance look good. When using the management-selected
benchmark, separate account performance looks much better than when an index that best fits the
return on the account or the four- or five-index model are used.
In a later section of this paper we show account performance is related to a number of
variables. Expenses, whether measured directly via the expense ratio or indirectly through

The Performance of Separate Accounts and Collective Investment Trusts Page 26 Elton, Gruber and Blake – June 21, 2012
turnover, negatively affect performance. Concentration, the size of the initial purchase and the
managing firm organized as a limited liability entity but where cash flows are distributed as a
partnership positively affect performance.
Finally, like mutual funds, past performance positively impacts cash flows into the
separate account. Furthermore, cash flows are higher for SMAs, separate accounts with larger
minimum initial purchase and for those cases where the managing firms have limited liability but
where income is distributed as a partnership. Larger separate accounts have a smaller percentage
increase in net assets.

The Performance of Separate Accounts and Collective Investment Trusts Page 27 Elton, Gruber and Blake – June 21, 2012
Table 1 – Characteristics of Separate Accounts and Mutual Funds
Panel A, Part 1 – Combined Separate Accounts
Aggregate Size of
Account (in thousands)
Number of
Customers in an Account
Minimum Investment
(in thousands)
Number of
Stock Holdings
% Assets in Top 10
Expense Ratio %
Turnover %
Median 152,410 12 5,000 63 28.8% 0.81% 60.6% 10% 3,090 2 100 32 16.2% 0.44% 22.5% 25% 25,000 4 1,000 43 22.2% 0.61% 35.8% 75% 692,000 45 10,000 97 35.9% 0.98% 95.6% 90% 2,091,200 187 25,000 164 44.0% 1.53% 145.1%
Panel A, Part 2 – Mutual Funds
Aggregate Size of Mutual
Fund (in thousands)
Minimum Investment
(in thousands)
Number of
Stock Holdings
% Assets in
Top 10 Stocks
Expense Ratio %
Turnover %
Median 403,703 1,000 79 26.3% 0.93% 85. 4% 10% 17,279 1,000 41 14.7% 0.65% 35.0% 25% 95,115 1,000 56 20.6% 0.79% 53.7% 75% 1,032.196 5,000 114 32.9% 1.10% 120.3% 90% 2,533,428 5,000 195 41.8% 1.27% 169.0%
Panel B Aggregate
Size of Strategy
(in thousands)
Number of Customer
Accounts in Strategy
Minimum Investment (in thousands)
Number of
Stock Holdings
% Assets in Top 10
Expense Ratio %
Turnover %
Separate Account
162,430
12
5,000
62
28.8%
0.82%
60.0%
CIT 55,697 14 5,000 79 29.1% 0.72% 73.2%
This table contains data on categories of separate accounts and a matched mutual fund sample. The aggregate size of an account represents the dollars invested in a particular account or mutual fund, while the number of customers in an account is the number of individuals and institutions that are in that account. The remaining columns are self-explanatory. Panel B is parallel to Panel A except that we separate the combined separate accounts into CITs and SMAs.
The Performance of Separate Accounts and Collective Investment Trusts Page 28 Elton, Gruber and Blake – June 21, 2012
Table 2
Panel A, Separate Account Alphas
Manager- Preferred Benchmark
Number of. Funds
Manager-Preferred Benchmark Alpha
Best-Fit Alpha
4-Factor Model Alpha
5-Factor Model Alpha
Large-Cap Growth 337 0.0898 -0.0335 -0.0577 -0.1019 Large-Cap Blend 677 0.0887 0.0087 -0.0389 -0.0351 Large-Cap Value 265 0.0871 0.0505 0.0048 0.0481 Mid-Cap Growth 182 0.0860 0.0125 0.0483 -0.0329 Mid-Cap Blend 154 0.0472 0.0527 0.1031 0.0308 Mid-Cap Value 110 0.0814 0.1021 0.1511 0.0971 Small-Cap Growth 186 0.1020 0.0332 -0.1112 -0.0633 Small-Cap Blend 185 0.1198 0.0713 -0.0532 -0.0355 Small-Cap Value 153 0.1687 0.1551 0.0637 0.0865 Other 70 0.0997 0.0156 -0.0649 0.0086 Overall Manager-Preferred
2319 0.0945 0.0318 -0.0123 -0.0174
Overall Entire Sample
2627 0.0324 -0.0141 -0.0202
Panel B, Open-end Fund Alphas
Morningstar Category Num. Funds 4-Factor Model Alpha 5-Factor Model Alpha
US OE Large Growth 156 -0.0900 -0.1289
US OE Large Blend 112 -0.1203 -0.1127
US OE Large Value 80 -0.0395 0.0125
US OE Mid-Cap Growth 80 0.0128 -0.0790
US OE Mid-Cap Blend 33 0.0506 -0.0619
US OE Mid-Cap Value 36 0.1411 0.1005
US OE Small Growth 88 -0.2020 -0.1637
US OE Small Blend 39 -0.0264 -0.0145
US OE Small Value 27 -0.0080 0.0139
Overall Entire Sample 651 -0.0644 -0.0785
Panel A divides the sample of combined separate accounts into 10 categories according to the manager-selected benchmark for each account. The row labeled "Overall Entire Sample" in Panel A includes, in addition to the separate accounts included in the row labeled "Overall Manager Preferred," the separate accounts for which no manager-selected benchmark was available. The second column in Panel A shows the number of separate accounts in each aggregate category of manager-preferred benchmarks. The third column in Panel A shows the alphas for each category, where the alphas were computed using a single-index model based on the indicated category. The fourth column in Panel A shows the alphas for each category, where the alphas were computed using a single-index model based on the index that best fit the return data for a given separate account. The alphas in the fifth column were computed using the familiar Fama-French-Carhart 4-factor model. Finally, the alphas in the sixth column were computed using a 5-factor model consisting of the Fama-French-Carhart 4-factor model with an added micro-cap stock index, where the index was the residual excess return from regressing the excess return of a micro-cap stock index on the Fama-French-Carhart 4-factor model. Panel B divides a sample of open-end mutual funds with minimum investments of $1 million into Morningstar categories, and presents the number of funds in each category along with the alphas from the 4-factor and 5-factor models as described above.

The Performance of Separate Accounts and Collective Investment Trusts Page 29 Elton, Gruber and Blake – June 21, 2012
Table 3
Number of Separate Accounts: Best-Fit Benchmarks and Manager-Preferred Benchmarks
Manager Preferred benchmark
Best fit benchmark Large-Cap Mid-Cap Small-Cap
Growth Blend Value Growth Blend Value Growth Blend Value Large-Cap Growth 199 56 1 1 1 0 0 0 0
Large-Cap Blend 69 448 50 0 2 1 0 1 0
Large-Cap Value 0 78 185 0 0 0 0 0 0
Mid-Cap Growth 50 27 0 139 24 0 57 6 0
Mid-Cap Blend 18 47 6 39 105 43 22 64 18
Mid-Cap Value 0 18 23 0 17 66 1 20 59
Small-Cap Growth 1 2 0 2 4 0 96 13 1
Small-Cap Blend 0 1 0 1 0 0 10 69 24
Small-Cap Value 0 0 0 0 1 0 0 12 51
Total 337 677 265 182 154 110 186 185 153
There were 2,249 accounts analyzed.
For each manager-preferred benchmark, this table shows the number of separate accounts that are best fit by each of nine benchmarks.

The Performance of Separate Accounts and Collective Investment Trusts Page 30 Elton, Gruber and Blake – June 21, 2012
Table 4
Separate Accounts Differential Alphas
Manager-Preferred benchmark
This table shows the difference in alpha when a manager chooses a benchmark index which is different from the one that best fits the pattern of the separate account's returns. A positive number indicates that the manager obtained a higher alpha with the chosen benchmark index. "NA" indicates that there were five or fewer observations. The row labeled "Average" shows weighted averages of the numbers in the respective columns. The entities in the row labeled "Average" show how much higher the alpha is when measured by each manager's preferred benchmark compared with the best-fit benchmark.
Best-Fit Benchmark Large-Cap Mid-Cap Small-Cap
Growth Blend Value Growth Blend Value Growth Blend Value
Large-Cap Growth ------ 0.0221 NA NA NA NA NA NA NA
Large-Cap Blend 0.2051 ------ -0.0440 NA NA NA NA NA NA
Large-Cap Value NA 0.1336 ------ NA NA NA NA NA NA
Mid-Cap Growth 0.2993 0.1852 NA ------ -0.0392 NA 0.0427 -0.1694 NA
Mid-Cap Blend 0.5063 0.4038 0.3560 0.3219 ------ -0.0485 0.3012 0.0868 0.0462
Mid-Cap Value NA 0.4248 0.4038 NA 0.1944 ------ NA 0.2517 0.0494
Small-Cap Growth NA NA NA NA NA NA ------ -0.2351 NA
Small-Cap Blend NA NA NA NA NA NA 0.3225 ------ -0.0778
Small-Cap Value NA NA NA NA NA NA NA 0.2337 ------
Average 0.279 0.192 0.117 0.322 0.059 -0.049 0.138 0.081 0.019

The Performance of Separate Accounts and Collective Investment Trusts Page 31 Elton, Gruber and Blake – June 21, 2012
Table 5
Differential Betas
(Implicit Benchmark Betas Minus Four-Factor Betas)
Manager Prefrered
Benchmark
Number of Funds Market Small-Minus-Big High-Minus-Low Momentum
Large-Cap Growth 337 -0.0489 -0.0895 -0.0797 -0.0605
Large-Cap Blend 677 -0.0061 -0.0836 -0.0100 -0.0171
Large-Cap Value 265 -0.0066 -0.0627 0.0690 0.0148
Mid-Cap Growth 182 -0.0629 -0.0241 -0.0636 -0.0778
Mid-Cap Blend 154 -0.0155 0.0125 0.0208 -0.0618
Mid-Cap Value 110 -0.0060 -0.0460 0.0665 0.0168
Small-Cap Growth 186 -0.0634 0.0758 -0.0165 -0.0566
Small-Cap Blend 185 -0.0327 0.0723 -0.0172 0.0074
Small-Cap Value 153 -0.0642 0.0395 0.1239 0.0113
Total Funds 2249
This table shows the difference in implicit benchmark betas and betas obtained from the Fama-French-Carhart 4-factor model. Implicit benchmark betas are computed as the product of the beta of the fund returns on the manager- preferred benchmark index and the beta of that benchmark index returns on the specified Fama-French-Carhart factor.

The Performance of Separate Accounts and Collective Investment Trusts Page 32
Elton, Gruber and Blake – June 19, 2012
Table 6
Alpha Cross-Sectionally Regressed on Explanatory Variables
This table shows the results from cross-sectional regressions of the separate account Fama-French-Carhart 4-factor alphas on two sets of explanatory variables. The first set includes a series of dummy variables; the second set does not. t-values are shown in parentheses.
Log of Min. Bank Broker Consultant Independent Limited
Adjusted Average Assets in Number of Average Initial Adviser Adviser Adviser Adviser Corporation Partnership
Obs. R-Square Intercept Turnover Top 10 Holdings Expenses Purchase Dummy Dummy Dummy Dummy Dummy Dummy
1326 0.0733 -0.2179 -0.0003 0.0018 -0.0002 -0.6267 0.0121 -0.0430 -0.0643 -0.0340 0.0161 0.0612 0.0235
(-3.078) (-3.170) (3.2158) (-3.044) (-4.467) (3.321) (-1.385) (-1.716) (-0.568) (1.005) (3.499) (1.821)
1326 0.0600 -0.1187 -0.0003 0.0020 -0.0002 -0.6248 0.0105
(-1.884) (-3.4074) (3.5348) (-3.251) (-4.429) (2.919)

The Performance of Separate Accounts and Collective Investment Trusts Page 33 Elton, Gruber and Blake – June 21, 2012
Table 7
Separate Account Cash Flow Regressed on Explanatory Variables
(Averages and t-values of Nine Annual Cross-sectional Regressions)
This table shows the averages and t-values across a set of nine annual cross-sectional regressions of cash flow on a set of explanatory variables. Lagged alpha is the overall annualized alpha plus the prior year's average residual. t-values are shown in parentheses.
Intercept
Lagged Alpha
Log of Firm Total
Assets
Average Expenses
Log of Min.
Initial Purchase
Pending
Litigation Dummy
Retail
Product Dummy
Collective Investment
Trust Dummy
Limited Liability Dummy
Partnership Dummy
Average -9.971 4.759 -4.412 27.596 7.006 5.413 73.614 -37.430 29.813 20.047
t-Value (-0.165) (4.529) (-2.473) (1.948) (2.522) (0.447) (1.797) (-4.075) (2.942) (3.155)

The Performance of Separate Accounts and Collective Investment Trusts Page 34
Elton, Gruber and Blake – June 19, 2012
Bibliography
Berk, Jonathan and Green, Richard (2004). Mutual fund flows and performance in rational markets. Journal of Political Economy 112:1269-1295. Brown, Stephen J. and Goetzmann, William N. (1995). Performance persistence. Journal of
Finance 50:679-698. Brown, Stephen J. Goetzmann, William N.; Liang, Bing; and Schwarz, Christopher. Trust and delegation. Social Science Research Network, (2011). Carhart, Mark M. (1997). On persistence in mutual fund performance. Journal of Finance 52:57-82. Elton, Edwin J.; Gruber, Martin J.; and Blake, Christopher R. (1996a). Survivorship bias and mutual fund performance. Review of Financial Studies 9:1097-1120. Elton, Edwin J.; Gruber, Martin J.; and Blake, Christopher R. (1996b). The persistence of risk-adjusted mutual fund performance. Journal of Business 69:133-157. Elton, Edwin J.; Gruber, Martin J.; and Blake, Christopher R. (2003). Incentive fees and mutual funds. Journal of Finance 58:779-804. Elton, Edwin J.; Gruber, Martin J.; Rentzler, Joel (1987). Professionally managed publicly traded commodity funds. Journal of Business: 60:175-199. Evans, Richard (2010). Mutual fund incubation. Journal of Finance 65:1581-1611. Fama, Eugene F. and French, Ken R. (2010). Luck versus skill in the cross-section of mutual fund return. Journal of Finance 65:1915-1947. Fama, Eugene F. and MacBeth, James D. (1973). Risk, return, and equilibrium: empirical tests. Journal of Political Economy 81:607-636. Gaspar, Jose-Miguel; Massa, Massimo; and Matos, Pedro (2006). Favoritism in mutual fund families? Evidence on strategic cross-fund subsidization. Journal of Finance 61:73-104. Grinblatt, Mark and Titman, Sheridan (1992). The persistence of mutual fund performance. Journal of Finance 47:1977-1984. Gruber, Martin J. (1996). Another puzzle: the growth in actively managed mutual funds. Journal
of Finance 51:783-810.

The Performance of Separate Accounts and Collective Investment Trusts Page 35 Elton, Gruber and Blake – June 21, 2012
Peterson, Mitchell (2009). Estimating standard errors in finance panel data sets: comparing approaches. Review of Financial Studies 22:435-480. Pollet, Joshua and Wilson, Mungo (2008). How does size affect mutual fund behavior? Journal
of Finance 63:2941-2969.

The Performance of Separate Accounts and Collective Investment Trusts Page 36
Elton, Gruber and Blake – June 19, 2012
Bibliography (continued)
Sirri, Eric and Tufano, Peter (1998). Costly search and mutual fund flows. Journal of Finance 53:1589-1622.


![THE INDIAN COMPANIES ACT, 1956 BASIC CONCEPT · PDF fileGroup accounts [sec. 212]: Where the company has subsidiaries and group accounts, than the principle of separate legal entity](https://static.fdocuments.in/doc/165x107/5aaf6f357f8b9a07498d5320/the-indian-companies-act-1956-basic-concept-accounts-sec-212-where-the.jpg)