The peculiar optic, dielectric and x-ray diffraction...
21
September 4, 2005 The peculiar optic, dielectric and x-ray diffraction properties of a fluorinated de Vries asymmetric-diffuse-cone-model ferroelectric liquid crystal Jan P. F. Lagerwall 1* , David Coleman 2 , Eva K¨ orblova 3 , Chris Jones 2 , Renfan Shao 2 , Jos´ e M. Ot´ on 4 , David M. Walba 3 , Noel Clark 2 , and Frank Giesselmann 1 1 Institute of Physical Chemistry, University of Stuttgart, Pfaffenwaldring 55, D-70569 Stuttgart, Germany 2 Department of Physics, Condensed Matter Laboratory, University of colourado, Boulder, CO 80309, USA 3 Department of Chemistry and Biochemistry, University of colourado, Boulder, CO 80309, USA 4 Dept Tecnolog´ ıa Fot´ onica, ETSI Telecomunicacin, Univ. Polit´ ecnica de Madrid, E-28040 Madrid, Spain * E-mail for correspondence: [email protected] Fax: 0049 711 684 2569 Telephone: 0049 711 685 4458 1
Transcript of The peculiar optic, dielectric and x-ray diffraction...
September 4, 2005
The peculiar optic, dielectric and x-ray diffraction properties of a
fluorinated de Vries asymmetric-diffuse-cone-model ferroelectric
liquid crystal
Jan P. F. Lagerwall1∗, David Coleman2, Eva Korblova3, Chris Jones2, Renfan
Shao2, Jose M. Oton4, David M. Walba3, Noel Clark2, and Frank Giesselmann1
1Institute of Physical Chemistry, University of Stuttgart,
Pfaffenwaldring 55, D-70569 Stuttgart, Germany
2Department of Physics, Condensed Matter Laboratory,
University of colourado, Boulder, CO 80309, USA
3Department of Chemistry and Biochemistry,
University of colourado, Boulder, CO 80309, USA
4Dept Tecnologıa Fotonica, ETSI Telecomunicacin,
Univ. Politecnica de Madrid, E-28040 Madrid, Spain
∗ E-mail for correspondence: [email protected]: 0049 711 684 2569Telephone: 0049 711 685 4458
1

Abstract
A newly synthesised semi-fluorinated chiral smectic liquid crystal, W504, is investigated by
electrooptic, dielectric and x-ray scattering experiments. It exhibits a huge dielectric soft mode re-
sponse, strong electroclinic effect and a birefringence which increases considerably with the director
tilt angle θ, typical characteristics of a SmA*-SmC* transition following the de Vries asymmetric
diffuse cone (ADC) model in which the non-zero director tilt in SmC* arises through an ordering
of tilting directions rather than an actual increase in average molecule tilt 〈θmol〉. In W504 a small
increase in 〈θmol〉 of about 4◦ is however detected in the SmC* phase. Although the increase in
molecule inclination is much less than the increase in director tilt θ, saturating close to 30◦, it leads
to a shrinkage of the smectic layers by about 1 A, a result of the large initial molecule tilt in SmA*
, 〈θmol〉SmA∗ ≈ 30◦. The tilting transition in W504 is thus mainly an ADC model disorder–order
transition, but it also has a component of a structural transition. The semi-fluorinated molecular
structure of W504 leads to a very weak electron density modulation along the layer normal, giving
a vanishing form factor in bulk samples which exhibit no (001) x-ray scattering peak. In thin films
the (001) peak is however observed, indicating that the electron density modulation is enhanced
by the breaking of the head-tail symmetry of the liquid crystal phase at the LC-air interface.
2

I. INTRODUCTION
In the research on ferroelectric and antiferroelectric liquid crystals (FLCs and AFLCs),
i.e. materials exhibiting the chiral smectic-C (SmC*) phase or one or more of its variations,
considerable attention has over the last few years been directed towards compounds exhibit-
ing the unusual property of a smectic layer thickness which is essentially independent of the
director tilt angle θ [1–14]. In the SmC* phase the director n is inclined by an angle θ > 0
with respect to the smectic layer normal, k, a geometry which in combination with chirality
results in a spontaneous polarization Ps along n × k [15]. Normally, the layers contract
below the transition from SmA* – where θ ≡ 0 in absence of fields – to SmC* or one of
its AFLC variations. In some compounds this shrinkage is much smaller than expected, a
behaviour which was explained by the Dutch-American crystallographer Adriaan de Vries.
He recognised that one must take into account that the molecules have a non-zero average
inclination 〈θmol〉 away from k even if θ = 0, as in SmA*, a result of the orientational
disorder characteristic of any LC phase [16–19]. The uniaxial symmetry around k and the
absence of director tilt are consequences of the fact that all directions of molecule inclination
are equally probable in the orientational fluctuations.
In de Vries’ scenario for the SmA-SmC transition without layer shrinkage 〈θmol〉 remains
constant, while the increasing director tilt θ > 0 comes about through a gradual azimuthal
biasing towards a certain molecule inclination direction. He referred to this model as the
’asymmetric diffuse cone’ (ADC) model [19], the asymmetry being equivalent to the az-
imuthal biasing present in the SmC phase. The ’diffuse cone’ can be seen as the trajectory
over time of a single molecule fluctuating around n in any LC phase. Recent analysis of the
ADC model has shown that, in the case of chiral smectics, it implies that the birefringence
∆n strongly increases with θ [5] and that the SmA* electroclinic effect and soft mode (field-
induced tilt θ > 0 and the corresponding polarization fluctuation) are unusually large [1, 20].
These properties have indeed been identified in a number of compounds with minimal layer
shrinkage.
So far, ADC behaviour has been found mainly in mesogens that have at least one
terminal chain quite different from standard alkyl chains, e.g. heavily fluorinated chains
[2, 6–8, 10, 11, 13], with a siloxane moiety attached [4, 5, 9], or even with the mesogens
attached to a polysiloxane backbone [12, 14]. In this paper we describe x-ray scattering,
3

dielectric and electrooptic investigations of a new FLC (Figure 1) of the former class,
exhibiting several of the properties typical of ADC materials to a very strong degree, for
instance a huge dielectric response. However, its x-ray scattering response is quite peculiar.
Not only does the compound exhibit stronger layer shrinkage than most ADC materials
investigated so far, but the first-order x-ray scattering peak is essentially undetectable when
studying bulk samples. The new results make it clear that the SmA*-SmC* transition can
involve several mechanisms in parallel, and that even when the ADC model mechanism is
strongly dominant it is not sufficient for achieving temperature-independent smectic layer
thickness.
INSERT FIGURE 1 ABOUT HERE
II. EXPERIMENTAL
The liquid crystal compound, W504 (synthesised in the Boulder chemistry lab), was filled
into cells with three different types of alignment layers: standard commercial polyimide-
coated EHC cells, hard-buffed polyimide-coated cells from the Chalmers MC2 cell produc-
tion line (Gothenburg, Sweden) and nylon-coated cells made in the Madrid cleanroom. The
cells were kept in Instec mK2 or Julabo FP-25 hot stages for temperature control. Sample
texture observations and optic and electrooptic measurements were done using an Olympus
BH-2 polarizing microscope. The optical tilt angle θ and birefringence ∆n were measured
with high resolution using a temperature scanning technique developed by Saipa and Giessel-
mann [21]. The magnitude of the spontaneous polarization Ps was measured by integrating
the polarization reversal current while switching the sample with a triangular waveform
electric field [22]. Dielectric spectroscopy with simultaneous sample texture monitoring was
performed using an HP4192A impedance bridge, a USB video camera (Logitech) and DiScO
measurement software (FLC Electronics).
Three series of X-ray diffraction (XRD) experiments were carried out, in two locations.
In the Stuttgart lab (Cu-Kα generator) the small-angle scattering (SAXS) from unaligned
samples in 0.7 mm diameter Mark capillary tubes was investigated with a Kratky com-
pact camera and a 1D position sensitive detector (A. Paar), and the wide-angle scattering
4

(WAXS) pattern from samples aligned by a 2.5 T magnetic field was determined using a flat
film camera loaded with digital imaging plates (Fuji BAS-SR system). With the National
Synchrotron Light Source at Brookhaven National Laboratory (beamline X10A) experiments
were carried out in reflectivity mode on samples aligned homeotropically on an octadecyl-
triethoxysilane self-assembled monolayer (OTE SAM) as well as in transmission mode on
capillary samples.
III. RESULTS AND DISCUSSION
A. Textures and electrooptic behaviour
Similar to other fluorinated ADC compounds [8] W504 is difficult to align in standard
LC sample cells. Figure 2 shows representative textures in the SmA* and SmC* phases
in the three different cell types used. Nylon has previously been shown to be one of the
best alignment materials for this type of compounds [23] and, indeed, the nylon-coated cell
produced excellent uniform alignment in the SmA* phase (Figure 2a). As the sample was
cooled into SmC*, however, both domain types (corresponding to the two possible in-plane
director tilt directions) developed a director structure with a strong twist from substrate to
substrate. This led to poor maximum extinction and to washed-out colours, changing with
sample orientation and not reflecting the birefringence, in bright orientations, cf. Figure 2 b
and c. This cell was thus not suitable for measurements of the optical properties of W504.
INSERT FIGURE 2 ABOUT HERE
The SmC* twist was much less pronounced in cells coated with polyimide (PI) but the
standard commercial cells (EHC, row 2 in Figure 2) did not impose a uniform direction
of the smectic layer normal, rendering quantitative measurements impossible also with this
cell. However, it is qualitatively clear already from the colour change from yellow to orange
on cooling the 4 µm sample from SmA* (d) to non-helical SmC* (e and f) that ∆n increases
substantially in SmC*, as expected for ADC materials. In the (partially) helical regions the
colour remained yellow, a result of the helical averaging of the optic axis direction decreasing
the effective value of ∆n. The yellow-orange colours also reveal that ∆n is lower than in
5
most smectic compounds, which in a 4 µm cell typically exhibit colours between red and
blue, i.e. at the border between first and second order in the Michel-Levy interference colour
chart.
By using strongly buffed PI cells, we could achieve a sufficiently homogeneous alignment
and at the same time avoid the director twist in SmC*, as shown in the two lowest rows in
Figure 2. Decreasing the cell gap to 1.5 µm a relatively defect-free alignment was obtained
(j - l), allowing quantitative measurements of ∆n and θ. The thin cell gap also assured
complete helix and twist expulsion even in the absence of fields, allowing for measurements
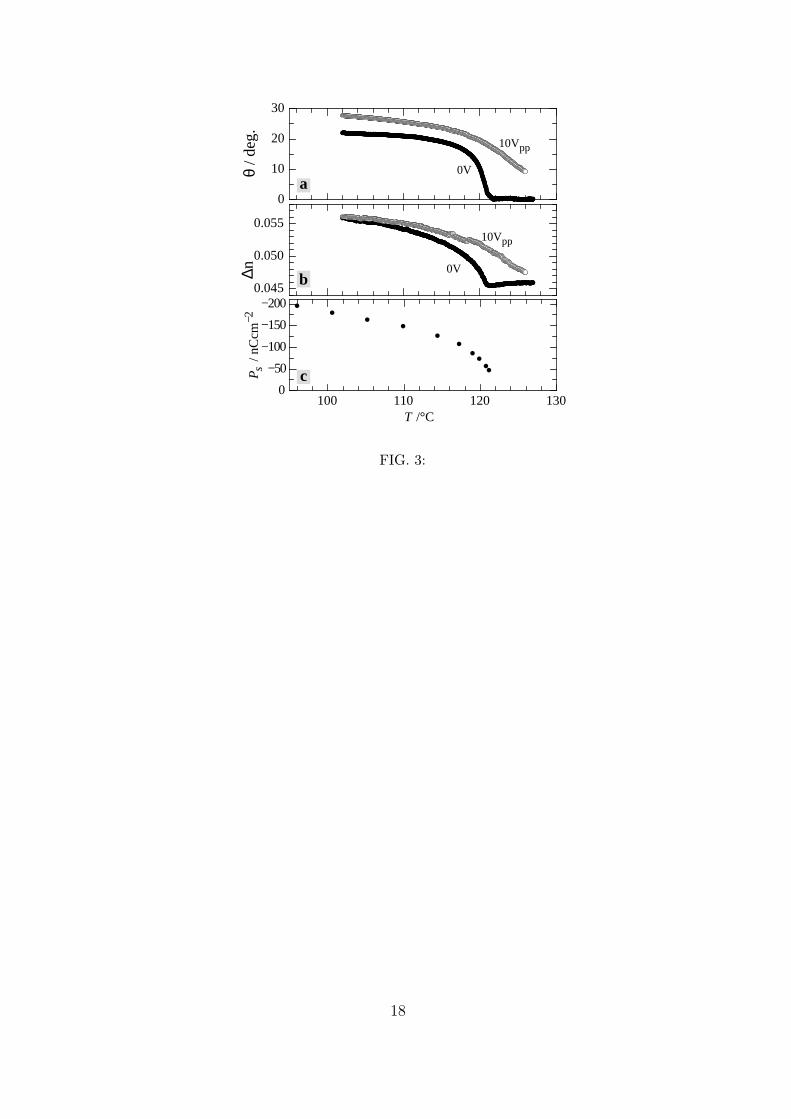
also in the field-free state. The results are shown in Figure 3a and b. In addition to the
remarkably low values of birefringence, the typical ADC characteristic of ∆n increasing
with θ stand out from these measurement results. The birefringence at the low-temperature
limit of SmC* (the first measurements were taken in supercooled SmC*) is about 22%
larger than in field-free SmA*. As is also typical of ADC materials, the magnitude of
the electroclinic effect is very large, with an induced tilt of θ ≈ 10◦ about 5◦C above
the SmA*-SmC* transition, and a corresponding field-induced increase of ∆n. Both the
θ and the ∆n curves are continuous, without any discrete jump around the SmA*-SmC*
phase transition, which thus seems to be of second order. Indeed, DSC measurements at
10 K/min heating and cooling rates could not resolve any transition peak, confirming the
continuous nature of the transition.
INSERT FIGURE 3 ABOUT HERE
B. Spontaneous polarization and dielectric response
The value Ps of the spontaneous polarization is shown as a function of temperature in
Figure 3c. It has a negative sign and reaches the quite substantial value of −200 nCcm−2
(in supercooled SmC*). Considering the high magnitude of Ps a quite strong dielectric
response should be expected, but the actual dielectric spectra that we obtained on a
23.5 µm planar-aligned (PI-coating) sample by far surpassed all expectations. At minimum
measuring field strength, the dielectric loss ε′′ reached values above 500 in the SmC* phase
(Figure 4a), where the response can be attributed to a phason mode corresponding to helix
6

distortion. This was however only about half of the maximum response, which was detected
at the SmA*-SmC* transition and can thus be attributed to the soft mode. Such behaviour
is unheard of in normal FLCs, where the SmC* phason mode is usually much stronger than
the soft mode, but it was recently shown to be a characteristic of chiral ADC compounds
[20]. The strong soft mode is a result of the very weak restoring force counteracting director
tilt (and, consequently, polarization) fluctuations in the ADC mechanism. This peculiarity
follows from the fact that the director tilt in SmC* arises mainly through an azimuthal tilt
direction ordering. With ε′′ almost reaching 1000 at the SmA*-SmC* transition, the soft
mode response of W504 is by far the strongest known to us, even being more than twice as
strong as that of the ADC compound from 3M studied in reference [20]. This difference
scales quite well with the difference in θ − Ps coupling constant, being two to three times
smaller in the 3M compound than in W504.
INSERT FIGURE 4 ABOUT HERE
On increasing the field strength to 20 mV/µm – a quite typical field strength for low-
amplitude dielectric spectroscopy investigations on FLCs – the phason mode absorption grew
drastically in strength, raising ε′′ in SmC* to values around 1600, thereby overshadowing
the soft mode response at the phase transition, cf. Figure 4b. This very strong SmC*
response arises because the measuring field induces not only helix distortion, but even helix
unwinding commences. This was verified by studying the texture photos taken during the
measurement, two examples of which are shown in the insets of Figure 4a and b. The
periodic helix lines were easy to see in the photos taken during the 2 mV/µm scans, but
partially or completely absent during the scans with 20 mV/µm measuring field strength.
Such a low helix unwinding / switching threshold is very unusual among FLCs but it has
been reported also for other ADC compounds, even in the case of AFLCs [7].
In order to make it clear just how huge the dielectric response of W504 is, an absorption
spectrum of (S )-S1B8, a typical non-ADC FLC with similar Ps (saturating at −160 nCcm−2;
see Schacht et al. [24] for more details on this compound), is shown in Figure 4 c. The
measurement was done in the same type of cell, with the same thickness, at 2 and 20 mV/µm,
giving essentially identical spectra. The data are plotted with the same scaling as in a and
b. The phason and soft mode absorptions of S1B8, producing ε′′ values of about 50, are then
7

hardly visible. (Actually, the main absorption seen in c, at low frequencies (10 - 100 Hz), is
not due to the polar nature of the SmC* phase but to a relatively large conductivity of the
sample.)
C. X-ray scattering results
We studied the XRD profiles of W504 both in the small-angle and in the wide-angle
regime. Examples of SmA* and SmC* radial SAXS profiles are shown in Figure 5a and
b as a function of scattering vector magnitude q. During the measurements with Cu-Kα
radiation (a) we noted that the scattering intensity was generally very weak (exposure times
2-5 times longer than usual were used). The biggest surprise was however that no (001)
pseudo-Bragg peak corresponding to the smectic layering could be resolved at any tempera-
ture above crystallization in the expected range of q ∼ 0.18 (equivalent to a layer thickness
of ∼35 A). In the SmA* phase a diffuse increase in intensity could be seen at about twice
this scattering angle (which would correspond to the (002) peak) but this ’bump’ was too
small to do any reliable analysis. The very unusual absence of first-order smectic XRD peak
suggests that the form factor is close to zero, a characteristic which most likely is related
to the electron-rich fluorinated end chain of W504. Although only one chain is fluorinated,
the head–tail symmetry in a bulk LC sample results in an equal number of molecules
where this chain points mainly upwards and downwards, respectively, hence the effective
electron density can be quite similar in core and tail regions. The unusually weak modu-
lation in electron density along the layer normal could thus explain the vanishing form factor.
INSERT FIGURE 5 ABOUT HERE
With the well-aligned OTE-SAM sample investigated at the synchrotron source, diffrac-
tion profiles where the smectic layer peaks are easy to resolve could however be obtained,
even though the intensity of the (001) peak was still much lower than that of (002), cf. Fig-
ure 5b. We speculate that the scattering in the case of the OTE-SAM sample is enhanced by
the breaking of the head–tail symmetry at the LC-SAM and LC–air interfaces. Close to the
sample surface we may expect a large difference in number of molecules aligned fluorine tail
up and down, respectively. As it is the near-surface volume of the sample that contributes
8

to the reflectivity measurement, this experiment would then sense a larger electron density
contrast than during the experiment on bulk samples. Hence the form factor is non-zero,
rendering the (001) peak visible.
In contrast, when repeating the bulk LC measurements on capillaries at the synchrotron,
no (001) peak was visible but a weak (002) peak was observed, just as with the Kratky
camera measurements. In Figure 5 c we present the smectic layer spacing d vs. temperature
obtained from the capillary and OTE samples. While there appears to be a slight shift
in the transition temperatures and in the d-spacing, the data are qualitatively equivalent
indicating that the scattering peak observed in capillary samples is indeed the (002) peak of
the smectic layering and that the form factor is approximately zero at the (001) peak. The
issue of the varying scattering behaviour of W504 in different sample geometries is currently
being investigated more carefully and the results will be reported in a future paper.
We note that the smectic layer spacing in SmA*, ∼35 A, corresponds to an average tilt
of the molecular long axis with respect to the layer normal, 〈θmol〉, of about 26◦ (using
the molecule length obtained with MOPAC / AM1, cf. Figure1). Such a large average
molecule tilt in the SmA* phase is typical for ADC compounds [8, 9], whereas it in ordinary
materials is 15-20◦ [18]. On the other hand, the smectic layers in W504 exhibit a non-
negligible contraction below the SmA*-SmC* transition which is somewhat of a surprise
considering the very strong ADC characteristics observed in the electrooptic and dielectric
response. To understand this we need to investigate the temperature variation of 〈θmol〉.
The best way to assess 〈θmol〉 is to analyse the directional (azimuthal) distribution of the
wide-angle x-ray scattering–originating from the liquid-like intralayer molecular order–in the
SmA* and SmC* phases.
The non-polar and uniaxial orientational order in e.g., a nematic or smectic-A liquid
crystal is described by the orientational distribution function (ODF) f(β) where β denotes
the angle between the long molecular axis and the director of the uniaxially ordered phase.
Since n is co-linear with k in SmA / SmA*, β ≡ θmol in this phase. The ODF is usually
expanded in terms of Legendre polynomials with the expansion coefficients 〈P2〉 , 〈P4〉, . . .
defining the orientational order parameters S2, S4, etc. Experimentally, we can determine
f(β) and the related order parameters in the SmA* phase by analyzing the azimuthal in-
tensity profile I(χ) in the WAXS pattern. The angle χ indicates the scattering direction
and we define it such that the magnetic field is directed along χ = ±90◦. Since n in SmA*
9

aligns with the field, this is also the direction of k.
For our analysis, we use a procedure developed by Davidson, Petermann, and Levelut
[25] where the ODF is expanded in terms of cos2n β-functions:
f(β) =∞∑
n=0
f2n cos2n β (1)
The corresponding WAXS intensity profile can also be written as a series of cos2n χ functions
involving the same f2n,
I(χ) =∞∑
n=0
f2n2nn!
(2n + 1)!!cos2n χ (2)
Hence, by fitting Eq. (2) to the experimental scattering profile I(χ), with the f2n being
the parameters to fit, f(β) can directly be calculated by inserting the fitted f2n into the
expansion in Eq. (1). With f(β) known, any average 〈X〉 of a certain property X that is
related to the orientational distribution can be numerically calculated, e.g. S2, and 〈θmol〉.
In the SmC* phase, however, the WAXS pattern includes the orientational averaging due to
the helical superstructure, hence S2 cannot be extracted (being uniaxially symmetric, the
Legendre polynomial order parameters are not defined in the biaxial SmC* phase).
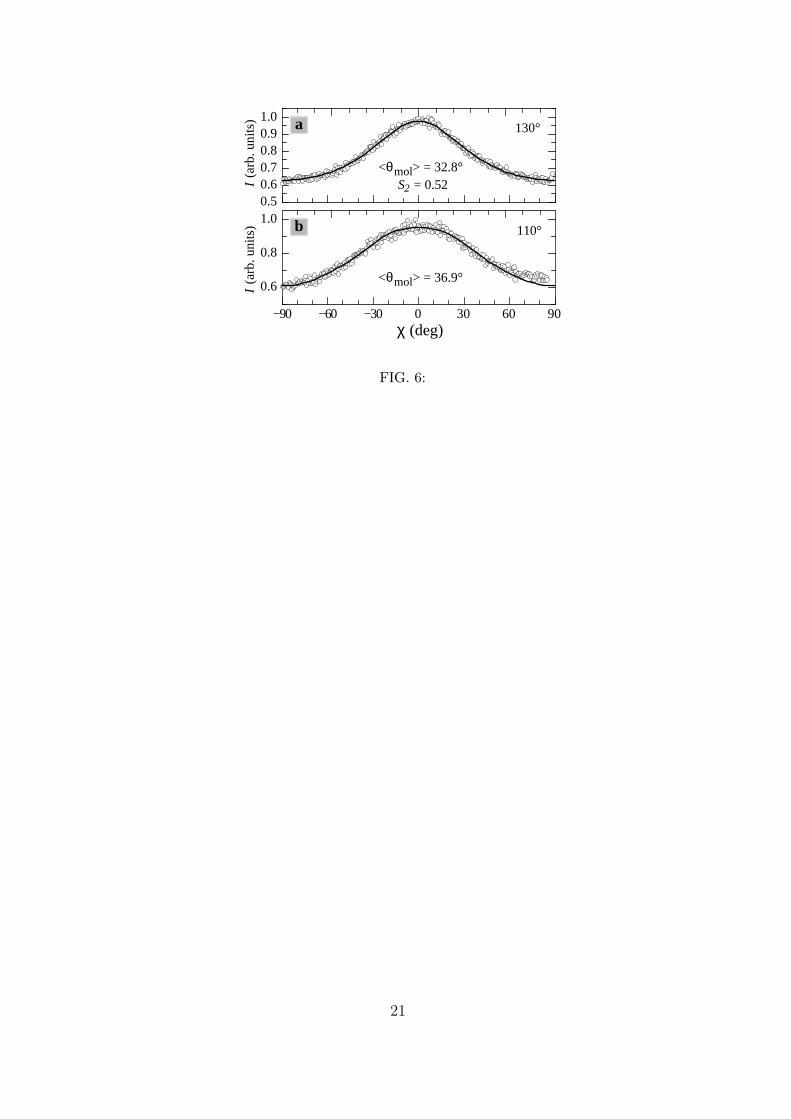
In Figure 6 the WAXS intensities measured in SmA* and SmC* are plotted as a function
of χ, together with the corresponding best fits of Eq. 2. The resulting values of 〈θmol〉 and
S2 are also given. We note that the orientational order determined in the SmA* phase is
remarkably low, S2 = 0.52, corresponding to 〈θmol〉SmA∗ ≈ 33◦. This is a characteristic
that W504 shares with previously investigated ADC materials [8, 9]. However, the value
obtained with this method estimates S2 downwards, i.e. the real (local) orientational order
may be sligthly higher, and 〈θmol〉 slightly smaller. This is because our measurement
averages the order over a macroscopic volume, hence phenomena such as layer undulations
and sample mosaicity contribute negatively to the measured value of S2. However, the
low ∆n values and the fact that the smectic layer spacing in SmA* is much smaller than
the expected molecule length suggest that the local orientational order indeed is low in W504.
INSERT FIGURE 6 ABOUT HERE
When cooling the sample to the SmC* phase, the WAXS profile broadens somewhat,
reflecting a small increase of average molecule inclination, at 110◦C being close to 37◦.
This constitutes an important difference to the ADC material investigated in [8], where
10
d was largely unaffected by the SmA*-SmC* transition and where the WAXS patterns in
SmA* and SmC* could hardly be distinguished. Although the broadening in W504 is small,
corresponding to an increase of 〈θmol〉 of only about 4◦, the large starting value of the
molecular tilt angle gives the increase a considerable impact on d, about 5% shrinkage. Had
〈θmol〉SmA∗ been zero, the tilt increase would have had to be 18 degrees to produce such
shrinkage. Taking d in SmA* to be about 35 A the WAXS analysis would thus predict
a shrinkage of 1.8 A, which is more than the actual shrinkage. This is another indication
that the influence of layer undulations and sample mosaicity on the WAXS pattern produce
apparent 〈θmol〉 values which are too large. The relative increase of about 4◦ should however
be close to the real 〈θmol〉 increase. The much larger increase in the optical tilt angle θ
displayed in Figure 3 is thus due to the strong ADC aspect of the SmA*-SmC* transition
in W504, i.e. it can be attributed mainly to an ordering of tilting directions, in accordance
with the electrooptic and dielectric behaviour of the compound.
IV. CONCLUSIONS
The non-zero director tilt in the SmC* phase of the semi-fluorinated mesogen W504
can be largely attributed to an ordering of tilting directions of molecules which exhibit a
considerable tilt already in the SmA* phase. This compound is thus quite well described by
the asymmetric diffuse cone (ADC) model of Adriaan de Vries, as verified by a birefringence
∆n which increases strongly with director tilt θ, strong electroclinic effect and huge dielectric
soft mode response in the SmA* phase, and a wide-angle x-ray diffraction pattern which
changes relatively little between SmA* and SmC*. However, in contrast to a number of other
ADC smectics which have recently been investigated, there is a non-negligible layer shrinkage
of about 1 A below the SmA*-SmC* transition in W504. This is a result of the large starting
magnitude of the average molecule tilt with respect to the smectic layer normal in the SmA*
phase, 〈θmol〉SmA∗ ≈ 30◦, giving even the small increase of about 4◦ detected on cooling
W504 into SmC* a considerable impact on the layer spacing. Counter-intuitively, through
the large average molecule tilt in SmA*, the ADC aspect thus increases the sensitivity of
the layer spacing to changes in molecule tilt. While a negligible layer shrinkage is still a
strong indication of ADC behaviour, we conclude that it is not a requirement.
X-ray scattering profiles from bulk samples of W504 do not contain any (001) x-ray
11

scattering peak. This highly unusual feature can be understood by considering that the
combination of one fluorinated tail and one ordinary alkoxy tail, taking the head-tail sym-
metry of the bulk liquid crystal phase into account, leads to a very weak electron density
modulation along the smectic layer normal, and thus a vanishing form factor. The head-tail
symmetry is however broken at the liquid crystal–air and liquid crystal–substrate interfaces,
hence a thin film of W504 on an OTE-SAM substrate, examined in reflection, exhibits a non-
zero form factor. Consequently, a (001) scattering peak is then observed in the scattering
profile, allowing for the determination of the smectic layer spacing.
V. ACKNOWLEDGMENTS
J.L. gratefully acknowledges financial support from the Alexander von Humboldt Foun-
dation and from the Swedish Research Council.
[1] F. Giesselmann, P. Zugenmaier, I. Dierking, S. T. Lagerwall, B. Stebler, M. Kaspar, V. Ham-
plova, and M. Glogarova, Phys. Rev. E. 60, 598 (1999).
[2] M. D. Radcliffe, M. L. Brostrom, K. A. Epstein, A. G. Rappaport, B. N. Thomas, R. F. Shao,
and N. A. Clark, Liq. Cryst. 26, 789 (1999).
[3] Y. P. Panarin, V. Panov, O. Kalinovskaya, and J. K. Vij, J. Mater. Chem. 9, 2967 (1999).
[4] M. S. Spector, P. A. Heiney, J. Naciri, B. T. Weslowski, D. B. Holt, and R. Shashidhar, Phys.
Rev. E 61, 1579 (2000).
[5] J. V. Selinger, P. J. Collings, and R. Shashidhar, Phys. Rev. E 64, 061705/1 (2001).
[6] N. A. Clark, T. Bellini, R. Shao, D. Coleman, S. Bardon, D. R. Link, J. E. Maclennan, X. H.
Chen, M. D. Wand, D. M. Walba, et al., Appl. Phys. Lett. 80, 4097 (2002).
[7] F. Giesselmann, J. P. F. Lagerwall, G. Andersson, and M. D. Radcliffe, Phys. Rev. E. 66,
051704 / 1 (2002).
[8] J. P. F. Lagerwall, F. Giesselmann, and M. D. Radcliffe, Phys. Rev. E. 66, 031703 (2002).
[9] P. Collings, B. Ratna, and R. Shashidhar, Phys. Rev. E. 67, 021705 (2003).
[10] S. T. Wang, X. F. Han, Z. Q. Liu, A. Cady, M. D. Radcliffe, and C. C. Huang, Phys. Rev. E.
68, 060702(R) (2003).
12

[11] J. P. F. Lagerwall, F. Giesselmann, A. Saipa, and R. Dabrowski, Liq. Cryst. 31, 1175 (2004).
[12] M. Rssle, R. Zentel, J. Lagerwall, and F. Giesselmann, Liq. Cryst. 31, 883 (2004).
[13] C. Huang, S. Wang, X. Han, A. Cady, R. Pindak, W. Caliebe, K. Ema, K. Takekoshi, and
H. Yao, Phys. Rev. E. 69, 041702 (2004).
[14] M. Rssle, L. Braun, D. Schollmeyer, R. Zentel, J. P. F. Lagerwall, F. Giesselmann, and
R. Stannarius, Liquid Crystals (accepted) (2005).
[15] R. B. Meyer, L. Liebert, L. Strzelecki, and P. Keller, J. Phys. Lett. 36, L69 (1975).
[16] A. De Vries, J. Chem. Phys. 71, 25 (1979).
[17] A. De Vries, Mol. Cryst. Liq. Cryst. Lett. 49, 179 (1979).
[18] A. De Vries, A. Ekachai, and N. Spielberg, Mol. Cryst. Liq. Cryst. Lett. 49, 143 (1979).
[19] A. de Vries, in Advances in Liquid Crystal Research and Applications, edited by L. Bata
(Pergamon Press, Oxford, Budapest, 1980), pp. 71–80.
[20] M. Krueger and F. Giesselmann, Submitted to Phys. Rev. E. (2004).
[21] A. Saipa and F. Giesselmann, Liq. Cryst. 29, 347 (2002).
[22] K. Miyasato, S. Abe, H. Takezoe, and A. Fukuda, Jpn. J. Appl. Phys. Lett. 22, L661 (1983).
[23] M. Radcliffe, Personal communication (2002).
[24] J. Schacht, H. Baethge, F. Giesselmann, and P. Zugenmaier, J. Mater. Chem. 8, 603 (1998).
[25] P. Davidson, D. Petermann, and A. M. Levelut, J. Phys. (Paris) II 5, 113 (1995).
13
Figure captions
1. The molecule under investigation, (S )-W504. The length is the largest core-core dis-
tance resulting from conformational energy minimization with MOPAC / AM1, plus
one F and one H van der Waals radius.
2. Textures of W504 in four different cells. In the left and right columns the sample has
been aligned for maximum extinction (within some uniformly aligned region in c, d, f,
i and l) in the SmA* and in the SmC* phase, respectively. The centre column shows
the SmC* texture with the sample aligned as in the left column. The SmA* pictures
are taken at T = 130◦ and the SmC* pictures at T = 105◦.
3. Optical director tilt angle θ (a), birefringence ∆n (b) and spontaneous polarization
Ps (c) as a function of temperature, the two former measured at 633 nm wavelength
on a 1.5 µm cell in the absence of field and with an electric field ensuring saturated
switching applied.
4. Dielectric absorption spectra from W504 in a 23.5 µm planar-aligned cell (a and b)
at two amplitudes of the measuring field. 20 mV/µm is enough to unwind the helix
in the SmC* phase, as seen in the two examples of texture photos taken during the
measurement. The helix unwinding leads to the large increase in SmC* absorption in
(b). As comparison, the corresponding dielectric spectrum of (S )-S1B8, an ordinary
non-ADC FLC with Ps similar to that of W504, is shown (c) with the same axis
scalings as for W504. The SmA*-C* transition is at 119◦ in S1B8, at 121.5◦ in W504.
5. Small-angle X-ray scattering profiles from a non-aligned sample investigated with
Cu-Kα radiation (a) and from an OTE-SAM-aligned sample investigated at the syn-
chrotron source (b), of W504 in SmA* (140 / 139◦) and in SmC* (110 / 111◦). From
the synchrotron data the smectic layer spacing d as a function of temperature T was
extracted (c).
6. WAXS scattering profile (rings) in SmA* (a) and SmC* (b), the corresponding best fits
of Eq. 2 (black curve) and the resulting average molecular inclination with respect to
the smectic layer normal 〈θmol〉. For the SmA* phase the orientational order parameter
S2 can also be estimated.
14
Figures
15
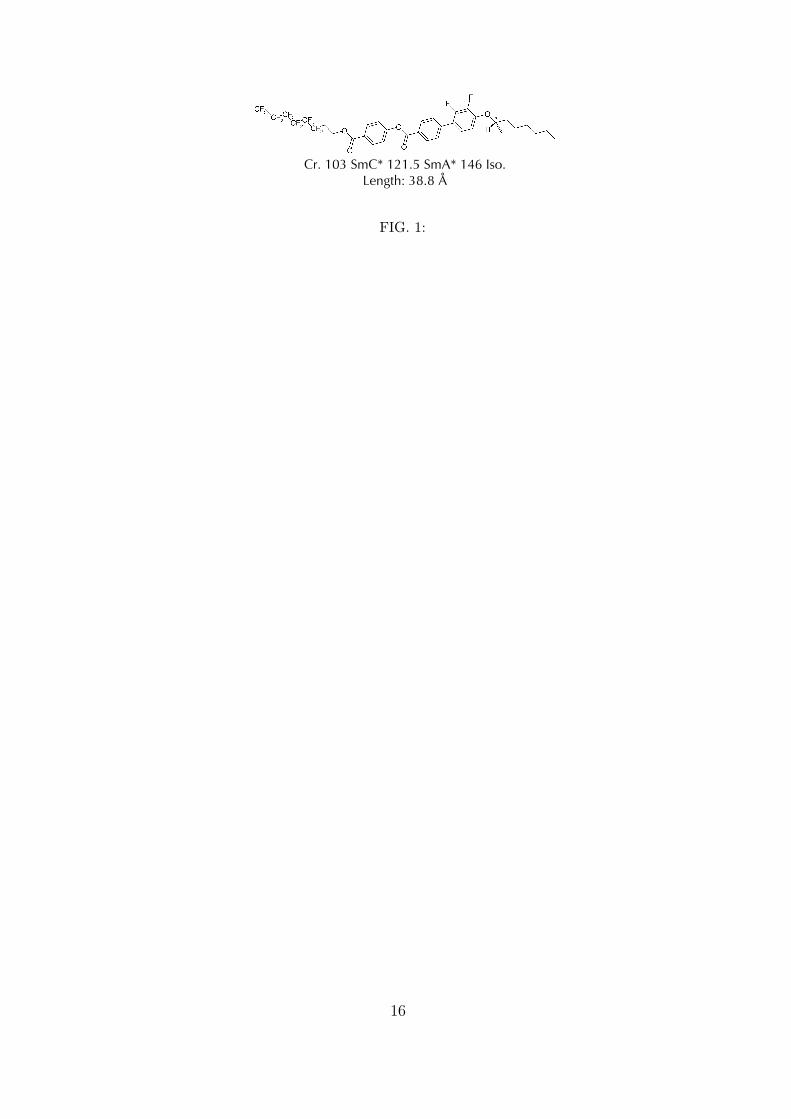
Cr. 103 SmC* 121.5 SmA* 146 Iso. Length: 38.8
FIG. 1:
16

100 m
g EH
C-P
I, 4
m
b
Nyl
on, 4
m
d e f
a
MC
2-P
I, 1
.5
m
c
i h
SmC*SmC*
(max extinction)SmA*
(max extinction)
j l k
MC
2-P
I, 4
m
FIG. 2:
17
0
10
20
30
θ / d
eg.
0.045
0.050
0.055
0V
10Vpp
0V
10Vpp
∆n
100 110 120 1300
−50
−100
−150
−200
T /°C
Ps
/ nC
cm−2
a
b
c
FIG. 3:
18

2mV/µm
20mV/µm
a
b
c
T = 110°C
T = 110°C
20mV/µm
FIG. 4:
19

2
4
6
8
I (a
rb. u
nits
)
0.2 0.3 0.40
2
4
q (Å−1)
I (a
rb. u
nits
)
a
b
17.4 Å34.7 Å
100 110 120 130 140 15033.6
34.0
34.4
34.8
T (°C)
d (
Å)
cOTE−SAM (001)Capillary (002)
110°C140°C
111°C139°C
FIG. 5:
20
0.50.60.70.80.91.0
I (a
rb. u
nits
)
130°
<θmol> = 32.8°S2 = 0.52
−90 −60 −30 0 30 60 90
0.6
0.8
1.0
χ (deg)
110°
<θmol> = 36.9°
a
bI
(arb
. uni
ts)
FIG. 6:
21