The PASCAL Visual Object Classes Challenge 2008...
37
The PASCAL Visual Object Classes Challenge 2008 (VOC2008) Part 1 – Challenge & Classification Task Mark Everingham Luc Van Gool Chris Williams John Winn Andrew Zisserman
Transcript of The PASCAL Visual Object Classes Challenge 2008...

The PASCAL Visual Object Classes Challenge 2008 (VOC2008)
Part 1 –
Challenge & Classification Task
Mark Everingham Luc Van Gool
Chris Williams John Winn
Andrew Zisserman

Dataset: Collection
Images downloaded from flickr
Collected January 2008
500,000 images downloaded and random subset selected for annotation
Queries
Keyword e.g. “car”, “vehicle”, “street”, “downtown”
Date of capture e.g. “taken 21-July”
–
Removes “recency”
bias in flickr
results
Images selected from random page of results–
Reduces bias toward particular flickr
users

Dataset: Annotation
Annotation in one session with written guidelines
20 classes
Bounding box
Viewpoint: front, rear, left, right, unspecified
“Truncated”
flag: Bounding box
object extent
“Occluded”
flag (new in VOC2008): Object is significantly occluded
“Difficult”
flag: Objects ignored in challenge

Examples
Aeroplane
Bus
Bicycle Bird Boat Bottle
Car Cat Chair Cow

Examples
Dining Table
Potted Plant
Dog Horse Motorbike Person
Sheep Sofa Train TV/Monitor

Dataset Statisticstrain val trainval test
Images Objects Images Objects Images Objects Images ObjectsAeroplane 119 159 117 157 236 316 236 316
Bicycle 92 133 100 136 192 269 187 270Bird 166 239 139 237 305 476 304 475Boat 111 170 96 166 207 336 209 337
Bottle 129 229 114 228 243 457 243 457Bus 48 61 52 68 100 129 90 130Car 243 426 223 414 466 840 466 840Cat 159 186 169 192 328 378 331 379
Chair 177 313 174 310 351 623 349 624Cow 37 61 37 69 74 130 76 132
Diningtable 53 55 52 55 105 110 104 110Dog 186 238 202 239 388 477 366 477
Horse 96 139 102 146 198 285 194 286Motorbike 102 137 102 135 204 272 203 273
Person 947 1,996 1,055 2,172 2,002 4,168 1,826 3,757Pottedplant 85 178 95 183 180 361 177 361
Sheep 32 67 32 78 64 145 66 147Sofa 69 74 65 77 134 151 134 151
Train 78 83 73 83 151 166 151 167Tvmonitor 107 138 108 136 215 274 200 274
Total 2,111 5,082 2,221 5,281 4,332 10,363 4,133 9,963

Classification Challenge
Predict whether at least one object of a given class is present in an image
Competition 1: Train on the supplied data
Which methods perform best given specified training data?
Competition 2: Train on any (non-test) data
How well do state-of-the-art methods perform on these problems?
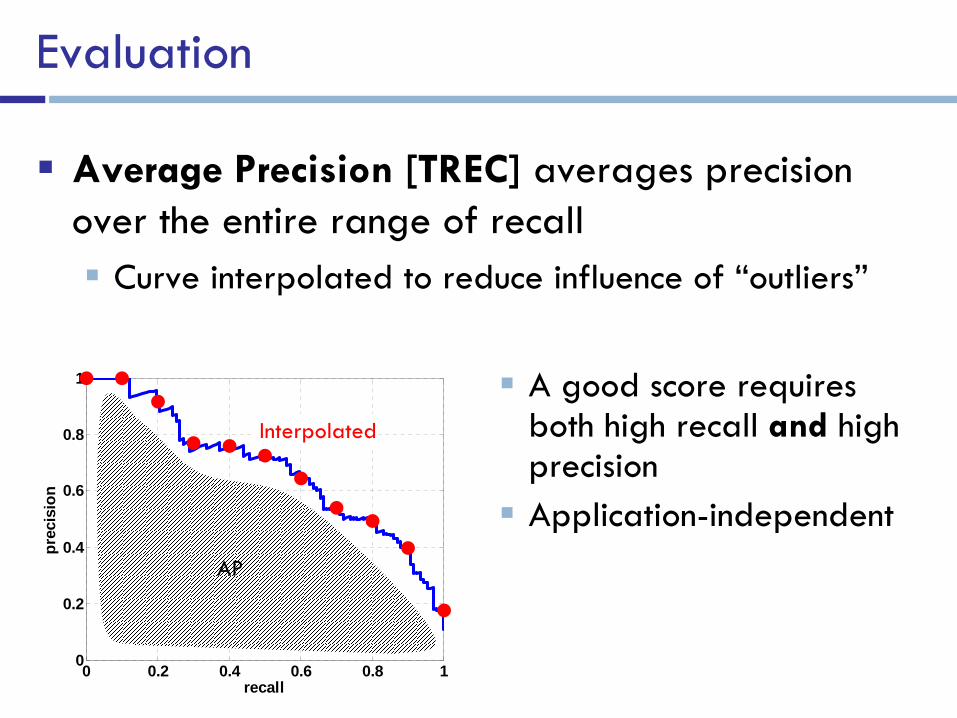
Evaluation
Average Precision [TREC]
averages precision over the entire range of recall
Curve interpolated to reduce influence of “outliers”
0 0.2 0.4 0.6 0.8 10
0.2
0.4
0.6
0.8
1
recall
prec
isio
n
A good score requires both high recall and
high
precision
Application-independent
AP
Interpolated

Methods
“Bag of visual words and beyond”
Interest point mechanism
e.g. sparse vs. dense
Features
e.g. SIFT
Codebook
generation e.g. K-means
Spatial
information e.g. spatial pyramid
Fusion
of features e.g. concatenate histograms
Classifier
e.g. 2
SVM

Methods: Bag of visual words and beyond
Interest Operators
LoG, Harris, Harris-Laplacian, SURF
Dense multi-scale grids
Features
SIFT, Color
SIFT
Codebooks
K-Means
Randomized clustering forest
Soft assignment to clusters
Per-image mixture of Gaussians

Methods: Bag of visual words and beyond
“Histograms”
No spatial information
Spatial pyramid
LDA projection to reduce dimensionality
Topic distribution (PLSA)
Feature Fusion
Sum distances for each feature type
Learnt weighting of feature types
Fusion of classifier per feature type e.g. product
Concatenation of pyramid levels
Sequential forward selection of relevant features

Methods: Bag of visual words and beyond
Classifiers
SVM
2, generalized RBF with learnt weights, vector set kernel (GMM)
Neural network
Logistic regression
Kernel discriminant
analysis
AdaBoost

Methods: Bag of visual words and beyond
Other
“Convolutional
Neural Net”
(INRIA Saclay)
HMAX: local template matching and spatial pooling, linear combination learnt by GA
“Classification via Segmentation”
(CASIA-Ecole
Centrale
Paris)
Classify image features as class/non-class by loopy BP on a graph with edges between spatial/scale neighbours
Extract bag of words separately for class/non-class regions
Classification by Detection (TU Berlin-Nikon)
Train PHOG/SVM detector on sub-images. Apply spatial pyramid of SIFT/multiple kernel SVM classifier to candidate sub-image
“Kitchen Sink”
(UIUC-CMU)
Object detectors, global image classifier, local context, occlusion boundaries, image segmentation, “geographic”
context, ...

Results: AP by Method and Class
SurreyUVA_SRKDA
1st on 8 classes, LEAR_shotgun
on 7, UVA_TreeSFS
on 4
aero bike bird boat bottle bus car cat chair cow table dog horse mbike pers plant sheep sofa train tv
BerlinFIRSTNikon 72.4 37.4 51.1 57.4 24.5 38.5 53.9 44.7 46.2 25.6 28.6 40.3 57.0 53.5 83.0 21.0 21.4 28.6 66.2 50.2
CASIA_LinSVM 50.8 21.5 31.8 41.8 18.3 7.7 35.7 40.6 30.6 4.9 7.1 31.5 29.3 22.0 73.4 7.9 13.7 11.6 18.9 31.0
CASIA_NeuralNet 47.6 12.7 28.4 35.3 12.7 5.8 31.6 34.5 22.7 3.7 6.0 23.6 21.9 16.1 69.1 8.1 5.0 8.7 15.9 15.1
CASIA_NonLinSVM 35.1 19.7 24.2 40.5 13.7 3.8 30.5 37.1 30.2 5.8 6.2 31.1 20.4 26.3 74.5 5.1 14.4 9.3 10.3 21.8
ECPLIAMA 54.9 25.3 31.1 29.8 18.9 21.4 33.7 25.5 28.4 - - 21.2 27.7 30.5 68.5 - - - 31.7 26.6
FIRST_SC1C 36.6 16.8 17.3 26.9 7.6 14.0 29.0 28.5 22.9 4.3 8.0 23.2 14.8 30.3 64.5 10.3 5.5 13.2 9.6 24.0
FIRST_SCST 36.6 16.8 17.3 26.9 7.6 14.0 29.0 28.5 22.9 4.3 8.0 23.2 14.8 30.3 64.5 10.3 5.5 13.2 9.6 24.0
INRIASaclay_CMA 52.4 15.0 23.6 33.9 10.2 10.3 32.7 32.4 26.4 13.2 16.0 22.2 18.5 27.3 64.8 8.6 4.4 7.9 20.0 30.4
INRIASaclay_MEVO 50.2 19.5 17.9 32.1 13.0 14.9 34.2 30.6 23.1 4.4 14.8 21.0 13.1 26.1 65.7 7.6 7.4 17.5 16.5 30.6
LEAR_flat 80.1 51.8 60.5 66.9 29.1 52.0 57.4 58.6 48.7 31.0 39.2 47.6 64.2 64.6 87.0 28.6 33.3 42.6 73.1 59.8
LEAR_shotgun 81.1 52.9 61.6 67.8 29.4 52.1 58.7 59.9 48.5 32.0 38.6 47.9 65.4 65.2 87.0 29.0 34.4 43.1 74.3 61.5
SurreyUvA_SRKDA 79.5 54.3 61.4 64.8 30.0 52.1 59.5 59.4 48.9 33.6 37.8 46.0 66.1 64.0 86.8 29.2 42.3 44.0 77.8 61.2
TKK_ALL_SFBS 77.9 47.3 52.4 61.0 27.9 45.5 53.5 55.5 47.6 26.8 40.8 46.1 58.6 58.3 83.5 26.4 24.3 39.2 70.3 56.9
TKK_MAXVAL 76.7 47.3 51.6 60.8 28.3 44.6 54.2 55.5 47.8 21.2 39.2 46.1 58.8 55.9 83.3 26.4 24.3 41.9 70.2 52.4
UvA_FullSFS 79.8 53.0 61.3 65.7 28.9 46.5 58.4 58.9 47.7 25.4 35.4 45.2 64.2 59.6 87.0 31.0 35.3 44.6 74.7 60.9
UvA_Soft5ColorSift 79.7 52.1 61.5 65.5 29.1 46.5 58.3 57.4 48.2 27.9 38.3 46.6 66.0 60.6 87.0 31.8 42.2 45.3 72.3 64.7
UvA_TreeSFS 80.8 53.2 61.6 65.6 29.4 49.9 58.5 59.4 48.0 30.1 39.6 45.0 67.3 60.4 87.1 30.1 41.5 45.4 74.3 59.8
XRCE 78.9 48.0 58.7 65.2 29.0 44.8 56.1 56.3 43.7 32.8 30.4 39.7 61.2 61.7 86.8 22.9 34.2 44.2 68.4 59.1

56.955.955.855.7
54.854.7
52.150.049.7
45.528.4
25.721.121.1
18.717.117.1
16.0
0 10 20 30 40 50 60 70
SurreyUvA_SRKDAUvA_TreeSFS
LEAR_shotgunUvA_FullSFS
UvA_Soft5ColorSiftLEAR_flat
XRCETKK_ALL_SFBSTKK_MAXVAL
BerlinFIRSTNikonECPLIAMA
CASIA_LinSVMCASIA_NonLinSVMINRIASaclay_CMA
INRIASaclay_MEVOFIRST_SC1CFIRST_SCST
CASIA_NeuralNet
AP (%)
Median AP by Method
Small differences between leading methods
cf. VOC2007: 1st 57.5%, 2nd 55.8%

0 0.1 0.2 0.3 0.4 0.5 0.6 0.7 0.8 0.9 10
0.1
0.2
0.3
0.4
0.5
0.6
0.7
0.8
0.9
1
recall
prec
isio
n
All results
UvA_TreeSFS (87.1)LEAR_flat (87.0)LEAR_shotgun (87.0)UvA_FullSFS (87.0)UvA_Soft5ColorSift (87.0)SurreyUvA_SRKDA (86.8)XRCE (86.8)TKK_ALL_SFBS (83.5)TKK_MAXVAL (83.3)BerlinFIRSTNikon (83.0)CASIA_NonLinSVM (74.5)CASIA_LinSVM (73.4)CASIA_NeuralNet (69.1)ECPLIAMA (68.5)INRIASaclay_MEVO (65.7)INRIASaclay_CMA (64.8)FIRST_SC1C (64.5)FIRST_SCST (64.5)(chance) (47.3)
Example Precision/Recall: Person
All methods

0 0.1 0.2 0.3 0.4 0.5 0.6 0.7 0.8 0.9 10
0.1
0.2
0.3
0.4
0.5
0.6
0.7
0.8
0.9
1
recall
prec
isio
n
Top 5 results by AP
UvA_TreeSFS (87.1)LEAR_flat (87.0)LEAR_shotgun (87.0)UvA_FullSFS (87.0)UvA_Soft5ColorSift (87.0)
Example Precision/Recall: Person
Top 5

0 0.1 0.2 0.3 0.4 0.5 0.6 0.7 0.8 0.9 10
0.1
0.2
0.3
0.4
0.5
0.6
0.7
0.8
0.9
1
recall
prec
isio
n
All results
SurreyUvA_SRKDA (59.5)LEAR_shotgun (58.7)UvA_TreeSFS (58.5)UvA_FullSFS (58.4)UvA_Soft5ColorSift (58.3)LEAR_flat (57.4)XRCE (56.1)TKK_MAXVAL (54.2)BerlinFIRSTNikon (53.9)TKK_ALL_SFBS (53.5)CASIA_LinSVM (35.7)INRIASaclay_MEVO (34.2)ECPLIAMA (33.7)INRIASaclay_CMA (32.7)CASIA_NeuralNet (31.6)CASIA_NonLinSVM (30.5)FIRST_SC1C (29.0)FIRST_SCST (29.0)(chance) (12.5)
Example Precision/Recall: Car
All methods

0 0.1 0.2 0.3 0.4 0.5 0.6 0.7 0.8 0.9 10
0.1
0.2
0.3
0.4
0.5
0.6
0.7
0.8
0.9
1
recall
prec
isio
n
Top 5 results by AP
SurreyUvA_SRKDA (59.5)LEAR_shotgun (58.7)UvA_TreeSFS (58.5)UvA_FullSFS (58.4)UvA_Soft5ColorSift (58.3)
Example Precision/Recall: Car
Top 5

0 0.1 0.2 0.3 0.4 0.5 0.6 0.7 0.8 0.9 10
0.1
0.2
0.3
0.4
0.5
0.6
0.7
0.8
0.9
1
recall
prec
isio
n
All results
SurreyUvA_SRKDA (30.0)LEAR_shotgun (29.4)UvA_TreeSFS (29.4)LEAR_flat (29.1)UvA_Soft5ColorSift (29.1)XRCE (29.0)UvA_FullSFS (28.9)TKK_MAXVAL (28.3)TKK_ALL_SFBS (27.9)BerlinFIRSTNikon (24.5)ECPLIAMA (18.9)CASIA_LinSVM (18.3)CASIA_NonLinSVM (13.7)INRIASaclay_MEVO (13.0)CASIA_NeuralNet (12.7)INRIASaclay_CMA (10.2)FIRST_SC1C (7.6)FIRST_SCST (7.6)(chance) (7.2)
Example Precision/Recall: Bottle
All methods

0 0.1 0.2 0.3 0.4 0.5 0.6 0.7 0.8 0.9 10
0.1
0.2
0.3
0.4
0.5
0.6
0.7
0.8
0.9
1
recall
prec
isio
n
Top 5 results by AP
SurreyUvA_SRKDA (30.0)LEAR_shotgun (29.4)UvA_TreeSFS (29.4)LEAR_flat (29.1)UvA_Soft5ColorSift (29.1)
Example Precision/Recall: Bottle
Top 5

AP by Class
Good results on “person”
due to prior
Classes indistinguishable by context prove difficult?
0
1020
30
4050
60
70
8090
100
pers
on
aero
plan
e
train
boat
hors
e
mot
orbi
ke
tvm
onito
r
bird ca
t
car
bicy
cle
bus
chai
r
dog
sofa
shee
p
dini
ngta
ble
cow
potte
dpla
nt
bottl
e
AP
(%) Max
MedianChance

Statistical Significance
Friedman/Nemenyi
analysis
Compare differences in mean rank
of methods over
classes using non-parametric version of ANOVA
Mean rank must differ by at least 4.9 to be considered significant (p=0.05)
12345678910111213141516Mean rank
LEAR_shotgunSurreyUvA_SRKDAUvA_TreeSFSUvA_Soft5ColorSiftLEAR_flatUvA_FullSFSXRCETKK_ALL_SFBS
TKK_MAXVALBerlinFIRSTNikon
CASIA_LinSVMCASIA_NonLinSVMINRIASaclay_CMA
INRIASaclay_MEVOFIRST_SC1C
CASIA_NeuralNetFIRST_SCST

Ranked Images: Motorbike
Class images: Highest ranked
Class images: Lowest ranked
Non-class images: Highest ranked
Intuitive confusion?

Ranked Images: Bicycle
Class images: Highest ranked
Class images: Lowest ranked
Non-class images: Highest ranked
“Texture”?

Ranked Images: Aeroplane
Class images: Highest ranked
Class images: Lowest ranked
Non-class images: Highest ranked
“Context”?

Ranked Images: Bird
Class images: Highest ranked
Class images: Lowest ranked
Non-class images: Highest ranked
“Context”?

Ranked Images: Train
Class images: Highest ranked
Class images: Lowest ranked
Non-class images: Highest ranked
Viewpoint bias?

Ranked Images: Cat
Class images: Highest ranked
Class images: Lowest ranked
Non-class images: Highest ranked
“Composition”?

Ranked Images: Dog
Class images: Highest ranked
Class images: Lowest ranked
Non-class images: Highest ranked
“Composition”?
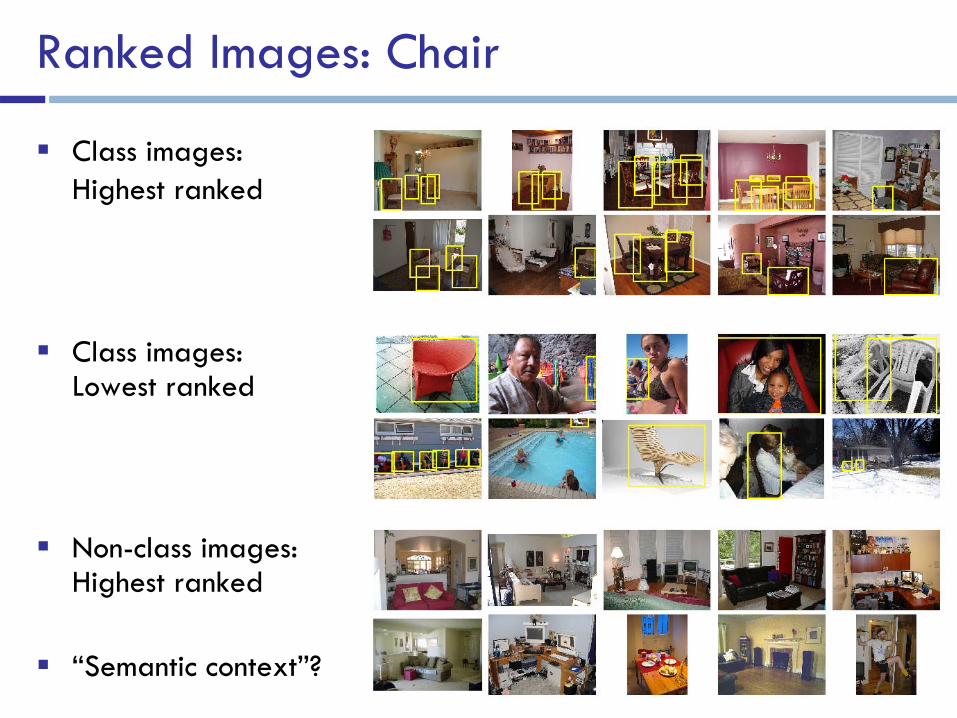
Ranked Images: Chair
Class images: Highest ranked
Class images: Lowest ranked
Non-class images: Highest ranked
“Semantic context”?

Ranked Images: Person
Class images: Highest ranked
Class images: Lowest ranked
Non-class images: Highest ranked
cf. 2007 motorbikes

AP vs. Object Class Area
Do these methods have a bias toward larger objects?
Moderate evidence for some classes: bicycle, bus, cat, dog, motorbike, sheep
Performance drops off due to increasing chance of occlusion?
0 5 10 15 20 25
10
20
30
40
50
60
min area (%)
AP
(%)
bicycle
SurreyUvA_SRKDAUvA_TreeSFSUvA_Soft5ColorSiftUvA_FullSFSLEAR_shotgunLEAR_flatXRCETKK_MAXVALTKK_ALL_SFBSBerlinFIRSTNikonECPLIAMACASIA_LinSVMCASIA_NonLinSVMINRIASaclay_MEVOFIRST_SC1CFIRST_SCSTINRIASaclay_CMACASIA_NeuralNet0 5 10 15 20 25
10
20
30
40
50
60
min area (%)
AP
(%)
sheep
SurreyUvA_SRKDAUvA_Soft5ColorSiftUvA_TreeSFSUvA_FullSFSLEAR_shotgunLEAR_flatXRCEBerlinFIRSTNikonTKK_ALL_SFBSTKK_MAXVALCASIA_NonLinSVMCASIA_LinSVMINRIASaclay_MEVOFIRST_SC1CFIRST_SCSTCASIA_NeuralNetINRIASaclay_CMA

AP vs. Object Class Area
For most classes, correlation with object class area is zero or negative
Methods are learning more about context/scene appearance than object appearance?
0 5 10 15 20 25
10
15
20
25
30
35
40
45
50
min area (%)
AP
(%)
chair
LEAR_shotgunLEAR_flatSurreyUvA_SRKDATKK_MAXVALUvA_Soft5ColorSiftTKK_ALL_SFBSUvA_FullSFSUvA_TreeSFSBerlinFIRSTNikonXRCECASIA_LinSVMCASIA_NonLinSVMECPLIAMAINRIASaclay_MEVOINRIASaclay_CMAFIRST_SC1CFIRST_SCSTCASIA_NeuralNet0 5 10 15 20 25
10
20
30
40
50
60
70
min area (%)
AP
(%)
train
SurreyUvA_SRKDAUvA_FullSFSLEAR_shotgunUvA_TreeSFSLEAR_flatUvA_Soft5ColorSiftTKK_MAXVALTKK_ALL_SFBSXRCEBerlinFIRSTNikonECPLIAMAINRIASaclay_CMACASIA_LinSVMINRIASaclay_MEVOCASIA_NeuralNetCASIA_NonLinSVMFIRST_SC1CFIRST_SCST
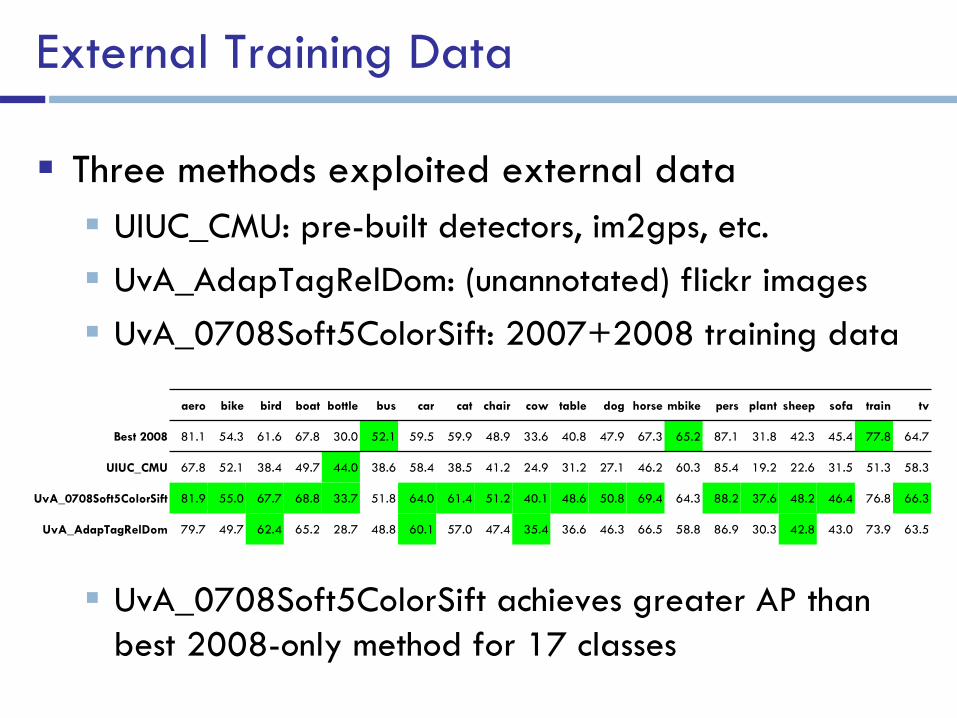
External Training Data
Three methods exploited external data
UIUC_CMU: pre-built detectors, im2gps, etc.
UvA_AdapTagRelDom: (unannotated) flickr
images
UvA_0708Soft5ColorSift: 2007+2008 training data
aero bike bird boat bottle bus car cat chair cow table dog horse mbike pers plant sheep sofa train tv
Best 2008 81.1 54.3 61.6 67.8 30.0 52.1 59.5 59.9 48.9 33.6 40.8 47.9 67.3 65.2 87.1 31.8 42.3 45.4 77.8 64.7
UIUC_CMU 67.8 52.1 38.4 49.7 44.0 38.6 58.4 38.5 41.2 24.9 31.2 27.1 46.2 60.3 85.4 19.2 22.6 31.5 51.3 58.3
UvA_0708Soft5ColorSift 81.9 55.0 67.7 68.8 33.7 51.8 64.0 61.4 51.2 40.1 48.6 50.8 69.4 64.3 88.2 37.6 48.2 46.4 76.8 66.3
UvA_AdapTagRelDom 79.7 49.7 62.4 65.2 28.7 48.8 60.1 57.0 47.4 35.4 36.6 46.3 66.5 58.8 86.9 30.3 42.8 43.0 73.9 63.5
UvA_0708Soft5ColorSift achieves greater AP than best 2008-only method for 17 classes

40 45 50 55 6040
45
50
55
60
VOC2007
2008: Median AP (%)
2007
: Med
ian
AP
(%)
LEAR_flatUvA_Soft5ColorSiftXRCE
VOC2007 vs. VOC2008 Test Data
Same/better results on 2007 test set than 2008 - easier test set?
Over-fitting –
no method equals best method trained on 2007 data

Prizes
Joint Winners:
SurreyUVA_SRKDA
Muhammad Atif
Tahir1, Koen
van de Sande2, Jasper Uijlings2, Fei
Yan1, Xirong
Li2,
Krystian
Mikolajczyk1, Josef Kittler1, Theo Gevers2, Arnold Smeulders2
1University of Surrey; 2University of Amsterdam
LEAR_shotgun Adrien
Gaidon, Marcin
Marszalek, Cordelia
Schmid
LEAR, INRIA Rhone-Alpes