THE PARTIAL RENAISSANCE OF SELF- · PDF filemight have encouraged the development of...
45
© OECD 2000 Chapter 5 THE PARTIAL RENAISSANCE OF SELF-EMPLOYMENT During the 1990s, self-employment grew faster than civilian employment as a whole in most OECD countries. This contrasts with the 1970s, when the share of self-employment tended to fall. At the same time, the proportion of self- employed with employees, which had been falling during the 1970s and 1980s, stabilised during the 1990s. This chapter aims to identify the areas of the economy where self-employment has increased fastest, and to investigate the forces that have caused these signs of renaissance. It also discusses the concerns that are sometimes expressed about the working conditions of the self-employed. Self-employment growth has been concentrated in the fastest-growing parts of the economy. In some countries, an impor- tant part of its growth, particularly during the 1980s, has come from women. The structure of self-employment is thus tending to become more like that of employment as a whole. Indeed the distinction between self-employment and wage employment may have weakened, as suggested by the growth of certain forms of employment, such as franchising, which have features of both forms of employment. In addition, several countries, at different times, have seen growing numbers of self-employed people who work for just one company, and whose self-employment status may be little more than a device to reduce total taxes paid by the firms and workers involved – the phenomenon of so-called “false” self-employment. On average, the working conditions of the self-employed seem to be less favourable than those of employees doing similar work, and they are less likely to report training, or the use of computers. Nonetheless, they tend to report higher job satisfaction, especially if they are employers. An examination of the countries where self-employment has grown fastest, including Canada, Germany and the United Kingdom, suggests there is no unique set of causes. Some of the growth in self-employment may have been gen- erated by the opportunities it offers to pay less taxes; some stems from changes in industrial organisation, such as the increase in outsourcing; and some is no doubt simply a response to the new opportunities offered by OECD economies. Policy may also have played a role, as governments in an increasing number of countries have sought to use self-employment both to reduce unemployment and foster entrepreneurship. In connection to this, a number of governments have recently introduced special policies to facilitate entry into self-employment for women and young people. Introduction Self-employment has become a significant source of job growth in many OECD countries. In several it has recently grown considerably faster than civilian employ- ment as a whole – notably in Canada and Germany. The recent picture contrasts with the 1970s, which saw the share of self-employment in total employment fall in the majority of countries. Self-employment is also an impor- tant source of entrepreneurship and small business growth – bringing with it a potential for longer-term employment growth [OECD (1998a)]. On the other hand, concerns have been expressed over the working conditions, training, security, and incomes of some self-employed. A number of overlapping reasons have been put for- ward for these signs of renaissance in self-employment. First, there have been suggestions that it might be a reac- tion to overly-rigid labour and product markets and high levels of taxation. Second, some analysts have pointed to changes in industrial organisation. A greater stress on out- sourcing of non-core activities may have increased the amount of work sub-contracted to the self-employed. Some networks or “clusters” of small, self-employment businesses have shown greater flexibility and speed of response than traditional firms. Third, it has been argued that the increase in the numbers of self-employed is best understood as the response by individuals to the new opportunities becoming available in OECD economies. 1 Summary
Transcript of THE PARTIAL RENAISSANCE OF SELF- · PDF filemight have encouraged the development of...

© OECD 2000
Chapter 5
THE PARTIAL RENAISSANCE OF SELF-EMPLOYMENT
During the 1990s, self-employment grew faster than civilian employment as a whole in most OECD countries. Thiscontrasts with the 1970s, when the share of self-employment tended to fall. At the same time, the proportion of self-employed with employees, which had been falling during the 1970s and 1980s, stabilised during the 1990s. This chapteraims to identify the areas of the economy where self-employment has increased fastest, and to investigate the forces thathave caused these signs of renaissance. It also discusses the concerns that are sometimes expressed about the workingconditions of the self-employed.
Self-employment growth has been concentrated in the fastest-growing parts of the economy. In some countries, an impor-tant part of its growth, particularly during the 1980s, has come from women. The structure of self-employment is thus tending tobecome more like that of employment as a whole. Indeed the distinction between self-employment and wage employment mayhave weakened, as suggested by the growth of certain forms of employment, such as franchising, which have features of bothforms of employment. In addition, several countries, at different times, have seen growing numbers of self-employed peoplewho work for just one company, and whose self-employment status may be little more than a device to reduce total taxes paid bythe firms and workers involved – the phenomenon of so-called “false” self-employment. On average, the working conditions ofthe self-employed seem to be less favourable than those of employees doing similar work, and they are less likely to reporttraining, or the use of computers. Nonetheless, they tend to report higher job satisfaction, especially if they are employers.
An examination of the countries where self-employment has grown fastest, including Canada, Germany and theUnited Kingdom, suggests there is no unique set of causes. Some of the growth in self-employment may have been gen-erated by the opportunities it offers to pay less taxes; some stems from changes in industrial organisation, such as theincrease in outsourcing; and some is no doubt simply a response to the new opportunities offered by OECD economies.Policy may also have played a role, as governments in an increasing number of countries have sought to use self-employmentboth to reduce unemployment and foster entrepreneurship. In connection to this, a number of governments have recentlyintroduced special policies to facilitate entry into self-employment for women and young people.
Introduction
Self-employment has become a significant source ofjob growth in many OECD countries. In several it hasrecently grown considerably faster than civilian employ-ment as a whole – notably in Canada and Germany. Therecent picture contrasts with the 1970s, which saw theshare of self-employment in total employment fall in themajority of countries. Self-employment is also an impor-tant source of entrepreneurship and small business growth– bringing with it a potential for longer-term employmentgrowth [OECD (1998a)]. On the other hand, concernshave been expressed over the working conditions, training,security, and incomes of some self-employed.
A number of overlapping reasons have been put for-ward for these signs of renaissance in self-employment.First, there have been suggestions that it might be a reac-tion to overly-rigid labour and product markets and highlevels of taxation. Second, some analysts have pointed tochanges in industrial organisation. A greater stress on out-sourcing of non-core activities may have increased theamount of work sub-contracted to the self-employed.Some networks or “clusters” of small, self-employmentbusinesses have shown greater flexibility and speed ofresponse than traditional firms. Third, it has been arguedthat the increase in the numbers of self-employed is bestunderstood as the response by individuals to the newopportunities becoming available in OECD economies.1
Summary

156 – OECD Employment Outlook
In addition, over recent years, many governmentshave increased their efforts to foster self-employment.Barriers to entry, such as overly-complex or expensive pro-cedures for setting up companies, have been addressed.Potential shortfalls in various types of capital have beentackled through policies to provide easier access tofinance, training, and networks of contacts. Special atten-tion has been given to groups under-represented in self-employment, including young people and women. How-ever, in some countries there has been concern that taxa-tion systems, and perhaps labour market policies as well,might have encouraged the development of “false” self-employment – people whose conditions of employmentare similar to those of employees, who have no employeesthemselves, and who declare themselves (or are declared)as self-employed simply to reduce tax liabilities, oremployers’ responsibilities.
In order to illuminate the nature of the recent growthin self-employment, and the role of government policy,this chapter addresses the following questions:
• Which countries have seen the strongest growth inself-employment, and what forces lie behind this?
• What are the main structural changes in self-employment?
• How do the working conditions of the self-employedcompare with those of employees? How do theycompare as regards job satisfaction? How many of thepopulation express a preference for self-employmentand what types of people are they?
• What are the recent trends in labour market policiesin favour of self-employment and what can be saidabout their effects?
According to the standard international definitions,self-employment jobs are ones where remuneration isdirectly dependent upon profits, and incumbents makeoperational decisions or are responsible for the welfare ofthe enterprise (see Annex 5.A for further details). Mostdata on self-employment come from national labour forcesurveys, which ask respondents to classify themselves asemployees or self-employed according to their status intheir main job. In general, this method gives results whichcorrespond fairly closely to the definition required. How-ever, there are some important exceptions, particularlyowner-managers of incorporated businesses, who repre-sent a substantial proportion of self-employment in somecountries – 31.4 per cent in the United States in 1998, forexample.2 These are people who own their business and areresponsible for its operation, but who are, legally, employ-ees of the business. For labour market analysis, they arebest classified as self-employed. However, because theirlegal status is that of an employee of their company, they
may identify themselves as employees in response to alabour force survey. Annex 5.A describes what is knownabout national classification systems in this respect. Thetables below are annotated accordingly.
Statistics on self-employment distinguish three mainsub-categories: self-employed without employees, or“own-account workers”; self-employed with employees,or “employers”; and unpaid family workers. The analysisin this chapter generally excludes unpaid family workerson the grounds that, according to the international guide-lines, they are not entrepreneurs, but rather the assistants ofentrepreneurs. The term, “self-employed”, thus generallyrefers to the sum of “own-account workers” and “employ-ers”. This omission probably tends to understate the truelevel of women’s entrepreneurship. Some women classi-fied as unpaid family workers in national statistics mightbetter be treated as equal partners with the self-employedperson who is in formal charge of the business [Felsteadand Leighton (1992); Marshall (1999)]. However, in 1996,the proportion of unpaid family workers among womenworking outside agriculture was only 3 per cent (unweightedaverage for the 23 countries for which data are available).
Apart from unpaid family workers, the analysis in thechapter also excludes the agricultural sector, except whereotherwise stated. This sector has a relatively high propor-tion of self-employed workers, but it has been declining insize in all Member countries over recent years.
The structure of the chapter is as follows. After iden-tifying where self-employment has been growing fastest,Section I analyses the changing structure of self-employment,in particular, the proportion of the self-employed who areemployers and may add to employment growth throughemploying others. An analysis of flow data in Section II pro-vides evidence on the proportion of unemployed people whobecome self-employed, and the numbers of own-accountworkers who become employers. Section III discusses theworking conditions of the self-employed, including newly-available information on the job-satisfaction of the self-employed, and preferences for self-employment. Section IVreports the results of econometric analyses designed toinvestigate the importance of some commonly-cited expla-nations for the development of self-employment. This leadsinto the final two sections, which summarise recent policydevelopments, and draw some conclusions.
Main findings
• Self-employment has tended to increase its share ofnon-agricultural civilian employment over the pastthree decades. Over the 1990s, its growth rate exceededthat of civilian employment in most OECD countries

The Partial Renaissance of Self-employment – 157
© OECD 2000
and the proportion of self-employed with employeesstabilised, after falling in the 1970s and 1980s.
• The growth in self-employment has been concen-trated in the fastest growing sectors of the economy,notably business and community services. Thestrongest growth has been seen in the higher-skilledoccupational groups.
• The proportion of women entering self-employment,as opposed to wage and salary employment, pickedup at the beginning of the 1980s. Since then, womenhave increased their share of self-employment in themajority of OECD countries.
• The link between self-employment and wage andsalary employment is strong. Most self-employed peo-ple were previously in wage and salary employment,and a substantial proportion of the self-employed enter(or re-enter) wage and salary employment. Franchis-ing – an example of a form of self-employment whichshares a number of the characteristics of wageemployment – has been growing rapidly in manyOECD countries.
• Only a very small proportion of unemployed peoplefind employment through self-employment, as opposedto wage and salary employment. Surprisingly, thisinflow appears to be relatively unaffected by recessions.
• Very few own-account workers (self-employed peo-ple without employees) become employers, over thecourse of a year. Most employers report no change intheir status over the previous year, but those who doare as likely to have been employees as to have beenown-account workers.
• The working conditions of the self-employed differfrom those of employees in a number of ways, evenafter allowing for a number of differences in thetypes of jobs they do. Self-employed people tend toreport poorer working conditions, including longerhours of work, and (unless they are employers) lesstraining, less use of computers, and feelings of lowerjob security. Nevertheless, the self-employed con-sider they have greater control of their working con-ditions than employees, reflecting their higher degreeof independence. This may be one of the main rea-sons why the self-employed generally report higherlevels of job satisfaction than employees – especiallyif they are employers.
• Employees and labour market entrants display a con-siderable degree of interest in self-employment, partic-ularly young men with above-average educationalqualifications. However, in Europe, almost a fifth ofself-employed people report wishing to change to wageand salary employment, at least in the short-term.
• An econometric investigation has failed to find aconsistent set of explanatory factors across countries.One possible exception is the growing share ofnational income accounted for by capital. This is adevelopment which might be expected to favourself-employment, whose income comes partly fromtheir capital and partly from their labour.
• Governments in almost all countries have introducedschemes to assist unemployed people become self-employed. In addition, a number of countries haverecently introduced programmes targeted on youngpeople and women. In general, the absence of an“evaluation culture” in most countries makes it verydifficult to assess the cost-effectiveness of theseschemes. However it seems clear that schemes forunemployed people can appeal only to a smallminority of the unemployed, particularly those withabove-average educational qualifications and previ-ous work experience.
I. Changes in size and structure3
In many countries, the growth in non-agriculturalself-employment has overtaken total non-agriculturalemployment over the past 25 years (Tables 5.1 and 5.2).For the broad economic cycles, 1979-90 and 1990-97,4
self-employment growth was faster than civilianemployment, overall. Over the recent period its growthoutstripped civilian employment growth in 15 out of24 countries. This contrasts with the 1973-79 cycle, whenthe average growth rate of self-employment was consid-erably lower than total employment. A number of coun-tries stand out for their particularly rapid growth in self-employment, relative to total civilian employment, overthe 1990s – Canada, Germany,5 Iceland, Mexico and theNetherlands.
Chart 5.1 shows the change in the distribution ofself-employment rates for the 20 countries for which dataare available for 1979, 1990 and 1997. It can be seen thatthe median value has risen, as has the highest value. How-ever, there is no evidence of any convergence in the ratesbetween the different countries. In 1997 the share of self-employment in total employment varied from 5 per cent inNorway to almost 30 per cent in Greece and Mexico.
In demographic terms, the most striking develop-ment is that the growth rate of the numbers of women self-employed has increased over the past two decades, andoutstripped men in the large majority of countries(Table 5.3). The proportion of self-employed who arewomen has also grown. To a large extent these develop-ments mirror the increase in the proportion of women incivilian employment as a whole. However, in addition, the

158 – OECD Employment Outlook
Table 5.1. Non-agricultural self-employment,a 1973-1998Thousands and percentages
1973 1979 1983 1989 1990 1994 1996 1997 1998
Numbers
Australia b 508 706 707 947 958 943 933 1 016 958Austria c 294 242 230 202 208 230 235 242 254Belgium d 394 397 416 460 469 508 513 517 516Canada d . . 1 007 1 204 1 490 1 563 1 804 1 940 2 160 . .Czech Republic c . . . . . . . . . . 454 539 554 642Denmark e 201 208 188 170 179 161 177 171 178Finland e 115 118 146 194 198 183 201 201 207France e 2 111 2 051 2 047 2 104 1 926 1 817 1 783 1 808 1 750Germany e 2 259 2 024 1 821 2 037 2 092 2 934 3 112 3 191 3 247Greece e . . 732 691 745 775 840 848 834 . .Hungary d . . . . . . . . . . 274 457 440 437Iceland c 6 6 7 13 13 18 19 19 20Ireland e 81 94 99 118 127 144 151 159 182Italy c 3 583 3 234 3 683 4 229 4 296 4 117 4 280 4 245 4 279Japan b 6 390 6 790 6 910 6 820 6 670 6 130 5 940 6 000 5 940Korea e . . . . . . . . 3 233 3 949 4 371 4 562 4 357Luxembourg c 15 14 13 13 13 . . . . . . . .Mexico e . . . . . . . . 3 600 5 953 6 852 7 241 7 703Netherlands e . . 400 404 448 469 596 656 693 695New Zealand c . . 106 193 193 221 246 249 266Norway f 114 112 119 120 114 116 109 111 113Poland e . . . . . . . . . . 1 301 1 327 1 399 1 991Portugal c 307 323 539 583 640 750 781 758 . .Spain d 1 584 1 499 1 524 1 874 1 901 1 983 2 093 2 119 2 136Sweden e 172 177 190 304 313 340 351 345 349Turkey e . . . . . . 2 523 2 615 2 863 2 927 3 018 3 054United Kingdom e 1 748 1 620 1 949 3 210 3 257 3 002 3 005 3 050 3 027United States b 5 451 6 751 7 540 8 561 8 669 8 955 8 929 9 017 8 924
Share of non-agricultural civilian employment
Australia b 9.5 12.4 12.1 12.9 12.9 12.5 11.8 12.9 11.8Austria c 11.7 8.9 8.1 6.6 6.6 6.6 6.9 7.0 7.4Belgium d 11.2 11.2 12.3 12.9 12.9 14.1 14.1 14.1 13.9Canada d . . 9.9 11.4 11.8 12.3 14.0 14.7 16.0 . .Czech Republic c . . . . . . . . . . 9.9 11.7 11.9 13.2Denmark e 9.3 9.2 8.5 6.9 7.2 6.8 7.1 6.7 6.9Finland e 6.4 6.1 7.0 8.7 8.8 9.9 10.3 10.0 10.0France e 11.4 10.6 10.5 10.5 9.3 8.8 8.5 8.6 8.2Germany e 9.1 8.2 7.4 7.8 7.7 8.5 9.0 9.2 9.4Greece e . . 32.0 27.9 27.2 27.4 28.0 27.5 27.0 . .Hungary d . . . . . . . . . . 8.1 14.0 13.4 13.1Iceland c 8.3 7.1 7.3 11.2 11.3 14.5 15.0 14.2 14.8Ireland e 10.1 10.4 10.7 12.9 13.4 13.6 12.8 12.9 13.4Italy c 23.1 18.9 20.7 22.4 22.2 22.3 23.0 22.7 22.7Japan b 14.0 14.0 13.3 12.0 11.5 10.1 9.7 9.7 9.7Korea e . . . . . . . . 21.8 23.0 23.8 24.4 24.9Luxembourg c 11.1 9.4 8.8 7.4 7.1 . . . . . . . .Mexico e . . . . . . . . 19.9 24.7 25.8 26.2 25.7Netherlands e . . 8.8 8.6 7.8 7.8 9.4 9.8 10.0 9.7New Zealand c . . 9.4 - 14.7 14.6 15.8 15.7 15.7 16.9Norway f 7.8 6.6 6.8 6.4 6.1 6.1 5.5 5.4 5.4Poland e . . . . . . . . . . 11.7 11.4 11.6 16.0Portugal c 12.7 12.1 17.0 16.4 16.7 19.2 19.8 19.1 . .Spain d 16.3 15.7 17.0 17.6 17.1 18.7 18.5 18.1 17.6Sweden e 4.8 4.5 4.8 7.1 7.3 9.0 9.1 9.0 9.0Turkey e . . . . . . 26.3 26.6 26.4 25.4 25.3 25.1United Kingdom e 7.3 6.6 8.6 12.4 12.4 12.0 11.7 11.7 11.4United States b 6.7 7.1 7.7 7.5 7.5 7.5 7.3 7.2 7.0
Unweighted average g 9.8 9.9 11.2 11.2 11.8 11.9 11.9.. Data not available.Note: See Table 5.A.1 for more information on the classification of owner-managers of incorporated businesses.a) Excluding unpaid family workers. b) Excluding owner-managers of incorporated businesses. c) Classification of owner-managers of incorporated businesses is unclear. d) Including owner-managers of incorporated businesses. e) Including most owner-managers of incorporated businesses. f) Excluding most owner-managers of incorporated businesses. g) Excluding Belgium, the Czech Republic, Greece, Hungary, Korea, Luxembourg, Mexico, Poland and Turkey.
Sources: OECD database on annual labour force statistics; except Canada, national submission.

The Partial Renaissance of Self-employment – 159
© OECD 2000
growth rate of the numbers of women in self-employmentmoved strongly ahead of that of women in total civilianemployment in the 1980s, after lagging behind in the 1970s.6
The proportion of employed people in self-employmenttends to increase with age. In most countries, both the better-and the less-well-educated have above-average probabilitiesof being self-employed [Blanchflower (1998)].
Other things being equal, the higher the proportion ofemployers in total self-employment, the higher the contri-bution of self-employment to the total number of jobs.Comparing the situation in 1997 with that in 1990, the pro-portion of employers in self-employment rose in over halfthe countries for which the comparison can be made(Table 5.4). This contrasts favourably with the period 1983to 1990, during which the proportion of employersdeclined in most countries. Nevertheless, it is striking thattwo countries where self-employment grew particularly
fast relative to civilian employment as a whole over the1990s, Canada and Germany, both displayed sharp falls inthe proportion of employers. This parallels the situation inthe 1980s, when the United Kingdom displayed both thefastest growth of self-employment and the fastest drop inthe proportion of employers among the self-employed(Chart 5.2). In all three cases, this suggests that a certainproportion of the growth might be attributable to “false”self-employment, in the sense outlined above.7
The distribution of self-employment by industry andoccupation differs from that of civilian employment as awhole. Understandably, mining and quarrying, and electricity,gas and water supply, account for only a very small proportionof self-employment, much less than for employment as awhole, and there are also relatively few self-employed peoplein manufacturing. Outside the agricultural sector, self-employment tends to be concentrated in wholesale and retail
Table 5.2. Annual average growth rates of self-employmenta and total civilian employmentPercentages
1973-1979 1979-1990 1990-1998
Civilian Civilian CivilianSelf-employment Self-employment Self-employment
employment employment employment
Australia 5.6 1.0 2.8 2.4 0.0 1.1Austria –3.2 1.3 –1.4 1.2 2.5 1.2Belgium 0.1 0.1 1.5 0.2 1.2 0.3Canada b . . . . 4.1 2.0 4.7 0.9Denmark 0.6 0.9 –1.4 1.0 –0.1 0.4Finland 0.4 1.2 4.8 1.5 0.6 –1.0France –0.5 0.8 –0.5 0.6 –1.2 0.4Germany –1.8 0.0 0.3 0.8 5.6 3.2Greece b . . . . 0.5 1.5 1.1 1.3Iceland –0.3 2.7 6.3 2.2 5.7 2.3Ireland 2.5 2.1 2.8 0.4 4.6 4.6Italy –1.7 1.0 2.6 1.1 0.0 –0.3Japan 1.0 1.2 –0.2 1.8 –1.4 0.7Korea . . . . . . . . 3.8 2.1Luxembourg –1.7 1.0 –0.6 2.0 . . . .Mexico . . . . . . . . 10.0 6.5Netherlands –0.2 1.1 1.5 2.4 5.0 2.3New Zealand . . . . 5.5 1.4 4.1 2.2Norway –0.3 2.7 0.2 0.8 –0.1 1.6Portugal b 0.9 1.1 6.4 3.5 2.4 0.5Spain –0.9 –0.3 2.2 1.5 1.5 1.1Sweden 0.5 1.5 5.3 0.8 1.4 –1.3Turkey . . . . . . . . 2.0 2.7United Kingdom –1.3 0.3 6.6 0.5 –0.9 0.1United States 3.6 2.7 2.3 1.8 0.4 1.3
Unweighted average c 0.2 1.2 2.2 1.4Unweighted average d 2.3 1.4 1.7 1.0
.. Data not available.a) Excluding the agricultural sector and unpaid family workers. For some countries, all or part of owner-managers of incorporated businesses are excluded
from self-employment. See notes to Table 5.1 and Table 5.A.1. b) 1990-1997 instead of 1990-1998. c) Excluding Canada, Greece, Korea, Luxembourg, Mexico, New Zealand and Turkey. d) Excluding Greece, Korea, Luxembourg, Mexico, New Zealand and Turkey.
Sources: OECD database on annual labour force statistics; except Canada, national submission.

160 – OECD Employment Outlook
trade and repairs, and hotels and restaurants [within theformer sector, the more detailed analysis in OECD (1986)shows the importance of retail trade]. The patterns vary con-siderably from country to country. For occupational groups,the differences between self-employment and civilianemployment are less marked. Legislators, senior officials andmanagers represent a larger share of the self-employed pop-ulation than of civilian employment as a whole, while clerksand elementary occupations account for relatively few self-employed people.8
Over the 1990s, the industry sectors which tended tocontribute the most to the growth in self-employment werefinancial intermediation, real estate, renting and business(FIRE); followed by community, social and personal services(Services). For employers, the contribution of wholesale andretail trade, hotels and restaurants was also important. Thecontribution of these sectors to the growth of self-employ-ment was greater than for employment as a whole. There weredistinctive patterns in some of the countries experiencing thefastest growth in self-employment over the 1990s. In Canada,own-account working grew in all sectors, including agricul-ture. The Netherlands stands out for the growth in the numberof employers, particularly in wholesale and retail trade. Whileself-employment lost ground in most sectors in France, therewere some gains in FIRE and Services.
The occupational groups which contributed moststrongly to the growth in self-employment over the 1990s
25
20
15
10
5
0
25
20
15
10
5
01979 1990 1997
Chart 5.1. Distributiona
of self-employment rates acrossOECD countriesb
Self-employment rate (%)
a) The boxplots show the minimum, first quartile, median, third quartile andmaximum of the distribution of the self-employment rate, defined as theratio of self-employment to civilian employment, excluding the agriculturalsector and unpaid family workers.
b) Countries are those where data are available for 1979, 1990 and 1997:Australia, Austria, Canada, Denmark, Finland, France, Germany, Iceland,Ireland, Italy, Japan, the Netherlands, New Zealand, Norway, Portugal,Spain, Sweden, the United Kingdom and the United States.
Sources: OECD database on annual labour force statistics; Canada, nationalsubmission.
3rd quartile
Maximum
Median
1st quartile
Minimum
25
20
15
10
5
0
25
20
15
10
5
01979 1990 1997
Chart 5.1. Distributiona
of self-employment rates acrossOECD countriesb
Self-employment rate (%)
a) The boxplots show the minimum, first quartile, median, third quartile andmaximum of the distribution of the self-employment rate, defined as theratio of self-employment to civilian employment, excluding the agriculturalsector and unpaid family workers.
b) Countries are those where data are available for 1979, 1990 and 1997:Australia, Austria, Canada, Denmark, Finland, France, Germany, Iceland,Ireland, Italy, Japan, the Netherlands, New Zealand, Norway, Portugal,Spain, Sweden, the United Kingdom and the United States.
Sources: OECD database on annual labour force statistics; Canada, nationalsubmission.
3rd quartile
Maximum
Median
1st quartile
Minimum
1983-1990
-20
1990-1997
8
6
4
2
0
-2
-4
-6
-8
-10
-12
8
6
4
2
0
-2
-4
-6
-8
-10
-12-10 0 10 20 30 40 50 60
8
6
4
2
0
-2
-4
-6
-8
-10
-12
8
6
4
2
0
-2
-4
-6
-8
-10
-12-20 -10 0 10 20 30 40 50 60
Changes in self-employmentand in the proportion
of the self-employed who are employers
Chart 5.2.
% points % points
Note: The agricultural sector and unpaid family workers are excluded.Sources: EU countries: EUROSTAT, European Labour Force Survey; other
countries: national data.
% points % points
Change in self-employment (%)
Cha
nge
in th
e pr
opor
tion
of s
elf-
empl
oyed
who
are
em
ploy
ers
Cha
nge
in th
e pr
opor
tion
of s
elf-
empl
oyed
who
are
em
ploy
ers
SpainLuxembourg
Portugal
France
Japan
Denmark Greece
NetherlandsItaly
AustraliaGermany
Canada
Ireland
Luxembourg
United Kingdom
Canada
Germany
Spain
Portugal
France
Japan
Denmark
Greece
Netherlands
Italy
Australia
Ireland
United Kingdom
Mexico
Change in self-employment (%)

The Partial Renaissance of Self-employment – 161
© OECD 2000
Table 5.3. Self-employmenta by gender: growth rate and share of self-employmentPercentages
Women Men
1973-1979 1979-1990 1990-1997 b 1973-1979 1979-1990 1990-1997 b
Annual average growth rates of self-employment
Australia 8.5 4.1 0.0 4.6 2.4 –0.2Belgium 0.0 1.7 1.9 0.2 1.4 1.4Canada . . 5.3 6.5 . . 3.6 3.8Denmark . . . . . . . . . . –0.7Finland –2.4 4.3 0.9 2.0 5.1 0.1France . . . . 0.6 . . . . –0.9Germany –3.2 –1.2 6.4 –1.1 1.0 5.0Greece . . –0.1 3.2 . . 0.7 1.1Ireland . . . . 5.7 . . . . 2.4Italy –6.0 3.7 0.1 –0.3 2.3 –0.2Japan 0.4 0.0 –2.8 1.3 –0.3 –0.8Korea . . . . 5.2 . . . . 5.0Mexico . . . . 19.2 . . . . 7.0Netherlands . . . . –0.2 . . . . 3.6Norway 1.5 2.6 0.4 –0.7 –0.5 –1.1Spain –2.3 2.9 2.6 –0.5 1.9 1.2Sweden 7.0 5.7 1.0 –1.2 5.2 1.5Turkey . . . . 1.3 . . . . 2.1United Kingdom –1.9 8.9 –1.0 –1.1 5.9 –1.5United States 5.7 4.2 1.9 2.9 1.4 –0.2
Unweighted average c 0.7 3.4 1.0 0.6 2.3 0.5
Share of total self-employment
Australia 27.5 30.5 32.9 72.5 69.5 67.1Belgium 28.1 28.3 28.9 71.9 71.7 71.1Canada . . 29.8 32.7 . . 70.2 67.3Finland . . 34.1 31.1 . . 65.9 68.9France . . . . 26.0 . . . . 74.0Germany 34.2 26.4 28.3 65.8 73.6 71.7Greece . . 16.6 19.4 . . 83.4 80.6Ireland . . . . 20.1 . . . . 79.9Italy 24.5 21.9 23.4 75.5 78.1 76.6Japan 33.6 35.5 33.9 66.4 64.5 66.1Korea . . . . 30.3 . . . . 69.7Mexico . . . . 33.8 . . . . 66.2Netherlands . . . . 32.8 . . . . 67.2Norway 21.3 23.5 28.3 78.7 76.5 71.7Spain 25.2 24.7 26.8 74.8 75.3 73.2Sweden 22.3 27.3 25.7 77.7 72.7 74.3Turkey . . . . 6.8 . . . . 93.2United Kingdom 20.4 23.9 24.8 79.6 76.1 75.2United States 27.2 32.9 37.0 72.8 67.1 63.0
Unweighted average c 26.4 28.1 29.2 73.6 71.9 70.8
.. Data not available.a) Excluding the agricultural sector and unpaid family workers. For some countries, all or part of owner-managers of incorporated businesses are excluded
from self-employment. See notes to Table 5.1 and Table 5.A.1. b) 1996 for Belgium, Greece and the United Kingdom.c) Excluding Canada, Denmark, Finland, France, Greece, Ireland, Korea, Mexico, the Netherlands and Turkey.
Sources: OECD database on annual labour force statistics; Canada: national submission; Denmark, France, Ireland and the Netherlands: EUROSTAT, EuropeanLabour Force Survey.

162 – OECD Employment Outlook
were professionals, and technicians and associated profes-sionals. The largest contribution to the growth in the num-ber of employers came from the category of legislators,senior officials and managers. The growth in both the num-bers of own-account workers and employers was moreconcentrated by occupation than was the growth ofemployment as a whole (where a substantial contributioncame also from the category of Service workers and shopand market sales workers).9
Over recent years, there are a number of indicationsthat the borders between self-employment and wage salaryemployment are becoming more blurred. For example, inlarge companies, it can be argued that one of the mainthrusts of human resource management policy has been togive employees more of the independence and personalaccountability that characterise self-employment. This isseen in higher levels of responsibility for the quality ofindividual output and career development, at the same timeas market-type relationships have become more importantwithin enterprises, and hierarchical ladders have beenreduced [OECD (1999a)].
In addition, there have been changes in the numbers andtypes of jobs which lie on the borders of wage andsalary employment and self-employment [Burchell andRubery (1992)]. Contractors working in a dependent relation-ship with just one enterprise may have little or no more auton-omy than employees, even when classified as self-employed.For Australia, Wooden and Van den Heuvel (1995) reportthat, in 1994, 40 per cent of self-employed contractors weredependent only on their current employer, and that their num-bers had grown during the 1990s. For the United Kingdom,Freedman and Chamberlain (1997) argue that the grey areabetween employee and self-employment status has beengrowing, drawing particular attention to workers whose busi-ness consists of providing only personal services without pro-viding any equipment or taking on their own employees.These workers are considered to be present in significantnumbers in the oil, construction, and computer industries andamong homeworkers and teleworkers, actors, televisionworkers and journalists. In a number of other countries,including Belgium, Germany and Italy, the growth inthe numbers of self-employed contractors working for
Table 5.4. Proportion of employers in self-employment, 1983, 1990, 1997a
Percentages
1983 1990 1997
Employer Own-account Employer Own-account Employer Own-account
Australia b 37.9 62.1 36.2 63.8 31.1 68.9Austria . . . . . . . . 68.8 31.2Belgium 13.9 86.1 11.7 88.3 10.3 89.7Canada 51.5 48.5 48.4 51.6 37.7 62.3Czech Republic . . . . . . . . 34.2 65.8Denmark c 52.6 47.4 53.8 46.2 50.1 49.9Finland . . . . . . . . 42.3 57.7France 45.2 54.8 48.3 51.7 49.7 50.3Germany 61.4 38.6 59.8 40.2 53.0 47.0Greece 24.1 75.9 24.5 75.5 28.8 71.2Hungary . . . . . . . . 20.0 80.0Ireland 38.7 61.3 37.8 62.2 39.9 60.1Japan 20.5 79.5 22.0 78.0 25.3 74.7Mexico . . . . 18.2 81.8 18.3 81.7Netherlands . . . . 35.5 64.5 37.4 62.6Portugal d . . . . 31.8 68.2 35.6 64.4Spain d . . . . 23.5 76.5 29.6 70.4Sweden . . . . . . . . 41.0 59.0United Kingdom 38.2 61.8 31.1 68.9 25.8 74.2United States . . . . . . . . 21.1 78.9
Unweighted average e 38.4 61.6 37.4 62.6Unweighted average f 34.5 65.5 33.8 66.2
.. Data not available.a) Excluding agricultural sector and unpaid family workers. For some countries, all or part of owner-managers of incorporated businesses are excluded from
self-employment. See notes to Table 5.1 and Table 5.A.1. b) 1985 instead of 1983. c) 1984 instead of 1983. d) 1986 instead of 1983. e) Excluding Austria, the Czech Republic, Finland, Hungary, Mexico, the Netherlands, Poland, Spain, Sweden and the United States. f) Excluding Austria, the Czech Republic, Finland, Hungary, Sweden and the United States.
Sources: EU countries: EUROSTAT, European Labour Force Survey; other countries: national data.

The Partial Renaissance of Self-employment – 163
© OECD 2000
just one company has led to policy concerns over “false self-employment” (see Section V). Many homeworkers fallinto this latter category [Schneider de Villegas (1990);Felstead (1996)]. Franchisees are another important group onthe borders of dependent and self-employment. Their num-bers have been growing quite rapidly in the 1990s (Box 1).
II. Flow analyses
Further insights into the changing characteristics ofself-employment can be obtained from data on flowsbetween self-employment and other labour market states.This allows an examination of the patterns of inflow intoself-employment over time, particularly from unemploy-ment and from wage and salary employment. A moredetailed analysis reveals the extent to which own-accountworkers transform themselves into employers over time.
Finally, the data allow a crude comparison of the stabilityof the states of self-employment and wage and salaryemployment. The main data source used for analysis isthe retrospective information provided by the EuropeanUnion Labour Force Survey (EULFS), described inAnnex 5.A. It must be noted that information of this kindis subject to large reporting errors and is, in general, suit-able only for indicating broad trends over time.10
The results of the analysis of flow data for a numberof European Union countries,11 shown in Tables 5.5, 5.6and 5.7 and Chart 5.3, coupled with a more detailed anal-ysis of the underlying data, suggest that:
• The large majority of inflows into self-employmentcome from paid employment in both the EuropeanUnion (Table 5.5) and Canada [Lin et al. (1999)]. Onlya small proportion of inflows into self-employmentcome from unemployment – with the exceptions of
Box 1. Trends in franchising*
According to the standard international definitions, franchisees are distinguished by having certain types of contracts withfranchisors, who own certain means of production (land, buildings, machinery, trade marks, etc.). The contracts specify, to a sig-nificant extent, how the business is operated, and require the payment of part of total sales. Franchising has become an increasinglyimportant avenue into self-employment. It can provide ready-made expertise to run a business in a particular area. When the fran-chisor offers a well-known brand name, it may also provide the customer base.
The degree of independence of franchisees varies considerably. In general, according to Felstead (1992), many franchisorsseek inexperienced franchisees who are more likely to remain dependent upon them. The role of the franchisees is seen as fur-nishing finance and labour. It is up to the franchisors to shape these raw materials into a trading business. The interests of fran-chisors and franchisees are sometimes at variance, because franchisors are generally remunerated on the basis of sales turnover,rather than profits. Franchisors may reserve the right to take over franchises if performance is not at a sufficiently high level. Theymay also choose to locate new franchises close to existing ones if their interests are served by so doing. Over the longer-term thefranchisor may maintain control over marketing and sales promotion, product supplies, and product and service development.
The table next page, presenting several indicators of franchising intensity, has been derived from a number of sources.They generally show consistent results. Where there are differences, this may signal a need for particular care in interpreting thefigures. The underlying source rests with franchise associations and, as some franchises may have escaped the net, the figuresshould be treated as lower bounds.
The largest numbers of franchisors and franchisees are found in the United States. However, bearing in mind the comparativesizes of the countries concerned, franchising is particularly well-represented in Japan and Canada. France may have the largestnumber of franchisees of the large European countries. Franchising appears to represent two per cent or more of GDP in a numberof countries, including France and the Netherlands. For a number of other countries, sales turnover figures are around 1 per cent ofGDP – including Belgium, Denmark, Finland, Italy, Mexico, and Portugal. Franchising is estimated to represent 6 per cent of totalretail and service markets in France, 18 per cent. of retail volume in Norway and 15 per cent of the fast food and restaurant sectorin Portugal.
According to US Department of Commerce (1999), there have been rapid increases in franchising over recent years inalmost all Member countries (with the exception of some Eastern European countries, where the market is still to be developed).Prospects for expansion are expected to be good. The average annual growth rate expected for Germany over the period 1999 to2001 was in the 10 to 15 per cent range, and strong increases were expected for a number of other countries.
* This box has been compiled with the assistance of Mr. David Purdy of the International Franchise Research Centre, University of Westminster,United Kingdom.

164 – OECD Employment Outlook
Indicators of franchising intensity
Number of franchisors by source Number of franchisees by source
European Franchising US Dept. European Franchising US Dept.Worldwide Worldwide
Federation of Commerce Federation of Commerce
1992/93 1995/96 1993/94 1997/98 1992/93 1995/96 1993/94 1997/98
Numbers Numbers
Austria 190 210 200 302 3 000 3 000 3 000 3 630Australia and . . . . 600 . . . . . . 26 000 . .
New ZealandBelgium 225 170 150 . . 3 500 3 500 3 083 . .Canada . . . . 1 000 . . . . . . 65 000 . .Czech Republic 40 . . 35 . . 80 . . 100 . .Denmark 42 98 68 . . 500 2 000 1 210 . .Finland . . . . 70 . . . . . . 900 . .France 450 470 520 517 25 700 25 750 30 000 28 851Germany 500 530 500 598 20 000 22 000 18 000 28 000Hungary 150 220 200 . . 1 000 5 000 10 000 . .Ireland . . . . . . 113 . . . . . . 864Italy 370 436 400 . . 18 650 21 390 18 500 . .Japan . . . . 714 . . . . . . 139 788 . .Mexico . . . . 375 400 . . . . 18 724 . .Netherlands 341 345 341 350 11 975 11 910 11 975 12 000Norway . . . . 185 185 . . . . 3 500 3 500Portugal 70 220 70 236 – 2 000 . . . .Spain 280 288 280 550 23 000 13 161 18 500 . .Sweden 200 230 200 . . 9 000 9 150 9 000 . .Switzerland . . . . 170 . . . . . . . . . .United Kingdom 396 474 414 . . 24 900 25 700 26 400 . .United States . . . . 3 000 . . . . . . 250 000 . .
Annual sales turnover by source Numbers employed a
US Dept.European Franchising Federation European Franchising Federation
of Commerce
1992/93 1995/96 1997/98 1992/93 1995/96
Billion ECU Billion US$ Thousands
Austria . . 1.6 . . . . 40Belgium 3.7 2.4 . . 27 29Czech Republic 0.8 . . . . 0.8 . .Denmark . . 1.0 2.7 . . 40Finland . . . . 2.1 . . . .France 31.0 9.2 3.4 319 356Germany 11.5 14.6 18.5 . . 230Hungary . . 2.6 0.9 10 45Ireland . . . . 0.5 . . . .Italy 8.1 12.0 . . 46 50Mexico . . . . 5.1 . . . .Netherlands 7.9 9.2 10.0 78 100Norway . . . . 8.5 . . . .Portugal . . 1.0 . . . . 35Spain . . 6.8 . . . . 69Sweden 5.0 5.7 . . 55 71United Kingdom 6.4 8.9 . . 189 223
. . Data not available.a) Includes full and part-time staff in franchised and company-owned outlets, as well as at the franchisor’s headquarters.
Sources: European Franchising Federation 1995/96 data taken from EFF (1997); 1992/93 data taken from correspondence between Mr. David Purdyand the British Franchise Association; ‘‘Worldwide’’ data extracted by Mr. David Purdy from Swartz (1995); US Department of Commerce (1999).

The Partial Renaissance of Self-employment – 165
© OECD 2000
% %7
1460
% %10
% %4
2014
% %80
25180
6
5
4
3
2
1
0
50
40
30
20
10
0
60
50
40
30
20
10
0
9876543210
3
2
1
0
12
10
8
6
4
2
0
70605040302010
0
160140120100
80604020
0
12
10
8
6
4
2
0
14
12
10
8
6
4
2
0
14
12
10
8
6
4
2
0
14
12
10
8
6
4
2
0
14
12
10
8
6
4
2
0
14
12
10
8
6
4
2
0
20
15
10
0
20
15
10
5
0
1983 1985 1987 1989 1991 1993 1995 19971983 1985 1987 1989 1991 1993 1995 1997
1983 1985 1987 1989 1991 1993 1995 19971983 1985 1987 1989 1991 1993 1995 1997
1983 1985 1987 1989 1991 1993 1995 19971983 1985 1987 1989 1991 1993 1995 1997
1983 1985 1987 1989 1991 1993 1995 19971983 1985 1987 1989 1991 1993 1995 1997
Chart 5.3. Flows between unemployment and self-employment, 1983-1997Thousands
Inflows from unemployment to self-employment (left-hand scale)Outflows from self-employment to unemployment (left-hand scale)Unemployment rate (percentages, right-hand scale)
Denmark Francea
a) Inflows and outflows are not available for 1991.b) Data refer to western Germany before 1991, and to Germany after 1991. 1991 data are not available.Source: EUROSTAT, European Labour Force Survey.
Germanyb Greece
Ireland Portugal
Spain United Kingdom

166 – OECD Employment Outlook
Finland and Spain, and Germany during the period ofrapid growth in self-employment since 1994 (whenperhaps one in four of the newly self-employed werepreviously unemployed).12
• Conversely, when unemployed people find work, thisis comparatively rarely through self-employment,even after taking account of the proportion of self-employment jobs in total employment (Table 5.6).
• A detailed analysis of the outflows from self-employment (Table 5.5 and underlying data) indi-cates that they are chiefly into paid employment andout of the labour force, a result also found for Canadaby Lin et al. (1999). In well over half of the countriesfor which a relatively long time series is available,there is an upward trend in outflows from self-employ-ment over the last ten to fifteen years. The source ofthis tends to be an increased outflow from self-
employment to paid employment. No such commonpattern is seen in the inflows.
• The proportion of self-employed people reporting nochange in their status since the same date in the pre-ceding year is slightly lower than for employees. Dis-aggregating into those with and without employees,employers are roughly as stable, in this sense, asemployees, while own-account workers are consid-erably less stable (Table 5.7).13
• In European Union countries, there is no consistentcorrelation between inflows from unemployment toself-employment and the level of the unemploymentrate (Chart 5.3). In some countries, there may besigns that the inflows into self-employment movecounter-cyclically, tending to increase, sometimesafter a lag, when unemployment rises: in no Europeancountry is the opposite pattern evident. However,
Table 5.5. Flows into and out of self-employmenta
Average annual flows over years indicatedPercentages of self-employment
Inflows to self-employment from: Outflows from self-employment to:
Out of the labour Out of the labourEmployees Unemployed Employees Unemployed
force force
Austria 1995-1997 10.4 0.9 3.4 10.7 0.8 2.2
Denmark 1983-1989 4.0 0.9 0.7 2.8 1.6 2.31990-1997 5.1 2.0 1.0 3.1 1.8 2.5
Finland 1995-1997 2.1 3.0 3.0 2.0 2.0 1.9
France 1983-1989 6.6 2.1 2.3 3.7 1.5 3.61990-1997 6.2 1.9 2.4 3.9 1.8 3.3
Germany 1983-1990 7.7 0.6 1.4 4.8 0.6 1.71992-1997 12.3 1.3 2.4 6.6 0.8 2.0
Greece 1983-1989 2.7 0.8 1.9 1.4 0.8 1.51990-1997 2.4 0.8 1.3 1.4 0.7 1.6
Ireland 1983-1989 2.5 2.2 1.6 3.0 2.0 1.21990-1997 3.3 1.7 1.9 4.6 1.7 1.6
Italy 1983-1992 3.5 1.4 2.7 4.3 0.6 2.31993-1997 5.5 2.1 3.6 4.1 0.8 3.1
Portugal 1986-1989 7.3 1.0 1.4 2.0 0.6 2.01990-1997 6.8 1.1 1.9 3.4 0.7 1.8
Spain 1987-1989 3.3 2.8 2.6 2.9 1.2 2.11990-1997 3.5 2.6 2.4 2.1 1.5 2.7
Sweden 1996-1997 2.8 1.2 1.8 1.8 1.0 1.8
United Kingdom 1983-1989 8.5 3.3 4.1 3.9 2.5 2.21990-1997 7.5 2.8 3.4 4.8 3.3 2.7
Unweighted average 1983-1989 5.1 1.7 2.1 3.2 1.2 2.11990-1997 5.7 1.8 2.4 4.0 1.4 2.3
a) Excluding the agricultural sector and unpaid family workers. For some countries, all or part of owner-managers of incorporated businesses are excludedfrom self-employment. See notes to Table 5.1 and Table 5.A.1.
Source: OECD calculations on the basis of data provided by EUROSTAT from the European Labour Force Survey.

The Partial Renaissance of Self-employment – 167
© OECD 2000
for Canada, Lin et al. (1999) find a significant butsmall negative correlation between the unemploymentrate and self-employment entries.
The absence of a consistent positive correlationbetween the unemployment rate and inflows into self-employment from unemployment fails to support the so-called “unemployment push” hypothesis: that peopletend to move into self-employment in greater numbersin recessions due to the absence of wage employment[see Meager (1991) for a summary of this debate].Nevertheless, the data show that inflows from unem-ployment into self-employment show little or no ten-dency to decline in recessions.
A further analysis of flows into the employer status(Table 5.8) shows that employers have not necessarilymoved on from being own-account workers – the pro-portion of employers saying they were own-accountworkers the year before is slightly less than the propor-tion saying they were employees. On average, over a
year, only roughly one in thirty own-account workersbecome employers in Europe.
III. Working conditions of the self-employed, job satisfaction and preferences
A. Working conditions
Earnings
Earnings are one of the most important compo-nents of the working conditions of the self-employed.Unfortunately, direct comparisons of the earnings of theemployed and self-employed populations are extremelydifficult. Data on the incomes of the self-employed areboth harder to obtain and less reliable than those forwage and salary workers [OECD (1992)]. On the defini-tional side, there are three areas where the determination
Table 5.6. Current status of those unemployed a year earlierAgricultural sector excluded, percentages
Employee Unemployed Out of the labour force Self-employed
Austria 1995-97 31.2 43.3 23.1 1.9
Belgium 1983-89 19.0 69.8 9.8 1.31990-97 21.9 50.8 25.6 1.6
Denmark 1983-89 42.8 39.3 16.7 1.01990-97 33.6 36.8 27.9 1.5
Finland 1995-97 25.3 45.9 27.2 1.5
France 1983-89 29.7 50.7 17.6 1.81990-97 30.5 51.6 16.2 1.4
Germany 1983-90 15.9 52.4 30.8 0.81992-97 24.0 49.6 25.0 1.3
Greece 1983-89 30.3 59.9 6.1 3.31990-97 24.1 61.4 11.5 2.5
Ireland 1983-89 16.8 68.2 13.5 1.41990-97 17.7 58.2 22.7 1.4
Italy 1983-92 23.1 54.2 19.0 2.81993-97 18.5 47.4 30.2 2.8
Portugal 1986-89 31.9 50.7 15.4 1.71990-97 32.4 41.8 22.4 3.0
Spain 1987-89 26.3 66.1 5.1 1.91990-97 26.9 63.6 7.2 1.8
Sweden 1996-97 26.5 52.0 18.6 2.9
United Kingdom 1983-89 28.3 52.4 15.6 3.61990-97 28.8 49.3 17.4 4.2
Unweighted average 1983-89 26.4 56.4 15.0 2.01990-97 26.3 50.1 21.1 2.1
Note: Rows do not sum exactly to 100% because of the exclusion of unpaid family workers.Source: As Table 5.5.

168 – OECD Employment Outlook
of self-employment incomes is particularly uncertain:the overlap between personal consumption expendituresand business expenditures, production for ownconsumption, and capital accruals. In addition, there aresevere measurement problems. By comparison withwage and salary workers, the self-employed have amuch greater opportunity to understate their incomes toavoid taxation. Taking National Accounts estimates asthe basis of comparison, self-employment earningsappears to be subject to much greater under-reporting inhousehold income surveys than employee earnings[Sullivan and Smeeding (1997)]. It is therefore prudentto restrict international studies of self-employmentearnings to comparisons of trends over time and thesituation of different population groups, such as menand women. It may also be possible to make compari-sons of the degree of inequality found in the distribu-tions of the earnings of employees and self-employedpeople. At the same time, it must also be rememberedthat many households obtain their income from a combi-nation of wage and self-employment earnings. For Canada,Leckie (1997) shows that the proportion of such householdshas been rising.
The OECD (1992) analysis of trends in the earningsof the self-employed, covering six countries over the late1980s, found no uniform pattern in changes in the ratiobetween the median earnings of the self-employed and ofthe civilian employed. The direction of change variedaccording to the country and gender concerned. This con-trasted with the conclusion of OECD (1986), for five coun-tries over the late 1970s and early 1980s, that medianearnings of the self-employed had been declining overtime relative to those of employees.
For the 1990s, there is again no evidence of clearpatterns:
• For Austria, trends in wage and self-employmentincomes appear to be similar over the period 1985-96.14
• For Canada, Leckie (1997) finds that mean annualearnings of the self-employed grew considerablyfaster than corresponding wage earnings over theperiod 1985 to 1995.
• For France, Cordellier (1998) concludes that therewas a widespread decline in the real earnings of theself-employed from 1986 to 1996, a period in whichreal wages grew. Even where the real earnings of the
Table 5.7. Stability of self-employmenta
Percentage of persons who were in the same status a year earlier, average of years shown
Self-employedEmployee
Own account Employer
Austria 1983-1989 83.4 85.5 90.0
Denmark 1983-1989 92.5 98.1 89.21990-1997 93.6 96.8 91.3
Finland 1983-1989 73.1 95.8 85.7
France 1983-1989 80.4 83.7 90.21990-1997 80.8 84.6 91.2
Germany 1983-1990 75.8 80.9 91.11992-1997 85.2 85.8 94.8
Greece 1983-1989 93.8 92.4 92.91990-1997 93.3 92.5 91.9
Ireland 1983-1989 89.4 94.3 89.71990-1997 90.1 95.9 90.9
Portugal 1986-1989 86.0 91.2 93.01990-1997 88.1 89.8 93.3
Spain 1987-1989 88.5 91.1 85.61990-1997 88.9 92.3 84.9
Sweden 1983-1989 80.8 96.1 92.2
United Kingdom 1983-1989 80.9 84.4 90.51990-1997 77.4 85.6 89.0
Unweighted average 1983-1989 84.1 90.3 90.01990-1997 87.2 90.4 90.9
a) Unpaid family workers and the agricultural sector are excluded.Source: As Table 5.5.

The Partial Renaissance of Self-employment – 169
© OECD 2000
self-employed increased or stagnated up to 1990,they usually declined afterwards.
• For the United Kingdom, Robson (1997) reports adecline in the average earnings of the self-employedrelative to employees over the whole period since1979, attributing it mainly to the reduction in thelevel of capital per self-employed worker.
• For the United States, Devine (1994) finds thatmedian real earnings of full-time year-round self-employed men declined between 1975 and 1990,while the real earnings of similar employees wererelatively flat. The earnings of self-employed womenimproved over time, relative to the earnings of self-employed men, but the gains lagged behind thoseseen in the wage-and-salary sector.
The OECD (1992) analysis of the inequality of self-employment earnings, relative to employee earnings,found evidence that the distribution of the incomes of theself-employed tended to be less equal than that of wageand salary employees. This is confirmed by a number ofrecent studies, including Sullivan and Smeeding (1997),covering 15 OECD countries; Bradbury (1996), on the
basis of expenditure data for Australia; Leckie (1997) forCanada; Pfeiffer and Pohlmeier (1992) for Germany; andParker (1997, 1999), who reviews a number of recentstudies for the United Kingdom, finding evidence for arise in the inequality of self-employment income over theperiod 1976 to 1995, paralleling that for employees. Inaddition, a number of studies, including Bradbury (1996)and Leckie (1997), point to the relatively large variation inself-employment incomes from year to year.
Conditions at work
Secretariat analysis of the 1996 Second European Sur-vey on Working Conditions [see European Foundation (1997a)and Annex 5.A] shows that the working conditions of the self-employed tend to differ from those of employees in a numberof important respects. These differences tend to persist afterallowing for a number of ways in which the jobs of self-employed people and employees tend to differ.15
Not surprisingly, self-employed people tend to reportgreater autonomy than employees on a number of dimen-sions, including the ability to choose their rate and methods of
Table 5.8. Flows into and out of employer statusa
Percentages of employers
Inflows to employer status from: Outflows from employer status to:
Own OwnOut of the Out of the
Employee Unemployed account Employee Unemployed accountlabour force labour force
worker worker
Denmark 1983-1989 4.3 0.6 0.4 0.3 2.4 1.3 1.5 0.91990-1997 3.2 0.5 0.5 0.3 2.3 1.4 1.9 0.5
Finland 1995-1997 1.9 0.6 1.3 1.2 1.3 0.9 2.0 1.2
France 1983-1989 6.0 0.9 1.2 6.2 3.8 0.9 3.0 5.51990-1997 6.1 1.0 1.3 7.4 4.0 1.2 2.8 6.4
Germany 1983-1990 8.1 0.3 0.6 4.8 3.7 0.4 1.4 2.41992-1997 12.0 0.6 1.1 5.1 5.9 0.5 2.0 3.2
Greece 1983-1989 2.7 0.4 0.9 3.3 1.4 0.7 1.1 2.11990-1997 2.4 0.4 0.6 3.9 1.5 0.4 1.2 2.9
Ireland 1983-1989 1.8 0.7 0.6 1.1 4.9 0.8 1.1 2.01990-1997 2.6 0.5 0.6 2.0 7.8 0.8 1.3 2.2
Portugal 1986-1989 6.5 0.3 0.8 2.5 0.9 0.5 1.4 2.61990-1997 4.5 0.4 0.8 3.1 2.1 0.4 1.2 3.0
Spain 1987-1989 2.4 0.5 1.2 3.3 3.8 0.7 1.3 1.71990-1997 2.7 0.9 1.2 3.8 2.0 0.7 1.8 2.4
Sweden 1996-1997 2.1 0.6 0.6 0.7 1.7 1.0 2.0 1.6
United Kingdom 1983-1989 5.5 1.2 1.5 6.0 3.4 1.5 2.0 4.31990-1997 5.3 0.8 1.2 8.1 3.1 1.5 2.2 5.4
Unweighted average 1983-1989 4.6 0.6 0.9 3.4 3.1 0.9 1.6 2.71990-1997 4.3 0.6 0.9 3.6 3.2 0.9 1.8 2.9
a) Unpaid family workers and the agricultural sector are excluded.Source: As Table 5.5.

170 – OECD Employment Outlook
work, the order in which they perform tasks, and the patternof breaks and holidays that they take. They are also lesslikely to complain of working under time pressure, and aremore likely to indicate that they “have enough time to get thejob done”. In addition, in most occupational groups, own-account workers are less likely than employees to agree thatthey are “working to tight deadlines” or “working at veryhigh speed”. Employers, by contrast, report these types ofwork pressure as often as employees. On the other hand, theself-employed are rather more likely than employees to saythat their pace of work is “dependent upon direct demandsfrom people such as customers, passengers, pupils andpatients”. Such differences are present in each sector and foreach occupation group. There is no evidence of additionaldifferences by gender.
The well-known tendency for self-employed peopleto report longer hours of work than employees isconfirmed by this survey. Own-account workers reportedan average of 45 hours a week and employers 52 hours,as opposed to the 39 hours reported by employees.16
Women own-account workers reported working longerhours than women employees, but considerably shorterhours than male own-account workers (male and femaleown-account workers were found to work, on average,46 and 40 hours, as opposed to 41 and 33 hours foremployees). Men and women employers were found toaverage around the same number of hours.
Table 5.9 shows the results of applying a logit anal-ysis to a number of other dimensions of working condi-tions. The figures show the probability that own-accountworkers and employers respond positively to the questionson the topics mentioned, relative to employees, after con-trolling for the effects of age, gender, country, education,occupation and industry. These are important dimensionsof jobs, although they do not exhaust all of the differencesbetween the jobs done by employees and self-employedpeople. With this caveat, the results suggest that:
• While the self-employed claim that they are moreable to adjust instruments and equipment for theirown comfort, they are nevertheless less likely toreport wearing protective equipment and more likelyto work in painful positions. They are more likely toreport working at night and at weekends.
• The self-employed report considerably lower levelsof training than employees. In addition, own-accountworkers (but not employers) report lower levels ofuse of computers.
• The self-employed, particularly own-account work-ers, are less likely to agree that they have a secure jobthan employees.
This last finding is not in line with the findings ofManski and Straub (1999) for the United States, that self-employed workers tend to perceive less chance of job loss
Table 5.9. Working conditions of the self-employed: results of a logistic regression model
Probability that the statement applies to the self-employed as a ratio of theprobability it applies to employees a
Self-employed
Own-account workers Employers
Percentages
Wearing protective equipment 59*** 91Working in painful positions 117*** 117**Able to adjust to their own comfort instruments/equipment 150*** 158***
Working shift and/or irregular hours 148*** 145***Working Saturdays (at least once a month) 118*** 122***Working at night (at least once a month) 131*** 182***
Working Sundays (at least once a month) 156*** 186***Dealing directly with outside people 106*** 108***Training in the last 12 months 41*** 61***
Working with computers at least 1/4 of the time 68*** 103Think job is secure 80*** 96*
***, **, and *, significant at the 0.1%, 1% and 5% level respectively.a) The table should be read as follows: own-account workers are 59% as likely to be wearing protective equipment as employees, etc. The calculations are
based on the case of a 40 year old man in Belgium, who left education between the ages of 16 and 20, working in wholesale and retail trade as a service orsales worker.
Source: OECD calculations from the Second European Survey on Working Conditions, excluding the agricultural sector.

The Partial Renaissance of Self-employment – 171
© OECD 2000
than those who work for others. However, these resultsrefer to possible job loss over the next twelve months,probably a relatively short time in the life of a self-employed business, while the European question made noreference to any time period.
B. Job satisfaction by employment status, gender and hours
The self-employed tend to indicate greater satisfac-tion with their jobs than employees. For the EuropeanUnion, Secretariat analysis of the 1996 Second EuropeanSurvey on Working Conditions shows that 38 per cent ofown-account workers and 45 per cent of employersreported being “on the whole, very satisfied” with theirmain jobs, as opposed to 30 per cent of employees.Blanchflower (1998) reports similar results for a numberof other surveys covering Europe and the United States.The differences tend to persist even after the inclusion of anumber of variables to control for the type of job.
Table 5.10 compares the job satisfaction of employ-ees and self-employed people according to gender andhours of work. There are some striking differences in thepattern of job satisfaction by gender. Male employees tendto report increasing job satisfaction with lengthening hoursof work, while female employees do not. However, for
men and women own-account workers the patterns differless – in both cases the peak satisfaction occurs in jobs ofaround 40 hours a week. Nevertheless, women own-account workers with low weekly hours also tend to reportquite high levels of job satisfaction, possibly because thisallows them to combine work and family life.
In sum, taken at face value, the evidence suggeststhat the self-employed are more content with their lot thanemployees. The poorer working conditions and longerhours associated with self-employment are presumablycompensated by other factors.
C. Employees in very small businesses
In considering the working conditions associatedwith self-employment, it is also important to examine theworking conditions of employees in businesses run by theself-employed. The necessary information, which wouldneed to include earnings data, is scarce. However, a num-ber of indications can be gleaned from the Second Euro-pean Survey on Working Conditions, referring to theworking conditions in firms with between one and nineemployees.17 There is a substantial overlap between thesefirms and the firms of self-employed people.
While employees in companies with between one andnine employees do not report above-average exposure to
Table 5.10. Job satisfactiona of the self-employed, by hours and gender, European Union, 1995/96Percentages
MenMen Womenand
Usual hours of work in main job Usual hours of work in main job women
Less More Less More10-29 30-39 40-44 45-59 All 20-29 30-39 40-44 45-59 All All
than 10 than 60 than 10 than 60hours hours hours hours hours hours hours hours hours hours hours
hours hours hours hours
Total employmentVery satisfied 12 25 29 29 35 36 31 35 35 33 32 35 37 34 32Other b 88 74 71 71 64 64 69 64 65 67 66 65 63 66 53
Own-account workersVery satisfied . . 23 53 36 32 33 35 43 37 48 49 42 38 44 38Other b . . 77 47 64 67 67 65 57 63 52 51 58 62 56 61
EmployersVery satisfied . . . . . . . . . . . . 42 . . . . . . . . . . . . 52 45Other b . . . . . . . . . . . . 58 . . . . . . . . . . . . 48 55
EmployeesVery satisfied . . 27 27 28 35 34 29 35 36 32 29 28 28 32 30Other b . . 73 73 71 64 66 71 64 64 68 69 72 72 67 69
.. Estimate unavailable because of inadequate sample size. Sample size restrictions are also the reason for the slightly different decomposition of hoursused for men and for women.
a) Data refer to satisfaction with main job. b) Including responses: ‘‘fairly satisfied’’, ‘‘not very satisfied’’ and ‘‘not at all satisfied’’. Figures do not always add to 100 because of small numbers of ‘‘don’t
knows’’.Source: As Table 5.9.

172 – OECD Employment Outlook
adverse ambient factors, they are more likely to say theywork in painful positions, or move heavy loads. They aremore likely to work long hours, and on Saturdays, but notnights or on Sundays. They are less likely to say theywork to tight deadlines. However, they report lower lev-els of autonomy than employees in larger firms, and areless likely to regard their jobs as complex, or involvingprecise quality standards, or requiring job rotation. Theyare much less likely than employees in general to reporthaving undergone training in the last 12 months, or usingcomputers. Regarding their compensation, they are lesslikely to receive special payments for overtime, unsocialworking hours, or poor working conditions. They are alsoless likely to enjoy family-friendly benefits, such asmaternity leave, sick child leave, parental leave or childday care, over and above those stipulated in national leg-islation. They are slightly less likely than average to thinktheir job is secure. However, they report being as satisfiedwith their jobs, if not more so, than workers in companiesof other sizes.
D. Preferences for self-employment
Recent survey evidence for Europe suggests a con-siderable, latent interest in self-employment. Table 5.11,taken from an analysis of the “Employment Options of theFuture” survey [Bielenski (1999) and Annex 5.A], showsthe numbers of people, either currently employed orintending to become employed within the next five years,who indicate that their desired employment state isself-employment. Taken at face value, the figures suggestthat the proportion of currently employed people whowould prefer self-employment is 26 per cent – just undertwice the figure currently seen in Europe. These figuresshould, of course, be regarded with considerable caution,as most dependent employees have no experience of self-
employment. At the same time, there is some indication of“involuntary self-employment” – 18 per cent of those cur-rently self-employed said they would prefer to work as anemployee.18
A detailed analysis of these data by Huijgen (1999)shows that preferences for self-employment are consider-ably stronger among men than women – indeed, differ-ences by gender were more important than any othervariable included in the survey. Twenty-two per cent ofmale employees and labour market entrants, as against15 per cent of women, indicated a preference for self-employment (and 33 per cent of men, as opposed to45 per cent of women, said they regarded it as unaccept-able). Preferences for self-employment decline gradually withage. They increase with the level of educational qualifica-tions. The strongest preferences for self-employment areexpressed by young men with above-average educationalqualifications entering the labour market.
Differences in preferences by gender are also foundfor the United Kingdom by Hakim (1998). Using 1991Census data to examine the narrowly defined profession ofpharmacist, in which men and women are roughly equallyrepresented, and which, she argues, offered a relativelyunconstrained choice of the type of working, she concludesthat women pharmacists show a strong tendency to preferemployee jobs (often part-time) while men consistently preferself-employment (almost always full-time). For the UnitedStates, Devine (1994) argues that the self-employment deci-sion for women is based on different factors to that for men.For Canada, Menzies (1998) reports survey evidence thatmen are more likely than women to choose self-employmentfor the independence it offers (47 per cent of men cited thisreason compared with 32 per cent of women): women aremore likely to say that it offers a chance to work from home(13 per cent of women compared with virtually no men).
Table 5.11. Preferences for self-employment and dependent employment, European Union, 1998Percentages
Desired status
No preference/Employee Self-employed
don’t know/no answer
Current statusEmployed (sum of employees and self-employed) 69 26 5Intend or wish to take up paid work in the next five years a:
Young entrants 58 26 16Women returners 70 15 15Unemployed 65 16 20
a) Defined as people, aged 16 and over, not currently employed, who want to be working in 5 years’ time. Young entrants are pupils or students intending totake up their first ‘‘real’’ job on completion of their studies. Women returners are women who want to take up paid work again after a break in their career.
Source: Bielenski (1999), analysis of the ‘‘Employment Options of the Future’’ survey, covering the EU and Norway.

The Partial Renaissance of Self-employment – 173
© OECD 2000
IV. Exploring the correlates of self-employment
From a cross-sectional viewpoint, there is a strong neg-ative correlation between the level of GDP per capita and theshare of self-employment in total, non-agricultural civilianemployment, as shown in Chart 5.4 (which includes onlythose countries for which data are available for all of theyears). The statistical relationship is very similar in each of theyears. However, other factors are at work – if GDP per capitawere the only influence, self-employment would have tendedto decline in all countries. This section reviews a number ofmultivariate analyses of the correlates of self-employment,including recent analyses by the Secretariat.
Previous international time-series analyses, includingAcs, Audretsch and Evans (1994), Staber and Bogenhold(1993) and Robson and Wren (1999) have used a variety ofexplanatory variables for the self-employment rate, includingunemployment, output per capita, proportion of women in thelabour force, share of GDP contributed by the services sector,average tax rates, and marginal tax rates. The sign for thecoefficient on the unemployment rate is uncertain, a priori,and estimates vary from study to study. The proportion ofwomen in the labour force is expected to have a negative coef-ficient, that of the proportion of services sector GDP a posi-tive one (though these results are not always found). Averagetax rates might be expected to have a positive coefficient,as higher average tax rates provide more incentive to findways of avoiding and evading income tax through self-employment. This result is found by some but not all anal-yses, including that of Robson and Wren (1999). They alsofind a negative relationship with marginal tax rates.19
The Secretariat analysis, which broadly followed theapproach of Robson and Wren (1999), is described inAnnex 5.B. The list of variables is shown in Table 5.12. Itshould be noted that neither this, nor indeed any of theanalyses just quoted can claim to incorporate a “model” ofthe decision to become self-employed. Such an approachwould require an analysis using individual, rather thanaggregate level. However, it can be seen that the first fourvariables used by the Secretariat relate to the developmentof and broad structural change in the economy, while thelast five are relevant to the likely advantages accruing toself-employment, relative to wage and salary employment.The new variables, by comparison with earlier studies, arethe proportion of value added accounted for by capital(SCVA) and the average unemployment benefit replace-ment rate (REPR). SCVA might be expected to have a pos-itive sign, in so far as it reflects the rate of return to capitalas opposed to labour – self-employment earnings include acomponent accruing to capital as well as one accruing tolabour. REPR might be expected to have a negative sign:
25
1990
0
1997
1979
20
15
10
5
0
25
20
15
10
5
040 00035 00030 00025 00020 00015 00010 0005 000
25
20
15
10
5
0
25
20
15
10
5
00 40 00035 00030 00025 00020 00015 00010 0005 000
0 40 00035 00030 00025 00020 00015 00010 0005 000
25
20
15
10
5
0
25
20
15
10
5
0
Self-employment rateand GDP per capita,a 1979, 1990 and 1997
Chart 5.4.
Self-employment rate (%)
Italy
a) The self-employment rate is defined as the ratio of self-employment tocivilian employment, excluding the agricultural sector and unpaid familyworkers. Countries shown are those where data are available for 1979,1990 and 1997. GDP per capita is in US$ and exchange rates of 1990.
Sources: OECD database on annual labour force statistics; OECD databaseon national accounts.
GDP per capita
Self-employment rate (%)
Self-employment rate (%)
GDP per capita
GDP per capita
SpainJapan
AustraliaPortugal
Ireland
New Zealand
United Kingdom
FranceDenmark
GermanyAustria
Canada
Sweden
NorwayFinland Iceland
United StatesNetherlands
SwedenNorwayDenmark
Finland
IcelandJapan
Spain
AustraliaIreland
New ZealandPortugal
United Kingdom
Italy
FranceNetherlands
CanadaAustria
United States
Germany
Sweden
NorwayDenmark
Finland
United StatesAustria
FranceGermany
CanadaNetherlands
JapanAustralia
IrelandUnited KingdomIceland
New Zealand
SpainPortugal
Italy
25
1990
0
1997
1979
20
15
10
5
0
25
20
15
10
5
040 00035 00030 00025 00020 00015 00010 0005 000
25
20
15
10
5
0
25
20
15
10
5
00 40 00035 00030 00025 00020 00015 00010 0005 000
0 40 00035 00030 00025 00020 00015 00010 0005 000
25
20
15
10
5
0
25
20
15
10
5
0
Self-employment rateand GDP per capita,a 1979, 1990 and 1997
Chart 5.4.
Self-employment rate (%)
Italy
a) The self-employment rate is defined as the ratio of self-employment tocivilian employment, excluding the agricultural sector and unpaid familyworkers. Countries shown are those where data are available for 1979,1990 and 1997. GDP per capita is in US$ and exchange rates of 1990.
Sources: OECD database on annual labour force statistics; OECD databaseon national accounts.
GDP per capita
Self-employment rate (%)
Self-employment rate (%)
GDP per capita
GDP per capita
SpainJapan
AustraliaPortugal
Ireland
New Zealand
United Kingdom
FranceDenmark
GermanyAustria
Canada
Sweden
NorwayFinland Iceland
United StatesNetherlands
SwedenNorwayDenmark
Finland
IcelandJapan
Spain
AustraliaIreland
New ZealandPortugal
United Kingdom
Italy
FranceNetherlands
CanadaAustria
United States
Germany
Sweden
NorwayDenmark
Finland
United StatesAustria
FranceGermany
CanadaNetherlands
JapanAustralia
IrelandUnited KingdomIceland
New Zealand
SpainPortugal
Italy

174 – OECD Employment Outlook
an increase should tend to increase the attractiveness ofwage employment.
A number of other variables of possible importancecould not be included. For example, outsourcing has beensuggested as one of the main reasons for the rapid growthin self-employment, for example in the United Kingdom inthe 1980s [Meager (1998)] and Canada in the 1990s[Leckie (1997)]. There is evidence of recent increases inoutsourcing from a number of national studies, includingMorehead et al. (1997) for Australia, Ekos Research Asso-ciates Inc. (1998) for Canada, and Cully et al. (1999) for theUnited Kingdom. Secretariat analysis of the 1996 EPOCsurvey [European Foundation (1997b)], found managersreporting initiatives in favour of outsourcing over the pre-vious three years in all ten European countries covered.The percentage of workplaces involved ranged from8 per cent in Spain to 23 per cent in Ireland. However, thedata are insufficient to include in a time series regressionmodel. Data limitations were also the reason for the exclu-sion of the level of employers’ social security contribu-tions, the strictness of employment protection legislation(EPL), and the availability of financial capital.
While cultural factors are not amenable to time-series analysis, Wilderman et al. (1999) find that, on across-country basis, certain cultural variables have a stron-ger explanatory power than standard economic variables.20
For the United Kingdom, a number of commentators havediscussed whether or not the sharp rise in self-employmentin the United Kingdom in the 1980s might have been due,at least in part, to a renewal of interest in entrepreneurialactivity within the national culture [OECD (1992);Blanchflower and Freeman (1994); Robson (1998)].
Table 5.13 summarises the results obtained by theSecretariat, from both individual and pooled regressions.The specification of the two models is given in Annex 5.B
(the models differ only in the treatment of the independentvariable, which is separated into its two components, thenumbers of self-employed and the numbers in civilianemployment, in the second model). Only variables foundto be significant at the 10 per cent level were retained inthe model. Few of the variables perform consistently well.The “best” variable, in the sense of consistent, significantcoefficients, is the proportion of value added accounted forby capital. This has the expected sign. The average tax-ation variable is often significant in first-differenceterms, but does not have the sign expected. The same istrue of the variable for the proportion of GDP accountedfor by services [a similar result was found by Robson andWren (1999)]. While GDP per capita gives mixed resultswhen used in the regressions for individual countries, it hasa negative sign in the pooled regressions, perhapsreflecting the tendency for countries with higher levels ofthis variable to have lower levels of self-employment(Chart 5.2). A separate analysis using the limited informa-tion on EPL found no evidence of a correlation between itand the self-employment rate.21, 22
In summary, the analyses presented here have failedto find a consistent set of explanatory variables for self-employment on a time-series basis across countries.
V. Policy considerations
Particularly since the beginning of the 1980s, gov-ernments in most OECD countries have adopted a range ofpolicies to support self-employment, both in its own right,and as part of attempts to foster entrepreneurship [OECD(1998a)]. This has taken place in the context of a generaltrend toward deregulation in many labour and productmarkets and the persistence of high unemployment[Meager (1994)]. Policy intervention has been justified by
Table 5.12. Explanatory variables used in the OECD Secretariat’s time series regression analyses
Variable CodeSER Self-employment rate: ratio of self-employment to civilian employmentSE Self-employmentEMP Civilian employment
GDP Real GDP per capitaFEM Proportion of women in labour forceMAN Proportion of manufacturing in value addedSERV Proportion of services in value addedSCVA Proportion of value added accounted for by capitalUNR Unemployment rateMTR Ratio of general government gross liabilities to GDPATR Average tax rate (proxied by ratio of general government outlays to GDP)REPR Average unemployment benefit replacement rate

The Partial R
enaissance of Self-employm
ent –175
© O
EC
D 2000
Table 5.13. Summary of time-series regression analyses for the self-employment rate
Model 1 (dependent variable SER) Model 2 (dependent variable SE)
United UnitedCanada Germany Italy Japan Pooled Canada Germany Italy Japan Pooled
Kingdom Kingdom
Variable a
LnSER t–1 –0.46** –0.27** –0.35** –0.16** –0.21** –0.23** n.a. n.a. n.a. n.a. n.a. n.a.LnSE t–1 n.a. n.a. n.a. n.a. n.a. n.a. –0.72** –0.62** –0.68** –1.29** –0.24** –0.33**
∆lnEMP t n.a. n.a. n.a. n.a. n.a. n.a. –2.34** 0.26* 2.70** 1.10** 1.93** 1.17**lnEMP t–1 n.a. n.a. n.a. n.a. n.a. n.a. 0.50** –0.51** 2.00** 2.00** –0.69** 0.64**
∆lnGDP t 1.79** 0.72* –1.01** –0.21** 1.09**lnGDP t–1 0.30** 0.08** –0.63** –2.13** –0.95** –0.23** 0.12** –1.04**
∆lnFEM t 2.68** 1.14* –2.35* 6.43** –1.30** –0.49** 2.14**lnFEM t–1 0.43** 2.60** –1.65** 2.14**
∆lnMAN tlnMAN t–1 –0.13** 0.08** 0.37** 1.00**
∆lnSERV t –1.52** –3.34** –0.56** –1.64** 0.11* –0.94** –0.11**lnSERV t–1 0.28** –0.32** –0.11** 0.63** 0.19** –0.15**
∆lnSCVA t 0.34** 0.70** 0.69** 0.78** 0.59**lnSCVA t–1 0.60** 0.57** –0.15** 0.38** 0.24** –0.41** 1.21** 0.82** 1.12** 0.35**
∆lnUNR t 0.07* –0.40** 0.08** 0.07**lnUNR t–1 –0.17** 0.05** 0.27**
∆MTR t 0.38*MTR t–1 0.30**
∆ATR t 1.15** –1.63* 1.70**ATR t–1 –1.08** –0.50* –2.40** –2.26** 2.72** –1.23**
∆lnREPR t –0.32** –0.28**lnREPR t–1 –0.15**
Number of observations 33 33 34 34 34 70 33 33 34 34 34 70Adjusted R 2 0.83 0.67 0.48 0.90 0.53 0.63 0.79 0.96 0.69 0.98 0.61 0.68
** significant at 5% level, * significant at 10%.n.a. not applicable.a) ∆ indicates that the variable was used in first difference form. See Annex B for details of the specifications of the OECD Secretariat model.

176 – OECD Employment Outlook
the presence of barriers to entry into self-employment,including the existence of capital market failures; admin-istrative burdens associated, particularly, with require-ments to report to a number of different administrations;and the lower social security protection of the self-employed relative to wage earners. To counteract thesebarriers as well as to help people find a job, governmentshave put in place different programmes and schemes tostimulate self-employment and the creation of new enter-prises. They have also tried to reduce the rate of failure ofself-employed businesses, where this is judged to be due tothe lack of necessary skills, particularly managerial skills.
As concluded by a recent Joint US-EU Seminar onEntrepreneurship [US Department of Labor (2000)], pub-lic policy can help entrepreneurship in several ways,although success in business creation must always dependon individual entrepreneurs. Self-employment depends on“conditions” (e.g. access to finance; administrative bur-dens; taxation; social policies like health, social insuranceand pensions), “skills” (human capital, managerial skills)and “spirit” (or personal choice). Policy interventionshould take all these dimensions into account. However,whereas governments can intervene to shape the generalframework formed by the “conditions” and the “skills” inorder to increase opportunities, the “spirit” rests on per-sonal choices, vision, determination and willingness totake risks. These are conditioned by the culture, and byfamily and local traditions, and are not easy to modify. Infact, self-employment is also an imitative phenomenon.Since a culture that supports risk-taking and individualreward associated to effort plays an important role insupporting entrepreneurial activities, several governmentshave recently tried to promote a culture of entrepreneur-ship [OECD (1999b)]. One important avenue has beenthrough initiatives in partnership with non-governmentalinstitutions through the education system, to integrate edu-cation or vocational training and self-employment oppor-tunities (via school or university projects).
Rather than attempt to review all policies designed tofoster entrepreneurship, this section concentrates on poli-cies, concerned with the self-employed as individuals,which can be considered to fall into the category ofnational active labour market policies. More precisely, thelist of areas under consideration is as follows:
• policies to help self-employed people develop theirbusinesses, and in particular take on employees whenappropriate;
• policies directed against “false” self-employment;
• policies to assist unemployed people to enter self-employment;
• policies to help young people and women enter self-employment.
However, it must be noted that the uneven informa-tion about the measures taken in different countries and thelack of evaluations in most cases, limit the extent to whichit is possible to judge the cost-effectiveness of policies,making very difficult to draw hard-and-fast conclusionsabout what works in these areas.
Policies to help self-employed people develop their businesses
The analysis above has noted the lower levels of train-ing and the higher levels of employment instability of own-account workers, compared with employees. This may pro-vide arguments for governments to facilitate access by theself-employed to appropriate training programmes, whichmight help to sustain the viability of their businesses andavoid unnecessary failure [Metcalf (1998)]. Unless the self-employed are able to organise themselves appropriately,they will fail to enjoy the economies of scale that are pos-sible when training is conducted in larger companies. How-ever, it would appear that only a few countries have adoptedsuch programmes. They include the following:
• Italy, where, since 1996, Law 608/96 offers specialtraining courses (eight weeks) for the self-employedwith a component aimed at vocational guidance andanalysis of entrepreneurial abilities and anothercomponent aimed at training and technical assistance.
• Belgium, where the EU National Action Plan for1998 includes the promotion of vocational trainingoutside normal working hours for the self-employed.
• Spain, where the “Plan integral de Fomento Empre-sarial de Autónomos”, launched in 1999, aims tooffer the self-employed counselling and advice tohelp them design their strategic business plan andimprove competitiveness, by training in areas such asbookkeeping, marketing, financing, foreign trading,information and technology.The analysis in Section II suggests that the propor-
tion of own-account workers who become employers isquite low. Conversely, employers are no more likely tohave come from the ranks of own-account workers thanfrom employees. In some ways this is surprising, as own-account workers presumably have many of the skillsneeded by employers. However, the lack of managementskills and experience of employing staff may act as a bar-rier to own-account workers transforming themselves intoemployers.
While most governments encourage SMEs in hiringnew employees by reducing social contributions though arange of different programmes, few countries direct such

The Partial Renaissance of Self-employment – 177
© OECD 2000
help specifically to the self-employed. Among those thathave done so are:
• France, where the 1989 programme Exonerationtotale des cotisations patronales de Sécurité Socialepour l’embauche d’un premier salarié (extended tomanagers of Sociétés à responsabilité limitée in 1990and to other associations, co-operatives and mutuellesin 1992) offered new employers exoneration fromsocial security contributions for up to 2 years.According to an evaluation of the programme madeby the French Ministry of Employment and Solidar-ity [DARES (1999a)], the average number of bene-ficiaries during the period 1990-98 was 70 000, witha peak around 90 000 in 1994 and in 1998. The neteffect on employment of this measure has been esti-mated at around 20 per cent [DARES (1996)].
• Belgium, where the 1988 programme Plus un, plusdeux offered a reduction of the employers’ socialsecurity contributions for the first three employees,declining over a period of three years.
• Finland, where the 1998 reform reduced and simpli-fied employers’ social security contributions in busi-nesses with less than five employees.
• Ireland, where the County Enterprise Board pro-motes the development of micro-businesses at locallevel, providing an employment grant (of up toIEP 5 000) for each new full-time job created.
Policies to combat false self-employment
At the same time as introducing policies to encour-age self-employment, a number of governments have beenconcerned with the possible growth of “false” self-employment (work situations which are classed as self-employment primarily in order to reduce tax liabilities). Aprimary objective is to reduce the level of tax avoidance.While the main policy instruments involved are fiscalones, labour market policies are also important, becauseincentives for “false” self-employment may also stem fromoverly strict labour protection laws. In addition, it has beensuggested, for Germany, that policies to encourage self-employment, particularly those which encourage unem-ployed people to enter self-employment (see below), mayencourage the development of self-employed businesseswith relatively low levels of resources and that part of thesemight be classed as a form of false self-employment[Pfeiffer (1999)].
Recently, special measures were introduced inGermany to control false self-employment. As notedabove, a high proportion of the very large increase inself-employment in the 1990s was accounted for byown-account workers. Further analysis showed that
many of them appeared to be working for just oneemployer. According to estimates from the FederalEmployment Office, in 1995, between 12 and 27 per cent ofall self-employed without employees may have been“false” self-employed23 [Pfeiffer (1999)]. To limit thetendency for wage workers to slide into the category of“false” self-employed, the German government laiddown in 1999, more stringent conditions for a person,previously classified as an employee, to become clas-sified as self-employed for social security purposes.According to the new regulation,24 a person is classed asan employee if any three of the following five conditions arefulfilled:
• The person does not employ other workers atwages above DEM 630 per month (including familymembers).
• The person depends strongly upon one employerover a long time.
• The person is employed with tasks for which his/heremployer or a comparable employer usually employsdependent workers.
• The person does not act as an entrepreneur.
• The person is employed with the same tasks by thesame employer for whom he or she previously workedas an employee.
Similar policies have been introduced in a number ofother countries, including:
• Greece, where concern over the growing incidenceof false self-employment spurred the August 1998Law on Industrial Relations according to which workagreements between self-employed persons andcompanies must be notified in writing to the Ministryof Labour within eight days, failing which the workwill be regarded as falling within a dependentemployment relationship.
• Belgium, where concern that false self-employmentwas present in all sectors [Ministère de l’Emploi(1995)] led the government to introduce a newprocedure, through the Arrêté Royal of 25th Jan-uary 1991, for monitoring the work relations of peo-ple entering self-employment from wage and salaryworking.
• Italy, where, in the context of limiting the informaleconomy, efforts to encourage enterprises and work-ers to “rise to the surface” have been continued inLaw 196/97 and particularly by wage realignmentcontracts. These contratti di riallineamento providefor social security contributions to be progressivelyaligned to normal levels, and concern nearly 90 000workers since 1997, the majority of whom worked inthe agricultural sector.

178 – OECD Employment Outlook
Policies to help unemployed people enter self-employment
While flows from unemployment to self-employmentare relatively small, the analysis above suggests that theyare comparatively little affected by cyclical downturns andmay provide a small, but valuable source of employment inrecessions. Particularly when unemployment is high, itseems reasonable that a certain proportion of the unem-ployed will have the skills that are needed to begin and runsuccessful businesses, but they may need to overcome con-siderable barriers in doing so. Over the years, governmentsin an increasing number of OECD countries have intro-duced policies to encourage these flows, by convertingunemployment benefits into various forms of grants, tohelp unemployed people become self-employed.
Expenditure on such policies, as a percentage of totalpublic spending on active labour market policies (ALMPs),varies from almost zero (Belgium) to 5 per cent (Greece)over the most recent period (Table 5.14). The number ofparticipants in these schemes varies between almost zero(Belgium) to over 6 per cent (Sweden) of the numbers ofunemployed. Over the whole period shown in the table,1985 to 1998, there were increases in expenditures and inparticipants in around half the countries and decreases in theothers. Particularly sharp increases were seen in Australia,Canada, Germany and Sweden while large declines wererecorded in the Czech Republic, Spain and the United
Kingdom. However, these schemes are too small toinfluence the overall movement of self-employment, andindeed no correlation was found between trends in self-employment and expenditures on these schemes.
While the general approach of the schemes for theunemployed, listed in Table 5.15, is the same in all countries,there are a number of important differences, as follows:
• Eligibility: in most countries, eligibility is broadenough to cover all registered unemployed receivingunemployment benefits. In France, people receivingthe minimum reinsertion benefits (RMI) or the sin-gle-parent allowance (API) can also apply, and inCanada people having received parental or maternitybenefits during the last five years who want to re-enterthe labour market by creating their own business, arealso eligible. Some countries fix a minimum lengthfor the unemployment duration like Denmark (fivemonths), France (six months) or Luxembourg (eightmonths), and others (Ireland, Portugal) give priorityto the long-term unemployed.
• Mode of financing and payment duration: here adistinction can be made between two differentmodels. The allowance is paid weekly or monthlyat a rate equal to the unemployment benefit inAustralia, Austria, Belgium, Canada, Denmark,Finland, Germany, Greece, Hungary, Ireland,
Table 5.14. Public support for unemployed persons starting enterprisesin selected OECD countries
Spending on such measures as Average annual inflows Ratio of inflows of participantspercentage of spending on ALMPs a of participants to total unemployed
1985-1989 1990-1994 1995-1998 b 1985-1989 1990-1994 1995-1998 b 1985-1989 1990-1994 1995-1998 b
Australia 0.5 2.6 3.9 886 3 203 8 244 0.2 0.4 1.1Belgium 0.7 0.3 0.2 1 881 439 284 0.4 0.1 0.1Canada . . 2.2 4.1 . . 6 347 12 904 . . 0.4 0.9Czech Republic . . 7.0 1.8 . . 11 025 975 . . 6.9 0.4Denmark 1.8 6.4 3.5 2 153 5 887 3 124 1.1 2.2 1.7Finland 1.8 2.2 2.1 3 075 7 000 6 050 2.7 2.3 1.7France 5.1 2.5 1.1 67 367 59 568 50 006 2.8 2.3 1.6Germany 0.4 0.3 2.1 7 150 24 000 84 800 0.3 0.9 2.3Greece 4.4 8.7 5.1 4 983 7 533 5 775 1.7 2.3 1.3Hungary . . 7.8 0.9 . . 8 633 3 600 . . 1.8 1.0Ireland c 3.4 1.4 1.0 3 453 2 229 1 067 1.6 1.1 0.6New Zealand 2.8 5.0 2.6 2 400 2 852 2 961 2.4 1.8 2.2Portugal 5.8 5.7 2.7 4 603 15 481 6 731 1.6 6.8 2.0Spain 24.5 17.6 4.9 63 438 69 177 33 333 2.3 2.5 1.0Sweden 0.4 1.5 3.7 2 000 10 300 19 767 2.5 4.0 6.3Switzerland . . 0.2 0.6 . . 300 850 . . 0.2 0.3United Kingdom 4.8 2.9 0.7 80 000 37 400 6 000 4.6 1.6 0.3
a) Active labour market programmes (ALMPs) cover public employment services and administration, labour market training, youth measures, subsidisedemployment and measures for the disabled.
b) 1997 for Australia, Canada, Greece and the United Kingdom. 1996 for Ireland and Portugal. c) Break in series.
Sources: OECD database on labour market programmes; OECD database on annual labour force statistics.

The Partial R
enaissance of Self-employm
ent –179
© O
EC
D 2000
Table 5.15. Self-employment assistance for the unemployed
DateCountries Programme Eligibility criteria Main features
introduced
Australia New Enterprise 1985 Unemployed. The assistance includes an income support allowance, for up to 52 weeks, equivalent to theIncentive basic rate of unemployment benefits. It also includes training in small business management,Scheme (NEIS) business skills and business plan development, business advice and mentor support during
the first year of the business operation.
Austria Business 1998 Unemployed claiming The assistance includes an allowance that equals the unemployment benefits during a periodStart-up unemployment insurance of 9 months. Aid in counselling and training is also offered in the preparation phase and,Programme or unemployment assistance. under certain conditions, an allowance of ATS 63/day (USD 5/day) for the social insurance(UGP) contributions can also be offered during the realisation phase.
Belgium 1992 Unemployed (from the first day). The system consists of loans (of BEF 800 000, around USD 22 040) for start ups, subjectYoung unemployed people can to certain conditions.apply even without entitlementto an allowance.
Canada Self Employment Replaced SEI Unemployed claiming (or having Applicants must be legally entitled to work in Canada, have not participated previously inAssistance in 1992, claimed within the last three self-employment activity through a similar programme, must have attended an orientation
reformed years) unemployment insurance session provided by the delivery agent and must have completed a self-evaluation onin 1996 benefit as well as people having suitability for self-employment. They also have to agree to work full time (30 hours or more)
received maternity or parental and must also make a previously determined personal equity contribution to theirbenefits within the last five years. self-employment business. Participants may not work on commission, but partnerships,
limited companies, worker co-operatives and franchises are permitted subject to someconditions. If all those prerequisites are satisfied applicants can receive a weekly taxableallowance (initially for 52 weeks, but the period has been reduced since 1996) insteadof unemployment insurance.
Denmark Enterprise 1985 to 1998 Any insured person, unemployed Consists of a grant of 50% of unemployment benefits (in 1997 it was around DKK 70 000 perAllowance for five months during year, around USD 10 400), paid on a monthly basis during 2.5 years.Scheme the last eight.
Finland Start-up grant 1984 Unemployed. The monthly allowance equals the employment subsidy but can be increased up to amaximum of 80% (that means by 2 500 to FIM 4 500 per month or between 450 andUSD 840). The allowance is paid for up to 10 months and to receive it, training or experiencein entrepreneurship is required.
France ACCRE Scheme 1977, Since 1997 directed to the Initially the financial assistance was set between 16 168 and FRF 43 000, but the maximumreformed unemployed (with or without lump sum was reduced to FRF 32 000 in 1994 (around USD 5 750 of 1994) and finallyin 1994 and benefits), and to people receiving eliminated in 1997 (if the business failed after 6 months the recipient had to repay the1997 the minimum reinsertion wage money). Since 1997 the main assistance has consisted of an exemption from social security
(RMI), or the single parent contributions for one year (prior to 1997 it was for the first 6 months of activity). Applicantsallowance (API). must demonstrate the likely viability of the project.
Germany Bridging 1986, Unemployed. The allowance equals the unemployment benefit or assistance, and is paid for up toAllowance reformed 6 months. The administration assesses the sustainability of the planned new activity, which
in 1994 has to be at least 18 hours of work a week. This assessment is to ensure that theunemployed person, after a starting phase, is able to earn a gross monthly income equal toat least 2/3 of the average income of an employed person in a similar job. The social insurancecontributions to be paid on these benefits are paid by the employment office. The schemealso involves a micro-finance loan component.

180– O
EC
D E
mploym
ent Outlook
Table 5.15. Self-employment assistance for the unemployed (cont.)
DateCountries Programme Eligibility criteria Main features
introduced
Hungary Self-employment Unemployed. A series of monthly payments equal to the regular unemployment compensation benefitassistance (which can be extended 6 months beyond the UC one-year eligibility period). Support may
also include reimbursement of up to half the cost of professional entrepreneurshipcounselling, and half the cost of training courses required.
Ireland Back to Work 1993 Unemployed. Replaced the Area Enterprise Allowance Scheme (AEAS), introduced at the local level in 1992Allowance for the long-term unemployed. The BTWAS is at national level and offers support for threeScheme years at a rate of 75% of the previous level of welfare income for the first year, 50% for the(BTWAS) second one, and then 25%.
Italy Subsidised Loan 1996 Unemployed in crisis areas, Consists of grants from public funds of up to USD 30 000 (60% from non refundable grants(Act 608/96) beginning with craft and and 40% from low interest loans to meet capital and operating costs). Investment projects
manufacturing businesses. are evaluated and selected according to their viability. Once the project is selected,applicants are ‘‘tutored’’ by specialised consultants and must undergo special training of upto eight weeks.
Netherlands Assistance to 1985, Unemployed. The programme allows for a loan for working capital (up to NLG 42 000 or aroundSelf-employed reformed USD 21 150) and/or temporary income support up to 18 months. Since 1998 there is a trialDecree (BBZ) in 1998 period for unemployed starters to examine their potential markets and develop a business
plan; an allowance for guidance and advice; an increase in the amount of credit; an extensionof the period to award supplementary income support; the possibility of taking account ofincome from other sources (another job, partner’s income) when deciding on the viabilityof a plan; and special provisions for persons who are handicapped or with care obligations.
Norway Benefit 1990 Unemployed. The allowance equals the unemployment benefit for up to 9 months (3 months areestablishing considered necessary for the start-up phase and 6 months for the development one).own-business Commercial assessments are required from the municipality (or from another competent
body) to start and maintain the new enterprise.
Poland Self-Employment Selected registered unemployed. Consists of a lump sum provided through a loan programme from the Labour Fund, withAssistance immediate repayment required if the business is not started. The maximum support is
20 times the national average wage and interest rates are at market rates. An incentiveto businesses to survive at least 2 years is provided by a 50% reduction of the repaymentof the principal.
Portugal Support grant 1989 Unemployed. Recipients are given the total amount of their unemployment benefits in the form of a grantfor for to creating their own business. An additional non-refundable grant for planning, settingself-employment up and operating the project is also provided. The maximum grant is 12 x the minimum wage(CPE) and may be increased by 20% for beneficiaries more than 45 years old and unemployed
for more than 1 year. A viable business plan is a requirement.
Spain Unemployment 1985, Since 1992, only owned-workers The programme was initially directed to the unemployed entitled to unemployment benefits,benefit reformed have been eligible. but since 1992 has been restricted to unemployed people wanting to create co-operatives orcapitalisation in 1992 limited companies of workers. It consists of an advance payment of the full unemployment
benefit to start-up the business. It can also be accompanied by a partial reduction of socialsecurity contributions during two years, and an income tax exemption (up to one millionof ESP, around USD 6 690).
Promotion of Unemployed registered at Consists of loans for investment in fixed capital at subsidised interest rates (up toautonomous National Employment Service. ESP 500 000) as well as subsidies for technical assistance (up to 100% of the cost).workers

The Partial R
enaissance of Self-employm
ent –181
© O
EC
D 2000
Table 5.15. Self-employment assistance for the unemployed (cont.)
DateCountries Programme Eligibility criteria Main features
introduced
Sweden Start-up grants 1987 Unemployed aged above 20. Grants are available for applicants presenting a viable project. The grant equals the benefitthat would have been paid from the insurance fund (it can also be provided for people notentitled to such benefits) and it is payable for a maximum of 6 months (in some casesfor 12).
United Kingdom Business Start 1993 Unemployed for at least 6 weeks. Replaced the Enterprise Allowance Scheme (EAS) of the 1980s. It consists of an allowance ofUp Scheme GBP 40 (USD 66) per week paid for one year. More emphasis is now given to likely business(BSUS) survival.
United States Self-Employment 1994 Unemployed. Only seven states introduced SEA. The programme paid weekly allowances to participants andAssistance provided support services for business start-ups. SEA participants were limited to no more
than 5% of those receiving regular unemployment insurance benefits.
USD values are calculated with the 1998 average daily nominal exchange rate of the different currencies vis-a-vis the USD.Sources: Country submissions and reviews by the European Commission.
182 – OECD Employment Outlook
Sweden, the United Kingdom and the UnitedStates. It is given in the form of a lump-sum grantduring the start-up phase of the new businesses inFrance, Italy, Luxembourg, Poland, Portugal andSpain.25 Only the Netherlands seems to offer thepossibility to choose between the two models,leaving applicants to decide if they prefer a loan toprovide working capital, or temporary incomesupport, or a mixture of the two.
• Controls on the viability of the self-employmentbusiness: some countries, including Canada, France,Germany, the Netherlands, Portugal, Spain and Swedenrequire a business plan to be presented and approvedby the competent authorities. To be eligible for theGerman Bridging Allowance, participants must showthat the proposed self-employed activity can generateat least two-thirds of the gross monthly incomereceived by an employed person for the same kind ofjob. By contrast, the United Kingdom EnterpriseAllowance Scheme (EAS), now replaced by the Busi-ness Start-Up Scheme (BSUS), places no restrictionon the potential wage level. Overall, the trend acrossOECD countries appears to be towards greater stresson a viable business plan.
• Availability of counselling and training: severalcountries include this as a component of theirschemes, but do so in different ways. For example, inFrance, self-employed people creating firms throughthe programme Aide aux Chômeurs Créateursd’Entreprise (ACCRE) can receive a number ofChèques-Conseil to spend on counselling at thebeginning of the creation of the firm and during thefollowing year. In Denmark, a subsidy of DKK 7 000is offered to cover consultancy fees for start-ups. Inthe United Kingdom, the Training for Work Pro-gramme, set up in 1993, allows for an increase in theweekly BSUS allowance received by the unem-ployed when undergoing training. Overall, theimportance attached to training and counselling inthese programmes appears to be increasing.
Despite all the experience gained with these schemesover the years, few evaluations are yet available. Whileone explanation for this is a lack of a “scientific” evaluationculture in many European countries, another relates to thedifficulty of assessing the size of the deadweight, substi-tution and displacement effects arising from such schemes.Deadweight effects occur, for example, when someoneintending to set up as self-employed becomes unemployedfor a period simply in order to become eligible for a grantwhich is not strictly needed. Substitution effects occur whena self-employment opportunity which would have beentaken up by one person is taken by another, simply because
the second person is eligible for a grant. Displacementeffects occur when new self-employment businesses,supported by grants, drive unsubsidised businesses out ofthe market; such effects are very difficult to measure unlessthe population of businesses likely to be affected iswell-defined.
Evaluation of the recent Canadian Self-EmploymentAssistance programme (SEA) indicated benefits to partic-ipants both in terms of increased earnings, and increasedconfidence in the use of skills in the labour market. On theother hand, it was also concluded that it applied only to anarrow group of the potential self-employed, and tooksome time to recoup its funding. These findings are echoedby most studies, which report a generally positive inter-national experience of success of self-employment assist-ance programmes in increasing participant’s income andreducing dependency on unemployment insurance, thoughthey apply only to a small group of highly motivated indi-viduals [Martin (2000); Wong et al. (1998)]. As the grantsare in lieu of unemployment benefits, the cost of the pro-grammes tends to be low, even after allowing for likelydeadweight effects.
One crucial question is the survival rate of the busi-nesses concerned. This seems to depend very considerablyon the severity of the criteria applied to the business plan.For example, in Germany, where the criteria are particularlystringent, a study by the Institut für Arbeitsmarkt undBerufsforschung of a sample of newly created businessessince 1994 set up by unemployed people who received the“Bridging Allowance” found that, three years after receivingthe support, 70 per cent were still self-employed and that onaverage each recipient had taken on one employee. A verysimilar result was found in the Netherlands. In Sweden, fouryears after having received the Start-up allowance,59 per cent of the unemployed were still in business[Okeke (1999)] whereas in France 51 per cent of the enter-prises created by the unemployed under the ACCRE schemewere still in place three years after having received the aid,compared with a survival rate of 42 per cent for thoseenterprises created by the unemployed without aid, and61 per cent for the enterprises created by workers[DARES (1999b)]. In other countries, e.g. Ireland, Norwayand the United Kingdom, anecdotal evidence suggests thatonly a relatively small share of subsidised enterprisesshowed good longer term survivability [OECD (1996)].
However, high levels of survival need to be inter-preted carefully before one can assume that the programmein question worked well. High survival rates can be asso-ciated with “creaming” – the programme assures successby accepting only the very best candidates. In turn, thisraises the likelihood of deadweight costs – such candidates

The Partial Renaissance of Self-employment – 183
© OECD 2000
might very well have created their own business anyway[O’Leary (1998)]. Lower survival rates do not necessarilyimply that a higher proportion of the money spent has nolong-term effect. Some studies suggest that a higher per-centage of programme participants than non-participantssucceed in finding long-term employment, even if theirbusinesses do fail [OECD (1998b)].
Self-employment policies for young people and women
Young people
Section III showed that the expressed preferences forself-employment among young people are relatively high(especially among well-qualified young men). However, asnoted above, the incidence of self-employment increaseswith age, and the relative incidence among young people islow [see, for example, Blanchflower (1998)]. The reason forthis low incidence is no doubt to be found in the lower levelsof capital (both financial and human) of most young people.Enterprises begun by young people generally tend to be lesssuccessful, and have higher failure rates than those begun byolder people. Government policies to encourage young peo-ple to enter self-employment are thus likely to receive a highdegree of interest, but may also require a comparatively highinvestment of resources and provide uncertain returns.
Over recent years, a number of countries have intro-duced self-employment policies specially tailored foryoung people (see Table 5.16). None of the schemes haveyet been subjected to careful evaluation, as far as known.By comparison with policies to assist self-employment ingeneral, special emphasis is always laid on training.However, in many other respects, the schemes take ratherdifferent approaches:
• The Italian Law 44/86 scheme stresses help in thedevelopment of business plans, and involves the useof a mentor firm to provide part of the technical train-ing and support to the new enterprise.
• The French Encouragement au Développementd’Entreprises Nouvelles scheme is principally directedto young people already eligible for employment con-tracts (emplois jeunes), offering them a reimbursableinterest-free loan.
• The Canadian Graduate Employment/Self-employment Initiative aims at helping relativelywell-qualified young people to set up businesses ingrowth sectors, offering them a range of trainingprogrammes, including distance education.
• The United Kingdom New Deal offers since 1999 toyoung people who have found it difficult to find work, aprogramme that includes a special course designed tohelp potential participants decide if self-employment is
suitable for them. If they join the self-employmentoption, they receive an allowance and can get adviceand support from training providers for up to sixmonths. The programme also offers the opportunity totrain towards an approved qualification.
Women
In almost all countries, the numbers of women inself-employment have begun to increase considerably.However, women employees and labour market entrantsstill tend to express considerably lower preferences forentering self-employment than men. In addition, the typeof self-employment sought by many women tends to bedifferent. For example, some women tend to seek forms ofself-employment which fit in with family activities, in par-ticular self-employment which can be done at home, andfor relatively short hours. Differences between womenself-employed and men can be due to many factors, rang-ing from differences in cultural attitudes towards entrepre-neurship, risk-taking, and women’s role in society, as wellas to the prevailing economic structure and the availabilityor affordability of family services. Personal characteristicssuch as family size, marital status, and the ages of childrenalso play an important role for many women in the deci-sion to become self-employed [Williams (1998)].
Women considering entry to self-employment mayface barriers which are additional to those faced by men[OECD (1999c)]. These stem partly from their comparativelack of a track record as entrepreneurs. Women face alsoextra difficulties due to different characteristics in the waythey start and manage their business. In general, womentend to start with lower capital than men, and tend to favourless ambitious projects, smaller investment and smallerloans. The positioning in the market is also different becausewomen have in general less market connections from theirprevious job than do men, and have less mobility due tochild-care obligations [OECD (1999d)]. Female self-employed are less likely than men to have employees andare more likely to establish service sector firms, whose mainassets are intangibles, which are difficult and costly to eval-uate, increasing the risks perceived by lenders. Extra diffi-culties in attracting finance can also arise from the weight ofsocial values that may make financial intermediaries seewomen as less capable of running a business.
For these reasons, and also as part of equal employ-ment and gender mainstreaming strategies, a number ofcountries have introduced programmes to encouragewomen’s self-employment. As can be seen from the partiallist in Table 5.17, one strong emphasis is on the provision ofloans, to counteract the fact that women may face additionaldifficulties in obtaining finance. In addition, some of the

184– O
EC
D E
mploym
ent Outlook
Table 5.16. Programmes to promote self-employment among youth in selected OECD countries
DateCountries Programme Eligibility criteria Main features
introduced
Australia Self-Starter 1985 Young unemployed between An extension of the New Enterprise Incentive Scheme (NEIS). The support consists of a grant18-25 years old. (up to AUD 3 000, around USD 1 880) and is accompanied by the provision of appropriate
business skills and financial assistance.
Belgium 1992 Young unemployed, even without An extension of the support system for the unemployed. The support consists of subsidisedentitlement to an unemployment loans of BEF 800 000 (USD 22 040) for starts-up under certain conditions.allowance.
Canada The Graduate/ 1994 Young graduates. Supports new business by encouraging graduates to become self-employed in growthSelf Employment sectors. Support includes a training allowance of CAD 800 (USD 540) and a distanceInitiative education programme.
Sectoral Youth Young people. Offers partial financial support for a period of up to 18 months to help subsidise on-the-jobInternship training for self-employment.Program
Young 1996 Young people between The programme offers a loan (up to CAD 25 000, around USD 16 850) for the start-up phase,Entrepreneur 18-34 years old. with a duration of 4-7 years, and is complemented by 50 hours of management support. ItFinancing also gives access to professional business management counselling as part of a tailor-madeProgram business plan.
France Youth Initiative 1985-1993 Young people. Programme offering low-cost advice (legal, financial, administrative, etc.) in the form of grantDepartmental aid (between FRF 10 000-100 000, around USD 1 695-16 950). The programme was laterFunds extended to other age groups and finally merged into a broader system of aid to
entrepreneurship.
EDEN Scheme 1997 Young people eligible for The scheme gives exemption from social insurance contributions and a reimbursable‘‘emplois jeunes’’. Also for people advance payment (consisting of a loan free of interests up to a maximum of FRF 40 000 orreceiving the minimum USD 6 780). The granting of the payment is subject to the recipient obtaining additionalreinsertion wage (RMI), or the financial support at least half the sum of the advance. Counselling, training and supportsingle parent allowance (API) as activities may also be subsidised.well as workers buying out theenterprise.
Greece Programme 1988 Unemployed between 18 and A subsidy is offered, up to 12 months, to young unemployed people to start their newfor new 30 years old. business, of up to GDK 250 000 (USD 850) for business in the trade and service sectors andprofessionals up to GDK 350 000 (USD 1 185) in the manufacturing sector. A viability plan is required.
Italy Act 44/86 1986 Youths under 36 years old. Provides monetary subsidies (90% of investment and operating cost in the South and 60% inthe rest of Italy) and technical assistance during the initial years of activity, for youthstarting a business in the agriculture, crafts or manufacturing sectors in areas supported byEU funds.
Act 236/93 1993 Unemployed under 35 years old. Offers monetary subsidies and technical assistance co-financed by EU Funds to start up newfirms or co-operatives providing services in certain sectors (environmental, tourism, culturaland agricultural) in Southern Italy (extended to other ‘‘crisis areas’’ in 1997).
Portugal Support 1995 Young persons between 18 and Offers a non-refundable installation grant corresponding to 12 times the minimum wage asfor entry into 25 years (until 30 years in the well as assistance in drawing up the viability plan after a training course of six weeks inself-employment region of Madeira). organisation and management. This programme is also available for long-term unemployed(ACPE) qualified for independent professions, including handicrafts, sector for which an additional
aid may be available.

The Partial R
enaissance of Self-employm
ent –185
© O
EC
D 2000
Table 5.16. Programmes to promote self-employment among youth in selected OECD countries (cont.)
DateCountries Programme Eligibility criteria Main features
introduced
United Kingdom New Deal 1999 Young people 18-24 years old. After a short course (one day a week for four weeks) to help decide whether self-employmentis a suitable choice for them, participants receive further information and training in order toproduce a business plan. The self-employment option for participants in the New Deal forYoung People offers an allowance plus a grant of up to GBP 400 (USD 660) paid in equalweekly or fortnightly instalments. The profits earned by the business during the six firstmonths can be reinvested or put in a bank account until the period of the option has ended.
USD values are calculated with the 1998 average daily nominal exchange rate of the different currencies vis-a-vis the USD.Sources: Country submissions and reviews of the European Commission.
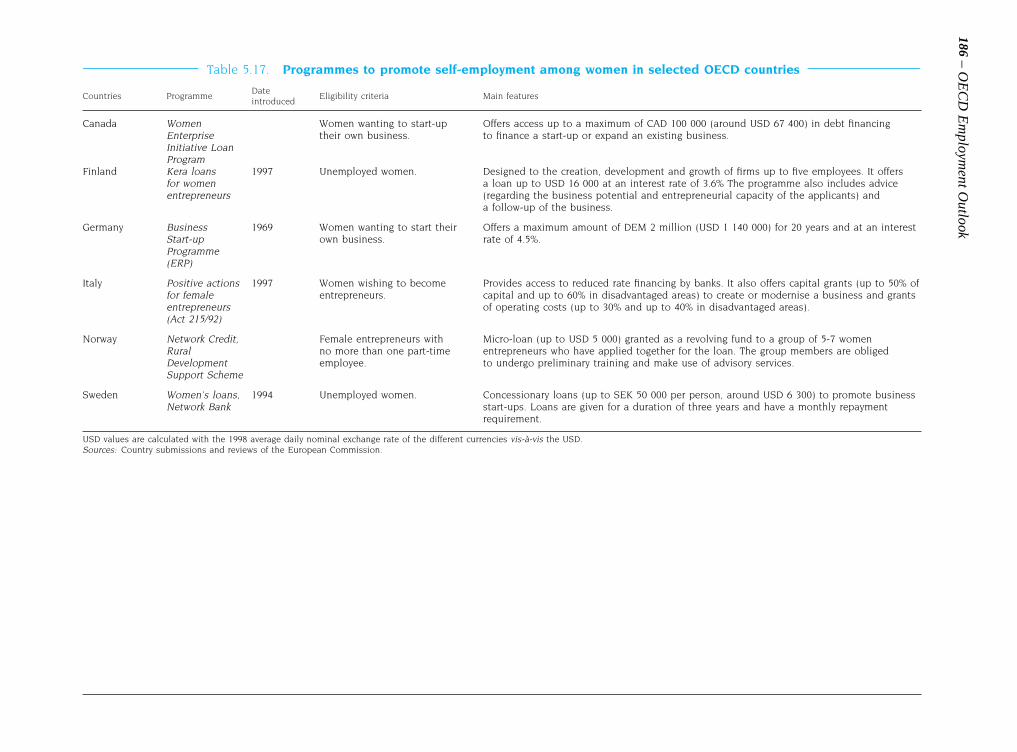
186– O
EC
D E
mploym
ent OutlookTable 5.17. Programmes to promote self-employment among women in selected OECD countries
DateCountries Programme Eligibility criteria Main features
introduced
Canada Women Women wanting to start-up Offers access up to a maximum of CAD 100 000 (around USD 67 400) in debt financingEnterprise their own business. to finance a start-up or expand an existing business.Initiative LoanProgram
Finland Kera loans 1997 Unemployed women. Designed to the creation, development and growth of firms up to five employees. It offersfor women a loan up to USD 16 000 at an interest rate of 3.6% The programme also includes adviceentrepreneurs (regarding the business potential and entrepreneurial capacity of the applicants) and
a follow-up of the business.
Germany Business 1969 Women wanting to start their Offers a maximum amount of DEM 2 million (USD 1 140 000) for 20 years and at an interestStart-up own business. rate of 4.5%.Programme(ERP)
Italy Positive actions 1997 Women wishing to become Provides access to reduced rate financing by banks. It also offers capital grants (up to 50% offor female entrepreneurs. capital and up to 60% in disadvantaged areas) to create or modernise a business and grantsentrepreneurs of operating costs (up to 30% and up to 40% in disadvantaged areas).(Act 215/92)
Norway Network Credit, Female entrepreneurs with Micro-loan (up to USD 5 000) granted as a revolving fund to a group of 5-7 womenRural no more than one part-time entrepreneurs who have applied together for the loan. The group members are obligedDevelopment employee. to undergo preliminary training and make use of advisory services.Support Scheme
Sweden Women’s loans, 1994 Unemployed women. Concessionary loans (up to SEK 50 000 per person, around USD 6 300) to promote businessNetwork Bank start-ups. Loans are given for a duration of three years and have a monthly repayment
requirement.
USD values are calculated with the 1998 average daily nominal exchange rate of the different currencies vis-a-vis the USD.Sources: Country submissions and reviews of the European Commission.

The Partial Renaissance of Self-employment – 187
© OECD 2000
schemes feature special training and counselling. Whilethese schemes are relatively new, and full evaluations arenot available, a number of them have reported success rates,in terms of the creation of viable enterprises, equal to, oronly just below, the rates usually obtained by male partici-pants in general schemes to support self-employment. Thisis, for example, the case for Sweden, where the SwedishNational Labour Market Board [Okeke (1999)] reports thatgender had no incidence on the survival rate of the enter-prises created by the self-employed with public support.Even while not having specific programmes to supportfemale self-employment, a similar result was found forFrance with the ACCRE programme [DARES (1999b)].
Conclusions
Over the past twenty-five years, self-employmenthas taken a larger place in total non-agricultural employmentin a number of OECD countries. The growth rate of self-employment, which generally lagged behind total employ-ment growth in the 1970s, outstripped it over the 1990s inmost OECD countries, notably in Canada and Germany. Inaddition, for the OECD as a whole, the proportion of self-employed with employees, which had been tending to fallin most countries over the 1970s and the 1980s, tended tostabilise during the 1990s.
The causes of these developments are not yet wellunderstood. At the national level, the reasons for the rapidgrowth in self-employment in Canada and Germany in the1990s, and even that in the United Kingdom in the 1980s,are still not clear, though it is noticeable that in all thesecases, the growth was concentrated on self-employed withoutemployees. In addition, in both Germany and the UnitedKingdom the growth was accompanied by substantialgovernment programmes designed to encourage self-employment and foster a climate of entrepreneurship. At theinternational level, the clearest statistical relationship is thetendency for self-employment to be lower in countries withhigher GDP per capita. As GDP per capita has been rising inall countries, including those where self-employment isrising, other factors are clearly at work. However, aneconometric investigation has failed to find a consistent setof explanatory factors across countries. One possible excep-tion is the growing share of national income accounted for bycapital in many countries, a development which might beexpected to favour self-employment, whose income comespartly from their capital and partly from their labour.
At the same time, the distinction between self-employment and wage and salary employment may haveweakened, as suggested, for example, by the growth of cer-tain forms of self-employment which offer working rela-tionships close to those of an employee. This applies to
many forms of franchising, which has been growing inimportance in many countries over the 1990s. While theresponsibility of the franchisor for the franchisee is gener-ally less than that of an employer for an employee, the free-dom of action of a franchisee may be hardly any greater thanthat of an employee, despite the financial responsibility thathe or she carries. In addition to Canada, Germany and theUnited Kingdom, several countries, at different times, haveseen growing numbers of self-employed people who work forjust one company, and whose self-employment status may belittle more than a device to reduce total taxes paid by the firmsand workers involved – the phenomenon of so-called “false”self-employment.
Concerns have sometimes been expressed about thequality of self-employment jobs, particularly in terms oftheir working conditions and their earnings. The results pre-sented in this chapter show that own-account workers (self-employed people without employees) tend to report poorerworking conditions than employees, including longer hoursof work. In addition, almost a fifth of self-employed peoplein the European Union say that they would prefer to work asemployees, and more own-account workers than employeessay they feel their jobs are insecure. Nevertheless, the self-employed also feel that they are in greater control of theirworking conditions. This is one facet of the greater inde-pendence they enjoy. This, in turn, may help to explain whythey generally display higher levels of job satisfaction thanemployees in similar types of job.
The evidence also shows that the degrees to whichown-account workers engage in training and use com-puters are markedly less than those of employees. Tosome extent this may be due to the nature of self-employmentjobs and the lack of opportunities that most self-employedpeople have to engage in training, particularly in view of theirlong working hours. However, it may be a serious problemwhen the self-employed people in question lack skills,particularly management skills, which are vital for theirbusinesses.
The working conditions of employers (self-employedwith employees), appear to be better than those of self-employed people without employees. Their job satisfactionis even higher. However, the working conditions of theiremployees need also to be taken into consideration. Whileprecise evidence is not available, the analysis above, refer-ring to firms with under 10 employees, notes that employeesin such companies tend to report lower levels of autonomyand job complexity than other employees, and are less likelyto have received training in the last 12 months, or to usecomputers. They are also less likely to receive compensationfor unsocial hours of work and to benefit from family-friendly leave and working-time policies, and are slightly

188 – OECD Employment Outlook
less inclined than employees in larger firms to think their jobis secure. However, their reported job satisfaction is as high,if not higher, as that of workers in larger companies.
Policies to help unemployed people enter self-employment have been in place in several countries formany years, and considerable experience has been gainedin applying them. Generally, what evaluations exist sug-gest they have enabled a number of unemployed people toenter self-employment, and it has been argued that thisexperience may be positive even if their businesses fail.However, it seems clear that the number of unemployedpeople who can benefit from such schemes is small, andtends to be restricted to the relatively well-educated withprevious work experience.
A number of governments have recently introducedpolicies to facilitate entry into self-employment for womenand young people. Policies for young people are likely to bedifficult to implement successfully – while young peopletend to show considerable interest in self-employment, rel-atively few have the work experience and skills which seemnecessary for success. Unfortunately, there are still very few
rigorous evaluations of the cost-effectiveness of these andother policies to support self-employment.
In conclusion, the growth in self-employment seems tooffer signs of a partial renaissance, not simply because of therapid surges in self-employment seen in a small number ofOECD countries, but also in the fact that increases in the pro-portion of self-employment have been seen in such a widerange of countries. The available econometric evidence pro-vides weak grounds for concluding that these increases aredue to high levels of unemployment, or to labour marketrigidities. However, it is likely that, in some countries, part ofthe growth represents a transfer of work from wage and salaryto self-employment in order to reduce tax liabilities. Anotherfactor behind increases in self-employment may be changesin industrial organisation, including the higher levels of sub-contracting and outsourcing which are apparent in manyOECD countries. In addition, the fact that the main growth inself-employment is seen in the fastest growing sectors of theservice economy suggests that the growth in self-employmentis also a response to the new opportunities offered by OECDeconomies.

The Partial Renaissance of Self-employment – 189
© OECD 2000
NOTES
1. This paragraph draws on Barbieri (1999).
2. The figure refers to the proportion of self-employed,including owner-managers of incorporated enterprises, whoare owner-managers of incorporated enterprises.
3. As noted above, this analysis excludes the agricultural sectorand unpaid family workers.
4. The period 1990-97 is not a complete cycle. The choices of1979 and 1990 as peak years are based on OECD analysesof cyclical trends provided in http://interprod.oecd.org/std/li2.htm. As country peaks differ slightly, they werechosen on a majority basis.
5. There were increases in the numbers of self-employed inboth the western and eastern Länder. In absolute terms,between 1991 and 1998, self-employment increased from2.69 million to 3.05 in the western Länder and from0.35 million to 0.54 million in the eastern Länder.
6. In the 1990s, however, the growth rates of self-employmentand civilian employment were the same for women.
7. Meager (1991) shows that a substantial part of the rise inself-employment in the United Kingdom in the 1980soccurred in the construction industry, where arrangementsinvolving “false” self-employment were common. Therecent data show that the fall in the proportion of employersin self-employment in the United Kingdom continued afterthe increase in self-employment came to an end.
8. The statistical information on which this and the followingtwo paragraphs are based is available from the Secretariat.
9. Can the concentration of self-employment growth in thefastest-growing areas of employment growth explain the factthat self-employment growth has tended to be faster than totalcivilian employment growth, in a number of countries? Ashift-share analysis, at the 1-digit level, for occupation andindustry (not reported), showed that the patterns of self-employment by industry and occupation could account for allof the excess growth of self-employment over total civilianemployment in Mexico, but very little of that in Canada andGermany.
10. On the other hand, few available longitudinal surveys have alarge enough sample size to allow analysis of the self-employed population, particularly employers.
11. Some European Union countries were excluded from theanalysis because of deficiencies in the data.
12. Communication from Dr. Friedhelm Pfeiffer.
13. These figures refer to the stability of the state of beingemployed, or self-employed. They do not imply that indi-vidual self-employment jobs tend to last for a shorter periodthan employee jobs.
14. Based on a communication from the Austrian FederalMinistry of Labour, Health and Social Affairs.
15. As before, the calculations exclude the agricultural sector.
16. Reported data on working hours need to be treated with cau-tion. In particular, self-employed people, especially thoseworking at home, may tend to carry out work and other activ-ities at the same time. Some time-use studies have concludedthat survey data over-estimate self-employed working hoursby comparison with employees, but there is little doubt thatself-employed hours are considerably longer.
17. See Annex 5.A for details of the question used.
18. These preferences are likely to be relatively reliable, in thesense that many self-employed have previous experience ofwage or salary employment. It should be noted, however,that a substantial proportion of the 18 per cent said theywould like to return to self-employment later in their careers.
19. The explanation given by Robson and Wren (1999) is that thepre-tax level of remuneration in self-employment is likely tobe more closely related to the level of individual effort than inthe case of dependent employment. Part of the attraction ofself-employment may thus be the extra income that can beobtained by extra effort. High levels of marginal tax rates,which reduce the return from extra effort in self-employment,may thus, the argument goes, reduce the attraction of self-employment relative to dependent employment.
20. The “cultural” variables comprised Schumpeter’s competitive-ness index, Mauro's bureaucratic efficiency index, the culturalindices of Hofstede and of Hoppe (power distance, uncer-tainty avoidance, individualism and masculinity), and indicesof dissatisfaction with life and democracy, derived from theEurobarometer surveys. The economic variables were GDPper capita, the female labour share, the share of labour incomein GDP, the unemployment rate and population density. Thestrongest correlations were found with the indices of dissat-isfaction.
21. EPL data are available only for the late-1980s and late-1990s[OECD (1999a)]. A number of previous studies, includingOECD (1992), Grubb and Wells (1993), and OECD (1999a)have found positive correlations between the strictness ofEPL and the self-employment rate. However, the first twostudies were simple bivariate analyses and, while the 1999
190 – OECD Employment Outlook
study included a range of control variables, self-employmentwas not its primary focus. A re-examination of the issue byRobson (2000) has resulted in the conclusion that thepositive correlations observed in previous analyses are notrobust to changes in specification. More precisely, when theagricultural sector is excluded and when GDP per capita isincluded as an independent variable, as standard in allanalyses specifically directed towards explaining thedevelopment of self-employment, the correlations observedin OECD (1999a) tend to disappear or become insignificant.
22. A further study of possible links between self-employment andmacro variables was made by Parker (2000) using co-integration techniques, which are designed to discoverwhether a set of non-stationary variables move together overtime in a stable, long-term relationship. Unlike standardregression techniques, they are not able to determine whetherthe influence of one variable on another is positive or negative.The results suggest that self-employment bears a stable long-term relationship with a wide range of explanatory variablesincluding GDP per capita, the unemployment rate, value addedin services as a percentage of GDP, the average rate of personaltaxation, payroll taxes, and the unemployment benefitreplacement rate.
23. The survey conducted in 1995 by the Federal EmploymentOffice considered that a “false” self-employed was a personwhose main job was done as self-employed but who wasdependent on an employer (in the sense of someone whocould be considered to be part of the staff of the firm, or usedmaterial from the employer, or worked with other employeesof the same employer).
24. The rules for the “false” self-employed, Regelungen gegenScheinselbständigkeit (Law on false self-employment), wereintroduced in 1998, as part of a general labour market reformprogramme but the definition of “false” self-employmentwas changed in 1999 in the Gesetz zur Förderung derSelbtständigkeit (Law to promote self-employment).
25. Meager (1994) suggests that, in principle, the form of financingmay influence the number and the type of people entering thescheme as well as the kind of activity they engage in. Whilethere can be little difference between those two models in termsof budget costs, economic theory suggests that as capitalmarkets are rarely perfect, the impact of a model that reducesthe capital constraints on entry to self-employment may bedifferent from another that increases the stream of incomeduring the initial period of self-employment.

The Partial Renaissance of Self-employment – 191
© OECD 2000
Annex 5.A
Definitions
Most current information on self-employment, and thebulk of the data used in this chapter, come from household inter-view surveys of the labour force. Two basic methods are used. Inthe first, the respondent is asked to assess his or her own status byselecting one out of a list of possible categories. In the second, theinterviewer poses a number of questions about the employmentcircumstances of the respondent and then makes the assessmenton the basis of the replies. The two methods can of course becombined, and the interviewer may or may not be asked to giveguidance to the respondent on the meaning of the term, “self-employment” (Table 5.A.1).
For all OECD countries, the labour force survey defi-nitions for self-employment form part of the definitions of the“economically active” population adopted by the ThirteenthInternational Conference of Labour Statisticians, convened bythe International Labour Office in Geneva in October 1982,and amplified by the resolution on the International Classifi-cation of Status in Employment (ICSE-93), adopted by theFifteenth International Conference of Labour Statisticians,convened by the International Labour Office in Geneva inJanuary 1993.* ICSE-93 classifies jobs with respect to the typeof explicit or implicit contract of employment of the personwith other persons or organisations. It contains the followinggroups:
1. employees;
2. employers;
3. own-account workers;
4. members of producers’ co-operatives;
5. contributing (or unpaid) family workers;
6. workers not classifiable by status.
Employee, or “paid employment” jobs are those jobswhere the incumbents hold explicit or implicit employment con-tracts which give them a basic remuneration which is not directlydependent upon the revenue of the unit for which they work.Some or all of the tools, capital equipment, information systemsand/or premises used by the incumbents may be owned by others,and the incumbents may work under direct supervision of, oraccording to strict guidelines set by, the owner(s) or persons in theowners’ employment. Persons in paid employment jobs aretypically remunerated by wages and salaries, but may be paid by
commission from sales, by piece-rates, bonuses, or in-kindpayments such as food, housing or training.
Self-employment jobs, on the other hand, are those jobswhere the remuneration is directly dependent upon the profitsderived from the goods and services produced. The incumbentsmake the operational decisions affecting the enterprise, or dele-gate such decisions while retaining responsibility for the welfareof the enterprise (in this context, “enterprise” includes one-personoperations.)
Owner-managers of incorporated enterprises are workerswho hold a job in an incorporated enterprise, in which they:a) alone, or together with other members of their families or oneor a few partners, hold controlling ownership of the enterprise;and b) have the authority to act on its behalf as regards contractswith other organisations and the hiring and dismissal of personsin the “paid employment” of the same organisation. For labourforce analysis they are normally best classified as self-employed,either as own-account workers or, more often, employers. How-ever, for taxation purposes they are generally counted asemployees, and this is also the classification in the System ofNational Accounts. Separate identification facilitates interna-tional comparisons, but relatively few countries are able to dothis, as shown in Table 5.A.1.
Data sources
Data on flows into and out of self-employment
Data on flows taken from the European Union LabourForce Survey are obtained from retrospective questions.Respondents are asked to give both their current employmentstatus (unemployed, employee, self-employed, etc.) and theirstatus one year previously. Thus, it is possible to obtain infor-mation on the reported status, one year ago, of people who arecurrently self-employed. This allows a calculation of the netinflows into self-employment over the year. For example, if theinformation comes from the Labour Force Survey of 1992, itwill allow the calculation of the net inflows into self-employmentover the period 1991 to 1992. The full range of responses to thequestions on current and retrospective status provides the currentstatus of all people who said their status was self-employed the yearbefore. This allows an estimate of the outflows over the year inquestion.
Definitions and Data Sources
* The information set out below draws heavily on the Resolutions of the International Conferences of Labour Statisticians.

192 – OECD Employment Outlook
It must be noted that information of this kind is subject tolarge reporting errors and is, in general, only suitable for indi-cating broad trends over time. A check on the data quality bymatching information from the retrospective questions to actualchanges in the numbers of self-employed from year to year foundonly a relatively poor correspondence between them.
Data on working conditions and preferences
The second European survey on working conditions
This survey is described in European Foundation (1997a).It was conducted in the fifteen countries of the European Union(Austria, Belgium, Denmark, Finland, France, Germany, Greece,Ireland, Italy, Luxembourg, the Netherlands, Portugal, Spain,Sweden and the United Kingdom) between 27 November 1995and 19 January 1996, in close collaboration with Eurostat and
National Statistical Institutes, many of which conduct similarsurveys on a national basis. The survey is also known asEurobarometer 44.2. It was specifically designed to monitor work-ing conditions as perceived by respondents, rather than attempting todefine them objectively.
The multi-stage random sampling design was designed to berepresentative of the employed population (employed and self-employed, including people with jobs from which they were tem-porarily absent). All people aged 15 and over were included in thesampled population, with the exception of retired, unemployedpeople and housewives. The target number of interviews was1 000 cases per country, with the exceptions of 500 for Luxembourg,1 000 for the former west Germany and 1 000 for the former eastGermany. The figures achieved were close to these targets, giving atotal of just under 16 000 interviews for Europe as a whole. Thesamples were found to over-represent Services and Public
Table 5.A.1. Classification of owner-managers of incorporated businesses (OMIBs)in labour force surveys
If Procedure ASeparate Classification of OMIBs
Verbal guidance WrittenNumber ofProcedure a identification in the statistics usedWho makes by interviewer? guidance?categories of OMIBs in this chapter bclassification?
in survey
Australia C 4 Interviewer No No No EmployeesAustria C 8 . . Yes Yes No UnclearBelgium B 6 Interviewer Yes Yes Yes Self-employedCanada C 3 Respondent Yes Yes Yes Self-employedCzech Republic A 5 Interviewer Yes No No UnclearDenmark A 4 Respondent Yes Yes No Mainly self-employedFinland B 3 . . Yes Yes No Mainly self-employedFrance A 8 Interviewer Yes Yes Yes Mainly self-employedGermany A 10 Respondent Yes Yes No Mainly self-employedGreece A 4 Respondent Yes Yes No Mainly self-employedHungary A 11 Interviewer Yes Yes Yes Self-employedIceland A 5 Interviewer Yes Yes No UnclearIreland A 4 Respondent Yes Yes Yes Mainly self-employedItaly A 11 Respondent Yes No No UnclearJapan A 8 Respondent No Yes No EmployeesKorea A 6 Interviewer Yes No No Mainly self-employedLuxembourg A 4 Interviewer Yes No UnclearMexico A 7 Respondent Yes Yes Yes Mainly self-employedNetherlands C 4 Interviewer No No No Mainly self-employedNew Zealand A 4 Interviewer Yes Yes No UnclearNorway C . . . . Yes No Mainly employeesPoland A 3 Respondent Yes Yes No Mainly self-employedPortugal A 5 Interviewer Yes No Yes UnclearSpain A 9 Interviewer Yes Yes No Self-employedSweden A 3 Respondent Yes Yes No Mainly self-employedSwitzerland C . . Yes Yes Yes Self-employedTurkey A 5 Interviewer or respondent Yes No Mainly self-employedUnited Kingdom C 4 Interviewer Yes Yes Yes Mainly self-employedUnited States C 4 Interviewer No Yes Yes Employees
. . Data not available.a) Procedure A means that the respondent or interviewer classifies jobs by selection between a predetermined set of categories.
Procedure B means that the classification is based on the replies to a number of questions put by the interviewer about the employment contract.Procedure C means that the method used is a combination of A and B.
b) It is assumed that when the procedure is self-assessment alone, OMIBs will mainly classify themselves as self-employed.Sources: Elias (1997) and further information from the ILO survey on self-employment classifications supplied to the Secretariat by the ILO; except last two
columns: information submitted to EUROSTAT and OECD by national authorities.

The Partial Renaissance of Self-employment – 193
© OECD 2000
Administration, while under-representing Agriculture, as wellas some Industry sub-sectors, causing the grouping of NACEcategories “Mining and quarrying” and “Manufacturing”.
Comparisons by the Secretariat between the numbers of self-employed people, as estimated by the survey, and national estimatesof the proportion of self-employed in total employment show that,for most countries the figures are quite close – once the agriculturalsector has been excluded from both sets of estimates. On theunweighted average for the 13 countries for which data fromboth sources are available, the proportion of self-employment is16.7 per cent according to the survey as opposed to 15.5 per centaccording to the national statistics published in OECD Labour ForceStatistics. The main discrepancies occur for Italy and Portugal.
The information relating to company size was derived fromthe question, “How many people are employed in total in your
country by the company/organisation where you work? (none, 1 to 9,10 to 49, 50 to 99, 100 to 499, 500 or more, don’t know)”.
The Employment Options of the Future survey
This survey, carried out in 1998, was a survey into potentiallabour supply, launched and managed by the European Founda-tion for the improvement of Living and Working Conditions. Thesample size of the survey was 30 557 interviews and its coveragethe 15 European Union Member States, and Norway. It focussedon those either employed or aspiring to be employed within thenext five years. During the course of 2000-2001 a range ofpublications with further analysis of the survey data will bedisseminated by the Foundation (see http://www.eurofound.ieor contact [email protected]. for further details).

194 – OECD Employment Outlook
Annex 5.B
This annex reports the results of Secretariat analyses toinvestigate the determinants of self-employment for five coun-tries. As the data available for each country were subject torestrictions, the results for individual countries were supple-mented by a pooled regression. The countries selected were asfollows: Japan (steady fall in the self employment rate overrecent decades); Italy (persistently high self-employment rate);United Kingdom, Canada and Germany (rapid increases in self-employment over the 1980s or 1990s).
Two regression models for the self-employment rate
Two types of regression model were used to reflect alter-native ways of modelling the self-employment rate. Each wasused for the regressions by country and the pooled regressions,in turn:
Model 1: the log of the non-agricultural self-employmentrate, SER, was regressed on the explanatory variables listed inTable 5.B.1 below.
Macroeconomic Determinants of Self-employment: An Analysis for Five OECD Countries
Table 5.B.1. Variable specifications and sources
Variable Code Variable Name Source
SER Self-employment rate calculated as self-employment as a OECD Labour Force Statistics database.percentage of civilian employment.
SE Self-employment, except unpaid family workers and OECD Labour Force Statistics database.excluding the agricultural sector.
EMP Civilian employment OECD Labour Force Statistics database.
GDP GDP per capita, US$ and exchange rates of 1990. OECD National Accounts database.
FEM Proportion of women in total employment, except unpaid OECD Labour Force Statistics database.family workers and excluding the agricultural sector.
MAN Share of manufacturing industries in GDP value added. OECD National Accounts database.
SERV Share of services in GDP value added. OECD National Accounts database.
SCVA Share of capital in value added, calculated as GDP OECD National Accounts database.evaluated on cost basis minus compensation of workers,expressed as proportion of GDP evaluated on cost basis.
UNR Unemployment rate, national definition. OECD Analytical database.
ATR Average tax rate, proxied by ratio of general government OECD National Accounts database.outlays to GDP.
MTR Ratio of general government gross liabilities to GDP OECD Analytical database.
REPR Benefit replacement rates; averages over average and 2/3 OECD database on Benefit Entitlements and Grossof earnings of ‘‘Average Production Worker’’. Replacement Rates. Data are not available for each year
and missing observations were supplied from a splinefunction.

The Partial Renaissance of Self-employment – 195
© OECD 2000
Model 2: the log of the self-employment rate wasdecomposed in the following way:
Ln SER = Ln SE-Ln EMP = β´1.x1 + ε:
Ln SE = β´2.x2 + ε,
where SE is the number of self-employed and EMP the totalnumber of employed. The list of independent variables, x2, thusincludes EMP as well as the variables listed in Table 5.B.1. Theregressions by country were based on a comparatively smallnumber of observations. In order to have comparable data for thefive counties included in the analysis on both an individual andpooled basis, observations were restricted to the period up to 1994.Special attention was given to the breaks in series occasioned bythe German reunification of 1990.
Proxies were required for the tax variables, because alter-native sources of data were not available for a sufficiently longrun of consecutive years. The ratio of general government outlaysto GDP as a proxy for average tax rates has a straightforwardrationale and has been used by many authors. The ratio of generalgovernment gross liabilities to GDP, included as a supplementaryindicator of tax pressure, was used by Robson and Wren (1999) toinstrument the marginal tax rate.
Regressions by country
The regression model used was a so-called “error correc-tion” model (ECM), designed to allow short- and long-run effectsto be distinguished. The equation has the form
∆yt = α + β´. ∆xt – yt-1 + δ´.xt-1 + εt (1)
where y is the natural logarithm of the non-agriculturalself-employment or self-employment rate; x is a matrix of obser-vations of the explanatory variables (used in logarithmic form,with the exception of the marginal and average tax rates); α is aconstant term and ε the error term.
The β’s can be interpreted as estimates of the short-runimpact of changes of the explanatory variables on the dependentvariable (the rate of non agricultural self-employment) and the δ’sas the long-run impact.
Pooled regressions
The pooled regressions were estimated in a similar way,over the same period, using an ECM specification with a set oftime and country dummies, T and C:
∆yt = α + β´. ∆xt – yt-1 + δ´.xt-1 + λ´.T + τ´.C + εt (2)
The other variables are exactly the same as in the individualcountry regressions.
The model selection was based partly on the minimumAIC, BIC and C(P) criteria [AIC, BIC and C(P) provide an indi-cation of the minimum sum of squares of the residuals, takingaccount of the number of variables and of observations] and partlyon the results of forward and backward stepwise regressions. Wherethere were signs of residual autocorrelation a Cochrane-Orchutttransformation was applied.
The results reported in Table 5.13 contain only those varia-bles found to be significant at the 10 per cent level. Other variableswere discarded from the regressions. Further details of the resultsare available from the Secretariat.

196 – OECD Employment Outlook
BIBLIOGRAPHY
ACS, Z. J., AUDRETSCH, D.B. and EVANS, D.S. (1994),“Why Does the Self-Employment Rate Vary across Countries and over Time?”, CEPR Discussion Paper Series No. 871, mimeo.
BARBIERI, P. (1999),“Self-employment in Italy”, Paper presented to the workshop on Self-Employment in Advanced Economies, Mannheim Centre for European Social Research, University of Mannheim, July, mimeo.
BIELENSKI, H. (1999),“Employment Options for the Future: First Results from a Representative Survey in all 15 EU Member States and in Norway”, report prepared for the European Foundation for the Improvement of Living and Working Conditions, Infratest Burke Sozialforschung, Munich, February.
BLANCHFLOWER, D.G. (1998),“Self-Employment in OECD Countries”, paper presented at the OECD/CERF/CILN International Conference on Self-Employment, September, Paris.
BLANCHFLOWER, D.G. and FREEMAN, R.B. (1994),“Did the Thatcher Reforms Change British Labour Market Performance?”, in Barrell, R. (ed.), The UK Labour Market: Comparative Aspects and Institutional Developments (ed.), Press Syndicate of the University of Cambridge, UK, pp. 51-92.
BRADBURY, B. (1996),“Are the Low-Income Self-Employed Poor?”, Australian Social Policy Research Centre Discussion Paper No. 73, December.
BURCHELL, B. and RUBERY, J. (1992),“Categorising Self-Employment: Some Evidence from the Social Change and Economic Life Initiative in the UK”, in Leighton, P. and Felstead, A. (eds.), The New Entrepreneurs: Self-Employment and Small Business in Europe, Kogan Page, pp. 101-121.
CORDELLIER, C. (1998),“Dix ans de revenus des indépendants : variations temporelles et individuelles”, Économie et Statistique, No. 319-320, INSEE, Paris.
CULLY, M., O'REILLY, A., MILLWARD, N., FORTH, J., WOODLAND, S., DIX, G. and BRYSON, A. (1999),The 1998 Workplace Employee Relations Survey First Findings, United Kingdom Department of Trade and Industry.
DEVINE, T. J. (1994),“Characteristics of Self-Employed Women in the United States”, Monthly Labor Review, March, pp. 20-34.
DIRECTION DE L’ANIMATION DE LA RECHERCHE, DES ÉTUDES ET DES STATISTIQUES (DARES) (1996),40 ans de la politique d'emploi, La Documentation Française, Paris.
DIRECTION DE L’ANIMATION DE LA RECHERCHE, DES ÉTUDES ET DES STATISTIQUES (DARES) (1999a),Premières Synthèses, No. 41.2, ministère de l'Emploi et de la Solidarité, Paris.
DIRECTION DE L'ANIMATION DE LA RECHERCHE, DES ÉTUDES ET DES STATISTIQUES (DARES) (1999b),Premières Synthèses, 51.2, ministère de l'Emploi et de la Solidarité, Paris.
EUROPEAN FRANCHISE FEDERATION (EFF) (1977),The EFF Survey on Franchising in Europe, British Franchising Association, Henley-on-Thames.
EKOS RESEARCH ASSOCIATES INC. (1998),“Using the WES Data to Study Organizational Change: Final Report”, report submitted to Statistics Canada, February, mimeo.
ELIAS, P. (1997)“Status in Employment: a world survey of practices and problems’’, Report to the ILO, forthcoming in ILO Bulletin of Labour Sta-tistics, Geneva.
EUROPEAN FOUNDATION FOR THE IMPROVEMENT OF LIVING AND WORKING CONDITIONS (1997a)Second European Survey on Working Conditions, Dublin.
EUROPEAN FOUNDATION FOR THE IMPROVEMENT OF LIVING AND WORKING CONDITIONS (1997b),New Forms of Work Organisation: Can Europe Realise its Potential?, Office for Official Publications of the European Communities, Luxembourg.

The Partial Renaissance of Self-employment – 197
© OECD 2000
FELSTEAD, A. (1992),“Franchising, Self-Employment and the ‘Enterprise Culture’”, in Leighton, P. and Felstead, A. (eds.), The New Entrepreneurs: Self-Employment and Small Business in Europe, Kogan Page, pp. 237-265.
FELSTEAD, A. (1996),“Homeworking in Britain: the National Picture in the mid-1990s”, Industrial Relations Journal, Vol. 27, No. 3, pp. 225-238.
FELSTEAD, A. and LEIGHTON, P. (1992),“Issues, Themes and Reflections on the ‘Enterprise Culture’”, in Leighton, P. and Felstead, A. (eds.), The New Entrepreneurs: Self-Employment and Small Business in Europe, Kogan Page, pp. 15-38.
FREEDMAN, J. and CHAMBERLAIN, E. (1997),“Horizontal Equity and the Taxation of Employed and Self-Employed Workers”, Fiscal Studies, Vol. 18, No. 1, pp. 87-118.
GRUBB, D. and WELLS, W. (1993),“Employment Regulation and Patterns of Work in EC Countries”, OECD Economic Studies, No. 21, Winter, pp. 7-58.
HAKIM, C. (1998),Social Change and Innovation in the Labour Market: Evidence from the Census SARs on Occupational Segregation and Labour Mobility, Part-Time Work and Student Jobs, Homework and Self-Employment, Oxford University Press, Oxford.
HUIJGEN, F. (1999),“Interest in Self-Employment”, draft report prepared for the European Foundation for the Improvement of Living and Working Conditions, Nijmegen Business School, University of Nijmegen, October, mimeo.
LECKIE, N. (1997),“Lessons Learned on Own-Account Self-Employment in Canada: Final Report”, report prepared by Ekos Research and Associates, Human Resources and Development Canada, mimeo.
LIN, Z., YATES, J. and PICOT, G. (1999),“The Entry and Exit Dynamics of Self-Employment in Canada”, Analytical Studies Branch Research Paper Series No. 134, Statistics Canada, March.
MANSKI, C.F. and STRAUB, J.D. (1999),“Worker Perceptions of Job Insecurity in the mid-1990s: Evidence from the Survey of Economic Expectations”, NBER Working Paper No. 6908, January.
MARSHALL, K. (1999),“Working Together – Self-Employed Couples”, Perspectives on Labour and Income, Statistics Canada, Vol. 11, No. 4, pp. 9-13.
MARTIN, J. (2000),“What Works among Active Labour Market Policies?: Evidence from OECD Countries' Experiences”, Economic Studies No. 30, pp. 79-114, OECD, Paris.
MEAGER, N. (1991),Self-Employment in the United Kingdom, IMS Report No. 205, Institute for Manpower Studies, Brighton.
MEAGER, N. (1994),“Self-Employment Schemes for the Unemployed in the European Community”, in Schmid, G. (ed.), Labour Market Institutions in Europe, Chapter 6.
MEAGER, N. (1998),“United Kingdom”, in European Commission, SYSDEM Trends, No. 31, Winter, pp. 74-79.
MENZIES, C. H. (1998),“Women and the Knowledge-Based Economy and Society”, discussion paper, Policy Analysis and Development and External Relations Directorate, Status of Women Canada, March.
METCALF, H. (1998),Self-Employment for the Unemployed: The Role of Public Policy, Research Report RR47, Department for Education and Employment, London.
MINISTÈRE DE L’EMPLOI ET DU TRAVAIL (1995), “‘Faux’ indépendants sous vrai carcan”, Revue du Travail, No. 18, Brussels.

198 – OECD Employment Outlook
MOREHEAD, A., STEELE, M., ALEXANDER, M., STEPHEN, K. and DUFFIN, L. (1997),Changes at Work: The 1995 Australian Workplace Industrial Relations Survey, Longman.
O'LEARY, C. (1998),“Promoting Self-Employment Among the Unemployed in Hungary and Poland”, W.E.Upjohn Institute for Employment Research, September, mimeo.
OECD (1986),Employment Outlook¸ Paris.
OECD (1992),Employment Outlook¸ Paris.
OECD (1996),Enhancing the Effectiveness of Active Labour Market Policies. The OECD Jobs Strategy, Paris.
OECD (1998a),Fostering Entrepreneurship, Paris.
OECD (1998b),“Fostering Entrepreneurship: Country Experiences of What Works and What Doesn't”, ECO/CPE/WP1(98)9, mimeo, Paris.
OECD (1999a),Employment Outlook, Paris.
OECD (1999b),“Background paper for the International Conference on Youth Entrepreneurship and Self-Employment”, DT/LEED/(99)9, mimeo, Paris.
OECD (1999c),“Financing for Women-Owned SMEs: Trends and Issues”, DSTI/IND/PME (99)5, , mimeo, Paris.
OECD (1999d),“Women’s Entrepreneurship: Exchanging Experiences between OECD and Transition Economy Countries”, DT/LEED/DE (99), mimeo, Paris.
OKEKE, S. (1999), “The Start-Up Grant: a Comparative Analysis of Entrepreneurial Survival and Growth”, report by the Research Unit of the Swedish National Labour Market Board, ISEKen No. 11.
PARKER, S.C. (1997),“The Distribution of Self-Employment Income in the UK, 1976-91”, Economic Journal, Vol. 107, pp. 455-466.
PARKER, S.C. (1999),“The Inequality of Employment and Self-Employment Incomes: a Decomposition Analysis for the UK”, Review of Income and Wealth, Vol. 45, No. 2, pp. 263-274.
PARKER, S. (2000),“Determinants of Panel Self-Employment: a Descriptive Summary”, Report for the OECD, mimeo, Paris.
PFEIFFER, F. and POHLMEIER, W. (1992),“Income, Uncertainty and the Probability of Self-Employment”, Recherches économiques de Louvain, Vol. 58, Nos. 3-4, pp. 265-281.
PFEIFFER, F. (1999),“Self-Employment in Germany”, report prepared for the OECD, mimeo, Paris.
ROBSON, M.T. (1997),“The Relative Earnings from Self and Paid Employment: A Time-Series Analysis for the UK”, Scottish Journal of Political Econ-omy, Vol. 44, No. 5, November, pp. 502-518.
ROBSON, M. T. (1998),“The Rise in Self-Employment amongst U.K. Males”, Small Business Economics, Vol. 10, pp. 199-212.
ROBSON, M.T (2000),“Does Stricter Employment Protection Legislation Promote Self-Employment?”, Report for the OECD, mimeo, Paris.

The Partial Renaissance of Self-employment – 199
© OECD 2000
ROBSON, M. T. and WREN, C. (1999),“Marginal and Average Tax Rates and the Incentive for Self-Employment”, Southern Economic Journal, Vol. 65, No. 4, pp. 757-773.
SCHNEIDER DE VILLEGAS, G. (1990),“Home Work: a Case for Social Protection”, International Labour Review, Vol. 129, No. 4, pp. 423-439.
STABER, U. and BOGENHOLD, D. (1993),“Self-Employment: A Study of Seventeen OECD Countries”, Industrial Relations Journal, Vol. 24, No. 2, pp. 126-137.
SULLIVAN, D. H. And SMEEDING, T. M. (1997),“All the World's Entrepreneurs: The Role of Self-Employment in Nineteen Nations”, Luxembourg Income Study Working Paper No. 163, June.
SWARTZ, L.N. (1995),Worldwide Franchising Statistics: A Study of Worldwide Franchise Associations, Arthur Andersen LLP and World Franchising Council.
US DEPARTMENT OF COMMERCE (1999),Best Market Reports – Franchising FY99 – IMI981113, STAT-USA Database Subscription Account, (http://www.stat-usa.gov).
US DEPARTMENT OF LABOR (2000),Entrepreneurship: Proceedings of a Joint United States and European Union Seminar, Washington D.C.
WILDERMAN, R.E., HOFSTEDE, G., NOORDERHAVEN, N.G., THURKIK, A.R.,VERHOEVEN, W.H. J. and WENNEKERS A.R.M. (1999),“Self-Employment in 23 OECD Countries: The Role of Cultural and Economic Factors”, Research Report 9811/E, EIM Small Business Research and Consultancy.
WILLIAMS, D.R. (1998),“Consequences of Self-Employment for Women and Men in the United States: Preliminary Results”, paper presented at the OECD/CERF/CILN International Conference on Self-Employment, September.
WONG, G., HENSON, H. and RIDDELL, C. (1998),“Earnings Impact of Self-Employment Assistance for the Canadian Unemployed, 1987-1996”, paper presented at the OECD/CERF/CILN International Conference on Self-Employment, September.
WOODEN, M. and VAN DEN HEUVEL, A. (1995),“Self-Employed Contractors in Australia: What are the Facts?” Working Paper No. 136, National Institute for Labour Studies, February.