THE PARACHUTE MODEL OF MARKETING STRATEGIES FOR …
282
THE PARACHUTE MODEL OF MARKETING STRATEGIES FOR SUCCESSFUL ENTREPRENEURSHIP : A PERSPECTIVE *Prof. P. K. Pradhan is working as Professor in Department of Commerce at Utkal University. He is working in the borad area of strategy management, marketing management. He has published books on Entrepreneurship and many other articles in various journals in field of management, marketing, entrepreneurship. The author can be contacted at [email protected] **Dr. N. M. Leepsa is currently working as Assistant Professor at School of Management, National Institute of Technology Rourkela, Odisha, India. She has published articles on mergers and acquisitions, entrepreneurship, value based management and other fields of management.Moreover, her teaching and research interest includes in the area of Corporate Finance, Accounting, Strategic Cost Management and Mergers and Acquisitions.The author can be contacted at [email protected] The Utkal Business Review December, 2015, Vol - XXIX, pp.-01-10 Pradyot Kesari Pradhan* N.M. Leepsa** ABSTRACT Purpose- Marketing is about all about fulfillingthe needs of customers. The product can be anything from a pin to a plane. By and large, the competition is tough. In order to survive and sustain- there is a need of continuous strategy adoption and implementation. That's the truth of marketing. The study explores the role of marketing in entrepreneurship and the relationship between the two. It investigates the importance and various aspects of the relationship between marketing and entrepreneurship, its relevance for the development of product and service in new firms, and the requisites for a good relationship between two. Design/methodology/approach-This paper reviews the literature on the basis of secondary data collected from the sources such as articles and research papers from various journals, annual reports, sustainability reports and newspapers. This is a qualitative study based on content analysis and observations from the data collected from various sources. The study assumes that a better understanding of the marketing/entrepreneurship relationship should decrease the numbers of both product and firm failures. Research Implications- The paper fillsthe existing gaps in literature by linking the three established concepts 'Parachute Model', 'Entrepreneurship', and 'Marketing Strategies' and establishes a relationship between these interdisciplinary concepts. Practical Implications- The paper provides to practical solutions to entrepreneurs in terms marketing strategies through the parachute model to make their business successful in the corporate world. Originality-The main contribution of this research is the Parachute Model which is a new term that is taking into aspect different marketing strategies that could be adopted by the entrepreneur for achieving sustainable business. Key Words : Marketing, Sustainable Entrepreneurship, Parachute Model Paper Type : Perspective
Transcript of THE PARACHUTE MODEL OF MARKETING STRATEGIES FOR …
THE PARACHUTE MODEL OF MARKETINGSTRATEGIES FOR SUCCESSFUL
ENTREPRENEURSHIP : A PERSPECTIVE
*Prof. P. K. Pradhan is working as Professor in Department of Commerce at Utkal University. He is workingin the borad area of strategy management, marketing management. He has published books on Entrepreneurshipand many other articles in various journals in field of management, marketing, entrepreneurship. The authorcan be contacted at [email protected]**Dr. N. M. Leepsa is currently working as Assistant Professor at School of Management, National Institute ofTechnology Rourkela, Odisha, India. She has published articles on mergers and acquisitions, entrepreneurship,value based management and other fields of management.Moreover, her teaching and research interest includesin the area of Corporate Finance, Accounting, Strategic Cost Management and Mergers and Acquisitions.Theauthor can be contacted at [email protected]
The Utkal Business ReviewDecember, 2015, Vol - XXIX, pp.-01-10
Pradyot Kesari Pradhan*N.M. Leepsa**
ABSTRACTPurpose- Marketing is about all about fulfillingthe needs of customers. The product can be anythingfrom a pin to a plane. By and large, the competition is tough. In order to survive and sustain- there is aneed of continuous strategy adoption and implementation. That's the truth of marketing. The studyexplores the role of marketing in entrepreneurship and the relationship between the two. It investigatesthe importance and various aspects of the relationship between marketing and entrepreneurship, itsrelevance for the development of product and service in new firms, and the requisites for a goodrelationship between two.Design/methodology/approach-This paper reviews the literature on the basis of secondary datacollected from the sources such as articles and research papers from various journals, annual reports,sustainability reports and newspapers. This is a qualitative study based on content analysis andobservations from the data collected from various sources. The study assumes that a better understandingof the marketing/entrepreneurship relationship should decrease the numbers of both product and firmfailures.Research Implications- The paper fillsthe existing gaps in literature by linking the three establishedconcepts 'Parachute Model', 'Entrepreneurship', and 'Marketing Strategies' and establishes arelationship between these interdisciplinary concepts.Practical Implications- The paper provides to practical solutions to entrepreneurs in terms marketingstrategies through the parachute model to make their business successful in the corporate world.Originality-The main contribution of this research is the Parachute Model which is a new term that istaking into aspect different marketing strategies that could be adopted by the entrepreneur for achievingsustainable business.
Key Words : Marketing, Sustainable Entrepreneurship, Parachute Model
Paper Type : Perspective

2
1) Prologue :
"You can have the best product or service in theworld, but if people don't buy - it's worthless.So in reality it doesn't matter how wonderfulyour new product or service is. The real questionis - will they buy it?"- Noel Peebles
Every day, new business enterprises arecreated. Some of these ventures succeed, butmany fall by the wayside.Others take thebusiness to a great start, given theirampleresources and capital, but weakenalong the way. Some ventures seem to beweak at beginning, but with perseveranceand careful planning they succeed toremain in the market at the end. Thedifference between the successful and failedventure lies in how efficiently theentrepreneur has adopted marketingstrategies in various fronts of business.
Marketing is about all about fulfilling theneeds of customers. The product can beanything from a pin to a plane. By and large,the competition is tough. In order to surviveand sustain- there is a need of continuousstrategy adoption and implementation.That's the truth of marketing. The studyexplores the role of marketing inentrepreneurship and the relationshipbetween the two. It investigates theimportance and various aspects of therelationship between marketing andentrepreneurship, its relevance for thedevelopment of product and service in newfirms, and the requisites for a goodrelationship between two. It assumes that abetter understanding of the marketing/entrepreneurship relationship shoulddecrease the numbers of both product andfirm failures. The main contribution of thisresearch is the Parachute Model that is
framed taking into aspect differentmarketing strategies by entrepreneur forsustainable business.
The rest of the paper is organized as follows:Section 2defines the Entrepreneurshipconcept from the literature; Section 3showsthe objectives of the study; Section 4focuseson research approach adopted for carryingout the study; Section 5shows discussesabout the Parachute Model of MarketingStrategies; Section 6gives the concludingremarks along with the limitation and futurescope of the study respectively.
2) Definition of Entrepreneurship :Recognizing ‘what’ and 'what not' of theconcept
There is vast literature on entrepreneurshipwhich haveexplained the Entrepreneurshipconcept and defined the term in variousways by different authors fromdifferentacademic disciplines, namely economics,sociology andpsychology (Blundel &Smith, 2001 and Carter & Jones-Evans, 2000cited from Taylor & Walley, 2003). Few ofthe definitions are discussed in this section.Entrepreneurship is the process ofsettingup one's own business as distinctfrompursuing any other economicactivity, be itemployment or practicing some profession.According to Peter F. Drucker, "Most of whatyou hear about entrepreneurship is allwrong. It's not magic; it's not mysterious;and it has nothing to do with genes. It's adiscipline and, like any discipline, it can belearned."As per Joseph A. SchumpeterEntrepreneurship is a process where anEntrepreneur innovates, raisesmoney, andassembles inputs, chooses managers andsets the commercialorganization going withhis ability to identify them and
The Parachute Model of Marketing Strategies for Successful Entrepreneurship : A Perspective

3
opportunities whichothers are not able toidentify and is able to fulfill sucheconomicopportunities"."Entrepreneurshipis based on purposeful and systematicinnovation. Itincluded not only theindependent businessman but alsocompanydirectors and managers whoactually carry out innovativefunctions."According to NationalKnowledge Commission of India Reportsof 2008,'Entrepreneurship is theprofessional application of knowledge,skills andcompetencies and/or ofmonetizing a new idea, by an individual oraset of people by launching an enterprisede novo or diversifying from anexisting one(distinct from seeking self employment asin a profession ortrade), thus to pursuegrowth while generating wealth,employment andsocial good'.
3) Objectives of Study :
The purpose of the study is to explore andpresent the marketing strategies forsuccessful and sustainableentrepreneurship using parachute model.
4) Research Approach :
This paper reviews the literature on the basisof secondary data collected from the sourcessuch as articles and research papers fromvarious journals, annual reports,sustainability reports and newspapers.This is a qualitative study based on contentanalysis and observations from the datacollected from various sources. The studyassumes that a better understanding of themarketing/entrepreneurship relationshipshould decrease the numbers of bothproduct and firm failures. It is based on thesecondary sources of data for analysis and
Source : Developed through existing concepts from literatures
Figure 1 Parachute Model
Pradyot Kesari Pradhan & N.M. Leepsa

4
interpretation of relationship between themarketing strategies and success ofentrepreneurship.
5) Parachute Modelof Marketing Strategies :A Viewpoint
The word "parachute" comes from theFrench prefix paracete, originally from theGreek, meaning to protect against, andchute, the French word for "fall", and it wasoriginally coined, as a hybrid word whichmeant literally "that which protects againsta fall", by the French aeronaut FrançoisBlanchard (1753-1809) in 1785 (Source:Wikipedia). This concept if applied tomanagement, specific to entrepreneur canhave a different perspective on strategies.The flowing figure depicts the parachutemodel that describes how a new companycan succeed till end :
In the figure, the man represents theentrepreneur who is standing with his cashand with new enterprise. The entrepreneuradopts various strategies for long termbusiness or sustainable entrepreneurship.The entrepreneur aims to go high in hisbusiness which is represented in theparachute. Target Customer has always inthe mind of the entrepreneurship. Thisbrings the note that customer should be firstpriority in any business. Hence, wholebusiness rests with the customer. Thisparachute has eight important things in itsstring which is very significant forsustainable entrepreneurship. These eightmarketing strategies are adopted with aview to achieveprofit in future that wouldhelp the entrepreneur to first survive amongall other big business in the market placeand then develop and grow and sustain inthe market place.
a. Innovation: The most importantmarketing strategy is innovation inproducts. The entrepreneur should tryto bring out with a differentiatedproduct that would stand unique inthe market. Then the job of theentrepreneur is to show case thebenefits of products and services to thecustomers, highlighting the uniquefeatures that provide solutions toexisting problemsthat old productofcompetitors have. The product shouldalso be packed differently from thecompetitors that would attract theconsumers. There are three categoriesin this innovation- (i) Pioneers (ii)Close followers (iii) Late followers.Either the entrepreneur can be pioneersby introducing a new product intomarket by his own and capture themarket or it can be a late follower bybring the products that are already inmarket but with some modifications.Pioneer strategy will work only if theentrepreneur makes continuous effortto update the product and providequality product to thecustomers.Pioneers with a distinctivepresence in the marketplace need tobe in a position to react, or even better,anticipate potential entrants andincrease the barriers to their entry. Apioneer may be in a position to reduceits price and decrease the value of thebusiness for a new entrant, or it canblock entrance entirely by controllingkey distribution channels.Whether alate entrant or a pioneer seeking to foilnewcomers, it helps to have a thoroughunderstanding of the entry anddefensive strategies available, a good
The Parachute Model of Marketing Strategies for Successful Entrepreneurship : A Perspective

5
sense of timing and a game plan fordecision-making.
b. Growth : The entrepreneurs shouldhavegrowth skillslike skills of newproduct development, or negotiatingand integrating acquisitions. Variousstrategies like joint ventures,acquisitions, acquire minority stakes,strategic alliances, marketingpartnership, and organic investments.There are four categories in thisgrowth (i) Horizontal Integration (ii)Vertical Integration (iii) Diversification(iv) Intensification (v) The acquisitionof additional business activities thatare at the same level of the value chainin similar or different industries iscalled horizontal integration. This canbe achieved by internal or externalexpansion. Because the different firmsare involved in the same stage ofproduction, horizontal integrationallows them to share resources at thatlevel. When a company expands itsbusiness into areas that are at differentpoints on the same production path,such as when a manufacturer ownsits supplier and/or distributor.Vertical integration can helpcompanies reduce costs and improveefficiency by decreasing transportationexpenses and reducing turnaroundtime, among other advantages.However, sometimes it is more effectivefor a company to rely on the expertiseand economies of scale of othervendors rather than be verticallyintegrated.A risk managementtechnique that mixes a wide variety ofinvestments within a portfolio. Therationale behind this technique
contends that a portfolio of differentkinds of investments will, on average,yield higher returns and pose a lowerrisk than any individual investmentfound within the portfolio.Diversification strives to smooth outunsystematic risk events in a portfolioso that the positive performance ofsome investments will neutralize thenegative performance of others.Therefore, the benefits ofdiversification will hold only if thesecurities in the portfolio are notperfectly correlated.The intensificationgrowth strategy penetrates the marketto increase share, increase customerloyalty, and create promisingincentives that target the currentcustomer base.
c. Generic : Porter's generic strategieswould help the entrepreneur tomaintain the competitive advantage.Since the company is new, so if itfocuses on the individual orcombination of generic strategies -coststrategy, differentiated strategy,segmentation strategy- then, it cansurvive and sustain. By adopting coststrategy, the entrepreneur can gainmarket share by attracting cost andprice-sensitive customers. This can bedone by tagging prices for its productsat lowest prices in the target marketsegment or at price compared to whatcustomers receive. This strategywould help the entrepreneur to achieveprofit and a high return on investmentalong with operating at a lower costthan its rivals. With the differentiatedproduct the entrepreneur would beable to provide product or privileged
Pradyot Kesari Pradhan & N.M. Leepsa
6
assets that can be hardly replicated bycompetitors.Thus the three categoriesto focus on are: (i) DifferentiatedProduct (ii) Cost Leadership (iii)Market Segmentation.
d. Market Power : Market power cannotbe achieved overnight. The beststrategy would be to select your bestarea and then work on this core areabecause new entrepreneur cannotcompete with the big firms, so focusingon core area would enable to bestutilize the limited resources so as toserve specific market efficiently. In thisprocess, make market offering andstick to the best and be expert in thatarea that would help to stand inmarket. This way the entrepreneur'scompetitors would be less and canhave market share in product. Assuggested by Mc. Kinsey, success canbe achieved by taking intoconsideration operational skills orcore competencies. The four categoriesin this category are: (i) Leader (ii)Follower (iii) Challenger (iv) Nicher.Leader is typically is the industryleader (with largest share) indeveloping innovative new businessmodels and new products.Challengeris with medium share, to challenge theleader. Market challenger is a firm in astrong, but not dominant position thatis following an aggressive strategy oftrying to gain market share.Followerhas no offensive posture against theleader. A market follower is a firm in astrong, but not dominant position thatis content to stay at thatposition.Nicher is one with smallmarket size, segmentation other firms
cannot think of. In this niche strategy,the firm concentrates on a select fewtarget markets. It is also called a focusstrategy.
e. Market Entry : While making marketentry the entrepreneur shouldremember that first impression mattersto remain in the mind of customers.The entrepreneur should thereforefocus on a well-laid out store,courteous staff, and personable voiceover the phone, etc. However, if youare a one-person business working ina home office, remember that you arethe center of your business andmarketing efforts. Everyone you comein touch with is potentially a client ora referral to another client because theyare either impressed with you as aperson, impressed with your skill atproviding a certain service or product.Make sure that you are alwayspresentable, professional in your waysand knowledgeable about yourbusiness. Even if the new entrepreneuris small compared to the competitorsyet he should not lose heart since smallbusiness has some befits too. Forexample, small businesses haveflexibility, ability to respond quickly,able to provide a more personalizedservice. The least risky growth strategyfor any business is to simply sell moreof its current product to its currentcustomers-a strategy perfected by largeconsumer goods companies. The fourcategories in this section are: (i)Prospector (ii) Analyser (iii) Defender(iv) Reactor. Prospector strategy is themost aggressive of the four strategies.It typically involves active programs
The Parachute Model of Marketing Strategies for Successful Entrepreneurship : A Perspective

7
to expand into new markets andstimulate new opportunities. Newproduct development is vigorouslypursued and offensive marketingwarfare strategies are a common wayof obtaining additional market share.They respond quickly to any signs ofmarket opportunity, and do so withlittle research or analysis. Defenderstrategy entails a decision not toaggressively pursue markets. As aresult, they tend to do none of thethings prospectors do. A defenderstrategy entails finding, andmaintaining a secure and relativelystable market. Rather than being on thecutting edge of technologicalinnovation, product development, andmarket dynamics; a defender tries toinsulate themselves from changeswherever possible.The analyzer is inbetween the defender and prospector.They take less risk and make fewermistakes than a prospector, but are lesscommitted to stability than defenders.Most firms are analyzers. They areseldom a first mover in an industry,but are often second or third placeentrants.A reactor has no proactivestrategy, often reacting to events asthey occur. They respond only whenthey are forced to by macroenvironmental pressures. This is theleast effective of the four strategies. Itis without direction or focus.
f. Market Research : Market researchprior to starting to business should bebasically focused on four things-company, competitors, collaborators,customer. The entrepreneur must beclear regarding what type of company
it want to start, what would be visionand mission of company, personalityof company, and values for customers.Then it has to look into different typesof customers, influencers, purchaserand end users. Market Researchinvolves- (i) Concept testing (ii)Demand Estimation(iii) PriceElasticity testing (iv) Sales forecasting(v) Segmentation research (vi) Testmarketing. Concept testing is used forearly identification of potentiallysuccessful products. It takes intoaccount customer reaction to a basicidea of the product, helping makedecisions such as pass/fail or go/nogo. Concept testing occurs before aproduct is marketed. Hence, whilepromising a high probability ofconsumer acceptance, the attemptminimizes research and developmentcosts and marketing costs. Concepttesting has several purposes. It helpsfinalize the optimum market tointroduce the product. While selectingamong alternative concepts, it confirmsthat the selected concept is mostfavorable. Concept testing also lays thefoundation upon whichbenchmarking can be carried out in thefuture. The effort helps introduce newideas into the concept. It forecasts thedemand and analyzes whether theproduct is actually ready to belaunched. The process of concepttesting should be considered as amechanism to refine, develop andnurture new ideas, thus increasingtheir chance to penetrate the marketsuccessfully. Concept testing resultscan be used to: (i) Estimate price
Pradyot Kesari Pradhan & N.M. Leepsa

8
sensitivity and purchase likelihood (ii)Identify features and benefits that drivepurchase likelihood (iii) Identify targetconsumer segments (iv) Assess howtarget consumers want to design andpurchase the product. Demandestimation is a process that involvescoming up with an estimate of theamount of demand for a product orservice. The estimate of demand istypically confined to a particularperiod of time, such as a month,quarter or year. When running a smallbusiness, it is important to have anidea of what you should expect in theway of sales. To estimate how manysales a company will make, demandestimation is a process that iscommonly used. With demandestimation, a company can gauge howmuch to produce and make otherimportant decisions.Price elasticity ofdemand (PED or Ed) is a measure usedin economics to show theresponsiveness, or elasticity, of thequantity demanded of a good or serviceto a change in its price. More precisely,it gives the percentage change inquantity demanded in response to aone percent change in price (holdingconstant all the other determinants ofdemand, such as income).Salesforecasts are common and essentialtools used for business planning,marketing, and general managementdecision making. A sales forecast is aprojection of the expected customerdemand for products or services at aspecific company, for a specific timehorizon, and with certain underlyingassumptions.Sales forecasting is a
difficult area of management. Mostmanagers believe they are good atforecasting. However, forecasts madeusually turn out to be wrong!Marketers argue about whether salesforecasting is a science or an art. Theshort answer is that it is a bit ofboth.Businesses are forced to look wellahead in order to plan theirinvestments, launch new products,and decide when to close or withdrawproducts and so on. The salesforecasting process is a critical one formost businesses. Key decisions that arederived from a sales forecast include:(i) Employment levels required (ii)Promotional mix (iii) Investment inproduction capacity.
g. Brand : The image of your companyshould be imprinted in the mind ofcustomers. There should be goodreputation of your company in marketplace that would determine thesustainability of your business in longrun. This can be done by theentrepreneur by bringing in goodquality of products and supportservices. The brand includes (i)Product branding (ii) Product linebranding (iii) Product range branding(iv) Corporate branding. If you have aproduct or a service, you must havethe required strategy to face theexisting intense market competition,and new entrants as well. Brandingyour product is quite significant for thegrowth of your business, and it's alengthy procedure. It's not just aslogan or a logo. It's an emotion thatarises in customers' mind when theyhear about your company, or look at
The Parachute Model of Marketing Strategies for Successful Entrepreneurship : A Perspective
9
your logo. The key to derive an effectiveproduct branding is to generatedesired emotion. Product lining is themarketing strategy of offering severalrelated products for sale as individualunits. Product line facilitatesmarketers to devise strategy withregards to future treatment for a givenbrand. This strategy focuses ondecision, as to whether product linecan be extended or new variants ofexisting product should beintroduced. When taking brandextension decision companies needsto carry SWOT (Strength, Weakness,Opportunity, Threat) analysis to fullyunderstand market conditions, currentcategory structure and environmental(economic, social, political, regulatory)dynamics. This analysis will givecompanies product line and categoriesto follow active brandingstrategy.Active branding strategy withrespect to product line involvescreating multiple brands; this providesdepth to the brandingprocess.Corporate branding refers toa company applying its name to aproduct. The product and thecompany name become the brandname. The company can advertiseseveral of its products under a singlebrand name in a practice referred to asfamily branding or umbrella branding.
h. Sales Channel : The entrepreneurshould have alternative sales channeland pursuing customers in a differentway like selling products online aswell as in stores. The sales channelinvolves- (i) Exclusive Distribution (ii)Intensive Distribution (iii) Selective
Distribution. When a single outlet isgiven an exclusive franchise to sell theproduct in a geographic area, thearrangement is referred to as exclusivedistribution. In intensive distribution,the product is sold to as manyappropriate retailers or wholesalers aspossible.In selective distribution, thenumber of outlets that may carry aproduct is limited, but not to the extentof exclusive dealing. By carefullyselecting wholesalers or retailers, themanufacturer can concentrate onpotentially profitable accounts anddevelop solid working relationshipsto ensure that the product is properlymerchandised. The producer also mayrestrict the number of retail outlets ifthe product requires specializedservicing or sales support.
6) Epilogue :
Entrepreneurship is not an easy task.Turning the start- up business to a smallenterprise, then surviving and turning it toa big company is too risky. But taking upaccurate marketing strategies will sustainyour business. Just like the parachute, thesemarketing strategies in the model wouldhelp the entrepreneur to protect against thefall in the market place and rise them tosurvive. "You can have brilliant ideas, butif you cannot get them across, your ideaswill not get you anywhere" -Lee Iacocca
REFERENCESCohen, B. &Winn, M.I.(2011). Market
Imperfections, Opportunity andSustainable Entrepreneurship, accessedon February 15, 2015.
Crals, E and Vereeck, L Sustainableentrepreneurship in SMEs. Theory and
Pradyot Kesari Pradhan & N.M. Leepsa
10
Practice, [online] available from http://www.inter-disciplinary.net/ptb/ejgc/ejgc3/cralsvereeck%20paper.pdfaccessed on February 21, 2015.
Fowler, T. (2011). Five Common Reasons WhySo Many Small Businesses Fail?
Hall, J.K., Daneke, G.A. & Lenox, M.J. (2010).Sustainable Development andEntrepreneurship: Past ContributionsAnd Future Directions, Journal ofBusiness Venturing, 25(5), 439-448.
Putting Entrepreneurship into Marketing: TheProcesses of EntrepreneurialMarketing, [online] available fromhttp://folders.nottingham.edu.cn/staff/webct_local_serve/Comparative% 20 Perspectives % 20 in % 20Entrepreneurship % 20%2 8 P1 4 B 1 1 % 2 9 /Pu bl i c% 2 0 F i l e s /J O U R N A L % 2 0 A R T I C L E S /Stokes%20%282000%29.pdf accessed onFebruary 25, 2015.
Rentschler, R.Marketing AndEntrepreneurship In The ThirdMillennium: The Case From ArtMuseums, [online] available fromhttp://smib.vuw.ac.nz:8081/www/ANZMAC1999/Site/R/Rentschler.pdfaccessed on February 25, 2015.
Role of Marketing in Business, [online]available from http://tutor2u.net/b u s i n e s s / g c s e / d o w n l o a d s /market ing_role_ in_business .pdfaccessed on February 22, 2015.
Rosalinde J.A. Klein WoolthuisBrian Dabson,U.S , Strategies for a sustainableentrepreneurship in Appalachia - U.S,by Brian Dabson, U.S , online availablefrom http://www.oecd.org/secure/pdf Document/0, 2834,en_21571361_38013663_39137914_1_1_1_1,00.pdfaccessed on February 5, 2015.
Strategies for Sustainable Entrepreneurship,[online] available from http://www.cannetwork.org/roundtable/strategies.pdf accessed on February 2,2015.
Taylor, D and Walley E. E. (2003). The GreenEntrepreneur: Visionary, Maverick orOpportunist?, Manchester MetropolitanUniversity Business School Workingpaper Series.
The Parachute Model of Marketing Strategies for Successful Entrepreneurship : A Perspective
MICROCREDIT AND ECONOMIC DECISION OFBORROWERS - AN ANALYSIS
*Lecturer in Commerce, B.J.B. Jr College, Bhubaneswar, Odisha**P.G.Department of Commece, Utkal University,Bhubaneswar, Odisha
Dr. Ranjita Nayak*Prof. R.K. Bal**
1. INTRODUCTION
In 1992 under the SHGs bank linkageprogramme (SBLP) by NABARD, the bankscame into the picture and lent funds to SHGs(Microclients). Microcredit has a greaterrole to play in India where approximately40% of people live in extreme poverty. Inthe ensuing years, RRBs have to face tightcompetition with the commercial banks fortheir growth and survival irrespective of thefact that their very role in the societyrequired a special status and a different setof policies.
In this article, a basic and middle-rangeapproach to impact analysis has beenapplied as 'impact assessment'. The
researcher has received 600 questionnairesfrom 120 WSHGs and in each SHG 5members are selected randomly of 4 blocksof two districts that participated in thesurvey but out of them 158 have one or moremissing responses which are discarded andnot subjected to further analysis. The finalsample size is 442. For the purpose of study,the survey has been conducted in twodistricts of Odisha i.e Angul and Dhenknal.These respondents are selected randomlyrepresented various background acrosscaste, rural, semi urban and urban, unionmember of the SHG and educational statusetc. The draft questionnaire and analysisof the data for both rounds of the surveyfollowed the core AIMS data analysis plan.
ABSTRACTMicrofinance is still a far cry from meeting potentials as instrument of genuine economic developmentthrough the empowerment of the economic active poor. Here it has been attempted to examine the impactof microcredit and to ascertain how it contributed to the financial process of household benefits inOdisha. After two decades of impressive growth, there is slackening of growth in SHG-BLP. It hasreached saturation point in the southern states, the growth is muted in other states. The loan impairmentrates are on the rise. Considering the matter paper has attempted to measure RRBs Microcredit impacton economic decisions of the borrowers using data obtained from primary source. For the purpose of thestudy the researcher has considered the members of the Women Self Help Groups (WSHGs) as microcreditborrower. To know the microcredit impact on economic decisions three parameters have been consideredi.e control over savings, loans, and income. Descriptive as well as inferential statistical tools have beenused to get conclusion. The hypotheses for the study are tested with 95% of significance level. Thisstudy found that microcredit has no impact on the household's economic decisions.
Key Words : WSHGs, Microcredit, loan disbursed, savings and income
The Utkal Business ReviewDecember, 2015, Vol - XXIX, pp.-11-18

12
This has called for a set of descriptive tablesfor data from Rounds 1 and 2, plusstatistical analysis of percentage and Zproportion test. The quantitative analysistested two core hypotheses about impact atindividual and the household levels. Microcredit is considered a fungible as it isinterchangeable with other monetary unitsand difficult to trace in addition to otherhousehold resources that can be allocatedto the activity (or activities) considered mostimportant by the individuals within thehousehold.
This article attempts to test the hypothesisthat Microcredit programs (MCP) inputslike credit, works, training and othertechnical assistance contribute inimproving economical decisions ofborrowers. The main focus has been onissues such as control over resourcessavings, loans and incomes. The Round 1and Round 2 analytical approach has beenapplied to measure the impact on economicdecisions.
2. LIERATURE REVIEW
In this section, it has been intended toreview some of the few earlier importantstudies undertaken by different authors ofnational and international those are directlyas well as indirectly related to the researcherarea have been reviewed. Few of these areas:
Mosley and Hulme (1998) explained thatmany studies avoid calculations of povertyimpact and often treat the fact that smallloans are being made as the proof that thepoor are being reached and the fact thatloans are being repaid as proof that incomeshave increased.
Kernan (2002) uses primary data onhousehold participants andnonparticipants in Grameen Bank and twosimilar microcredit programs to measure thetotal and noncredit effects (noncreditservices and incentives) of microcreditprogram participation on productivity. Thetotal effect is measured by him estimating aprofit equation and the noncredit effect byestimating the profit equation conditionalon productive capital. Productive capitaland program participation are treated asendogenous variables in the analysis. Hefound large positive effects of participationand the noncredit aspects of participationon self-employment profits.
Puhazhendi (2002) in his study oneconomic impact of the program byNABARD, covering 115 members from 60SHGs in three backward eastern states, viz.,Chattisgarh, Orissa ,and Jharkhandrevealed that there was significant increasein assets (up by 30%) and income level (upby 23%) of the members , with more than 80per cent members coming from SC/ST andbackward classes.
Borchgrevink et. al (2005) studiedmarginalized groups, credit andempowerment for the case of Dedebit Creditand Saving Institution (DECSI) of Tigray.The study finds that female householdheads are extremely marginalized groupsand also young households' rural landlesshouseholds and urban house-rentinghouseholds are the other marginalizedgroups. Trough two-phase assessment, thestudy found that the DECSI's programmehas had a positive impact on the livelihoodof and as well enhanced the social andpolitical position of many clients.
Microcredit and Economic decision of Borrowers - An Analysis
13
Brett (2006) in his study revealed thathaving borrowed money from amicrofinance organization to start a smallbusiness, many women in El Alto, Boliviaare unable to generate sufficient income torepay their loans and so must draw uponhousehold resources. His article exploresthe range of factors (the social andstructural context) that condition andconstrain their success as entrepreneurs.The paper argues for a shift from evaluationon outcomes at the institutional level tooutcomes at the household level to identifythe forces and factors that conditionwomen's success as micro-entrepreneurs.
Nirantar (2007) examined the impact onwomen members joining SHGs. Verylimited efforts were made on the part ofsponsoring agencies to provide literacytraining to SHG members. Forty-seven percent of groups formed under governmentprogrammes had not received any kind ofcapacity building input during the past twoyears and only 19% had received inputs onincome generation and livelihoods. Lessthan 50% of groups studied had made anykind of linkages with the panchayat andonly 36% of groups had taken up any socialissue in the past two years. Only 11% ofgroups formed under governmentprogrammes had taken up issues such asdomestic violence. Fifty-eight per cent of thegroups had not received any loans eventhough more than 90% of the groups weredepositing their savings. Most of the largerloans were given to leaders of the groups.
Pokhriyal and Ghildiyal (2011) haveviewed services of the banks should not berestricted only to the linking the SHGs andproviding the loans, it should be expanded
to suggesting various income generatingactivities to the SHGs and the NGOspromoting SHGs. Average amount of theloan to the SHGs is too less to start anyfruitful activity and therefore it is suggestedto enhance this income so that it could beused in income generating activities.
Chliova et. al (2014) in their primaryempirical meta-analysis, they empiricallysynthesize a total of 545 quantitativeempirical findings from 90 studiesconducted to the date. Their findings reveala positive impact of microcredit on keydevelopment outcomes at the level of theclient entrepreneurs. Additionally, theyscrutinize how the development contextinfluences the effectiveness of microcreditand find that microcredit generally has agreater impact in more challenging contexts.
Crépon et. al (2015) in their report resultsfrom a randomized evaluation of amicrocredit program introduced in ruralareas of Morocco in 2006. Thirteen percentof the households in treatment villages tooka loan, and none in control villages did.Among households identified as more likelyto borrow, microcredit access led to asignificant rise in investment in assets usedfor self-employment activities, and anincrease in profit, but also to a reduction inincome from casual labor. Overall there wasno gain in income or consumption. Theyfind suggestive evidence that these resultsare mainly driven by effects on borrowers,rather than by externalities.
Islam (2015) in his paper evaluates theeffects of microcredit on householdconsumption using a large dataset fromBangladesh. Village fixed effects andinstrumental variable strategies are used to
Dr. Ranjita Nayak & Prof. R.K. Bal
14
estimate the causal effects of microcreditprogram participation. Overall, the resultsindicate that the effects of microcredit onconsumption vary across different groupsof poor household borrowers. The groupsthat benefit the most include the poorest ofthe poor participants. The benefits are lowfor households that are marginal to theparticipation decision. The effects ofparticipation are generally stronger forfemale borrowers than for male borrowers.
3. RESEARCH GAP AND STETEMENTOF THE PROBLEM
The above review shows that there is moreor less positive impact which dependsupon various factors size, percentage ofwomen borrowers, degree ofcommercialization, type of institutions, typeof poor etc. However, the data analyzeddoes not provide conclusive evidence aboutthe mere participation in the programme ortaking the economic decisions or controlover access by themselves. Only disbursingloan in the name of a woman is not sufficientto accept her involvement in the financialdecision making process. Financialdecision in family is related how to use thesavings, loans and incomes. Till date nostudy has been made in this direction inOdisha, so in this context the researcher hasproceeded to study the RRB's microcreditimpact on WSHGs. At this juncture theresearcher collected data related to financialdecision taking ability of women.
4. OBJECTIVES AND METHODOLOGY
4.1 Objectives
To find out impact of microcredit of RRBon the household's economic decisionsi.e control over savings and loans of the
borrower in the respective study area.
To find out impact of microcredit of RRBon the household's economic decisionsregarding the use of savings, loans andincome of the borrower in the respectivestudy area
4.2 Methodology
The current study is analytical in nature.The author has used primary data. Criticalevaluations of the available data are madeto draw any conclusion on this researcharea. WSHGs are considered as microcreditborrowers for purpose of the study.
4.3. Sampling
For the purpose of the study, RRBconsidered as its universe. In Odisha theDGB which is transformed to NGB in 2008and thereafter it has been changed to OGBin 2013 is considered for the study.
4.4. Sample Size
In Odisha after amalgamation there are twoRRBs, one of them is considered for thepresent study which caters to 13 districts ofOdisha.
4.5. Period of the Study
For this survey the respondents are theactive members of WSHGs linked with RRBand within 2 years of their formationoperating in the Dhenkanal and AngulDistrict. The survey has been conducted intwo rounds, i.e Round 1 and Round 2 andthe gap between both the rounds is one year.
4.6. Data
120 WSHGs covered from 4 blocks and 30WSHGs from each block. Five members fromeach WSHGs i.e 600 microcredit borrowersare administrated with the close-ended
Microcredit and Economic decision of Borrowers - An Analysis

15
questionnaire to collect the data on theirviews of economic decisions.
4.7. Techniques Used
Descriptive as well as inferential statisticaltools are used to arrive at any conclusion.The hypotheses for the study are to be testedwith 95% of significance level.
4.8. Hypotheses
In order to conduct the study and examinethe objectives, the researcher has formed ahypothesis for testing.
H01: Participation in MCPs of RRB has noimpact on the household's economicdecisions i.e control over savings, loans,and income.
5. ANALYSIS & INTERPRETATIONS
5.1. Analysis of Opinion of Respondentson Economic Decision
TABLE-1: SUMMARY OF DECISION TAKERTO AVAIL LOAN IN A HOUSEHOLD
Decisions Round 1 Round 2
Change No. of Respondents %age No. of
Respondents %age
Self 314 71.04 336 76.02 7.006369 Spouse 15 3.39 14 3.17 -6.66667 Self + Spouse 113 25.57 92 20.81 -18.5841 Total 442 442 100
Source: Primary data
FIGURE-1: DECISION TAKER TO AVAILTHE LOAN IN A HOUSEHOLD
Source : Plotted from Table -1
All of the SHGs are managed andmaintained by women. In micro credit, theloan is given to the members of SHG. Andthe loan disbursed in the name of a womanis not sufficient to accept her involvementin the financial decision making process.At this juncture the researcher collected datarelated to financial decision taking abilityof women.
Data related to decisions on availing loanis summarized in Table-1. Financialdecision may be taken by self (member),spouse or by both. When decision is takenby self + spouse, it may considered asparticipative process of decision making.When it is taken by spouse only it mayconsidered as not giving financial decisionmaking right to the member. In round one,it is indentified that 71% of respondents aretaking loan on their own decision, 3% ofrespondents take loan on the decision ofspouse. 26% of respondents avail loandeciding together (self +spouse). In 2ndround an increase is recorded in self groupand decrease is traced in rest two groups.The number of respondents in self groupincreased to 336 in 2nd round from 314in1st round whereas self and spouse group isdecreased to 92 in 2nd round from 113 in1st round. This may be due to the effect oftraining programme in leadership.
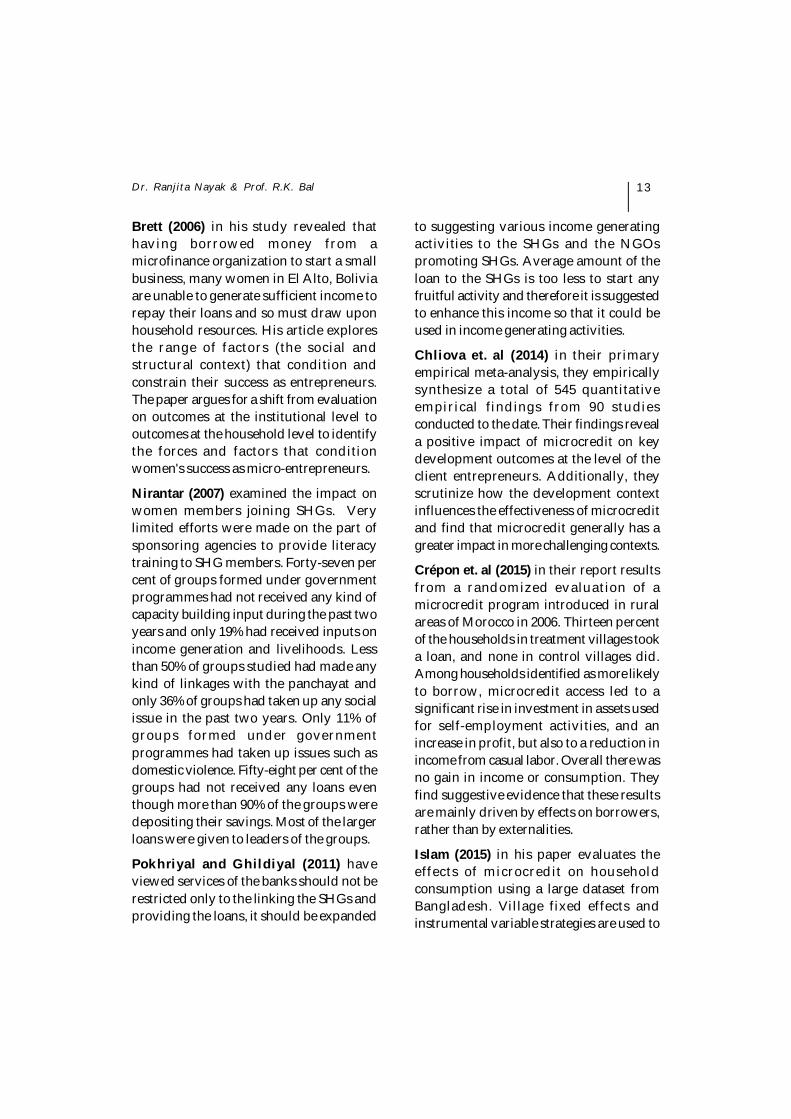
TABLE-2: DECISION TAKER TO MAKESAVINGS IN A HOUSEHOLD
Decisions Round 1 Round 2
Change No. of Respondents %age No. of
Respondents %age
Self 332 75.11 350 79.19 5.421687 Spouse 0 0.00 Self + Spouse 110 24.89 92 20.81 -16.3636 Total 442 442
Source: Primary data
Dr. Ranjita Nayak & Prof. R.K. Bal
16
FIGURE-2: DECISION TAKER TO MAKESAVINGS IN A HOUSEHOLD
Source: Plotted from Table 2
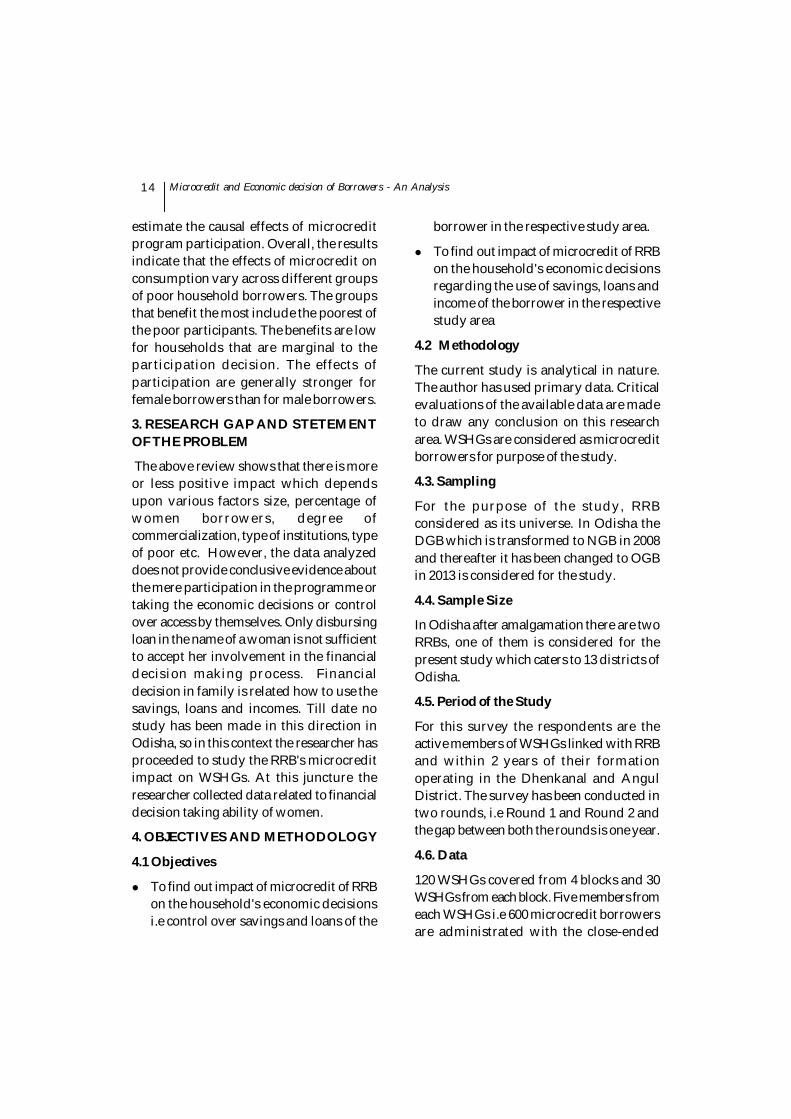
The opinion on saving decision is presentedin Table-2. Out of 442 respondents 332respondents, individually take decision onsavings whereas rest 110 respondents jointly(Self + Spouse) take decision on the savings.In 2nd round, it is found that 350 respondentsindividually take decision on savingswhereas rest 92 respondents jointly (Self +Spouse) take decision on the savings. Further,it is observed from the data that the decisionmaking power of individuals (self) on savingshas been increased over period of study. Inthe 1st round 332 respondents takethemselves decision on savings which isincreased by at 5.42% during period of study.TABLE-3: DECISION TAKER TO USE THEAMOUNT OF LOAN/SAVINGS/INCOME
IN A HOUSEHOLD
Decisions Round 1 Round 2
Changes No. of Respondents %age No. of
Respondents %age
Self 163 36.88 172 38.91403 5.521472 Spouse 0 0
Self + Spouse 279 63.12 270 61.08597 -3.22581 Total 442 442 100
Source:Primary data
FIGURE 3: DECISION TAKER HOW TOUSE THE AMOUNT OF INCOME/LOAN/
SAVINGS IN A HOUSEHOLD
Source: Plotted from Table 3
The investigation result on who takes thedecision how to utilize (spend) the amountof income/loan/ savings is summarized inTable-3. It is clear from the table andcorresponding figure that the respondentsdo not allow the spouse individually takedecision on the utilization of the amountof income/loan/ savings. Further, it isnoticed that the minimum 61% spouseindirectly control the spending decision oftheir wife. In the 1st round, out of 442respondent only 163 respondents areindividually able to take decision on howto spend the amount of income/loan/savings whereas in 2nd round out of 442respondent only 172 respondents areindividually able to take decision on howto spend the amount of income/loan/savings. The difference in 2nd and 1st roundis 9 i.e. an increase of 5.5% over 1st round isidentified. The increase in number indicateswomen empowerment due to microcredit.
5.2. Hypothesis Testing
H01: Participation in MCPs of RRB has noimpact on the household's economicdecisions i.e control over savings, loans, andincome.
To identify the impact of micro credit on thehousehold's economic decision a surveyhas been made on the aspects namely:control over savings, loans, and income. Theobjective behind this portion of research isto identify the impact of micro credit onwomen economic empowerment. Fromtable-1, 2 and 3 which reveals different typesof decision, the self decision which matterseconomic empowerment the change over thestudy period shows a change of 7.01% forloan whereas 5.42% change is identified incontrol over savings. In control over income
Microcredit and Economic decision of Borrowers - An Analysis

17
5.52% change is recorded. The changes arenot so high. At this juncture, an attempt hasbeen made to know whether the changesare significant or not. 'Z' proportion test isapplied to test the significance. Thesummary of the test is presented in Table 4.
TABLE 4: 'Z' PROPORTION TESTSUMMARY OF DIFFERENT TYPES OF
ECONOMIC DECISIONS IN A FAMILY
CONTROL OVER LOANS Details Round 1 Round2 Difference
Sample proportion 0.7104 0.7602 0.0498 95% CI (asymptotic) 0.6681 - 0.7527 0.7204 - 0.8 -0.1164 z-value 1.7 P-value 0.0933
CONTROL OVER SAVINGS Details Round 1 Round2 Difference
Sample proportion 0.7511 0.7919 0.0408 95% CI (asymptotic) 0.7108 - 0.7914 0.7541 - 0.8297 -0.1108 z-value 1.4 P-value 0.1486
CONTROL OVER INCOME Details Round 1 Round2 Difference
Sample proportion 0.3688 0.3891 0.0203 95% CI (asymptotic) 0.3238 - 0.4138 0.3436 - 0.4346 -0.128 z-value 0.6 P-value 0.5339
Source : Computed from Primary data
The Table-4 has 3 parts. The 1st, 2nd and3rd part respectively reveal 'Z' test resultfor control over savings, loans, and income.The test is conducted at 95% of confidenceinterval. The z-value for control oversavings, loans, and income is 1.7, 1.4 and0.6 respectively. For each variable namelycontrol over savings, loans, and income, 'P-value' is 0.0933, 0.1486 and 0.5339respectively. For each variable the P-valueis greater than 0.05, which is interpreted asthe difference observed over study period isnot significant. So the null hypothesis'Participation in MCPs of RRB has noimpact on the household's economicdecisions i.e control over savings, loans,and income' is accepted at 95% ofconfidence level.
6. FINDINGS AND CONCLUSION
The key objective behind the research work isto measure the microcredit impact oneconomic decisions of the borrower. Theresearcher has arrived at following points viz
Under different types of decision, the selfdecision which matters economicempowerment the change over the studyperiod shows a change of 7.01% for loanmaking.
Whereas 5.42% change is identified incontrol over savings and in control overincome 5.52% change is recorded.
For each variable namely control oversavings, loans, and income, 'P-value' is0.0933, 0.1486 and 0.5339 respectively.For each variable the P-value is greaterthan 0.05, which is interpreted as thedifference observed over study period isnot significant.
In analyzing the impact of micro credit oneconomic decisions of marginally poorWomen of Angul and Dhenkanal District,it is observed that the impact of credit oneconomic decisions of the borrower overperiod of study has increased whereas theincrease is not so significant. Micro creditsstill its infancy to be nurtured so policymeasures should be taken to improve it.
REFERENCESAIMS (2000), "Learning from Clients:
Assessment Tools for MicrofinancePractitioners." The Small EnterpriseEducation and Promotion (SEEP)Network, Washington, DC.
Borchgrevink, A., T. Woldehanna, G. Ageba,and W. Teshome (2005), "MarginalizedBulletin". Bangladesh. World BankEcon. Rev., 19(2):263-286.
Dr. Ranjita Nayak & Prof. R.K. Bal

18
Brett, A. J (2006), "We Sacrifice and Eat Less":The Structural Complexities ofMicrofinance Participation, Humanorganization" Vol. 65, No. 1, pp. 8-19.
Chen M. (1984), "Developing Non-craftEmployment for Women inBangladesh, New York, Seeds.
Crépon at el (2015), "Estimating the Impact ofMicrocredit on Those Who Take It Up:Evidence from a RandomizedExperiment in Morocco." AmericanEconomic Journal: Applied Economics,7(1): 123-50.
Hulme, David and Paul Moseley (1996),"Finance Against Poverty", Vols. 1 and2, Routledge, London and New York.
Nirantar. (200)," Examining Literacy and Powerwithin Self Help Groups: A QuantitativeStudy." Nirantar.
Pokhriyal A.K and Ghildiyal Vipin (2011), "AComparative Assessment of Bankingand Microfinance Interventions inUttrakhand" Global Journal of Financeand Management, Volume 3, Number1 (2011), pp. 111-121.
Puhazhendhi, V, (2000), "Evaluation Study ofSelf Help Groups in Tamilnadu",NABARD ( www.nabard.org).
Puhazhendhi, V, and Satyasai, K.J.S. (2000),"Microfinance for Rural People- AnImpact Study," NABARD,(www.nabard.org).
Puhazhendhi, V, and Badatya, K.C,(2002), "SHGBank Linkage Programme-An ImpactEvaluation." NABARD,(www.nabard.org).
Sebstad, Jennefer, and Monique Cohen. (2000),"Microfinance, Risk Management, andPoverty". AIMS Project Report, USAID/G/EG/MD. Washington, D.C.:Management Systems International.
Sebstad, Jennefer and Gregory Chen. (1996),"Overview of Studies on the Impact ofMicroenterprise Credit." AIMS ProjectReport, USAID/G/EG/MD.Washington, D.C.: ManagementSystems International.
Sebstad, Jennefer, Catherine Neill, CarolynBarnes, and Gregory Chen. (1995),"Assessing the Impacts ofMicroenterprise Interventions:" AFramework for Analysis. USAIDManaging for Results, Working PaperNo. 7. Washington, D.C.: USAID.
Microcredit and Economic decision of Borrowers - An Analysis

WORK-LIFE BALANCE - A HOLISTIC APPROACH
*Assistant Professor, Regional College of Management, Chakadola Vihar, C. S. Pur, Bhubaneswar-751023,[email protected]**Associate Professor, Sri Sri University, Cuttack-754006, [email protected]***Reader, P. G. Department of Commerce, Utkal University, Bhubaneswar-751004,[email protected]
Dr. Soumendra Kumar Patra*Dr. Subash Chandra Nath**
Dr. Maheshwar Sahu***
INTRODUCTION
What is balance ?
According to the dictionary terminologybalance means "noun: an equal distributionof weight… a condition of steadiness…" oras a verb "to bring into or keep in a steadycondition".
What is Work-life balance?
Work-Life balance is to strike a balancebetween work activities and spending
quality time with the family amidst allcircumstances in a given moment. Work-Life balance is personal, intangible anddynamic. Work-life balance is aboutimproving people's quality of life andwidening access to paid employment andcareer opportunities. Work-life balance isabout the fundamental aspects of 'DecentWork', which is enshrined in the Director-General's report to the International LabourConference in 1999.
ABSTRACTIn the pursuit of improving performance, increasing productivity, reducing costs and enhancingprofitability in the workplace, organizations are evolving new ways and means to build psychologicalrelationships with employees. Work-life balance (WLB) is a common challenge throughout theindustrialized world. Employees all over the world are facing challenges how to balance work and theirfamily lives. This article throws a light on how Work-Life Balance can be made part of the comprehensiveHR strategy aimed at both employee satisfactions as well as achieving organizational results, howWLB as a win-win strategy benefits employees, employers and shareholders and also how the concept ofWork-Life Balance builds overall personality of an Individual.
Key Words : Work, Balance, Individual, Personality, Achieving, Strategy, Results
It's all about quality of life and finding a happy balance between work andfriends and family.
- Philip Green
The Utkal Business ReviewDecember, 2015, Vol - XXIX, pp.-19-27

20
Decent work
Affordable
childcare
Reasonable
Working Hours
Fair pay
Manageable workload
Quality
Good Leave
provisions
Satisfying and
rewarding Paid work
Equity
Decent
Work
Figure 1 : Depicts the factors of Decent Workof International Labour Organisation.
Why does Work-life balance matter toemployees and employers ?
Adoption of work-life balance policies andpractices can improve an organization'sability to respond to customers' demandsfor increased access to services and dealwith changes in a way that can besatisfactory to both employers andemployees. Employers who implementwork-life strategies for the benefit of itsemployees are always in the driving seatand they reap benefits in terms ofproductivity and high performance in thework as well as balancing their family lives.
Achieving a healthy work-life balance is themost important consideration for educatedyouth when it comes to choosing anemployer and hence work-life balancepolicies and practices are an important andperhaps essential recruitment tool.
Statistics
Statistics show that average work weeksvary; employees in Japan workapproximately 35 hours a week; in theUnited Kingdom, 37 hours; and the UnitedStates, 47 hours. The truth is that mostemployees in India work around 55-60hours a week - well over the 48 hours one isnormally expected to put in. 'Work/lifebalance' is now a live theme in social policy,generating considerable public debate,research and policy innovation.
Advantages of Work-life balance
Balancing work and life is vital for bothemployers and employees alike because itcreates an edge for building strongrelationships, which creates a positiveimpact on the organization.
Figure 2 : Depicts the expected benefits ofWork Life Balance
It is very interesting to notice that, Work LifeBalance will enable every Employee/Individual to achieve some of the followingcommon benefits (See Figure: 2)1. Better performance of an employee2. Increase in productivity3. Higher morale and lower staff turnover
Work-Life Balance - A Holistic Approach

21
4. Lower absence and sickness rates5. Reduction in burnout6. Better management of Stress7. Better recruitment and retention of staff8. Improved company image.
Result of work life-imbalance
As the most critical and crucial asset of theorganization are being employees,Moreover as they have to be retained withthe organization for a longer period, toachieve sustainable growth in this world ofgreat competition.
Hence, it is suggested that, a proper balancemust be maintained between work andfamily life of an individual. There may be anegative impact on the organization if aproper balance is not stroked between thework, and life outside the work which mayresult into serious repercussions andultimately damages the image of theorganization. In a case where, work andlife is not properly balanced might result inoccurrence of some of the following negativeconsequences such as High stress levels,Increase rate of absenteeism andpresenteeism, Broken relationships,Addicting to bad habits, Lower performancelevels, Increased mental tension (See Figure: 3)
High stress levels
Increases rate of absenteeism and
presenteeism Addicting to
Bad habits
Broken Relationships
Lower Performance levels
Increased mental tension
Result of Work life Imbalance
Figure 3 : Outlines negative consequences ofimbalanced work-life
Objectives :
This study seeks
How work-life balance strategies impactorganizational performance
How a person can develop hispersonality through work-life balancestrategies.
People are the most important resource inany business activity. If we take care of ourpeople then they will take care of ourorganizations. Nations like India, China aredeveloping because of quality humanresources. Since the world is working by24x7 system, it is the responsibility of theemployers to provide good welfaremeasures to its employees for qualityperformance in the organizations.
Work-life balance in Indian Scenario
The need for balanced work-life wasrealized when world is adopting 24x7 workculture and after the advent of LPG(Liberalisation, Privatisation andGlobalisation) most of the females areworking in Indian concerns than ever before.Previously men used to work and womenare confined to household activities. Due tolarge number of working females the needfor work-life balance arose. It is the time;organizations are realizing the need forimplementation of work-life strategies inorganizations to retain its talented workforce by helping them in balancing theirwork and life outside work. In a nation likeIndia, we should be very careful inimplementing work life policies and itshould be under the supervision ofrespective HR departments so thatemployees might not take undue advantageof the family-friendly policies. If there is
Dr. Soumendra Kumar Patra, Dr. Subash Chandra Nath & Dr. Maheshwar Sahu

22
feedback and control in implementing thesepolicies there is every chance for India tostand besides world leading nations. Indiashould always remember, "Healthy Peoplewill create Healthy Organisations".
Work-life balance practices in IndianCorporates that contributes to an HR edge
Infosys
The work life at Infosys is tailored aroundthe personal lives of the employees, not theother way round. All possible facilities areavailable on-site to all employees. Thecompany, an extension of the family, takescare of every individual's need, from seeingan employee through a close relative'sillness to celebrating special occasionstogether.
ICICI
ICICI believes that the quality of work lifeenhances employee productivity. Thefamily-
Friendly package of ICICI include facilitiesfor children of employees to get admitted inbest schools, providing holiday homes forleisure there by enabling managers toconcentrate on work.
Procter & Gamble
P&G prides itself on looking after the healthof employees and their families. Some of therelated benefits provided include unlimitedmedical coverage, an onsite doctor,education on health management, and first-aid workshops. Newsletters on health,stress-reduction programmes, subsidisedhealth club facilities, and nutritioncounselling are other welfare measures.
Apart from these there are lot manyorganizations following Work-Life
Strategies. Sense of belongingness- NTPC Sparsh Involvement & empowerment- Samtel
electronics Promoting smart work- Alternate work
place of IBM, GE, GSK Opportunity to fulfil personal ambition-
WIPRO ( Wings within)/ Sasken Recognition of other interest-PWC/
ADOBE/IBM Culture of openness - Accenture
mentoring system
WLB as part of HR Policy
WLB practices in Indian organizationsshould be made part of the comprehensiveHR strategy aimed at both employeesatisfactions as well as achievingorganizational results.
In this global industry, the demands onpeople's time are more intense than ever.We realize that great people have choices,and it's our duty to create an environmentthat works with people's needs and at thesame time promotes and drives businesssuccess."
— Sharon DaleyGE Energy's Vice President of Human Resources.
A WLB Model Individual Requirements Business Priorities
WLB as part of HR Strategy Branding Organization for r ight talent
Win-Win Systems Culture of Openness
Role Models at Top
Organization Commitment & Joyful Work-Culture
Figure 4: Work-life Balance from anEmployers and Employees Perspective
Work-Life Balance - A Holistic Approach

23
Employers see only the "cost side" of theWork/Life equation. One of the greatestchallenges facing employers is in theimplementation and management of Work-life balance policies. If implementedproperly they can reap enormous benefits.
Better recruitment and Retention
Enhanced Corporate Image and Reputation
Reduction in Absenteeism
More satisfied customers
Employee with better Morale
and highly motivated
Improved Performance and Productivity
What Employer Seek Outcome of Balance What Employee Seek
Better quality of Work/Life.
Better health and Peace of mind
More enjoyable work life And Career Advancement
More Income and Benefits.
Enough Time to spend with Family & Friends
Increased ROI
Quality Work
Quality Life
Improved Process
Better Business
Better Society
Value Addition
Further Education and Training & Development
Figure 5 : Benefits expected by an employer &employees as well as expected overall outcome
Where as Employees is an indispensableasset to the organization. Employers shouldensure WLB practices to be effectivelycarried out for showing high performanceon the jobs. All individuals have differentneeds and wants; the employers shouldimplement WLB strategies at different levelsin their lives depending upon theirrequirements.
Employees who feel their managers supporttheir family responsibility situation and arenot distracted by conflicts between work andfamily are more productive and more likelyto stay with an employer. (See Figure: 5)
Personality Development can be achievedthrough Work-Life Balance
For many of them an ideal employee is onewho sacrifices personal life for the sake ofwork priorities. If a person has to develophe has to concentrate on four aspects of hislife to achieve a proper balance whether itmight be in work or non-work relatedactivities.
(1) Social Aspect : Man is a social being. Heis a part of a family. He is a part of society.He cannot work alone and he has towork in teams or groups.
Figure 6 : WLB contributing towards thepersonality development of an individual
A person who has good interpersonalrelationships, be it in the family or thesociety; derives and gives moral support tohis fellow human beings who are workingalong with him can strike a proper balancewith his work as well as life.
A person who was brought up with gooddiscipline will lead a disciplined life andcontrols his emotions, if he is accountableand responsible for the work he wasbestowed upon and if he is clear about hisrole he can lead a balanced life.
(2) Physical Aspect : A person whoconstantly takes care of his health willmaintain good physique. A person whois mentally fit and has positive attitudewill perform better and will lead abalanced work-life.
(3) Spiritual Aspect : A person who isspiritually strong by practicing his orher own religion will have a strongpsychological balance, mental peace,
Dr. Soumendra Kumar Patra, Dr. Subash Chandra Nath & Dr. Maheshwar Sahu

24
reduced stress levels and will have goodcharacters, such persons can thinkinnovatively and can contribute to thegood cause of the society.
(4) Intellectual Aspect : A person who isintellectually strong will have soundwisdom and knowledge on all spheresof life and he will behave in a maturedand civilized manner.
If a person with the above aspects enters anorganization or an industry he will easilyget habituated to the work culture.Employers or employees with the blend ofabove qualities will somehow try to balancetheir work as well as life. We see now-a-days there is lot of mental stress and tensionfor both employers and employees resultinginto broken relationships, habituating tobad habits, reduced performance levels inthe work and lower productivity. To arrestthis imbalance every individual has to doSWOT (Strengths, Weaknesses,Opportunities and Threats) analysis in thelight of the above four important and crucialaspects.
Every person he or her should analyse indifferent roles, as a manager, as a father, asa mother, as an elderly person and shouldthink twice whether he is happy in all theseroles, Is he contributing quality time apartfrom his routine work to his family?. He alsoshould analyse whether he is unhappy inany of the mentioned roles and how best hecan do to make himself happy in each role.
A person who is happy and who leads abalanced life will contribute to the "Qualityof work-life".
The Two Sides of the INDIVIDUAL'SWork-Life Balance Coin
Figure: 7
All good organizations implement strongHR policies like Family-Friendly policies toits employees. Every individual expectssomething from the organization in returnfor their services rendered to theorganization. The strong HR policy now adays extensively used is "If we take care ofour employees, our employees will take careof our organization".
In the above Fig. 5, HR departments shouldrecognize that employees are their key assetsand they should motivate its employees byproviding family-friendly packages so as toretain its quality work force. An individualcan deliver only when his needs are met,organizations should use the quality timeof its employees towards higherperformance and greater productivity.
Providing quality work-life or balancedwork-life is the prerequisite of everyorganization so as to smoothly run for yearstogether by retaining its human assets. Theneed of the hour is "Healthy people willbuild Healthy Organizations". People willbe healthy when they lead a balanced lifeand finding a happy balance between work,friends and family.
Implementing Work-Life Strategies
The work-life strategy should contain someof the tried and tested components. Anorganization needs to adopt the pattern and
Work-Life Balance - A Holistic Approach
25
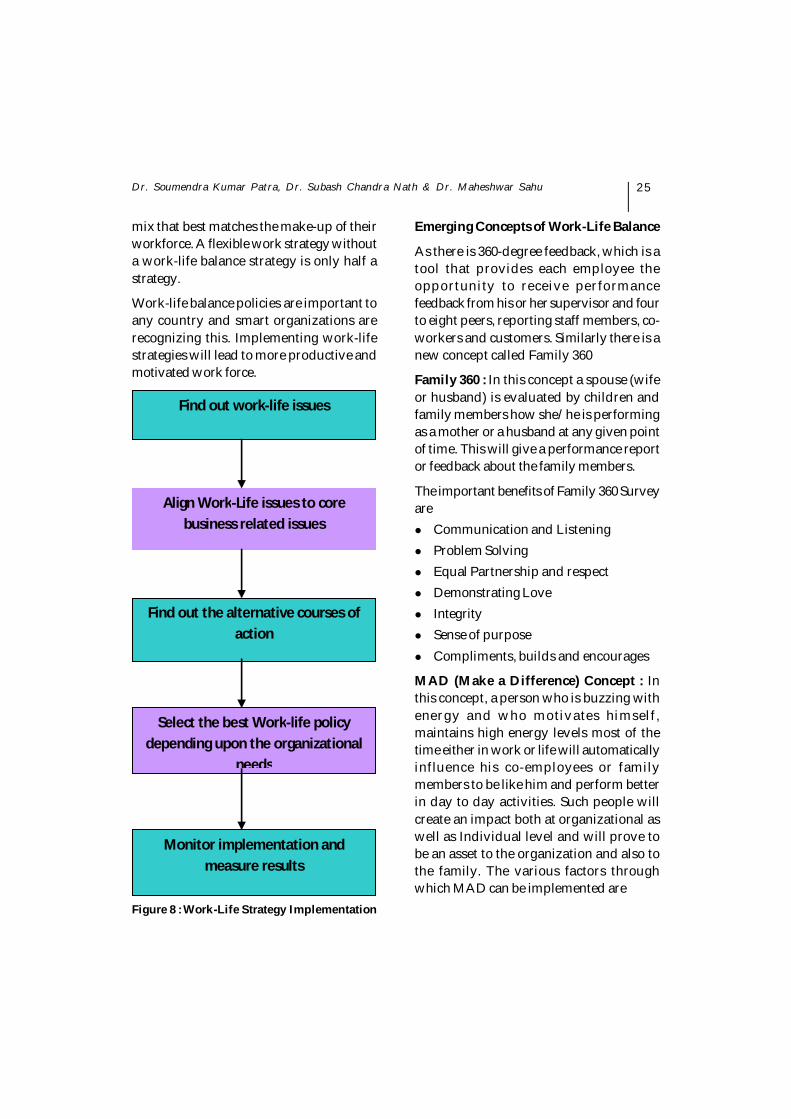
mix that best matches the make-up of theirworkforce. A flexible work strategy withouta work-life balance strategy is only half astrategy.
Work-life balance policies are important toany country and smart organizations arerecognizing this. Implementing work-lifestrategies will lead to more productive andmotivated work force.
Align Work-Life issues to core business related issues
Find out work-life issues
Find out the alternative courses of action
Select the best Work-life policy depending upon the organizational
needs
Monitor implementation and measure results
Figure 8 : Work-Life Strategy Implementation
Emerging Concepts of Work-Life Balance
As there is 360-degree feedback, which is atool that provides each employee theopportunity to receive performancefeedback from his or her supervisor and fourto eight peers, reporting staff members, co-workers and customers. Similarly there is anew concept called Family 360
Family 360 : In this concept a spouse (wifeor husband) is evaluated by children andfamily members how she/he is performingas a mother or a husband at any given pointof time. This will give a performance reportor feedback about the family members.
The important benefits of Family 360 Surveyare Communication and Listening Problem Solving Equal Partnership and respect Demonstrating Love Integrity Sense of purpose Compliments, builds and encourages
MAD (Make a Difference) Concept : Inthis concept, a person who is buzzing withenergy and who motivates himself,maintains high energy levels most of thetime either in work or life will automaticallyinfluence his co-employees or familymembers to be like him and perform betterin day to day activities. Such people willcreate an impact both at organizational aswell as Individual level and will prove tobe an asset to the organization and also tothe family. The various factors throughwhich MAD can be implemented are
Dr. Soumendra Kumar Patra, Dr. Subash Chandra Nath & Dr. Maheshwar Sahu

26
MAD (Make a Difference Concept)includes Values established by Staff Actions established by management MAD Events & Anchors MAD in Performance Appraisals MAD Notice MAD Cards & Letters
Future of Work-life balance in India
Employers are however extremely positiveabout the future of Work-Life Balancepolicies in India. They recognize that it willbecome a distinct part of an organization'sHR policy and corporate strategy and willhave a positive impact on business.Government-led legislation will need to actas a catalyst of change for the industry inintroducing Work-Life Balance policies
There are some areas however are notsupported by too much research like theimpact of Work-Life Balance policies onsenior managers which would be aninteresting area for further exploration. Itwould be interesting to trace how policiesevolve over the next few years to includelarger cross section of employees.
CONCLUSION
Work-Life strategies, if implemented well,offers practical solutions to real businessas well as personal problems. Business canexpect improved employee loyalty andcommitment, increased productivity,reduced turnover and absenteeism, and anoverall lower cost of doing business.Employees can expect greater control overtheir lives and an improved capacity tobalance commitments at work and at home.Society, as a whole, can expect stronger
businesses and healthier families.
Work/life balance is becoming moreimportant with each passing year. If youtake care of your people, they will take careof you and your organization," It is thebalance, which one strikes among thesecompeting interests that truly dictates one's"quality of life."
Corporate success in the next millenniumdepends on effective use of humanresources,
Firms must aggressively embrace work/lifebalance programs and recognize thatemployees have major responsibilitiesoutside their jobs. Failure to do so will posea threat to corporate survival.
Work-life balance is different to differentpeople, individual choices differ, andbalance for one individual may not be thebalance for another individual. In this backdrop it is better to assess what are the areaswhere individuals feel balanced and whatare the areas where they can better theirimbalances in life and work related activitiesthrough various frameworks likepersonality development through work-lifebalance, individual work-life balance coinetc.
REFERENCESSarang Shankar Bhola, "A Study of Quality of
Work Life in casting and Machine ShopIndustry in Kolhapur", Finance India,Vol. XX No.1, March 2006. (Pages 202-208).
Ujvala Rajadhyaksha and Deepthi Bhatnagar,"Life role salience: a study of dual careercouples in the Indian context", Journalof Human Relations, Vol.53 (4): 489-511,April 2000. Pages 101-135.
Work-Life Balance - A Holistic Approach

27
D.R.Saklani, "Quality of Work Life in Indiancontext: an empirical investigation",Decision, Vol.31, No.2, July-Dec-2004.
Sandra L. Wiley, Creating work/life balancewithin your organization, Catalyst(Dublin, Ohio), Sept-Oct 2006, p26 (3).
Kalra, S.K and Ghosh.S "Quality of Work Life:a study of associated factors", The IndianJournal of Social Work, Vol.25 (3), Pages(341-349), 1984.
Molly Bernhart, "Lawsuits looming forcompanies blind to familyresponsibility issues", EmployeeBenefit News, September-15, 2006.
Amie Duda "Work-life balance: how do youget it", Training, , Vol:43 i9, p9 (1), Sept2006.
Madhavi Mishra and Purva Mishra, HewittAssociates LLC, "India's Best Employers:The Top 5" , A Business Today- HewittStudy.
Galinsky, E and Bond, J.T," The Role ofEmployers in addressing the needs ofemployed parents", Journal of SocialIssues, Vol.52, No.3, Pages (111-136),1996.
Crouter, A.C., Bumpus, M.F, Head, M.R andMchale, S.M, "Implications of overworkand overload for the quality of men'sfamily relationships", Journal ofMarriage and the Family, Vol.63 No.2,Pages (404-416), 2001.
Kossek, E and Ozeki, C "Bridging the Work-Life policy and productivity gap: ALiterature Review, Community, Workand Family, Vol.12, No.1, Pages (7-32),1999.
Dr. Soumendra Kumar Patra, Dr. Subash Chandra Nath & Dr. Maheshwar Sahu
ENTREPRENEURSHIP EDUCATION- THEMISSING BOULEVARD TO INDIA'S SHINING
FUTURE- AN EMPIRICAL ANALYSIS
*Assistant Professor, SAI International College of Commerce**Reader, P.G. Department of Commerce, Utkal University
Ms. Smruti Rekha Sahoo*Dr. Prabodha Kumar Hota**
1. BACKGROUND OF THE STUDY
Entrepreneurship plays a key role in anynation's economy and is a crucial driver foremployment and economic growth. Ittouches human lives through variousaspects like introduction of newtechnologies, products and services.Through their creative vision, entrepreneursimprove the world by innovation and helpin building a richer, comfortable and a bettersociety. Entrepreneurship is the steppingstone towards economic development ofIndia. Thus, efforts should be made todevelop an entrepreneurial bent of mindamong individuals.
It is believed that factors like institutionalenvironment, primary education, highereducation and training and innovation are
the key drivers of budding entrepreneurship.Therefore, it is important to analyze the roleof entrepreneurial education in fosteringentrepreneurship. Late Dr. A.P.J. AbdulKalam, rightly said, while addressing thestudents of IIT Bombay that an educationsystem which highlights the importance ofentrepreneurship needs to be created.Systematic entrepreneurship education willimpart the necessary skill of creativity,freedom and ability to generate wealth andprepare them to get oriented towards settingup enterprises. A faster rate of growth can beexpected if the youth of our country areencouraged to become entrepreneurs andhelp along with support is provided to themin transforming their vision into anenterprise that serves not just the domesticmarket but the global market as well.
ABSTRACTIn this era of globalization and technological innovations, there are many individuals who thinkoutside the box and like to distinguish themselves from others. Such individuals have a vision whichthey want to bring to market or desire to start their own business. In order to bring the potentialentrepreneurs to the forefront, it is important to impart necessary knowledge and skills which is possiblethrough entrepreneurship education. Although entrepreneurship education is crucial, its awareness isstill sluggish.This paper tries to explain that support for entrepreneurship has never been more important. Theshining future of India depends on the pace at which entrepreneurship develops which is possible onlyby proper education and training.
Key Words : Attitude, economic growth, Entrepreneurship education, entrepreneurs, skills, support.
The Utkal Business ReviewDecember, 2015, Vol - XXIX, pp.-28-35

29
2. SIGNIFICANCE OF THE STUDY
The word 'development' is used in differentways; however, economic developmentessentially means a process that increasesthe per capita income of the country. Animportant aspect of economic developmentis emergence of new entrepreneurs.Entrepreneurship and innovation arecritical for the growth of a developingcountry like India. Development ofentrepreneurship should be such that itgenerates impetus for further innovation.Apart from creating wealth and boostingeconomy, it creates employmentopportunities for millions of people, aculture of independence, risk-taking andconfidence. In order to create such anenvironment, entrepreneurship educationis paramount for today's individuals. Thesignificance of Entrepreneurship can besummarized under the following points;
Promotes capital formation Provides Large scale employment Reduces the concentration of economic
power Promotes balanced regional
development Acts as a catalyst of economic
development
3. REVIEW OF LITERATURE
1. Sang M. Lee, Daesung Chang, Seong BaeLim (2005) studied thatentrepreneurship has emerged as amainstream business discipline.However its education by country differsaccording to cultural context. The paperpresents the results of a study on theimpact of Entrepreneurship educationin USA and Korea.
2. Daniel Yar Hamidi, Karl Wennberg,Henrik Berglund (2006) investigated theimportance of creativity inentrepreneurship education andtheoretical models of entrepreneurialintentions. The ?ndings indicate thatexercises in creativity can be used toraise the entrepreneurial intentions ofstudents in entrepreneurship education.Heterogeneity in creative styles amongstudents also points to the problems of a"one-size-?ts-all" approach toentrepreneurship education.
3. Eslyn Isaacs, Kobus Visser, ChristianFriedrich and Pradeep Brijlal (2007),assessed the levels of entrepreneurshipeducation and training at the FurtherEducation and Training (FET) level in aSouth African context. Research clearlyshowed that various problems inschools hinder the effectiveimplementation of entrepreneurshipeducation, some of which are poorlytrained educators and lack of adequateresources. Better entrepreneurshipeducation could make a significantcontribution to job creation andultimately to poverty alleviation.
4. Anis ur Rehman, Dr. Yasir Arafat Elahi(2012) analysed the role of B-schools inshaping and nurturing of futureentrepreneurs in India. It also discusseswhether the current curriculum taughtin B-schools meets the requirements ofbudding entrepreneurs. Moreover, thispaper discusses the steps that shouldbe taken by B-schools towardspromotion of entrepreneurshipeducation.
Ms. Smruti Rekha Sahoo & Dr. Prabodha Kumar Hota

30
5. C. S. Ramanigopal, G. Palaniappan, NHemalatha (2012) studied thatEntrepreneurship education meansmany different things to educators - fromprimary schools to university, fromvocational education to a universityMBA. At each level of education, it isreasonable to expect different outcomesas students mature and build onprevious knowledge. But the overallpurpose remains to develop expertise asan entrepreneur. The action ofgovernment in creating and limiting theenvironment for entrepreneurshipshould be included in courses of highschool government.
6. R. Arun, M. Sureka (2014) highlights theimportance of the business education ,frame work for the development ofbusiness education, the competenciesthat are require building strongentrepreneurs, the role business schoolsand their initiatives taken by them inimparting management education tobuild entrepreneurial competencies inan efficient effective excellent manner toencounter the challenges of business.
7. Kalpana Singh (2014) analysed thatbusiness schools play a significant rolein the development of Entrepreneurialeducation. The business schools help inthe development of knowledge basethrough the identification ofopportunities and making the ways toovercome the obstacle that are imposedin the path of an entrepreneur by thecircumstances.
8. Dr. Aneitie E. Efi (2014) examined therole of higher institutions in promotingentrepreneurship and small business in
Nigeria. A critical review ofentrepreneurship education in Nigeriareveals that the programme has helpedin instilling and revivingentrepreneurial spirits in the minds ofNigerians, thereby encouraging andproviding individuals with careeroptions, self-sustenance, and self-reliance. This paper has alsohighlighted the challenges and concernsthat threaten the effectiveness ofentrepreneurship education in Nigeria.The paper recommends thatentrepreneurship education should beintroduced at the primary and secondarylevels of the Nigerian educational sectoras this will further boost the urge anddrive for entrepreneurial practice andcareer option.
9. Ekundayo B. Babatunde & E. Durowaiye(2014) studied that exposure toentrepreneurship education influencesstudents' intentions of becoming selfemployed. The study concludes thatdespite knowledge of entrepreneurshipeducation as a contributing factor in thereduction of unemployment, Nigerianyouth requires additional supports toovercome the foreseen challenges.
10. Pramod Rajput, RK Shrivastava andUsha Dhulia (2015) analysed thataspirants seeking jobs are increasingrapidly. However, the jobs are reducingday by day. Therefore it is important toattract the under graduate studentstowards Entrepreneurship.
4. Research Gap
After analyzing different research studies,the following research gaps are revealed;
Entrepreneurship Education-the Missing Boulevard to India's Shining Future- an Empirical Analysis

31
The importance of Entrepreneurshipeducation as a part of syllabi in India,especially in Odisha, at school level isyet to be researched.
There has not been any extensive studyon the impact of entrepreneurialknowledge in choosingentrepreneurship as a career.
The above review is silent on the issuesand challenges that prevent individualsto become successful entrepreneurs.
5. Problem Statement
The count of people without a job or abusiness is on the rise. India ranks 130 outof 189 countries in terms of ease of doingbusiness by the World Bank thus clearlyindicating the scope for entrepreneurshipin India. The truth of soaring rate ofunemployment is being hidden under theshadow of shining and rising growth rateof Indian Economy. Going by the surveyreport by Labour Bureau, India'sunemployment rate has risen from 4.7% to4.9% in FY-14 which was last updated on7th January, 2015. The growth rate of youthpopulation in India is evident from the lastelection that the country has added 9.7 crorevoters since the 2009 Lok Sabha polls. Theworking-age population is rising by about12 million people a year. However, theemployability and entrepreneurshipopportunity is not growing at the same pace.If the same scenario continues, by 2020,India will become the youngest country inthe world with 64% of the population in theworking age group accompanied by thehighest rate of unemployment. In theexisting scenario, it is more important toeducate people to be self employed.
It is true that a major population of India ispoor but, not because of lack ofentrepreneurial skill or ambition but due tolack of relevant education, support andcumbersome legal processes to start abusiness. Today, India's biggest worry is thewaste of huge potentiality in terms ofentrepreneurship which can be understoodfrom a recent event in Bangalore where arecruitment drive was held for 1200Engineer trainee posts at a reputed ITCompany. However the number candidateswere more than 8000 leading to a chaoticscenario. This shows that the population ofunemployed in India is much higher thanthe total population of Canada, Australia,New Zealand and Switzerland.
One of the biggest challenges for the growthentrepreneurship in India is lack of properefforts towards its education anddevelopment. People should be encouragedto become entrepreneurs not because theycan't find a job but they see an opportunity.The city streets all over India are crowdedwith clever and hard-working streetvendors. In spite of having great potentialto become an entrepreneur they are forcedinto such businesses because of lack ofeducation and support. Four of the 10 bestcountries for entrepreneurship have thesmallest economies in the developed world.We need to accept the fact that the bestcountries for entrepreneurs do notnecessarily have the biggest economies, butthe countries with basic amenities forentrepreneurs.
6. Objectives of the Study
The broad objective of the study is to findthe reasons behind the slow progress ofentrepreneurs and suggest how
Ms. Smruti Rekha Sahoo & Dr. Prabodha Kumar Hota

32
entrepreneurship education can play aninstrumental role in fosteringentrepreneurship. The specific objectives arelisted below;
To evaluate the attitude of school andcollege students towardsEntrepreneurship.
To find out the reasons behind lack ofinterest towards Entrepreneurship.
7. Hypothesis
Null Hypothesis (H0)- ChoosingEntrepreneurship as a career isindependent of having or not havingEntrepreneurial knowledge. [Exhibit-IV]
Alternate Hypothesis (H1)- ChoosingEntrepreneurship as a career isdependent on having Entrepreneurialknowledge.
8. Research Methodology
The sources of data used are primary as wellas secondary in nature. A survey wasconducted among 100 individuals, chosenrandomly, aged between 14-25 years. Aquestionnaire was prepared whichincluded close ended questions like;
Do you have any knowledge aboutEntrepreneurship or start-ups?(Exhibit: I)
Would you like to become anentrepreneur? (Exhibit: II)
If 'no', give reasons. (Exhibit: III)
9. Findings & Analysis
Exhibit-I
The findings of the study are shown below;
Responses on EntrepreneurshipKnowledge
Age Group
Total no. of Individuals Interviewed
Entrepreneurial Knowledge
Yes No 14-16 30 10 20 16-20 35 23 12 20-25 35 14 21
Total 47 53 Source: Primary Survey
Prepared on the basis of above table;
Source: Primary Data
Exhibit- II
Choosing Entrepreneurship as a Career
Total Yes No 100 36 64
Source: Primary Data
Prepared on the basis of above table;
Source: Primary Data
Entrepreneurship Education-the Missing Boulevard to India's Shining Future- an Empirical Analysis

33
Exhibit: III
Reasons behind not choosingEntrepreneurship as a career
Source: Primary Data
(Exhibit-IV)
Association between EntrepreneurshipKnowledge and Entrepreneurial CareerOption Career Option Total
YES NO
Entrepreneurial Knowledge
HAVE Count 30 17 47 Expected Count 16.9 30.1 47.0
HAVE NOT
Count 6 47 53 Expected Count 19.1 33.9 53.0
Total Count 36 64 100 Expected Count 36.0 64.0 100.0
Result of Chi-Square Test
Value df Asymp. Sig. (2-sided)
Pearson Chi- Square 29.810a 1 .000b N of Valid Cases 100
a. 0 cells (0.0%) have expected count lessthan 5.
b. The minimum expected count is 16.92.
10. Interpretation
Thirty number of individuals interviewedbetween the ages of 14-16 who were schoolstudents either in ninth or tenth grade. It isdisturbing to know that a majority of the
students didn't have any knowledge aboutentrepreneurship. When interviewed toindividuals aged between 16-20 years, morethan 50 percent of them had informationwhat entrepreneurship is all about.However, the positive responses camedown when interviewed to individualsaged between 20-25. On further enquiry, itwas revealed that it was not only lack ofinformation but also insufficient capital andlegal formalities involved in a start-upbusiness that contributed to lack of interestin Entrepreneurship.
A chi-square test was conducted to checkindependence of attributes between havingor not having entrepreneurial knowledgewith choosing or not choosingEntrepreneurship as a career option. Thedata set met all the conditions for thevalidity of chi-square test i.e. Data reasonably large (N=100). Independent sample observations. Linear constraint on cell frequencies i.e.
O = E = N , whereO = Observed frequencyE = Expected frequency
N = Total frequency Data is in original units. Theoretical frequency in any scale is not
less than 5.
The cross tabulation table observedfrequencies and reflect the fact that out of47 individuals who have entrepreneurialknowledge, 30 individuals choose tobecome entrepreneurs. On the other side, outof 53 individuals who do not haveentrepreneurial knowledge, 6 are willing tobecome entrepreneurs. Expected frequencyfor each category in the cross tabulation is
Ms. Smruti Rekha Sahoo & Dr. Prabodha Kumar Hota
34
around ±13.1. The chi-square test value is29.810 which have 0.000 asymptoticsignificance (2-tailed test) or p-value. Sincethe p-value is less than 0.05; we reject theH0 and accept H1 to conclude that choosingentrepreneurship as a career is dependenton having entrepreneurial knowledge.
11. Suggestions
Even today, there are only a handful ofschools and colleges that offerentrepreneurship as a discipline atsecondary level. Entrepreneurshipeducation helps in cultivatingentrepreneurial bent of mind amongstindividuals. Therefore, it is important thatEntrepreneurship is made mandatory forstudents choosing the stream of Commerce.It is also important to ensure that thecurriculum of Entrepreneurship as a subjectis not limited only to learn how to start andrun a business. The quality of educationshould be such that it is able to meet therequirements of today's world. Thecurriculum of Entrepreneurship shouldtouch different aspects like skill and behavioural training resource building business opportunity identification business management interaction with successful
entrepreneurs and experts inentrepreneurship development forpractical insights
visit to different enterprises etc.
Entrepreneurship as a subject should alsobe introduced to students at school level inthe form of success stories of entrepreneursin order to motivate and encourage studentsto become entrepreneurs. This will contribute
to creating successful entrepreneurs whichwill, in turn, have a huge positive impact onthe economy of our country.
It is also important to ensure that everyindividual across India is aware of thedifferent short term and long term educationalprogrammes as well as training programmesconducted in order to brush up their skillsand knowledge on different aspects ofEntrepreneurship. It is also important on thepart of the Government to come up with moretraining programmes with latest methodologyin order to equip the individuals to becomesuccessful entrepreneurs. One crucial steptowards boosting entrepreneurship is toliberalize the existing set of policies for startingup a new venture. A public-friendly policycan play a significant role in removing theobstacles that come in the way of growth ofpotential entrepreneurs. Lesser legal hasslesshall definitely lead proliferation ofentrepreneurship.
12. CONCLUSION
In the last few years, entrepreneurshipeducation has grown significantly and isreflected with a sharp rise in studentenrollment, growth of formalentrepreneurship centers and newentrepreneurship curricula and programs.Approaches to entrepreneurship educationhave been revamped across colleges anduniversities from single course offerings tointegrated curricula that include areas likemarketing, finance, competitive analysis,new product development and technology.Many institutions have alreadyimplemented entrepreneurship as aspecialized subject and are also coming upwith different programmes especially for thenon-business majors.
Entrepreneurship Education-the Missing Boulevard to India's Shining Future- an Empirical Analysis

35
Support for entrepreneurship has never beenmore important. The government needs toact now. The challenge for policy makers inIndia is to create the right frameworkconditions to fuel the growth ofentrepreneurs. There are many avenues opento policy makers to address the issue, but thechallenge would be in prioritization- pickingthe right set of issues and sequencing themto achieve significant results.
Emphasis on Entrepreneurship educationwill definitely boost the Prime MinisterNarendra Modi's mission of 'Make in India'and if it is achieved, the day is not far whenIndia will be ranked amongst the developedcountries in the world.
REFERENCESAnis ur Rehman, Dr. Yasir Arafat Elahi (2012),
International Journal of Engineeringand Management Research, Vol-2, Issue5, October 2012, PP 05-14.
C. S. Ramanigopal, G. Palaniappan, NHemalatha (2012), International Journalof Physics and Social Sciences, Vol-2,Issue 3, March 2012, PP 243-259
Daniel Yar Hamidi, Karl Wennberg, HenrikBerglund (2006), Journal of SmallBusiness and Enterprise DevelopmentVol. 15 No. 2, 2008 PP. 304-320
Dr. Anietie E. Efi (2014), "The Role of HigherInstitutions in PromotingEntrepreneurship and Small Business inDeveloping Nations: The NigerianExperience", International Journal ofInnovation Education and Research,Vol.2-09, 2014, PP 15-22.
Ekundayo B. Babatunde & E. Durowaiye (2014),"The Impact of EntrepreneurshipEducation on Entrepreneurial Intentionsamong Nigerian Undergraduates,International Journal of Research inHumanities, Arts and Literature ISSN(E):
2321-8878; ISSN(P): 2347-4564 Vol. 2,Issue 11, Nov 2014, PP 15-26.
Entrepreneurship Education ResearchRevisited: The Case of HigherEducation Jean-Pierre Béchard andDenis Grégoire, Academy ofManagement Learning & Education,Vol. 4, No. 1 (Mar., 2005), pp. 22-43
Eslyn Isaacs, Kobus Visser, Christian Friedrichand Pradeep Brijlal (2007),Entrepreneurship Education and Trainingat the Further Education and Training(FET) level in South Africa, South AfricanJournal of Education Copyright © 2007EASA Vol 27: PP 613-629
Kalpana Singh (2014), "The Role of Businessschools in Entrepreneurialdevelopment of Rural Areas of IndiaThrough Entrepreneurial education",TMIMT International Journal, Vol.1,Issue-2, Dec 2014
Pramod Kumar Rajput, R.K. Shrivastava andUsha Dhulia (2015) "Under GraduateStudents'Attitude TowardsEntrepreneurship- an Earnest Need toStudy", American Research Thoughts,Vol-1, Issue-6, April 2015, PP 1717-1722
R. Arun, M. Sureka (2014), BuildingEntrepreneurship through BusinessEducation, International Journal ofscientific research and management(IJSRM) Special Issue On National LevelConference Business Growth and SocialDevelopment, PP 87-90.
Sang M. Lee, Daesung Chang, Seong Bae Lim(2005), International Entrepreneurshipand Management Journal-1, PP 27-43.
h ttp://www.doingbusiness .org/data/exploreeconomies/india#close
http://www.doingbusiness .org/data/exploretopics/starting-a-business
http://www.iitbombay.org/news/Current/apj-abdul-kalam-for-education-that-promotes.
Ms. Smruti Rekha Sahoo & Dr. Prabodha Kumar Hota

DEVELOPMENT AND IMPACT OF TOURISMINDUSTRY IN INDIA
*Lecturer, P.G. Department of Commerce, Utkal University, Bhubaneswar. Email [email protected] , Mob- +91- 9437375400.**Lecturer, P.G. Department of Commerce, Berhampur University, Berhampur. Email [email protected] , Mob- +91-9040670389.
Dr. Rabindra Kumar Swain*Sri Maheswar Sethi**
INTRODUCTION
The impact of Tourism on the economic andsocial development of a country can bemultifarious like contribution to nationaldevelopment, opening it up for business,trade and capital investment, bringingpsychological peace and tranquil amongthe people, removing regional disparity,establishing harmonious relationship,unity and understanding among peoplearound the globe and removing
xenophobia, creating jobs andentrepreneurialism for the workforce andprotecting heritage and cultural values.Development of travel and tourism is notnew in Indian rather it is as old as humancivilization. There was a time when peoplewere travelling for the purpose of religiousrequirements, trade and commerce,exploring knowledge and exploring newlands. But now-a-days with the introductionof modern mode of transportation like
ABSTRACTThe economic development of any nation depends on the contribution of all the sectors of the economy.But the contribution of all the sectors is not of equal significance to the economic development. Keepingin mind the importance of various sectors in propelling the engine of economic growth, government ofIndia has declared the "Make in India" program and included many sectors of economic importancewithin its purview. Tourism industry which accounts for 6.8 % of GDP is one of such crucial sectors of"Make in Indian" program. This paper aims at highlighting the contribution of Indian tourism industryto economy and Employment of India. This study is descriptive in nature. For analyzing the economiccontribution of tourism industry variables like Direct contribution to GDP, Total contribution to GDP,Direct contribution to Employment, Total contribution to Employment, Visitors Exports, CapitalInvestments, number of Foreign Tourist Arrival, Foreign Exchange Earnings are taken into consideration.This paper concluded that the contribution of tourism industry to economy and employment is highlysignificant and also it has greater potential to contribute more in the periods to come. There existsenormous opportunities which need to be capitalized. So it is the call of the time to leverage this sectorto the greater interest of the nation. For all these a collaborative effort of government, private players,NGOs, local community and public at large is sought.
Key Words : Tourism industry, Contribution to GDP, Contribution to Employment, Visitor Exports,International Tourist Arrivals, International Tourism Receipts.
The Utkal Business ReviewDecember, 2015, Vol - XXIX, pp.-36-50

37
railways, ship, motor cars and airtransportation some new purposes oftravelling has been added to existingpurposes and amongst them travelling forthe purpose of tourism is considered to beof high volume. This has given a boost tothe development of tourism industry in thecountry. With the slogan "Atithi DevoBhava", India has continued to providelavish treatment to visitors irrespective ofplace where they come from. India is wellknown for entertaining visitors with varietyof attractions which includes wild life,mountain peaks, forest, landscapes, river,snow, beautiful sea beaches, sciencemuseums, historical museums,technological parks, monuments, centre ofpilgrimages, cultural heritages, ports, dams,yoga, ayurveda natural health resort,religious places and hotels. The handicraftsof India especially leather goods, woodenarticles, woven articles, brass work, ivory,jewelry and carpets have also successfullyattracted the interest of foreign tourist to agreat extent. As development of tourismbrings much economic and socialdevelopment to a nation, it is the call of thetime to leverage this industry to propel theengine of economic growth. Keeping in viewthe economic contribution of tourismindustry, this has been considered as asector of economic importance andincluded as a crucial sector in make in Indiaprogramme. In this study sincere efforts havebeen made to explore the development andcontribution of tourism industry to Indianeconomy.
Literature review
Though there are very less number ofliterature available in the field of tourism
sectors, sincere effort has been made toinclude those research works which arerelevant for this research. This section dealswith some of the prior works in this area tohave a concrete idea about the phenomenonwhich are going to be addressed in thisresearch paper.
Gupta (2015) conducted a study to illustratethe status and contribution of Foreign DirectInvestment (FDI) in facilitating tourism inIndia, to pinpoint the challenges of tourismin India and to highlight the issues thatdeserve attention of policy makers forachieving inclusive growth throughtourism sector. The paper concluded thatcapitalization of the massive opportunitiesin tourism sector for facilitating inclusiveand sustainable growth in India can beachieved through FDI. But there are manyfactors like Service tax on travelintermediaries, multiple tax structure, lackof coherence in varied policies, lack ofskilled manpower, diffusion of technologyin tourism etc which make the Indiantourism unattractive to foreign investors. Soappropriate policy measures, to removethose challenges can bring a sizable growthin Indian tourism industry.
Sharma, Sharma and Kukreja (2012)conducted a exploratory research on Indiantourism industry to highlight the role oftourism industry in socio-economicdevelopment of the country, to analyze therole of Hotel and Aviation Industry inincreasing the foreign exchange in India ,toknow the areas which offers tourism relatedemployment ,to measure the effectivenessof different schemes and programmesinitiated by Government to promote suchindustry and finally to trace out the
Dr. Rabindra Kumar Swain & Sri Maheswar Sethi

38
problems faced by the industry. The studyconcluded that tourism industry isexpanding day by day and contributing alot towards the economic development ofsociety by providing employmentopportunities and huge increase in foreignexchange earnings. Though it has somenegative sides too but this problem can beeliminated by the joint efforts of government,tourism organizations, media, and ofcourse local communities.
Tiwari (2012) proceeded to conduct researchto examine the different types and benefitsof tourism co-exist for the optimumutilization of resources, to determine the keystrategies are required for the growth ofIndian tourism and finally to explore thechallenges and prospects in Indian tourismsector. The study came up with theconclusion that there exists a large numberof benefits in tourism industries but thatbenefits are being hindered by the problemsthat exist in the sector. So a collaborativeeffort on the part of public, governmentauthorities, NGOs and local community caneffectively remove those challenges.
Patel (2012) undertook a research to tracethe progress made by India's tourismindustry in the planning era, and theemerging issues under globalization and toexamine the problems and challenges of thecountry as well as the pitfalls in tourismplanning in India. The paper concludedthat though Indian tourism industry hadmade considerable progress it needs to bedeveloped further to rip the benefits of suchindustry in national interest. The industryis also subject to many issues andchallenges which need to be addressedproperly to ensure development of the
industry and which in return will contributetowards socio-economic development of thecountry.
Kakkar and Sapna (2012) conducted aresearch to examine the contribution ofIndian tourism sector to economic growthof the country. The study concluded thatIndian tourism is not only a majorcontributor to growth of economy but also amajor generator of employmentopportunities. With the forward andbackward linkage of this sector with othersectors like transportation, healthcare,education, hospitality, banking etc. India iswell equipped to reap full potential of thisvibrant sector.
Relevance
Tourism industry has various economic,social, psychological and environmentalimpacts on the society. When we considereconomic impact of the industry it is multi-dimensional in terms of its contributionboth directly and indirectly to GDP,Employment, foreign exchange reserve ofthe nation which are the key drivers ofeconomic growth and development. Sodevelopment of the nation can be achievedby developing tourism industry. Keeping inview the role played by the tourism industryin economic development of our nation, thissector has been included as crucial sectorin Make in India program. Government ofIndia has taken many policy measures forthe promotion of this sector but still therepersists some problems which hinder itsgrowth. At the same time manyopportunities are also available for theindustry which needs to be capitalized.
In the above backdrop this study aims atexploring the development and
Development and Impact of Tourism Industry in India

39
contribution of tourism industry toeconomy and employment of India andfinally to make a comparative analysis ofIndian tourism industries with world andAsia Pacific region.
Objectives
To analyze the economic contribution ofIndian tourism industry towardsdevelopment of the country
To make an international comparison ofdevelopment and contribution of theIndian tourism industry
To highlight the status of Indian tourismin world tourism
Research Methodology
Source of Data
The research paper is an attempt ofexploratory research, based on thesecondary data sourced from journals,magazines, articles, government portals,reports of World Travel and TourismCouncil and media reports.
Period of Study
This study covers the data set for a periodof 8 years. The 8 years data consists of 6year actual data from 2009 to 2014, 1 yearestimated data for the year 2015 and 1 yearforecasted data for the year 2025. All theestimations and forecasts are made byWorld Travel and Tourism Council.
Variables under Study
For analyzing the development andeconomic contribution of tourism industry
variables like Direct contribution to GDP,Total contribution to GDP, Directcontribution to Employment, Totalcontribution to Employment, VisitorsExports, Capital Investments, number ofForeign Tourist Arrival, Foreign ExchangeEarnings are taken into consideration.
Research Design
Looking into requirements of the objectivesof the study, the research design employedis of descriptive type. Trend analysistechnique has been applied for analyzingthe data. This research design is adopted tohave greater accuracy and in depth analysisof the research study.
Economic Contribution of Indian TourismIndustry
Tourism and hospitality industries havenow been taken a front seat in the economicdevelopment of our country and it hasgrowing potential to generate more wealthfor the nation. It contributes 6.8% of the GDPand it has been ranked 3rd as far as itscontribution to foreign exchange earningsis concerned. This paper aims at examiningthe economic contribution of IndianTourism industry in terms of its directcontribution to GDP, total contribution toGDP, direct contribution to employment,total contribution to employment, numberof foreign tourist arrivals and contributionto foreign exchange reserve. The summaryof estimates and forecasts are highlightedin table-1 to get an overview of the economiccontribution of the industry.
Dr. Rabindra Kumar Swain & Sri Maheswar Sethi

40
Direct Contribution to GDP
Direct contribution to GDP means GDPgenerated by industries that deal directlywith tourists, including hotels, travel agents,airlines and other passenger transportservices, as well as the activities ofrestaurant and leisure industries that dealdirectly with tourists. So the directcontribution of Travel & Tourism to GDPreflects the internal spending on Travel &Tourism (total spending within a particular
country on T&T by residents and non-residents for business and leisure purposes)as well as government 'individual'spending (spending by government onTravel & Tourism directly linked to visitors,such as cultural or recreational).
The direct contribution of Travel & Tourismto GDP is calculated as the differencebetween total internal Travel & Tourismspending within a country and thepurchases made by those industries(including imports).
The direct contribution of Travel & Tourismto GDP was INR 1777.79 bn in 20009 and itreached INR 2307.4 bn in 2013 registeringa growth of 5.42 % over last year. In 2014 itincreased to INR2, 478.21bn (2.2% of GDP).The data indicates an increasing trend in
the contribution to the GDP of country. Thisis forecasted to rise by 7.6% to INR 2,667.45bn in 2015.This primarily reflects theeconomic activity generated by industriessuch as hotels, travel agents, airlines andother passenger transportation services
Table-1
Summary of Actual, Estimates & Forecasts of Economic Contribution of Tourism in India
India 2014
INR bn (Actual)
2014 % of total GDP
2015 Growth
(Estimates)
2025 (Forecasts)
INR bn % of total Growth
Direct contribution to GDP 2478.21 2.18 7.63 5339.15 2.45 6.95 Total contribution to GDP 7642.47 6.74 7.52 16,587.2 7.61 6.85 Direct contribution to Employment 23,024.1 5.48 1.9 29,019.7 5.71 2.2 Total contribution to Employment 36,695.4 6.74 1.8 45,566.00 9.0 2.0 Visitor export 1,224.4 4.11 5.16 2377.17 4.15 6.46 Capital investment 2,107.18 6.22 9.26 4337.75 6.9 6.14
Source-Report of World Travel and Tourism Council on Economic Impact of Tourism in India, 2015
Table-2
Direct Contribution Tourism to GDP
Direct Contribution to GDP 2009 2010 2011 2012 2013 2014 2015 (E) 2025 (F)
INR bn 1777.79 1898.62 2040.54 2188.66 2307.4 2478.21 2667.45 5339.15
% of GDP 2.11861 2.07382 2.06925 2.11436 2.14016 2.18637 2.20657 2.45089
% Growth 1.83273 6.79686 7.47454 7.25911 5.42537 7.40263 7.63615 6.95113
Source-Report of World Travel and Tourism Council on Economic Impact of Tourism in India, 2015
Development and Impact of Tourism Industry in India

41
(excluding commuter services). But it alsoincludes, for example, the activities of therestaurant and leisure industries directlysupported. The direct contribution of Travel& Tourism to GDP is expected to grow by7.2% pa to INR 5,339.2 bn (2.5% of GDP) by2025.
The Total Contribution to GDP
The total contribution of Travel & Tourismincludes its wider impacts on the economy.The indirect contribution includes the GDPand jobs supported by Travel & Tourism
investment spending (such as purchase ofnew aircraft and construction of newhotels), Government collective spending(such as tourism marketing & promotion,aviation, administration, security servicesetc.) and Domestic purchases of goods andservices by the sectors dealing directly withtourists (including purchases of food andcleaning services by hotels, of fuel andcatering services by airlines and IT servicesby travel agents). The total contribution toGDP has been highlighted in table-3.
The total contribution of Travel & Tourismto GDP (including wider effects frominvestment, the supply chain and inducedincome impacts) was INR 5860.06 bn in2009 and it increased to INR7,642.5bn in2014 (6.7% of GDP) and is expected to growby 7.5% to INR8,218.0bn (6.8% of GDP) in2015. It is forecasted to rise by 7.3% pa toINR16, 587.2bn by 2025 (7.6% of GDP).
Though in 2009 there was a negative growthbut again it started increasing and toucheda maximum growth of 7.2% in the year 2014.
Direct Contribution to Employment
Direct contribution to employment refers tothe number of direct jobs created withinTravel & Tourism sector.
Table-3
Total Contribution of Tourism to GDP
Total Contribution to GDP 2009 2010 2011 2012 2013 2014 2015 (E) 2025 (F)
INR bn 5860.06 6125.73 6361.66 6776.31 7124.63 7642.47 8217.95 16587.2
Percentage of GDP 6.98349 6.69099 6.45118 6.54626 6.60824 6.74247 6.79804 7.61423
Percentage Growth -1.98499 4.53362 3.85146 6.51788 5.14032 7.26835 7.52991 6.85692
Source-Report of World Travel and Tourism Council on Economic Impact of Tourism in India, 2015
Table-4
Direct Contribution of Tourism to EmploymentDirect contribution to
Employment 2009 2010 2011 2012 2013 2014 2015 (E)
2025 (F)
Thousands of job 22495.9 21717.9 22045.7 22202.6 22471.2 23024.1 23455.3 29019.7
Percentage of Employment 5.5898 5.54849 5.52587 5.46663 5.44311 5.48262 5.48722 5.71586
Source-Report of World Travel and Tourism Council on Economic Impact of Tourism in India, 2015
Dr. Rabindra Kumar Swain & Sri Maheswar Sethi

42
The above table shows that Travel &Tourism generated 23,024.1 jobs directly in2014 (5.5% of total employment) and this isforecasted to grow by 1.9% in 2015 to23,455,500 (5.5% of total employment). Thisincludes employment by hotels, travelagents, airlines and other passengertransportation services (excludingcommuter services). It also includes, forexample, the activities of the restaurant andleisure industries directly supported bytourists. By 2025, Travel & Tourism will
account for 29,019.7 jobs directly, anincrease of 2.2% pa over the next ten years.
Total Contribution to Employment
It consists of the number of jobs generateddirectly in the Travel & Tourism sector plusthe indirect and induced contributions.Induced contribution includes no ofpersons indirectly employed inaccommodation, passenger transport,restaurants, providing leisure facilities forspecific tourism use etc.
Table-5 shows that the total contribution ofTravel & Tourism to employment (includingwider effects from investment, the supplychain and induced income impacts) was36,695,500 jobs in 2014 (8.7% of totalemployment). This is forecasted to increaseby 1.8% in 2015 to 37,365,000 jobs (8.7% oftotal employment). By 2025, Travel &Tourism forecasted to support 45,566,000jobs (9.0% of total employment), an increaseof 2.0% pa over the period.
Visitor Exports
Visitor exports means spending within thecountry by international tourists for bothbusiness and leisure trips, includingspending on transport, but excludinginternational spending on education.Money spent by foreign visitors to a country(or visitor exports) is a key component ofthe direct contribution of Travel & Tourism.
Table-6
Visitors Export
Visitor Exports 2009 2010 2011 2012 2013 2014 2015(E) 2025(F)
INR bn 817.083 907.579 1024.68 1092.44 1149.79 1224.4 1287.69 2377.17
Percentage of Export 4.51356 4.37977 4.12203 4.0409 4.02364 4.11153 4.07108 4.15723
Percentage of Growth -0.4717 11.0761 12.9021 6.6128 5.2504 6.48893 5.16879 6.46956
Source-Report of World Travel and Tourism Council on Economic Impact of Tourism in India, 2015
Table-5
Total Contribution of Tourism to Employment
Total contribution to Employment 2009 2010 2011 2012 2013 2014 2015
(E) 2025 (F)
Thousands of jobs 34666.9 33930.6 34853.5 35254.9 35736.4 36695.4 37365.0 45566.0
Percentage of Employment 6.98349 6.69099 6.45118 6.54626 6.60824 6.74247 6.79804 7.61423
Source-Report of World Travel and Tourism Council on Economic Impact of Tourism in India, 2015
Development and Impact of Tourism Industry in India

43
In 2014, India generated INR1,224.4 bn fromvisitor exports. In 2015, this is expected togrow by 5.2%, and the country is expectedto attract 7,757,000 international touristarrivals. By 2025, international touristarrivals are forecasted to total 15,291,000,generating expenditure of INR2,377.2 bn,an increase of 6.4% pa.
Capital Investment
Capital investment includes capitalinvestment spending by all industriesdirectly involved in Travel & Tourism. Thisalso constitutes investment spending byother industries on specific tourism assetssuch as new visitor accommodation andpassenger transport equipment, as well asrestaurants and leisure facilities for specifictourism use.
Travel & Tourism have attracted capitalinvestment of INR2,107.2 bn in 2014. Thisis expected to rise by 9.3% in 2015, and riseby 6.5% pa over the next ten years toINR4,337.8bn in 2025. Travel & Tourism's
share of total national investment will risefrom 6.6% in 2015 to 6.9% in 2025.
Foreign Tourist Arrivals and ForeignExchange Earnings
Table-8
Foreign Tourist Arrival
Foreign Tourist Arrivals (FTAs) and Foreign Exchange Earnings (FEE) from Tourism in India during 2014 and comparative figures of 2013 and 2012.
Year Percentage of Change
2012 2013 2014 2013/12 2014/13
Foreign Tourist Arrivals (Nos.) 65,77,745 69,67,601 76,79,099 5.9 10.2 Foreign Exchange Earnings (in Rs. Crore) 94,487 1,07,671 1,23,320 14.0 14.5
Foreign Exchange Earnings (in US$ mn) 17.737 18.445 20.236 4.0 9.7
Source-Report of World Travel and Tourism Council on Economic Impact of Tourism in India, 2015
Table-7
Capital Investment
Capital Investment 2009 2010 2011 2012 2013 2014 2015(E) 2025(F)
INR bn 1637.83 1742.47 1875.62 1984.61 2034.58 2107.18 2302.38 4337.75
Percentage of Export 5.89306 5.66847 5.60786 5.85438 6.03764 6.22119 6.61089 6.90543
Percentage of Growth -30.4891 6.38882 7.64142 5.81096 2.51803 3.56851 9.26317 6.14862
Source-Report of World Travel and Tourism Council on Economic Impact of Tourism in India, 2015
Dr. Rabindra Kumar Swain & Sri Maheswar Sethi
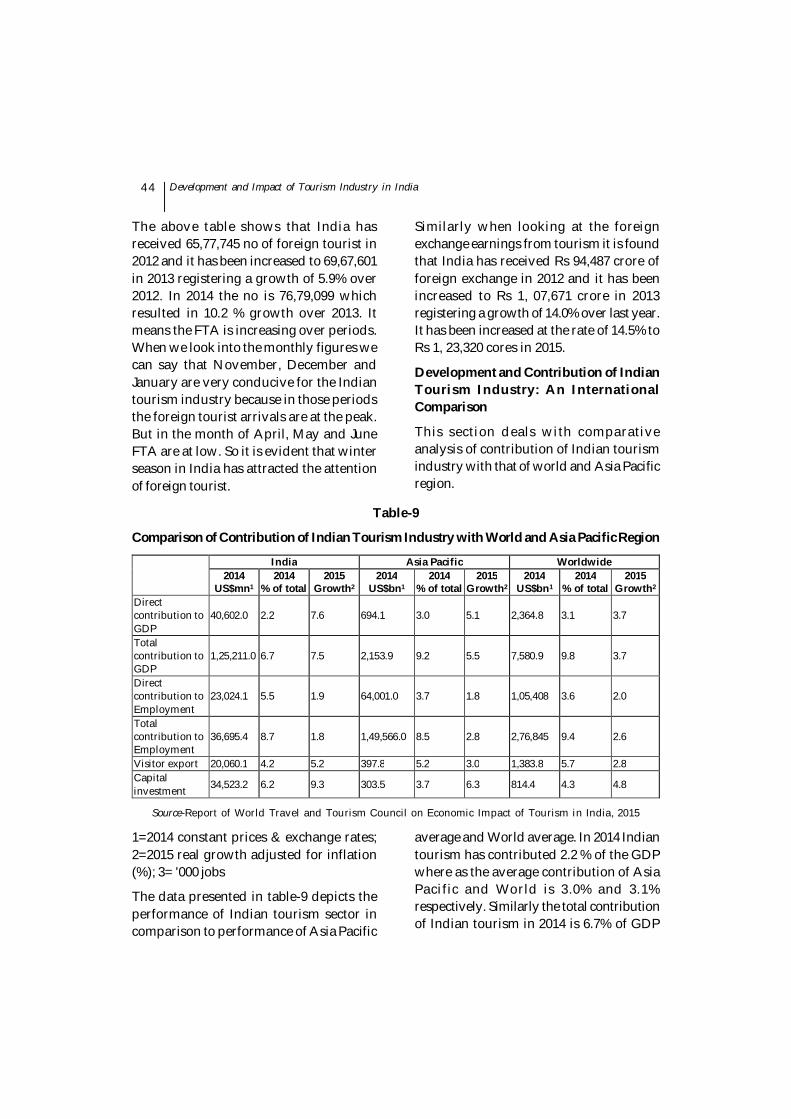
44
The above table shows that India hasreceived 65,77,745 no of foreign tourist in2012 and it has been increased to 69,67,601in 2013 registering a growth of 5.9% over2012. In 2014 the no is 76,79,099 whichresulted in 10.2 % growth over 2013. Itmeans the FTA is increasing over periods.When we look into the monthly figures wecan say that November, December andJanuary are very conducive for the Indiantourism industry because in those periodsthe foreign tourist arrivals are at the peak.But in the month of April, May and JuneFTA are at low. So it is evident that winterseason in India has attracted the attentionof foreign tourist.
Similarly when looking at the foreignexchange earnings from tourism it is foundthat India has received Rs 94,487 crore offoreign exchange in 2012 and it has beenincreased to Rs 1, 07,671 crore in 2013registering a growth of 14.0% over last year.It has been increased at the rate of 14.5% toRs 1, 23,320 cores in 2015.
Development and Contribution of IndianTourism Industry: An InternationalComparison
This section deals with comparativeanalysis of contribution of Indian tourismindustry with that of world and Asia Pacificregion.
Table-9
Comparison of Contribution of Indian Tourism Industry with World and Asia Pacific Region
India Asia Pacific Worldwide
2014 US$mn1
2014 % of total
2015 Growth2
2014 US$bn1
2014 % of total
2015 Growth2
2014 US$bn1
2014 % of total
2015 Growth2
Direct contribution to GDP
40,602.0 2.2 7.6 694.1 3.0 5.1 2,364.8 3.1 3.7
Total contribution to GDP
1,25,211.0 6.7 7.5 2,153.9 9.2 5.5 7,580.9 9.8 3.7
Direct contribution to Employment
23,024.1 5.5 1.9 64,001.0 3.7 1.8 1,05,408 3.6 2.0
Total contribution to Employment
36,695.4 8.7 1.8 1,49,566.0 8.5 2.8 2,76,845 9.4 2.6
Visitor export 20,060.1 4.2 5.2 397.8 5.2 3.0 1,383.8 5.7 2.8 Capital investment 34,523.2 6.2 9.3 303.5 3.7 6.3 814.4 4.3 4.8
Source-Report of World Travel and Tourism Council on Economic Impact of Tourism in India, 2015
1=2014 constant prices & exchange rates;2=2015 real growth adjusted for inflation(%); 3= '000 jobs
The data presented in table-9 depicts theperformance of Indian tourism sector incomparison to performance of Asia Pacific
average and World average. In 2014 Indiantourism has contributed 2.2 % of the GDPwhere as the average contribution of AsiaPacific and World is 3.0% and 3.1%respectively. Similarly the total contributionof Indian tourism in 2014 is 6.7% of GDP
Development and Impact of Tourism Industry in India

45
which is much less than the Asia PacificAverage (9.2%) and World average (9.8%)and it is expected to grow at higher rate(7.5%) than the Asia Pacific average (5.5%)and world average (3.7%) in 2015. As far asthe direct contribution to employment isconcerned in 2014, India with 5.5%contribution to the total employment of theeconomy has outperformed the Asia Pacific(3.7%) and world average (3.6%) and rakedat 3rd position after Cambodia (11.7%) andThailand (5.8%) in Asia pacific region. Incase of total contribution to employment, in2014 Indian tourism has generated a total
of 36695.4 thousands of jobs which is 8.7%of total employment generated in India ,though India (8.7%) in 2014 has contributedat higher rate than the Asia Pacific average(8.5%) but lagged behind the world average(9.4%). In 2014 India could not perform wellin attracting foreign visitors and it hasreceived foreign visitors spending of20,060.1 US$mn comprising 4.2% of theGDP where as the Asia Pacific and worldaverage stood at 5.2% and 5.7% respectively.The investment in tourism in 2014 is34,523.2 US$mn comprising 6.2% of the totalcapital investment of the country.
Table-10
Comparison of International Tourist Arrivals in India, World and Asia & the-Pacific RegionShare of India in International Tourist Arrivals (ITAs) in World and Asia & the-Pacific Region,1998-2014
Year
International Tourist Arrivals (in millions) FTAs in India
(in millions)
Percentage (%) share and rank of India in World
Percentage (%) share and rank of India in Asia and the Pacific
World Asia and the Pacific % Share Rank % Share Rank
1998 611.0 88.3 2.36 0.39 47th 2.67 --- 1999 633.8 97.6 2.48 0.39 46th 2.54 --- 2000 683.3 109.3 2.65 0.39 50th 2.42 11th 2001 683.4 114.5 2.54 0.37 51th 2.22 12th 2002 703.2 123.4 2.38 0.34 54th 1.93 12th 2003 691.0 111.9 2.73 0.39 51th 2.44 11th 2004 762.0 143.4 3.46 0.45 44th 2.41 11th 2005 803.4 154.6 3.92 0.49 43th 2.53 11th 2006 846.0 166.0 4.45 0.53 44th 2.68 11th 2007 894.0 182.0 5.08 0.57 41th 2.79 11th 2008 917.0 184.1 5.28 0.58 41th 2.87 11th 2009 883.0 181.1 5.17 0.59 41th 2.85 11th 2010 948.0 204.9 5.78 0.61 42th 2.82 11th 2011 995.0 218.5 6.31 0.63 38th 2.89 9th 2012 1035.0 233.5 6.58 0.64 41th 2.82 11th 2013 1087.0 249.8 6.97 0.64 42th 2.79 11th 2014 1135.0 (P) 263.4 (P) 7.68 0.68 41th 2.92 12th P: Provisional Source: (i) UNWTO Tourism Market Trends 2007 Edition, for the years upto 2005 (ii) UNWTO Barometer June 2009 for 2006 & 2007 (iii) UNWTO Tourism Highlights 2011 Edition for 2008 and 2012 Edition for 2009 (iv) UNWTO Barometer April 2014 for 2011 , 2012 & 2013 Source-Report of World Travel and Tourism Council on Economic Impact of Tourism in India, 2015
Dr. Rabindra Kumar Swain & Sri Maheswar Sethi
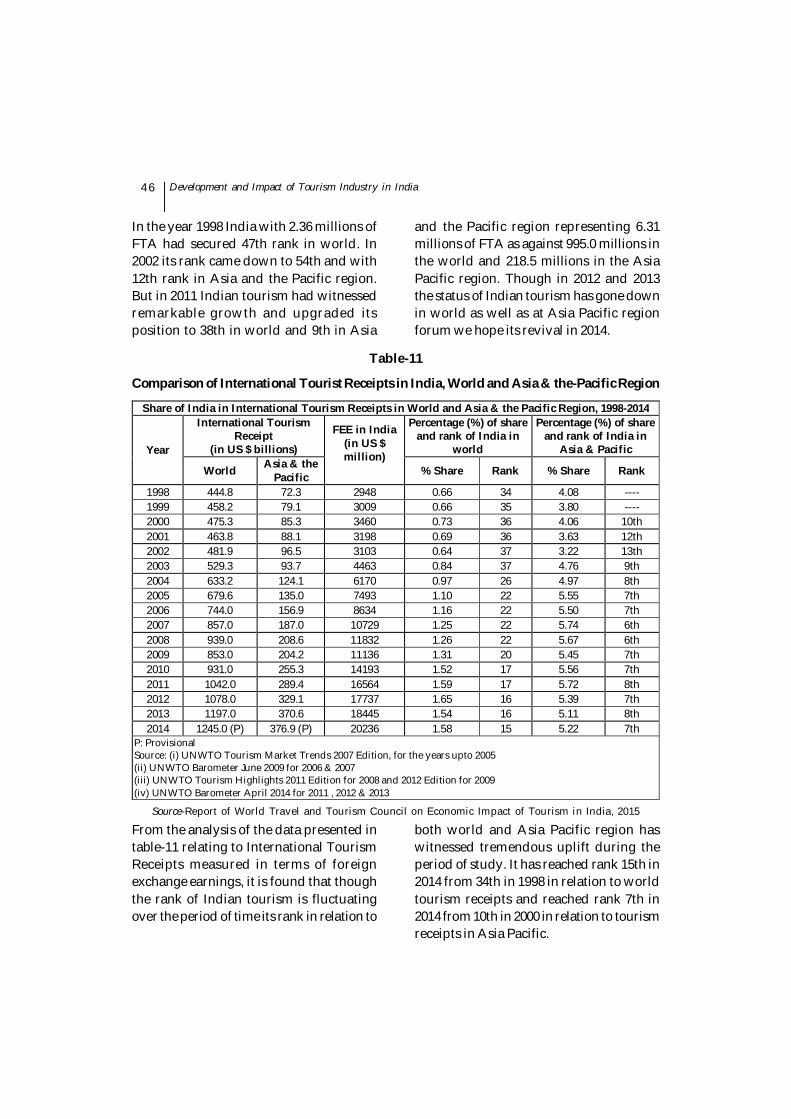
46
In the year 1998 India with 2.36 millions ofFTA had secured 47th rank in world. In2002 its rank came down to 54th and with12th rank in Asia and the Pacific region.But in 2011 Indian tourism had witnessedremarkable growth and upgraded itsposition to 38th in world and 9th in Asia
and the Pacific region representing 6.31millions of FTA as against 995.0 millions inthe world and 218.5 millions in the AsiaPacific region. Though in 2012 and 2013the status of Indian tourism has gone downin world as well as at Asia Pacific regionforum we hope its revival in 2014.
Table-11
Comparison of International Tourist Receipts in India, World and Asia & the-Pacific Region
Share of India in International Tourism Receipts in World and Asia & the Pacific Region, 1998-2014
Year
International Tourism Receipt
(in US $ billions)
FEE in India (in US $ million)
Percentage (%) of share and rank of India in
world
Percentage (%) of share and rank of India in
Asia & Pacific
World Asia & the Pacific % Share Rank % Share Rank
1998 444.8 72.3 2948 0.66 34 4.08 ---- 1999 458.2 79.1 3009 0.66 35 3.80 ---- 2000 475.3 85.3 3460 0.73 36 4.06 10th 2001 463.8 88.1 3198 0.69 36 3.63 12th 2002 481.9 96.5 3103 0.64 37 3.22 13th 2003 529.3 93.7 4463 0.84 37 4.76 9th 2004 633.2 124.1 6170 0.97 26 4.97 8th 2005 679.6 135.0 7493 1.10 22 5.55 7th 2006 744.0 156.9 8634 1.16 22 5.50 7th 2007 857.0 187.0 10729 1.25 22 5.74 6th 2008 939.0 208.6 11832 1.26 22 5.67 6th 2009 853.0 204.2 11136 1.31 20 5.45 7th 2010 931.0 255.3 14193 1.52 17 5.56 7th 2011 1042.0 289.4 16564 1.59 17 5.72 8th 2012 1078.0 329.1 17737 1.65 16 5.39 7th 2013 1197.0 370.6 18445 1.54 16 5.11 8th 2014 1245.0 (P) 376.9 (P) 20236 1.58 15 5.22 7th
P: Provisional Source: (i) UNWTO Tourism Market Trends 2007 Edition, for the years upto 2005 (ii) UNWTO Barometer June 2009 for 2006 & 2007 (iii) UNWTO Tourism Highlights 2011 Edition for 2008 and 2012 Edition for 2009 (iv) UNWTO Barometer April 2014 for 2011 , 2012 & 2013 Source-Report of World Travel and Tourism Council on Economic Impact of Tourism in India, 2015
From the analysis of the data presented intable-11 relating to International TourismReceipts measured in terms of foreignexchange earnings, it is found that thoughthe rank of Indian tourism is fluctuatingover the period of time its rank in relation to
both world and Asia Pacific region haswitnessed tremendous uplift during theperiod of study. It has reached rank 15th in2014 from 34th in 1998 in relation to worldtourism receipts and reached rank 7th in2014 from 10th in 2000 in relation to tourismreceipts in Asia Pacific.
Development and Impact of Tourism Industry in India

47
Table-12
Comparison of International Tourist Arrivals in India and Top 10 Countries of the WorldShare of Top 10 Countries of the World and India in International Tourist Arrivals in 2014
Rank Country International Tourist Arrival (P) (in millions) Percentage (%) of share
1 France 83.7 7.37 2 USA 74.7 6.58 3 Spain 65.0 5.73 4 China 55.6 4.90 5 Italy 48.6 4.28 6 Turkey 39.8 3.51 7 Germany 33.0 2.91 8 United Kingdom @ ----- ------ 9 Russian Federation 29.8 2.63 10 Mexico 29.1 2.56
Total of Top 10 countries 459.3 40.47 India # 7.68 0.68 Others 668.0 58.85 Total 1135.0 100.00 P): Provisional. @. Figure not available, Rank estimated on the basis of 2014 figures. # Excludes nationals of the country residing abroad. Source: UNWTO Barometer April 2014 and Bureau of Immigration (BOI) Source-Report of World Travel and Tourism Council on Economic Impact of Tourism in India, 2015
The data relating to tourists arrival in 2014shows that India received 7.68 millions ofinternational tourists as against the worldtotal of 1135.0 million and against 459.3
millions of the total of top 10 countries ofthe world. But the position of Indian tourismis not satisfactory when it is analyzed inglobal scale.
Dr. Rabindra Kumar Swain & Sri Maheswar Sethi
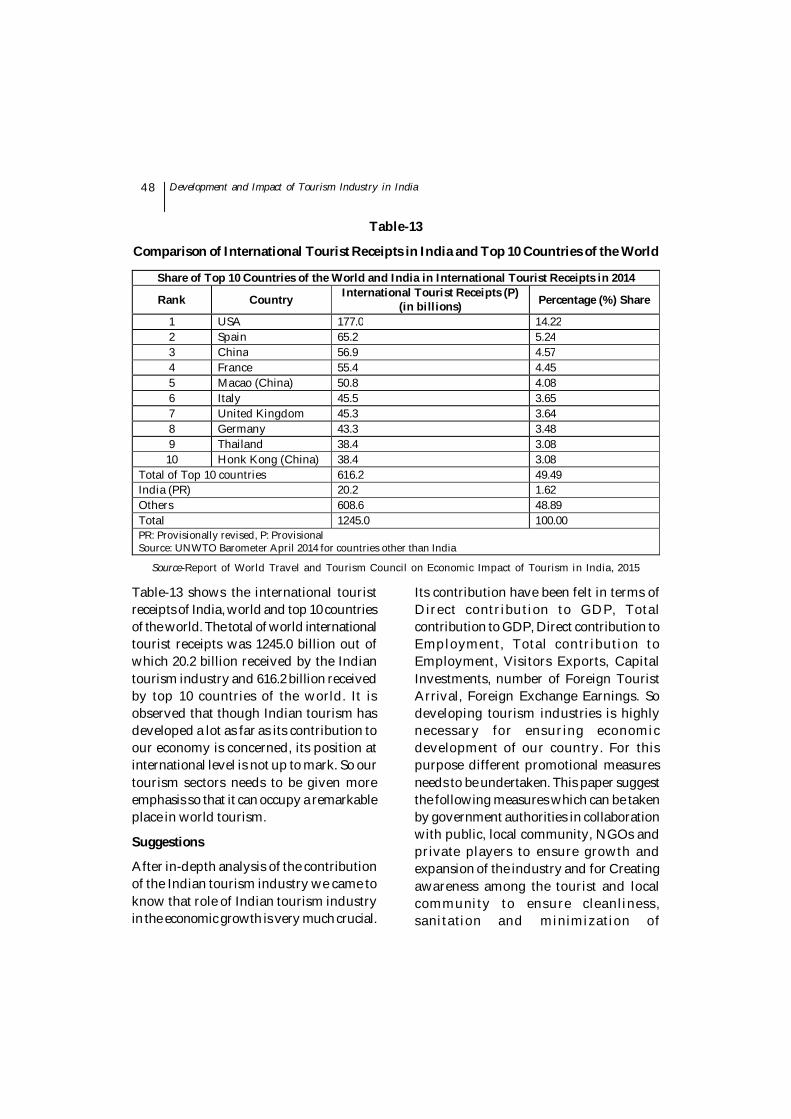
48
Table-13
Comparison of International Tourist Receipts in India and Top 10 Countries of the World
Share of Top 10 Countries of the World and India in International Tourist Receipts in 2014
Rank Country International Tourist Receipts (P) (in billions) Percentage (%) Share
1 USA 177.0 14.22 2 Spain 65.2 5.24 3 China 56.9 4.57 4 France 55.4 4.45 5 Macao (China) 50.8 4.08 6 Italy 45.5 3.65 7 United Kingdom 45.3 3.64 8 Germany 43.3 3.48 9 Thailand 38.4 3.08 10 Honk Kong (China) 38.4 3.08
Total of Top 10 countries 616.2 49.49 India (PR) 20.2 1.62 Others 608.6 48.89 Total 1245.0 100.00 PR: Provisionally revised, P: Provisional Source: UNWTO Barometer April 2014 for countries other than India
Source-Report of World Travel and Tourism Council on Economic Impact of Tourism in India, 2015
Table-13 shows the international touristreceipts of India, world and top 10 countriesof the world. The total of world internationaltourist receipts was 1245.0 billion out ofwhich 20.2 billion received by the Indiantourism industry and 616.2 billion receivedby top 10 countries of the world. It isobserved that though Indian tourism hasdeveloped a lot as far as its contribution toour economy is concerned, its position atinternational level is not up to mark. So ourtourism sectors needs to be given moreemphasis so that it can occupy a remarkableplace in world tourism.
Suggestions
After in-depth analysis of the contributionof the Indian tourism industry we came toknow that role of Indian tourism industryin the economic growth is very much crucial.
Its contribution have been felt in terms ofDirect contribution to GDP, Totalcontribution to GDP, Direct contribution toEmployment, Total contribution toEmployment, Visitors Exports, CapitalInvestments, number of Foreign TouristArrival, Foreign Exchange Earnings. Sodeveloping tourism industries is highlynecessary for ensuring economicdevelopment of our country. For thispurpose different promotional measuresneeds to be undertaken. This paper suggestthe following measures which can be takenby government authorities in collaborationwith public, local community, NGOs andprivate players to ensure growth andexpansion of the industry and for Creatingawareness among the tourist and localcommunity to ensure cleanliness,sanitation and minimization of
Development and Impact of Tourism Industry in India

49
environmental pollutions at the tourist placewhich will lead to growth of tourism.
Upgrading, developing, andmaintaining a multi-modal transportsystem of surface (road and rail), marine,and air transport that is friendly to theenvironment.
Educating and sensitizing individuals,public & private institutions to identify,understand value, protect, and developthe national cultural heritage.
Encouraging local communityinvolvement through awarenessprogrames in development,preservation, protection andmaintenance of tourist destinations.
Developing human resource throughtraining to meet the industry demandand to ensure quality of services.
Promoting tourism through extensiveadvertisement & publicity in print,electronic and social Medias.
Hosting international events in thecountry to attract more tourists fromabroad.
Ensuring infrastructural developmentthrough public private partnership.
Making provision to ensure security atthe tourist destinations.
Promoting hospitality facilities at thetourist place.
Establish a favorable fiscal, legal, andregulatory framework in order to attractfinance. Like providing fiscal incentiveslike tax exemptions, subsidies, interestfree loans to private players to motivatethem to invest capital in this sector.
Development of local transportations.
Identifying and setting aside specificareas for tourism development andinvestment in collaboration with therelevant land authorities.
Developing environmental impactassessment (EIA) guidelines and ensurethat EIA is carried out and strictlyadhered to in all tourism developmentprojects.
For bringing transparency andcredibility in the tourism scenario andensuring speedy delivery of informationas well as services to foreign tourists,digital technology must be implementedin the sector.
CONCLUSION
Form the above discussion it is revealed thattourism in India has made remarkablegrowth in last two decades and now it hasbecame one of the key drivers of economicdevelopment among the service sectors. Ithas contributed immensely to generation ofemployment, earning of foreign exchangeand socio-economic development of thelocal and host communities. Growth oftourism has also contributed to growth ofmany sectors like transport, hospitality,banking, education, health etc. So forfostering economic growth, capitalizing thepotential of tourism industries is highlynecessary now-a-days. But this industry issubjects to many problems which hinder itsgrowth. These bottlenecks need to be weedout with collaborative efforts of governmentand private players in the industry to reapfull benefits of the sectors.
Dr. Rabindra Kumar Swain & Sri Maheswar Sethi

50
REFERENCESGupta. R. (2015) "Tourism, FDI and Inclusive
Growth in India", Pacific BusinessReview International, Vol. 7(12), pp.108-114.
Sharma. A., Sharma. A and Kukreja. S. (2012)"Economic Contribution of TourismIndustry Towards Society",International Journal of Scientific &Engineering Research, Vol.3, Issue .10,October-2012.
Mishra. M., Padhi. P. K. "Emergence of Tourismin the Sustainable Growth of India: AnEmpirical Analysis", ABHINAV, vol.1(8), pp. 161-167.
Tiwari. M. (2012) "Making of Indian Tourismin 21st Century: Challenges andProspects", International Journal ofPhysical and Social Sciences, vol-2 (5),pp-309-322.
Patel. R. (2012) "India's Tourism Industry -Progress and Emerging Issues", ArthPrabandh: A Journal of Economics andManagement, Vol.1 (5), August-2012.
Bhatia, A. K., Internatioal Tourism-Fundamentals and Practices, Page No.2-5, Edition-2006, Published by SterlingPublishers Pvt. Ltd.
Mathur, Arpita, Fundamentals of Travel andTourism, Page No. 113-115, Edition-2011, Published by Ane Books Pvt. Ltd.
Report of World Travel and Tourism Councilon Economic Impact of Tourism inIndia, 2015.
UNWTO Tourism Highlights 2014 Edition.Report of Ministry of Tourism, Govt. of India
2014-15. At www.tourism.gov.in.www.India.gov.inINDIA-opportunity ? A guide to do business
in India.Indian Tourism and Development
Corporation.
Development and Impact of Tourism Industry in India

SUSTAINABILITY REPORTING PRACTICES :A COMPARATIVE INDO- USA ANALYSIS
Biswo Ranjan Mishra*Sabat Kumar Digal**
INTRODUCTION
Sustainability Reporting involves themeasurement, management and reportingof economic, environmental and socialperformance indicators in a single reportwhich creates long term shareholder value.Over the past few years, an increased numberof companies have prepared such reports.Although sustainability reporting is still avoluntary activity in most of the countries,for some countries it is mandatory. Forexample, France became the first country torequire publicly traded companies to reporttheir social and environmental issues inMay 2001. The United Kingdom andDenmark require mandatory sustainabilityreporting for some companies and Canada
and the United States require publiclytraded companies to report onenvironmental liabilities and other socialand environmental issues that areconsidered "material" to their shareholders.
LITERATURE REVIEW
A number of empirical studies have beenundertaken to investigate the extent andnature of corporate sustainable disclosure(CSD) practices in different countries.
Hughes (2001) examined environmentaldisclosures made by 51 US manufacturingfirms for1992 and 1993. Again, the authorsused a slightly modified Wiseman index tomeasure environmental disclosures madewithin the President's letter, MD&A, and
ABSTRACTThis study analyses the level of corporate sustainability reporting practices of 100 largest companiescomprising 50 each from India and USA in 10 selected sectors for three years (2012 to 2014).Based oncontent analysis method, the study examined the sustainability reports of sample companies usingUNEP benchmarking tool. In the study a comparative analysis of corporate sustainable reportingscores (CSRS) between two countries has been made. The study also investigates the level of corporatesustainability reporting practices among manufacturing and services sectors in India and USA. Bothparametric and non-parametric significant tests are used to ascertain the degree of comprehensivenessof sustainability reporting practices and if there is significant difference between the two countries.Results from the analysis show that there exists a significant difference in the level of corporatesustainability reporting practices between the two countries. The paper concludes that sustainabledisclosure practices in India is found to have of lower level as compared to USA during the period of thestudy.
Key Words : Sustainability Reporting, Triple Bottom Line, Content Analysis
*Lecturer, P. G. Department of Commerce (DDCE), Utkal University, Bhubaneswar, Odisha**Lecturer, P.G. Department of Commerce, Utkal University, Bhubaneswar, Odisha
The Utkal Business ReviewDecember, 2015, Vol - XXIX, pp.-51-62

52
note section, and then assessed whetherenvironmental disclosures are consistentwith environmental performance ratings(good, mixed, and poor) by the CEP.Although the study found no difference inenvironmental disclosures between goodand mixed groups, firms rated as poorenvironmental performers by the CEP tendto make substantially more environmentaldisclosures under the Wiseman disclosureindex.
Kolk (2001) investigated the national andsector influences on the volume ofsustainability reporting. Expectations in hisresults state that besides regulation, socialcontext is expected to play a role. He sawthe need for future research into the effect ofsocial context on sustainability reporting.
Sujit (2007) conducted a study andexamined the environmental disclosurepractices of top 50 Indian private sectorcompanies spread over 14 industrysegments. The performances of thesecompanies have been evaluated against the20 core environmental indicatorsrecommended by UNEP/Sustainability.The major findings of the paper are thatthere are fewer examples of corporatesustainability reporting or triple bottom linereporting in India. Not only are those, a vastmajority of the Indian companies failing todemonstrate their social and environmentalaccountabilities in a real, meaningfulreporting.
Chen and Bouvain, (2009) found thatsustainability reporting practices aresignificantly different among companies inthe U.S., U.K., Australia and Germany,suggesting that the country of origin mattersin sustainability reporting.
Dutta Sumanta., (2012) has worked on"Triple Bottom Line Reporting: An IndianPerspective" The main objective of the studyhas been made an attempt to highlight howthe TBLR implementation is taking place inwith special reference GRI initiative.Corporate Sustainability is of utmostimportant for the survival of organizationsand their future generations' stakeholders.Hence, Triple Bottom Line Reporting (TBLR)is considered to be a sine qua non forcorporate growth on a sustained basis.Triple Bottom Line Reporting (TBLR) goesbeyond the traditional way of reportingmechanism and encourages businesses togive closer attention to the whole impact oftheir commercial activities, over & abovetheir financial performance.
From the literature review it is found thatfew studies have taken an explicit cross-industry approach in sustainabilityreporting. Again a comparative analysis ofIndian companies' sustainability reportingpractices visa vies USA companies is notmade.
OBJECTIVES OF THE STUDY
The objective of the paper is :
To understand the theoretical concepts,purpose and driving forces forsustainability reporting, and
To compare sustainability reportingpractices between India and the USA.
HYPOTHESIS
In order to achieve the objectives of thisstudy, the following hypotheses are statedin the null form:
Ho1.01: There is no significant differencein the average corporate sustainable
Sustainability Reporting Practices : A Comparative Indo- USA Analysis
53
reporting scores for companies in India andthe USA.
Ho1.02: There is no significant differencein the average corporate sustainablereporting scores for manufacturing sectorin India and the USA.
Ho1.03: There is no significant differencein the average corporate sustainablereporting scores for service sector in Indiaand the USA.
RESEARCH METHODOLOGY
The present study adopts the followingmethodology:
Sources of Data
The study is based on the secondary dataobtained from the company websites andsustainability reports for the period 2012 to2014.
Sample Design
As discussed earlier, data are collected fortwo countries namely: USA and India. Tensectors have been selected from eachcountry. The selected business sectors aregrouped into two broad categories i.e.manufacturing sector and services sector.Out of 10 selected business sectors, sevenfalls in manufacturing category namely,automobiles & parts, chemicals,construction & building materials, mining,
oil & gas, pharmaceuticals & bio-technologyand steel & other metals. The three servicessectors are banking, software & computerservices and telecommunication.
For the present study, from each businesssector 5 top listed companies' sustainabilityreports have been selected (Based on FT-500USA Companies list & ET-500 IndianCompanies list) Hence; the sample consistsexclusively of 100 large corporations.
Sampling Unit
Sampling unit for this study is one company.All companies are public companies listedin their home country.
Period of the Study
For the present study, the samples arecollected for the period of 2012, 2013 and2014.
Research Tool
To analyze the content of the TBL reports,benchmark tool developed by UNEP /SustainAbility have been used. Thebenchmark tool comprises 50 reportingitems, grouped under the five sections of(1) Management Policies and Systems, (2)An Input/output Inventory, (3) Finance, (4)Stakeholder Relations and Partnerships,and (5) Sustainability Development.(Figure 1)
Biswo Ranjan Mishra & Sabat Kumar Digal

54
1. Management Policy and Systems 1. Top Management Statement 2. Environmental Policy 3. Environmental Management System 4. Responsibility & Accountability 5. Environmental Audit 6. Goals & Target 7. Legal Compliance 8. Research& Development 9. Awards 10. Verification 11. Reporting Policy 12. Corporate Context 2. Inputs / Outputs Inventory Inputs: 13. Material Use 14. Energy Consumption 15. Water Consumption 16. Clean Technology 17. Health & Safety 18. Accidents & Emergency Response 19. Risk Management & EIS 20. Land contamination &Remediation 21. Stewardship of Ecosystem Outputs: 22.Waste Minimization 23. Air Emission 24.Water Effluents 25. Noise &Odours 26.Transportation Products: 27. Life Cycle Design & Assessment 28. Environmental Impacts 29. Product Stewardship 30. Packaging 3. Finance 31. Environmental Spending 32. Environmental Liabilities 33. Market Solutions & Instruments 34. Environmental Cost Accounting 35. Charitable Contributions 4. Stakeholders Relation & Partnership 36. Employees 37. Legislators & Regulators 38. Local Communities 39. Investors 40. Suppliers & Contractors 41. Customers & Consumers 42. Industry Associations 43. Environment Groups 44. Science & Education 45. Media 5.Sustainable Development 46. Global Developmental Issues 47. Technology cooperation 48. Global Environment 49. Global Operating standards 50. Visions, Scenarios, Future Trends
Figure 1: UNEP/Sustainability "Engaging Stakeholders Survey Instrument 2006 Revised Version"
Source: UNEP/Sustainability (2006) Engaging Stakeholders
Sustainability Reporting Practices : A Comparative Indo- USA Analysis

55
The above 50 reporting items are scored ona scale of 0-4. This rating scale (shown inTable 1 below) is based on the principle thatthe more complete and comprehensive theinformation relating to a given reporting
item, the higher the score that it is given.Thus a score of 0 indicates that the elementis not reported while a score of 4 indicatescomprehensive coverage.
Table 1: UNEP/Sustainability Report Scoring Criteria
0 1 2 3 4
No coverage
Minimum coverage,
little detail
Detailed and honest, including
company shortcomings and
commitments
Commitment to and progress
towards sustainable
development in core business
Commitment to and progress towards ‘triple bottom line’ of
sustainable development in core business plus benchmarking
against competition and/or best practice in other sectors
Source: UNEP/Sustainability (2006) Engaging Stakeholders
Scoring Procedure
On the basis of the above four point scalean overall assessment of the corporatesustainability reporting practices of selectedcompanies have been done by developing asustainability reporting score (CSRS). Forthis purpose all the key area wise scoreshave been summed up and the total scoresrepresented the company's sustainabilityreporting scores (CSRS). It is considered thatall the key area information in the index isequally important to the average users. Thesustainability reporting score can be foundout with the help of following procedure:
Corporate Sustainability Reporting Score(CSRS) = SMPS + SIOI + SF + SSRP + SSD
Where,
SMPS = Total Scores for ManagementPolicy and Systems Variables
SIOI = Total Scores for Inputs / OutputsInventory Variables
SF = Total Scores for Finance Variables
SSRP = Total Scores Stakeholders Relation& Partnership Variables
SSD = Total Scores SustainableDevelopment Variables
Data Analysis Technique
The independent samples T- Test would beconducted using the SPSS-Grad Pack 17.0to determine if there is a significantdifference in the mean scores of the two caseindustries. For robustness sake, thehypothesis of no significant differencewould be further ascertained using theMann-Whitney U Test. The Mann-Whitneytest is the non-parametric alternative to theindependent T-test. It is used for assessingwhether one of two samples of independentobservations tends to have larger valuesthan the other. It is one of the most wellknown non-parametric significance testsknown for its robustness and its lowerlikelihood (than the T test) to spuriouslyindicate significance because of thepresence of outliers (Conover, 1981).
REFLECTION ON SAMPLE (DATADESCRIPTIVE)
The descriptive statistics of CSRS from 2012to 2014 for total sample is presented below.
Biswo Ranjan Mishra & Sabat Kumar Digal

56
Table 2 reflects the values of mean, median,standard deviation, maximum andminimum CSRS from 2012 to 2014 for USAand India. Results show that there is adifference between mean and standarddeviation of CSRS across the years. Thevalues of maximum, minimum and meanCSRS have increased steadily from the year2012 to 2014 for both India and USA.
FINDINGS OF THE STUDY
Considering the influence of country andindustry specific factors, the following threehypotheses have been tested.
Ho1.01: There is no significant differencein the average corporate sustainablereporting scores for companies in India andUSA.
Ha1.01: Significant difference exists in theaverage corporate sustainable reportingscores for companies in India and USA.
Table 2: Descriptive Statistics of CSRS from 2012 to 2014 for USA &India
Country Year Count Minimum Maximum Mean Median Std. Deviation USA 2012 50 56.00 115.00 84.68 83.50 14.16
2013 50 60.00 120.00 89.04 90.00 13.80 2014 50 63.00 125.00 93.96 95.00 13.81
INDIA 2012 50 40.00 95.00 60.94 60.00 15.47 2013 50 42.00 103.00 67.78 63.50 15.37 2014 50 47.00 108.00 72.88 71.00 15.51
Source: Author's own Computations
Table 3: Comparative CSRS-India and USA (T-Test and Mann Whitney Test)
Country Count Mean S.D t value Sig. (2-tailed)
U Sig. (2-tailed)
India 50 67.20 15.21 -7.580 .000 366.500 .000
USA 50 89.23 13.81 Source: SPSS Output (Author's own Computations) Independent sample t-test (equal variances assumed)
The result as indicated in Table 3 shows thatthat at = 0.05, 'p' i.e. level of significance =0.000 when 't' test is run and 0.000 whenMann Whitney test is run. Since p < , nullhypothesis of equality of means is rejected.Thus the null hypothesis of no difference inaverage corporate sustainable reportingscores for companies in India and USA is
rejected. The alternate hypothesis that thereis a significant difference in the averagecorporate sustainable reporting scores forcompanies in India and USA is accepted.
Ho1.02: There is no significant differencein the average corporate sustainablereporting scores for manufacturing sectorin India and USA.
Sustainability Reporting Practices : A Comparative Indo- USA Analysis

57
Table 4 shows that at = 0.05, 'p' i.e. level ofsignificance = 0.001 when't' test is run and0.000 when Mann Whitney test is run. Sincep < , null hypothesis of equality of meansis rejected. Thus the null hypothesis of nodifference in the average corporatesustainable reporting scores formanufacturing sector in India and USA isrejected. The alternate hypothesis that thereis a significant difference in the average
corporate sustainable reporting scores formanufacturing sector in India and USA isaccepted.
Ho1.03: There is no significant differencein the average corporate sustainablereporting scores for service sector in Indiaand USA.
Ha1.03: Significant difference exists in theaverage corporate sustainable reportingscores for service sector in India and USA.
Ha1.02: Significant difference exists in theaverage corporate sustainable reporting
scores for manufacturing sector in India andUSA.
Table 4 : Comparative CSRS-Manufacturing Sector in India and USA(T-Test and Mann Whitney Test)
Country Sector Count Mean S.D t value Sig. (2-tailed) U Sig.
(2-tailed) India Manu 35 66.04 13.45
-6.704 .000 164.500 .000 USA Manu 35 87.34 13.13
Source: SPSS Output Author's own Computations Independent sample t-test (equal variances assumed)
Table 5: Comparative CSRS-Service Sector in India and USA(T-Test and Mann Whitney Test)
Country Sector Count Mean S.D t value Sig. (2-tailed) U Sig.
(2-tailed) India Service 15 69.91 18.95
-3.818 .001 35.000 .001 USA Service 15 93.62 14.82
Source:SPSS Output (Author's own Computations) Independent sample t-test (equal variances assumed)
Table 5 shows that at ? = 0.05, 'p' i.e. level ofsignificance = 0.001 when't' test is run and0.001 when Mann Whitney test is run. Sincep < ?, null hypothesis of equality of meansis rejected. Thus the null hypothesis of nodifference in the average corporatesustainable reporting scores for servicesector in India and USA is rejected. Thealternate hypothesis that there is asignificant difference in the averagecorporate sustainable reporting scores for
service sector in India and USA is accepted.
LIMITATION OF THE STUDY
The study has two specific limitations: first,the assessment is limited to the top 100companies from selected countries i.e. USAand India. The findings may not necessarilybe representative of sustainability reportingpractices of small and medium sizedcompanies; and second, content analysismay have specific limitations.
Biswo Ranjan Mishra & Sabat Kumar Digal

58
CONCLUSION
Sustainability Reporting is a form of internalmonitoring, management and externalcommunication which enablesorganizations of all sizes to meet the growinginformation needs of their variousstakeholders, both internal and external. Thepaper found that there are no mandatoryrequirements for companies to undergosustainability report and their assurance. InIndia, typically, reporting beyond mandatoryrequirements is low. This study revealed thatIndia is found to have lower level ofsustainable disclosure practices as comparedto USA. Both Indian manufacturing sectorand services sector is found to have lowerlevel of sustainable disclosure practices ascompared to USA manufacturing andservices sector. Hence it concludes that USAis found to have higher level of sustainabilityreporting practices in comparison to India.Conclusively, this study recommends thatthe Financial Reporting Council and otherrelevant bodies in the standard settingprocess should draft a comprehensiveframework for sustainability reporting.Further, pro-activeness of all the stakeholderswill make sustainability reporting moremeaningful and useful.
REFERENCESDutta, Sumanta (2012) "Triple Bottom Line
Reporting: An Indian Perspective"Interdisciplinary Journal ofContemporary Research InBusinessapril 2012, vol.3, No 12
Guthrie, J & Parker, LD (1989), "Corporate socialreporting: A rebuttal of legitimacytheory", Accounting & Business Research,vol.19, no.76, pp343-352.
Gray, R. (2006), "Social, environmental andsustainability reporting andorganisational value creation? Whosevalue? Whose creation?" Accounting,
Auditing & Accountability Journal 19(6): 793-819.
Hughes, S. B., Anderson, A., & Golden, S. (2001),"Corporate environmental disclosures:Are they useful in determiningenvironmental performance?" Journal ofAccounting and Public Policy, 20, 217-240.doi:10.1016/S0278-4254(01)00031-X 249.
John Elkington, Cannibals With Forks: TheTriple. Bottom Line of 21st CenturyBusiness. Capstone,.Oxford, 1997, 402pp. ISBN 1-900961-27-X.
Kolk A. (1999). "Evaluating corporateenvironmental reporting". BusinessStrategy and the Environment 8: 225-237
Milne, M.J., Ball, A. & Gray, R. (2005), "Fromsoothing palliatives and towardsecological literacy: A critique on theTriple Bottom-line". InternationalConference on Social andEnvironmental Accounting Research, 30March-1April2005.
Morhardt, J. E., Baird, S., & Freeman, K. (2002),"Scoring corporate environmental andsustainability reports using GRI 2000,ISO 14031 and other criteria". CorporateSocial Responsibility andEnvironmental Management, 9, 215-233.
Ranganathan, J. (1998), Sustainability rulers:measuring corporate environmentaland social performance. SustainabilityEnterprise Perspective, May, 1-11.Washington, D.C.:World ResourceInstitute. Retrieved from www.igc.org/wri/meb/pdf/janet.pdf/.
Skouloudis, A., Evangelinos, K. andKourmousis, F., 2010, "Assessingnonfinancial reports according to theGlobal Reporting Initiative guidelines:evidence from Greece", Journal ofCleaner Production 18 (5), 426-438.
Sujit Kumar Roy., (2007), "CorporateSustainability Reporting: How IndianCompanies Measure up" The ICFAIUniversity Journal of EnvironmentalEconomics 02/2007; V(2).
Sustainability Reporting Practices : A Comparative Indo- USA Analysis

59
Annexure-1Overall Company-Wise CSRS from 2012 to 2014 for India
CSRS 2014
CSRS 2013
CSRS 2012 Company Name Sector Average
CSRS
69.00 64.00 62.00 Tata Motors Limited Automobiles & Parts 65.00
89.00 82.00 75.00 Mahindra & Mahindra Limited Automobiles & Parts 82.00
61.00 56.00 51.00 Bajaj Auto Limited Automobiles & Parts 56.00
55.00 58.00 52.00 Hero Motor Corporation Limited Automobiles & Parts 55.00
54.00 51.00 45.00 Maruti Suzuki India Limited Automobiles & Parts 50.00
78.00 72.00 63.00 Tata Chemicals Limited Chemicals 71.00
68.00 67.00 66.00 United Phosphorus Limited Chemicals 67.00
63.00 61.00 59.00 BASF India Limited Chemicals 61.00
69.00 62.00 55.00 Pidilite Industries Limited Chemicals 62.00
61.00 58.00 52.00 Gujarat Fluorochemicals Limited Chemicals 57.00
99.00 96.00 90.00 Larsen & Toubro Limited Construction & Building materials
95.00
75.00 65.00 50.00 Jaiprakash Associates Limited Construction & Building materials
63.33
61.00 55.00 40.00 Punj Lloyd Limited Construction & Building materials
52.00
54.00 54.00 45.00 DLF Limited Construction & Building materials
51.00
62.00 58.00 47.00 Gammon India Limited Construction & Building materials
55.67
83.00 77.00 65.00 HDFC Bank Limited Financial 75.00
52.00 48.00 44.00 Canara Bank Financial 48.00
60.00 51.00 48.00 State Bank of India Financial 53.00
82.00 70.00 61.00 ICICI Bank Limited Financial 71.00
60.00 56.00 49.00 Punjab National Bank Limited Financial 55.00
72.00 63.00 60.00 Coal India Limited Mining 65.00
73.00 62.00 54.00 NMDC Limited Mining 63.00
66.00 61.00 60.00 SesaSterlite Limited Mining 62.33
49.00 47.00 45.00 Shirpur Gold Refinery Limited Mining 47.00
59.00 48.00 40.00 Gujarat Mineral Development Corporation Limited
Mining 49.00
100.00 95.00 90.00 Reliance Industries Limited Oil & Gas 95.00
Biswo Ranjan Mishra & Sabat Kumar Digal
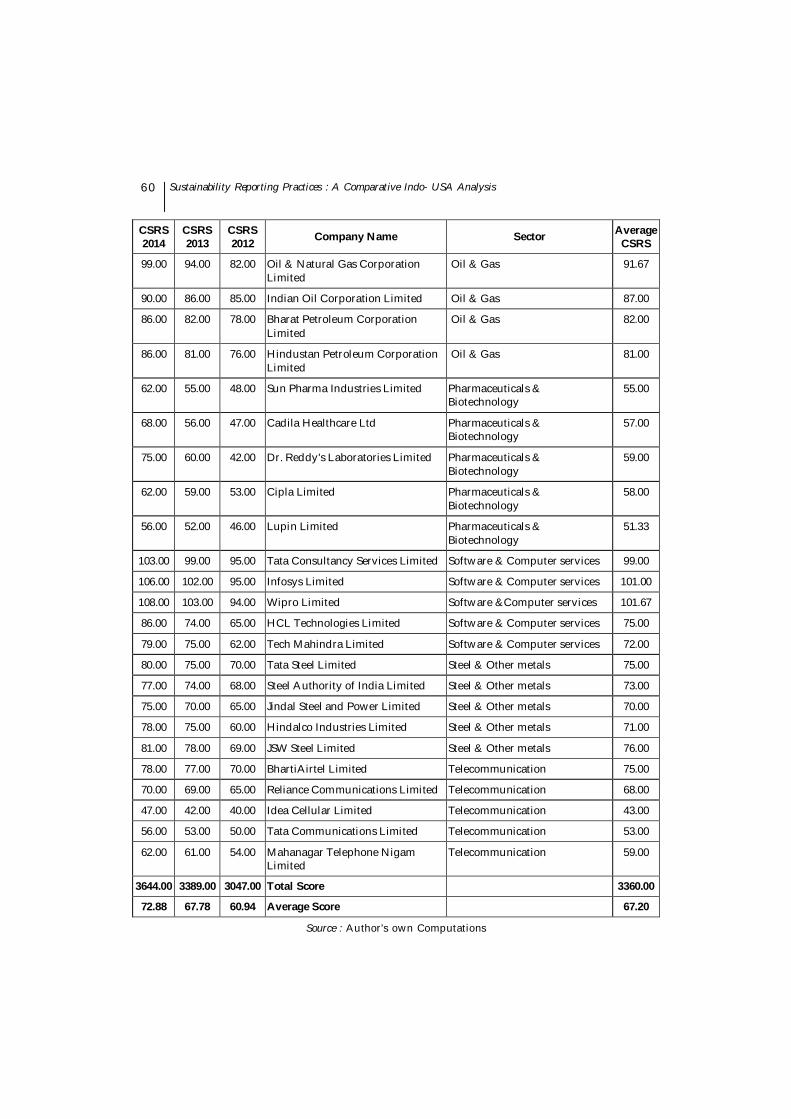
60
CSRS 2014
CSRS 2013
CSRS 2012 Company Name Sector Average
CSRS
99.00 94.00 82.00 Oil & Natural Gas Corporation Limited
Oil & Gas 91.67
90.00 86.00 85.00 Indian Oil Corporation Limited Oil & Gas 87.00
86.00 82.00 78.00 Bharat Petroleum Corporation Limited
Oil & Gas 82.00
86.00 81.00 76.00 Hindustan Petroleum Corporation Limited
Oil & Gas 81.00
62.00 55.00 48.00 Sun Pharma Industries Limited Pharmaceuticals & Biotechnology
55.00
68.00 56.00 47.00 Cadila Healthcare Ltd Pharmaceuticals & Biotechnology
57.00
75.00 60.00 42.00 Dr. Reddy's Laboratories Limited Pharmaceuticals & Biotechnology
59.00
62.00 59.00 53.00 Cipla Limited Pharmaceuticals & Biotechnology
58.00
56.00 52.00 46.00 Lupin Limited Pharmaceuticals & Biotechnology
51.33
103.00 99.00 95.00 Tata Consultancy Services Limited Software & Computer services 99.00
106.00 102.00 95.00 Infosys Limited Software & Computer services 101.00
108.00 103.00 94.00 Wipro Limited Software &Computer services 101.67
86.00 74.00 65.00 HCL Technologies Limited Software & Computer services 75.00
79.00 75.00 62.00 Tech Mahindra Limited Software & Computer services 72.00
80.00 75.00 70.00 Tata Steel Limited Steel & Other metals 75.00
77.00 74.00 68.00 Steel Authority of India Limited Steel & Other metals 73.00
75.00 70.00 65.00 Jindal Steel and Power Limited Steel & Other metals 70.00
78.00 75.00 60.00 Hindalco Industries Limited Steel & Other metals 71.00
81.00 78.00 69.00 JSW Steel Limited Steel & Other metals 76.00
78.00 77.00 70.00 BhartiAirtel Limited Telecommunication 75.00
70.00 69.00 65.00 Reliance Communications Limited Telecommunication 68.00
47.00 42.00 40.00 Idea Cellular Limited Telecommunication 43.00
56.00 53.00 50.00 Tata Communications Limited Telecommunication 53.00
62.00 61.00 54.00 Mahanagar Telephone Nigam Limited
Telecommunication 59.00
3644.00 3389.00 3047.00 Total Score 3360.00
72.88 67.78 60.94 Average Score 67.20
Source : Author's own Computations
Sustainability Reporting Practices : A Comparative Indo- USA Analysis

61
CSRS 2014
CSRS 2013
CSRS 2012 Company Name Sector Average
CSRS
118.00 110.00 105.00 Ford Motor Company Automobiles & Parts 111.00
105.00 103.00 101.00 General Motors Corporation Automobiles & Parts 103.00
96.00 90.00 85.00 Johnson Controls Automobiles & Parts 90.33
91.00 84.00 80.00 Goodyear Tire & Rubber Company
Automobiles & Parts 85.00
87.00 77.00 72.00 Lear Corporation Automobiles & Parts 78.67
125.00 120.00 115.00 Dow Chemical Chemicals 120.00
95.00 91.00 90.00 PPG Industries Chemicals 92.00
93.00 87.00 84.00 Celanese Corporation Chemicals 88.00
86.00 78.00 70.00 Huntsman Corporation Chemicals 78.00
82.00 75.00 68.00 Westlake Chemical Corporation
Chemicals 75.00
77.00 73.00 70.00 Fluor Corporation Construction & Building materials 73.33
77.00 70.00 68.00 Lennar Corporation Construction & Building materials 71.67
93.00 90.00 87.00 Jacobs Engineering Company Construction & Building materials 90.00
70.00 60.00 56.00 DR Horton Construction & Building materials 62.00
75.00 73.00 65.00 URS Corporation Construction & Building materials 71.00
105.00 101.00 100.00 JPMorgan Chase & Company Financial 102.00
106.00 100.00 95.00 Wells Fargo & Company Financial 100.33
100.00 95.00 90.00 Citigroup Companies Financial 95.00
98.00 93.00 85.00 Bank of America Financial 92.00
95.00 93.00 85.00 US Bank Corporation Financial 91.00
95.00 90.00 87.00 Freeport McMoRan Copper Company
Mining 90.67
95.00 90.00 85.00 Newmont Mining Corporation
Mining 90.00
98.00 92.00 86.00 Consol Energy Mining 92.00
87.00 85.00 80.00 Peabody Energy Mining 84.00
92.00 83.00 81.00 Alpha Natural Resources Mining 85.33
112.00 102.00 100.00 Exxon Mobil Oil & Gas 104.67
116.00 108.00 106.00 Chevron Oil & Gas 110.00
Overall Company-Wise CSRS from 2012 to 2014 for USA
Biswo Ranjan Mishra & Sabat Kumar Digal

62
CSRS 2014
CSRS 2013
CSRS 2012 Company Name Sector Average
CSRS
106.00 102.00 101.00 ConocoPhillips Oil & Gas 103.00
95.00 93.00 82.00 Phillips 66 Oil & Gas 90.00
105.00 103.00 101.00 Occidental Petroleum Oil & Gas 103.00
99.00 95.00 82.00 Pfizer Pharmaceuticals & Biotechnology 92.00
87.00 87.00 81.00 Merck & Co Pharmaceuticals & Biotechnology 85.00
95.00 87.00 82.00 Abbott Laboratories Pharmaceuticals & Biotechnology 88.00
99.00 88.00 83.00 Eli Lilly & Co Pharmaceuticals & Biotechnology 90.00
91.00 88.00 82.00 McKesson Pharmaceuticals & Biotechnology 87.00
110.00 105.00 100.00 IBM Corporation Software & Computer services 105.00
106.00 101.00 102.00 Oracle Corporation Software & Computer services 103.00
109.00 108.00 104.00 Microsoft Corporation Software & Computer services 107.00
108.00 103.00 101.00 Cognizant Technology Software & Computer services 104.00
89.00 87.00 79.00 Computer Science Corporation
Software & Computer services 85.00
85.00 82.00 80.00 Nucor Corporation Steel & Other metals 82.33
77.00 70.00 66.00 US Steel Steel & Other metals 71.00
75.00 72.00 72.00 Schnitzers steel Steel & Other metals 73.00
76.00 75.00 68.00 Cliffs Natural Resources Steel & Other metals 73.00
78.00 76.00 68.00 A K Steel Steel & Other metals 74.00
108.00 103.00 101.00 AT&T Telecommunication 104.00
113.00 108.00 103.00 Verizon Communications Telecommunication 108.00
70.00 62.00 60.00 Century Link Telecommunication 64.00
85.00 84.00 80.00 Sprint Nextel Telecommunication 83.00
63.00 60.00 60.00 Level 3 Communication Telecommunication 61.00
4698.00 4452.00 4234.00 Total Score 4461.33
93.96 89.04 84.68 Average Score 89.23 Source : Author's own Computations
Sustainability Reporting Practices : A Comparative Indo- USA Analysis
THE IMPERATIVES OF GLOBALIZATION ANDSURVIVAL STRATEGY OF SMES- IN THE
CONTEXT OF ODISHA
*Professor, Utkal University, Bhubaneswar.**Research Scholar, Utkal University, Bhubaneswar, Email;[email protected], Ph.No. 7539877686
Prof. (Dr.) Kshiti Bhusan Das*Ms. Alaka Panda**
ABSTRACT
The globalization has set in motion by four important drivers - a. Liberalization of international tradeb. Intellectual property development (patents, copy rights, trademarks etc) c. Connectivity (in all forms)and d. The rapid economic resurgence of emerging markets. The 21st century business operates in a realtime global market place. The enterprises strategies on maximizing comparative advantage by sourcing,supplying products and improving competitive position, through minimizing the cost. To achieve thetwo comparative and competitive advantages, the business enterprises constantly review and re-evaluatetheir business locations but also engage in disruptive break through. The trend shows that, there isgreater industrial mobility and the industrial houses are prepared to invest in places (countries) ifassured by the country's policy.These imperatives of globalization have set in motion many policy initiatives of the government ofIndia. The recently launched Make in India initiative, the Sagarmala project, the 16 NMIZs are fewsuch programmes. The Competitive Federalism policy has unleashed a race and spirit among the statesto attract and augment investment, with an assurance to comply to their infrastructure requirements.The states having comparative advantage over others have a fair chance of attracting more internationalinvestments. Odisha is a state, whose geological assets have paid dividend till date could not pull thestate out of poverty and backwardness. The 21st century global business model focuses on both geologicaland geographical assets for investment. The present policy initiatives of the Government of India, theinfrastructural commitment and the competent human resources of this country have become an offer tothe global investors. But one apprehension is significant and most conspicuous, i.e. Will these investmentlead to inclusive growth? Or the inequality level will increase further? To deal with this, the Governmentof India has laid down a blueprint which has the capacity to reduce the gap. The START UP, STANDUP, MUDRA, TADF are few such programmes. It is true that industrial growth is sine quo non; but itmust be inclusive and sustainable. How can these be sustainable, if not inclusive? For this purpose,Odisha was selected. This paper is an attempt to study the efficacy of inclusiveness of the industrializationprocess, which will be sustainable. The paper discussed the policies of the Government of India and alsoof Odisha, to find out how far these policies are helpful in inclusive and sustainable growth anddevelopment.When it is looked upon from the point of view of regional development, this research opines that theremust be a comprehensive approach to achieve growth and competitiveness. In Odisha it should be
The Utkal Business ReviewDecember, 2015, Vol - XXIX, pp.-63-75

64
designed on the basis of specific geographic linkages to geological and other economic activity area- byoptimizing the use of infrastructure, encouraging value addition and value chain. The policy optionshould be meant to usher in balanced socio-economic growth of Odisha that will hinge on sustainabledevelopment with strong inclusive industrial growth, with sustainable employment potentiality andappropriate utilization of natural resources. There is a compelling economic logic to put emphasis onmanufacturing and local value addition. Unless value addition at the primary level (green field) isencouraged these agenda cannot be accomplished. Value addition of intermediate goods will neithergenerate enough resources nor can create more employment.Considering these hypotheses, this paper analyzed the policy options, the institutional frameworkwhich can pave the way forward to identify the strong and grey areas of linkages among corporatehouses, SMEs and Government agencies. The Paradeep Port has been chosen for this study, as it is themost crucial infrastructure with all potentiality to attract investment and provide sustainability to bothbig and small business enterprises. Not only that many industries will come up in the port areas whichmay be classified as port induced, port required and port attracted industries. Many service industrieswill also come up in the port bonded area. This study also opines that increased participation ininternational trade can improve local working conditions as the industries will have to comply withinternational standards. It will also help in greater access to modern technology and best practices.The study concludes that, only those enterprises that have the ability to constantly generate newactivities intend for up gradation to higher levels of value addition, higher productivity and adapt tonew economic and technological breakthrough can sustain in a highly competitive global market. So,also the economies which are characterized by constant reforms and structural changes can sustain andprosper. This is also equally applicable to the small and medium enterprises. The technology and thecapital requirement of the SMEs for the sustenance of such enterprises may be met from Governmentprogrammes like TADF and MUDRA- the new architecture of SME financing in India.
Key Words : SMEs, sustainability, inclusive, port attracted, port induced and port required industries.
INTRODUCTION
Small and Medium Enterprises (SMEs) playa vital role in economic development as theyhave been the main source of employmentgeneration and output growth, both indeveloping as well as in developedcountries. In developing countries, the rolesof SMEs become more crucial as they havepotential to improve income distribution,create new employment, reduce poverty andfacilitate export growth. SME fosterdevelopment of entrepreneurship, industryand the rural economy. It is not only the factthat high rates of economic growth
contribute to economic and socialdevelopment and poverty reduction.Studies show that economic growth of anycountry is closely linked with SMEdevelopment. As globalization proceeds,transition and developing countries andtheir enterprises face major challenges instrengthening their human andinstitutional capacities to take advantageof trade and investment opportunities. Thishas become a top priority on the globaldevelopment agenda.
The Indian growth story of last threedecades exhibits one fact that, growth has
The Imperatives of Globalization and Survival Strategy Of SMEs- in the context of Odisha

65
happened but development has eluded. Thejobless growth was marked with a high levelof exclusion. The growth was notcommensurate with the development. Thelions share to the process of growthcalculated in terms of GDP was contributedby service sector i.e. 67% of GDP. But it isresponsible for only 27 % of employment.The other sector which had the capacity tocreate more employment likemanufacturing, agriculture and mining etc.did not contribute significantly to thenational GDP. It can therefore, be construedthat due emphasis was not given to thesesectors. It is acknowledged that themanufacturing sector has the potentialityto create three indirect employments for onedirect employment. There are otherindustrial sectors like agri processing,automobiles; electronics which are not onlygreat economic multipliers but also theseare big job providers. Moreover, in order tocome out from the syndrome of poverty, thedependence ratio on agriculture has to bereduced and they should be shifted tomanufacturing and tertiary sectors. Thiswill not only help in reducing poverty butalso will help in inclusive growth.
At this moment, India and especially theemerging states like Odisha, Jharkhand andChhattisgarh need development modelswhich can help create employment,generate income and wealth, mobilize bothpublic and private resources, stimulateeconomic activities of all sectors andprovide sustainability. It should be a modelwhich should be holistic and the capacityto address the above issues.
The liberal trade agreements, integratedtransport network, established linkages(civilization, cultural, historical,
strategically) and strong information,communication, technology has createdunprecedented business opportunities forthe country. In view of these, the plannersof the country have laid down a host ofpolicies and programme which have thecapability to transform the economy. Thepresent dispensation at the apex advocatescooperative and competitive Federalism,throws enormous opportunities. In fact acompetition is already in the cards amongthe states and respective starts carving theirown policies to garner more investmentcreate more jobs and produce more wealththrough maximization of resourceutilization. At the National level macropolicies are outlined. It is now up to thestates to formulate the policies which cancomply with the strategically needs of theindustries and can address the priorities ofthe government that is poverty andemployment, on the sustainable basis.
It is imperative at present to analyze someimportant policy options of the uniongovernment and find out their relevance tothe state economy. It is also required to seehow the policies of the state are aligned tothe national policies with other states andto find out whether the same have thecapacity to deliver. At the same time, theinternational experience and historicalevidence should also be considered foranalysis.
The research would contemplate to find outa answer to the effectiveness of SMEs andport, with an inclusive policy. Theinclusiveness need to include the livelihoodoptions of the majority of people and theavailable resources. The root question isHow can architect a model which canprovide improved livelihood to the people
Prof. (Dr.) Kshiti Bhusan Das & Ms. Alaka Panda

66
of the region by optimally using theresources and endowments availablelocally and by using suitable and effectivepolicies of the governments like (Make inIndia Initiative, Manufacturing Policy,Sagarmala Project, of Odisha to skilling anddigital India). For that matter the state andthe region have to take a proactive decisionand action.
The Imperatives of Port Policy in thecontext of Odisha:
The establishment of special economic zone(SEZ) is to facilitate export oriented unitsnear Paradeep and Gopalpur Ports will bebeneficial for the development of trade inthe State. In order to assure the handling ofcargo by new ports, and deal with therequirement of rapid industrialization portdevelopment is essential. The developmentof ports and increase of SMEs are to besynchronized. The major chunk of the cargowill be the imports of crude oil, finishedpetroleum products, LPG, LNG cookingcoal, edible oil, fertilizers and constructionmaterials for commissioning of mega steeland other plants. The exports of mineralsands, granite, processed fish and finishedgood of proposed port based steel plants;allied manufacturing units are alsopotential sources as that of Gujarat andTamilnadu States. It is very much essentialto set an integrated and sustainableMaritime Master Plan. The Maritime Boardwill have the authority, resources and todraw up on the expertise as and whenrequired to cater to the need of the improvedSMEs. Odisha will have to play a vital rolein the overall development of Eastern regionof the country. An integrated port policyfor the State would encourage and lay down
the pathway for the development of portsand other associated infrastructure forpromoting SMEs. It would create a vibrantbusiness environment.
Firstly, the logic of locating major SMEs nearports is clear, since the large businessestablishments can have industrial rawmaterials and they require easy access tothe local markets with low cost. The majorjustification for the state of Odisha is that ithas a vast hinterland generating cargo apartfrom the landlocked states with plenty ofresources like the Eastern and CentralIndian States. The port locations and theperennial systems of Odisha are ideallysituated to adapt to the currentdevelopments in technology, in the areas ofcommunication, automation, cargohandling and ship technology and overalleconomic policy.
According to a survey, the primary goals ofthe port and SMEs are
To create Job and generate income
To set up export processing
To transfer the Technology
To Create backward linkages throughsourcing of raw materials
Odisha is home to some of the leading PSUslike HAL, NALCO, MCL and privatecompanies like Tata steel, VedantaAluminum, Aditya Birla, Jindal etc. Odishareceives un-precedent investments in steel,aluminum, power, refineries and port. Thisopportunity is a perfect platform andpresents a huge opportunity fordownstream and ancillary industries andalso for the SME sectors.
The Imperatives of Globalization and Survival Strategy Of SMEs- in the context of Odisha

67
Review of Literature
Cendrero(1989) in his research paper'Land-Use Problems, Planning andManagement in Coastal Zone' discussesthat The existing planning legislativeprovisions and organizational andadministrative set up presents acombination of opportunities andpotential set-backs for planning withincoastal zones. They need to be taken intoaccount when attempting to improve theplanning practice.
Clark,(1991). 'The Status of IntegratedCoastal Zone Management: A GlobalAssessment. 'discusses that the existinginstitutions and legal frameworks maybe inadequate to plan and implementadaptive responses. New institutionsand legal authorities may be needed inmany coastal states. National legislationand institutions for coastal zonemanagement can provide the neededplanning. In addition, legal structures torequire advance consideration of likelyimpacts-such as environmental impactreview by those planning new projects-can encourage needed foresight.
Chua, and L.F. Scura(1992) in his researchpaper 'Integrative Framework andMethods for Coastal Area Management'This study clearly illustrates that landuse planning and management shallneed to form one of the basic elements ofthis approach. Further research shall benecessary to ascertain just how exactlythe land use planning process could beeffectively amalgamated with the overallICZM activity.
Chua Thia (1993) in his research paperon 'Essentials elements of ICZM'
discusses the coastal zone managementissues which have become a major threatto economic sustainability,environmental quality, intensifiedconflict, social unrest and issues whichdestabilizes the national economy. Hesuggests for an alternative but effectivemanagement system.
Crawford, B.R., J.S. Cobb, and A. Friedman.(1993) in his research paper "BuildingCapacity for Integrated CoastalManagement in Developing Countries."discusses that ICZM programs haveimplications for pre-existing nationalplans and programs as well asinternational jurisdictions.
Gaudian, (1993) in his research paper"Establishment of a Coastal ZoneManagement." discusses that Especiallyin developing countries, this importantpart of the analysis will review andassess new economic developmentpossibilities in the coastal zone.Priorities should be set based uponclearly designed studies of markets andpotential demand, analyses of costs ofproduction and competitive aspects, andrelated issues.
Sorensen, (1993) in his research paper"The International Proliferation ofIntegrated Coastal Zone ManagementEfforts." discusses that there areinsufficient data for a systematic,outcome based performance evaluationof state CZM programs, largely becauseof the lack of a common set of outcomeindicators that would link statemanagement activities and decisions tonational CZMA objectives.
Prof. (Dr.) Kshiti Bhusan Das & Ms. Alaka Panda

68
Vallejo,(1993).in his research paper "TheIntegration of Coastal ZoneManagement into NationalDevelopment Planning." discusses thatthe development planning approach isnarrow in scope, i.e., very muchconcerned with resolving pure land useallocation issues. but less to do with thewider environmental planningconcerns. This approach is non-conducive to the production of coastalplanning policies appropriate for thesound management of the coastal zones.
Brussels. Cicin-Sain( 1993) in hisresearch paper "SustainableDevelopment and Integrated CoastalManagement." discusses that there is aneed for further identification of theenabling and constraining issues in theimplementation of both decentralizedpolicy and co-management approach.Further examination of the appropriateindicators for measuring theeffectiveness of decentralized coastalmanagement and co-managementapproaches will be useful in assessingthe success of, and adjustingaccordingly, the implementation of thesetwo important approaches.
Pernetta, and D.L. Elder (1993) in hisresearch paper 'Cross-Sectoral,Integrated Coastal Area Planning'discusses that entails the formulationof appropriate coastal policies for thedevelopment plans. Key coastal policyheadings relevant to a particular areashould be covered, followingappropriate coastal policy componentsformulated and supported by relevantplanning techniques, guidelines andstandards.
RESEARCH GAP
Till now the economic importance of SMEsin the port has not been realized especiallythe eastern zone of India. The problem isthat when the western coast of India hasbecome vibrant the eastern coast of India isneglected. Odisha will have to play a vitalrole in the overall development of SMEs ineastern region of the country, if its naturalmaritime and cultural endowments andindustrial resources are to be optimallyutilized. The infrastructure of large scaleindustries could be the necessary backbone,for attracting the downstream industries.An integrated port policy for the State wouldencourage and lay down the pathway forthe development and for promotingindustry, trade and commerce.
It remains a fact that the Government of Indiaand the state of Odisha, till date (last year)did not give importance to this developmentof downstream industries. But the recenteconomic policy of Make in India policy andthe like which are intended to enhance theinvestment in manufacturing creates anopportunity for the states with port facility.It is postulated that the industries would liketo set up in the proximate area of the ports.The states will be immensely benefited fromthese investments. For that matter the stateshave to modernize their ports and providethe required infrastructure and facilities.
It is a fact that ports play crucial roles inlocal and regional economies alongside theprosperity of the nation. Not only that largeworkforce is engaged in port relatedactivities directly but also the indirect andinduced employment opportunities arehuge. One example of indirect employmentis like supplying goods and services to
The Imperatives of Globalization and Survival Strategy Of SMEs- in the context of Odisha

69
companies engaged in port activity.Similarly, the induced employment isassociated with expenditure resulting fromthose who derive income from port. Byputting the related businesses in groups thatsurrounds the port area, will create clusterarea. This will accelerate economic activitiesthrough competition, innovation andcreation of new business opportunities. Thiswill also bring in new investment, newtechnology that will match the currentrequirements.
The problem of the state is that despite ofhaving plenty of resources both natural andhuman, it is not able to grow economically.When comparisons are made even amongthe other states of India, it appears thatprobably the state lacks proactive policiesand effective implementation. Therefore, itis felt that an economic model is to beprepared with suitable modifications, sothat the desired result can be achieved.
RELEVANCE OF THE PRESENT STUDY
This study is relevant with regard toestablishment of SMEs and utilizationof port areas resources properly. Majoraim of this study is to promote regionaldevelopment, port based smallindustrial estates would be encouraged.As more number of Mega projects arecoming up in the State, industrialdevelopment shall be synchronized withthe port development and theinfrastructure development.
Whether the policies of port anddownstream industrialization can beeffectively applied to unlock theeconomic potentials of the state. Whetherthis can be an effective way to bringtransformative investments into
business using local resources. Thestudy will identify the pre conditions,good design and implementationpractices of successful initiatives acrossthe country and the globe.
The imperatives of this study lies withthe logic that how the state of Odishacan harness opportunities from theinitiatives taken up by the uniongovernment.
The study is relevant in investment inthe port sector would demand an equalinvestment in the infrastructure facilities.
With regard to" Make in India policy".
With regard to export and revenuegeneration. The major advantage is thatOdisha has a vast hinterland generatingcargo, comprising of the developingEastern and Central Indian States.Exports and imports of food grains,mineral sands, raw materials, finishedgoods, fertilizers and edible oils andpetroleum products, by the largeindustrial houses located in thehinterland offer long term potential forcargo. Any economic developmenttaking place in the hinterland Stateswould have a direct bearing on the portsin Odisha. The port locations and theperennial systems of Odisha are ideallysituated to adapt to the currentdevelopments in technology, in the areasof communication, automation, cargohandling and ship technology.
With regard to providing improvedlivelihood to the people.
With regard to increase in cooperationbetween the large scale industries andsmall scale industries.
Prof. (Dr.) Kshiti Bhusan Das & Ms. Alaka Panda

70
This study is based on new andimproved technological developmentsin the global shipping scenario,especially in the field of containerhandling equipment and in the new portlayout to accommodate container traffic.These technological developmentsdemand new institutional set-up tocapture the flow of major investments inthe State's port sector. The port locationsand the perennial systems of Odisha areideally situated to adapt to the currentdevelopments in technology, in the areasof communication, automation, cargohandling and ship technology.
To analyze the policies of governmentundertaken for the development ofodisha coastal areas and itsimplications.
To undertake a comprehensive study toassess the port capacity requirements topromote trade and encourage economicactivity.
To mechanization and modernization ofexisting port infrastructure and systemsto improve efficiencies.
The development of industrial clusters/ SEZs in the vicinity of the port and itshinterland that will power the economicactivity in the region.
OBJECTIVES
To study the efficacy of inclusiveness ofthe industrialization process, whichwill be sustainable.
To find out how far these policies arehelpful in inclusive and sustainablegrowth and development.
HYPOTHESES
There must be a comprehensive approachto achieve growth and competitiveness.In Odisha it should be designed on thebasis of specific geographic linkages togeological and other economic activityarea- by optimizing the use ofinfrastructure, encouraging valueaddition and value chain.
The policy option should be meant tousher in balanced socio-economicgrowth of Odisha that will hinge onsustainable development with stronginclusive industrial growth, withsustainable employment potentialityand appropriate utilization of naturalresources. There is a compellingeconomic logic to put emphasis onmanufacturing and local value addition.
RESEARCH METHODOLOGY :
The methodology also includes a literaturereview on the subject of industrial clusteror FTZ or SEZ and economic corridors andport related concepts, comprising economictheories underpinning these concepts. Thereview will serve the purpose of feasibilityof these initiatives. Key documents relatingto regional or territorial developmentexamined.
Sources of data:
Primary data collected through survey.
Good Administrative Secondary dataascertained from reports, journals andadministrative decisions.
ANALYSIS AND INTERPRETATION
When industrialization process in thecoastal area of Odisha is picking up may be
The Imperatives of Globalization and Survival Strategy Of SMEs- in the context of Odisha
71
because of policy options or theinfrastructure facility the deprivation levelis likely to go up. How to address thisimbalance? If the MNEs or big corporatecannot address such issues the deprivationlevel will accentuate. The solution lies indeveloping a separate value chain activities,add on activities like support services in theplace of their business. When the globalfirms are shifting from developed marketsto emerging markets like India - they cannotafford to have the existing supply and valuechains to serve the units in this market. It isobvious that in the study area the companieshave to pursue a policy of survival of theweakest. It is possible with Harmoniousand complementarity and not thecompetition alone can provide themsustainability. How to harmonize?? It canbe harmonized through increasedemployment opportunities and livelihoodof the local people. Here in this study thoughparadeep port has a lot of scope for petrochemical and steel industries apart frommany other industries, these two industrieshave been taken into account for study, thesetwo have many downstream and upstreamindustries. It has been also declared as SEZ,many mega industries will come up Themega industries needs support services alsolike logistics and transportation etc. whichcan be only provided by the downstreamindustries.
Steel is one of the most important productsof the modern world and is of strategicimportance for any industrial nation.Historically, all nations during theirindustrialization phase have beensupported by a strong steel industry of theirown. From construction, industrialmachinery to consumer products, steel finds
a wide variety of applications. It is also anindustry with diverse technologies based onthe nature and extent of use of raw materials.
The unfolding developments, both on thedemand and supply sides have warranteda re-look. In the new environment newinvestments in the downstream industrieshave to be steered with appropriate policysupport to ensure that production of steelmatches the pace of growth in consumptionevery year in the decades ahead. Fresh policyinitiatives are needed to ensure that theSMEs follows a path that is sustainablewhen it comes to capacity addition,environment, raw materials sourcing,quality of steel products and the use oftechnology in steel making. Mostimportantly, it is incumbent on the part ofthe government to ensure that the SMEs arefreed from negative externalities so that thegrowth of the industry is based on itsabsolute competitive strength and its actualperformance matches its potential.
The downstream industries of steelindustries which can be located near theport and able to increases the revenue ofstate government.
Refractory Material Industry
Refractories are crucial for iron and steelproduction and the productivity of the steelindustry depends a lot on the quality of therefractories used. As the blast furnace orsteel making shops have undergonesignificant design and technology changes,the quality of refractories have gainedfurther importance.
Following are the key issues pertaining torefractories as SMEs in the context of thesteel industry.
Prof. (Dr.) Kshiti Bhusan Das & Ms. Alaka Panda

72
There is a need for close coordinationbetween the refractory makers andoperational units as 30 per cent of theperformance parameters are refractorybased and 70 percent operation based.Close interaction between operationalestablishments within the end usingplants and refractory makers is requiredfor optimization of operationalparameters and standardization of thesame.
There is a need for standardization ofshapes and size of refractory bricks toensure smooth production and inter-changeability in the industry.
There is an overdependence on imports,mainly from China to meet the domesticdemand. The Chinese manufacturers ofrefractories have overwhelming pricingpower given their strong dominance inthe world market. There is an urgentneed to improve the domestic productioncapabilities and in development of rawmaterials for refractories by adequateexploration and research.
Nickel Industry
Nickel is used in the production of certaingrades of stainless steel as well as specialalloy steel. The production of nickel in thecountry is negligible and almost the wholeof the demand of the domestic end useindustry is being met from imports.Domestic stainless and alloy steel industryhas to face the vagaries of the widelyfluctuating prices of nickel in internationalmarket.
In view of this, there is a need fordevelopment of nickel resources in the state
for exploring possibilities of nickelproduction from available resources ofassociated minerals.
There is a good potential of nickel inchromites overburden dumps ofSukinda Valley in Odisha and therefore,extraction of nickel from these chromiteoverburden dumps of Sukinda Valleyneed to be given a priority. Extraction ofnickel is an energy intensive process andalso involves environmental hazardsassociated with it. More intensive R andD efforts are required for findingeconomically and technically viablemethods for the exploitation of nickel forchromites overburden dumps ofSukinda Valley.
Ferro- Alloys Industry
Ferro alloys are consumed in the productionof all grades of steel, but, significantly andspecifically in alloy and stainless steel. Assteel production increases, demand forferro-alloys will also rise in nearly the sameproportion. Ferro-alloys are a set of diverseproducts and lack of adequate informationin respect of consumption and productionof ferro-alloys in each grade, a reliableforecast of their growth could not be made.However, it is fairly well established that,globally, the industry exhibits significantexcess capacity and the Indian industry isfaced with stiff competition from overseas.Although the industry has remained a netexporter of bulk ferro-alloys with theadvantage of domestic resources andcurrent value of the rupee, in the longer termperspectives several measures are requiredto make the industry competitive on a longterm basis.
The Imperatives of Globalization and Survival Strategy Of SMEs- in the context of Odisha

73
Petro chemical industry
The petro Chemical Industry comprises thecompanies that produce industrialchemicals. Chemicals are used to make awide variety of consumer goods as well asthousands inputs to agriculture,manufacturing, construction and serviceindustries. The chemical industry itselfconsumes 26% of its own output. Thereasons for growth of chemical industry inand around Paradeep are the port throughwhich a large South East Asian market canbe captured, the presence of oil refinery, anall-time availability of water and supply oflaborers. The industries that are clearlyrelated to chemical industry includepetroleum, glass, paint, ink, sealant,adhesive and food processingmanufacturers. The petroleum industry isinvolved in the global processes ofexploration, extraction, refining,transporting (often with oil tankers and pipelines) and marketing petroleum products.The largest volume products of theindustries are fuel oil and gasoline (petrol).Petroleum is also the raw material for manychemical products includingpharmaceuticals, solvents, fertilizers,pesticides and plastics. With the recentestablishment of Paradeep PetrochemicalsComplex, the planning of the Stategovernment for 'downstream growth zone'shas been initiated. In this process, dispersalof activities to cover all possible areas of theState will be given priority.
The downstream industries of petro-chemical industries which can be locatednear the port and able to increases therevenue of state government.
Dyes & Pigments
Colorants have inherent element of valueaddition to a wide variety of products liketextiles, leather, paper, food products,cosmetics, plastics, paints, inks and high-tech applications like optical data storage(CDs, DVDs), solar cells, medicaldiagnostics (CT Scan, angiography),security inks, lasers, photo dynamics etc.The colorant industry comprises two subsegments- dyes and pigments.
The world market for colorants comprisingdyes, pigments and intermediates ispresently estimated at approximate valueof $27 billion. During the last decade, theindustry was growing at an average growthof 2-3% per annum. Whereas other countriesin the world market contribute nearly 86%of the global share, India accounts for ~14%.Size of the Indian colorants industry is $3.9billion in FY12 with exports accounting for~65%. The Indian dyestuff industry ishighly fragmented and characterized by alarge number of players in the unorganizedsector. Today, Indian dyestuffs industrycomprises about 950 units (50 in large andorganized sector and 900 units under Small& Medium Enterprises (SME) Sector. Theglobal capacity of dyestuffs has exceededthe demand resulting in an oversupplyscenario. It is expected that consumerpreference for environmentally friendlyproducts and high performance dyes andorganic pigments will help improve overallvalue of the SME market. The textileindustry will remain the largest consumerof dyestuffs; however growth will be drivenby markets such as printing inks, paints andplastics. These segments are also expectedto increase the consumption of high
Prof. (Dr.) Kshiti Bhusan Das & Ms. Alaka Panda

74
performance pigments helping improveprofitability at around 8% growths.
Construction Chemicals
Construction Chemicals are the chemicalcompounds used in construction activities.These compounds can be used in existingconstruction projects to speed up theconstruction work or in new constructionprojects to impart durability and strengthenthe structures. Construction chemicalsincrease the cost of the project by 2-5% butthe benefits are multi-fold. Certain chemicalproducts help in minimizing the quantitiesof cement and water used in theconstruction. The Indian constructionchemical industry is estimated at ~US$ 0.8Bn in FY12. It has shown a strong growthrate of 17% p.a., historically due to theconstruction boom in India and growingawareness in the industry for better qualityof construction. The construction chemicalmarket is highly competitive and with anincreasing number of global constructioncompanies making a foray intomanufacturing operations in India, theindustry is becoming more attractive andexperiencing strong growth.
Polymer additives
Polymer additives are specialty chemicalsadded to the base polymer to enhancecertain properties or improve processing.They contribute to about 5-7 % of the totalweight of the plastic and about 10% by thecost. The Indian polymer additives marketis estimated at~ $ 360 Mn in 2012. Indianpolymer additives market has been growingat a CAGR of ~10% in the last five yearsand is estimated to be ~US $360 Mn in 2012.The market for polymer additives is
expected to grow at a CAGR of 10% to reach~$ 585 Mn in 2017.
Paradeep port expects to attract investmentfor steel downstream industry of Rs 5000 crand generating an employment opportunityfor 32000 lakh people both direct andindirect. The park is also expected togenerate tax revenue worth Rs 700 cr p.a forthe state govt. It also expect to attractinvestment for petro- chemical downstreamindustries up to Rs 2.80 lakh cr out of whichRs 39000 cr has already been invested andexpected employment opportunity bothdirect and indirect is for 6.5 lakh people.
We can analyses from this how thesedownstream industries not only increase theemployment opportunity for the localpeoples it also increases revenue for the stategovernment
SUGGESTIONS
For the development of these downstreamindustries certain factors are required theyare
Skill
Infrastructure
Financial support
These three factor is lacking in the localpeople. The skill, infrastructure andfinancial support are to be provided by boththe mega industries and government. As thebig industries has the ability of risk taking,have financial strength, and can providemodern technology. The support of largescale industries could be necessarybackbone for attracting the downstreamindustries and an integrated port policy forthe state would encourage and lay down
The Imperatives of Globalization and Survival Strategy Of SMEs- in the context of Odisha

75
pathway for the development and forpromoting the SMEs. This how the largeindustries, government and thedownstream industries can complementeach other.
CONCLUSION
"Survival of the weakest is the key tosustainability". The study concludes that,only those enterprises that have the abilityto constantly generate new activities intendfor up gradation to higher levels of valueaddition, higher productivity and adapt tonew economic and technologicalbreakthrough can sustain in a highlycompetitive global market. So, also theeconomies which are characterized byconstant reforms and structural changescan sustain and prosper. This is also equallyapplicable to the small and mediumenterprises. The technology and the capitalrequirement of the SMEs for the sustenanceof such enterprises may be met fromGovernment programmes like TADF andMUDRA- the new architecture of SMEfinancing in India.
REFERENCESAhmad Termizi, A. (1994) Land Use Planning
Within the Context of Coastal ZoneManagement:
Cendrero, A. (2013) Land-Use Problems,Planning and Management in CoastalZone'. An Introduction. Ocean &Shoreline Management, 12, 367 -381 .
Ch'ng, K.L. and Sasekumar, A. (1990) SouthJohor Coastal Resources ManagementPlan, ASEAN-US Coastal ResourcesManagement.
Darus Ahmad (1994) Coastal Resources inMalaysia and Its Socio-EconomicSignificance. Proceedings Seminar onCoastal Zone Management, KualaLumpur, 10 - l1 January 1994.
Economic Planning Unit (2001) NationalCoastal Erosion Study. EPU, PrimeMnister's Department, Malaysia.
Economic Planning Unit (2004) MalaysianNational Conservation Strategr,Volume 3 Critical Areas, EPU, PrimeMinister's Department, Malaysia.
Goh B L. (1999) The Future of Urban Planningin Malaysia. IPCC (1994) Preparing toMeet the Coastal Challenges of the 21stCentury, Conference Report, WorldCoast Conference, 1993.
Sorensen, J. (1993) The InternationalProliferation of Integrated CoastalZone Management Efforts. Ocean &Coastal Management, 21, 45-80
Taussik, J. (1995) Development Plans in CoastalAreas. Center for Coastal ZoneManagement, University ofPortsmouth.
UNCED (1992) Agenda 21, United NationsConference on Environment andDevelopment, Rio de Janeiro
Prof. (Dr.) Kshiti Bhusan Das & Ms. Alaka Panda

MAIZE EXPORT FROM ODISHA :A COMMERCIAL ANALYSIS
*Ph.D Scholar, P.G.Department of Commerce, Utkal University, Bhubaneswar
Durga Prasad Mishra*
INTRODUCTION
Odisha is an agrarian economy withconducive agro-climatic and soilconditions to grow variety of crops. Thecrops grown in the state are paddy, pulses,sugarcane, maize,oilseeds, turmeric, jute,cotton, coconut, rubber, tea , ground nuts,potato, jowar. These crops depend heavilyon rain and distribution of monsoons is aprime factor in deciding the output andyield. As per Odisha Economic Survey(2014-15) published by Government ofOdisha Agriculture and allied sectorremains one of the prime focus sectors forrapid, inclusive and sustainable growth ofthe State. The real annual growth rate underAgriculture sector reduced from 11.01percent in 2012-13 to -3.25 percent during2013-14 at 2004-05 prices, which is an areaof concern. The production and productivityin agriculture during 2013-14 were severelyaffected because of the cyclone "Phailin"followed by recurrent floods in coastaldistricts. But the sector continues to remaina high priority sector that absorbs more thansixty percent of labour force of the State andhas immense growth potential.
As per the State Agricultural Policydocument-2013 agricultural sector inOdisha about 65% of the workforcedepends on agriculture for employment andlivelihoodAs per the advance estimate for2013-14, the broad Agriculture sector
contributed 15.58 percent to the GSDPduring the year at 2004-05 prices.
Directorate of Agriculture and FoodProduction Odisha carried out SWOTanalysis for chalking out strategic plan forGreen Revolution in Odisha(2011). Themajor strength pointed outare favorableagro-climatic conditions, biodiversity, scopefor horizontal, adequate availability ofground water, vertical expansion in cashcrops, well developed ruralconnectivity,traditional and modernexpertise for agricultural scenario in Odishastate. The weakness is extension of socio-economic conditions prevailing in the statesuch as subsistence farming, non-remunerative agriculture, lack of marketorientation, lack of entrepreneurship, socalled money order economy , absence ofpolicy guidelines to include share croppersin availing investment subsidy, financialassistance. Opportunities listed arefavorable Government policy, network ofsupport system at grass root level, growingemphasis on Public Private Partnership forassured market and contract farming andinfrastructural support. Threats are manysuch as changing food habits, recurringnatural calamities, lower production andproductivity, dominance of rain fed crops,lack of just and fair distribution andutilization of water resources, lack ofadvanced knowledge of in farming disaster
The Utkal Business ReviewDecember, 2015, Vol - XXIX, pp.-76-84

77
management techniques and increased farmmechanization.
Brief scenario on Maize inOdisha andother regions of India
Maize is one of the major crop grown inOdishaapart from Paddy, Pulses andSugarcane. From growers point of viewMaize crop needs less input cost andprovides more profit margin. It's a versatilecrop that requires less water with wideradaptability to soil type, seasons andecologies. Moreover it has varied anddiversified use as food, feed and industrialingredients and ready market for disposal.The different types of Maize are yellow/white grain, sweet corn, baby corn, popcorn,quality protein Maize, waxy corn, high oilcorn, fodder meal.Maize is also used asIndustrial raw material and used in varietyof products directly and indirectly.TheMaize production in India has been largelydriven by growing demand by feed industryand various industrial use.(Kumar,Srinivas & Others 2014).Recently, advancecountries like USA, Canada and Europeutilize maize crop as an importantingredient in bio fuel.
The largest producers of maize are AndhraPradesh (4.97 Million tonnes), Karnataka(3.98 Million tonnes)Maharastra (3.08Million tonnes) out of the total estimatedcrop All-India basis 24.35 Million Tonnesas per Department of AgricultureGovernment of India. The crop of Maize ispre dominantly kharif crop grown in NorthKarnataka and South Karnataka, East &West Godavri district, Nizamabad andAdilabad of Andhra Pradesh, Karnatakaand Maharashtrabordering regions, Biharand Orissa.
The ideal condition for growth of Maize israin during sowing and growing time anddry and sunshine weather during maturingand harvesting time. Any rain or shower orany increase in moisture in the weathercondition make the corn discolored,mouldy. Increase in moisture tends toincrease the aflatoxin content in the maizeand also make seeds germinate and sprout.
The quality of Maize grownin Karnataka isof superior quality especially in Northernpart like Bagalkot, Bijapur, Gulbarga, Bidar,Dharwar, Hubli, Belgaum, in terms ofcolour, grain size and lower level of moistureand aflatoxin content. Because these partsof Karnataka get adequate monsoon rainduring planting time and get enoughsunshine at the time of harvest. Basically,the crop is planted during May-June duringmonsoon time and harvested duringSeptember-October which is comparativelydry season. In contrast, in places like Bihar,Orissa and Andhra Pradesh they are proneto natural calamities like cyclone, flood andheavy rain during harvesting of kharif andrabi crop hence, the crop output and qualitysuffers as a result.
As per the National Estimates of Area,Production and Yield of maize (average of2008-09 to 2012-13) by Directorate ofAgriculture Government of India.
1. Area In Million Ha2. Production in Lakh MT3. Productivity in Kg/Ha
Area Production Productivity
Kharif 7.17 15.15 2113
Rabi 1.32 5.29 4005
Total 8.49 20.44 2408
Durga Prasad Mishra

78
As far as Odisha state is concerned thedetails of maize grown area, production and
productivity of maize crop submitted hereas under:
1. Area In Lakh Ha, 2. Production in Lakh MT, 3. Productivity in Kg/Ha
KHARIF RABI TOTAL Year Area Production Productivity Area Production Productivity Area Production Productivity
2000-01 1.70 2.10 1234 0.06 0.08 1273 1.76 2.17 1235 2001-02 1.56 1.75 1119 0.08 0.11 1287 1.64 1.85 1125 2002-03 1.52 1.70 1118 0.06 0.07 1244 1.58 1.77 1123 2003-04 1.66 1.83 1101 0.09 0.12 1389 1.75 1.96 1116 2004-05 1.76 2.30 1305 0.09 0.15 1649 1.85 2.44 1322 2005-06 1.79 2.63 1468 0.08 0.17 2092 1.87 2.80 1496 2006-07 1.90 2.99 1575 0.09 0.20 2147 1.99 3.19 1602 2007-08 2.04 4.53 2216 0.10 0.28 2824 2.14 4.82 2245 2008-09 2.11 4.76 2252 0.13 0.38 2935 2.24 5.14 2291 2009-10 2.17 4.75 2192 0.11 0.25 2169 2.28 4.99 2191 2010-11 2.36 6.03 2552 0.16 0.46 2820 2.53 6.49 2570 2011-12 2.45 5.59 2280 0.17 0.49 2912 2.62 6.08 2321
Source : Department of Agriculture Government of Odisha web site
It is evident from the above details theproduction and productivity of maize inOdisha is below all-India average.
The Minimum Support Price (MSP)mechanism has been used as tool to provideremunerative prices to farmers on theirproduce, encourage increasing acreage andinvesting for increase in productivity. It isevident from the below table that MSP formaizehas been increased providingincentives to farmers for growing maizecrop.
Year Price in Rupees per Quintal
2010-11 880
2011-12 980
2012-13 1175
2013-14 1250
2014-15 1310
2015-16 1325
The figures for production, domesticconsumption and export of maize fromIndia are given below:
(In Thousand Tonnes)
Year Production of Maize In India
Consumption of Maize in India
Export of Maize from India
2005 14710 14200 521
2006 15100 13900 1208
2007 18960 14200 4473
2008 19730 17000 2608
2009 16720 15100 1939
2010 21730 18100 3526
2011 21760 17200 4569
2012 22260 17500 4691
2013 24260 19600 3871
2014 22500 20000 2500
Source: United States Department of Agriculture
But the volume of export of maize from Indiasuffered last year due to import of cheapermaize from Argentina by traditional buyerslike Iran ,Indonesia ,Thailand , Yemen, UAEetc.
Maize Export from Odisha : A Commercial Analysis

79
Some of the available Literature regardingMaize exports is submitted below :
Kumar, Srinivas and Sivaramane (2012-13)in their assessment of the maize situation,outlook and investment opportunities inIndia found that the demand for maize inlivestock based products are increasing andthe demand for maize as a food product isconstantly declining in India. The marketsurplus of maize crop has increased andhas suggested improved access to domesticand international market with economy ofscale and value creation.
Kachroo, Sharma & Bhat (2013) in theirstudy of the growth and instability of Maizein Jammu and Kashmir observed that thearea, production and yield instability inmaize is very prominent in Jammu andKashmir.
Dass & Others (2012) concluded that geneticand biotechnological interventions in maizecan ensure food security and economicgrowth.
Kumar, Srinivas & Others (2014) hasconcluded that with congenial policyenvironment India can participate in Maizeexport market in a big way in coming years.
"Fact finding report on popularisation ofhybrid maize in Odisha" (2011) has notedthat districts like Nawarangpur, Ganjam,Kalahandi, Koraput, Malkangiri, Kandhmalhave highest areas under irrigated maizein Odisha. A special programme forpopularization of hybrid maize has beentaken up in 20 districts namely Bolangir,Mayurbhanj, Koraput,Keonjhar,Sundergarh, Gajapti, Kandhmal,Kalahandi, Nuapada,Rayagada, Nayagarh,Deogarh, Angul, Ganjam, Khurda,
Jharsuguda, Samabalpur, Baragarh,Dhenkanal and Malkangiri in PPP model.
Objective of the Study:
To make an analysis of Maize export fromOdisha in the recent past and suggestmeasures to increase the export activities.
Benefit of the Study
At present Odisha is not placed likeKarnataka and Andhra in the export mapin case of maize, but our study has broughtout certain positive aspects in maize exportfront
1. The maize cultivation is presentlyadopted on a sustainable basis thoughin certain pockets maize is beingcultivated on commercial scale. Variousstudies have pointed out the fact that theoverall economic conditions of growerscan be improved by making cultivationon commercial scale. Odisha has all thepotential to become a major maizegrowing state for meeting demand ofdomestic and overseas markets.
2. Further Odisha can be developed asdestination for sourcing organic maizewith less application of chemicalfertilizers and adoption of traditionalfarming.
3. There is urgent need to restructure andstrengthen Mandi system across thestate for ensuring remunerative price togrowers through Minimum SupportPrice (MSP).
4. Many parts of Odisha generallylacksbasic infrastructural facilities and policymakers to strive for developing morefacilities like good quality seeds forfarmers, irrigation, improved technology
Durga Prasad Mishra
80
for pre and post harvesting, godown,storage space and truck and railconnectivity between sourcing base toport areas.
Methodology of Data Collection
The present study mainly relied on primarydata collected from exporters, traders,buying houses, reputed independentInspection agencies engaged in quantityand quality certification, Cargo HandlingAgents, etc. The samples of respondentswere chosen (no 25) are engaged in themaize export activities from Karnataka,Andhra Pradesh, Bihar, Maharashtra andOdisha. In our view the samples chosenwere representative of the universe. All therespondents have direct or indirectprevious experience of dealing maize exportfrom Odisha.Most of the respondentsinterviewed have undertaken the exportactivities from eastern ports likeVisakhapatnam, Kakinada and Haldia inbreak bulk/container loads. Many of theexporters have undertaken export toBangladesh in truck/rake loads throughIndo-Bangladesh border.Statistics withregard to figure on production,consumption and trade is relied upon theGovernment sources and the specializedbodies associated the activities connectedto rice trade. The data gathered furthertabulated on the basis of the objective ofstudy and interpretation was carried outaccordingly.
Assumptions and Limitation of the Study
1. The export activity is primarily acommercial activity and the presentstudy find out "commercial aspect" ofmaize export from Odisha such asacceptability and viability of export of
maize from Odisha to overseas markets.
2. In the recent past Indian maize is outpriced by South American origin and nomajor export activities with regard toMaize except some parcels moving toneighboring country like Bangladesh,Malaysia, UAE and Yemen etc. Hencethe response of the respondents is basedon their experience not so recent one.
3. The Odisha Maize is mainly exportedfrom neighboring ports like Vizag andby road/rail to Border States ofBangladesh. Hence the respondentsmainly consisted of exporters/traders/agencies active in east coast for exportactivities.
4. The quality parameters like moistureand aflatoxin content is mutually agreedbetween exporter and importer and theend use as "feed purposes" or "foodpurposes" is not differentiated in thisstudy. The export from Odisha meansMaize produced in different parts ofOdisha only.Maize is traded basisspecifications though there is informalunderstanding about the origin of Maizeto be exported.
5. In this study logistics constraints implybottle-necks in respect of transportation,go down and storage, port facilities,loading of vessels in both pre-shipmentand post-shipment.
Analysis of the Study :
All the respondents were interviewed andasked specific questions about theirexperience in respect of maize exports ingeneral and from Odisha in particular theirresponse is summarized below as under:
Maize Export from Odisha : A Commercial Analysis

81
1. As per the Respondents maize fromOdisha are being exported for the lastfew years to Bangladesh, Indonesia andThailand from eastern coast portsnamely Vizag. The shipment to Far Eastdestination is by vessel and containersdepending upon the contractualrequirement. Mostly the shipment toBangladesh is effected through rail/trucks by the exporters. Much of thecargo is sourced by the local traders andexporters in AP from Odisha and thecargos are mixed/blended with otherorigins and then get exported.Alltherespondents were unanimous intheir opinion that maize from Odisha isnot exported on "standalone basis" dueto not so positive perception aboutOdisha maize.
2. The size of maize crop grown in Odishais estimated to be about 5.5 Lakh MT to6.0 Lakh MT as compared to totalcountry production in the range of 22 to23 Million Tones.There was divergentopinion among the respondents aboutthe quantum of maize exported duringthe last few years on average basis.About 60% of respondents felt 50,000Mtsof exportable surplus available andabout 30% of the respondents put thefigure about 1,00,000Mtsand balance10% of the respondents stated that abbot1,25,000 to 1,50,000 Mts has beenexported from Odisha on yearly basisduring the last few years.
3. As far as quality of maize is concernedalmost 100% of the respondents opinedthat Karnataka and Andhra produce thesuperior quality of maize for export.Majority of respondents felt quality ofmaize produced in Odisha is comparableto quality of maize produced in Bihar.Given a choice majority (96% ofrespondents) felt that supplier would notlike to take maize from Odisha.Respondents overwhelmingly opinedthat exporters look for exporting Odishamaize in case other origins are not easilyavailable especially from Bihar orexporters meeting low priced contract orurgent need to meet loading deadlineand failure to deliver the cargo wouldland exporters in trouble.Respondentsalso stated that Maize grown in Odishawas earlier used in the starch industrydue to inferior quality however 75% ofthe respondents felt Odisha has started
Durga Prasad Mishra

82
growing quality maize recently andcatering to the demand of feed industry.
4. Almost 80% of the respondent respondedthat presence of "high moisture" and'aflatoxin content" are primary reasonsfor them to keep away from exportingOdisha maize.As per the majority of therespondents the moisture content inKarnataka and Andhra origin maize isbetween 12-13% as compared to Odishamaize around 15% on average. The sizeof maize produced in Odisha is smalleras compared to Karnataka and Andhramaize. Hence the Odisha maize used as"blending" for export consignmentExporters source maize from Karnatakaand Andhra at a higher price to avoidquality dispute or rejections from theForeign buyer.
5. Maize growers of Odisha use thetraditional method of separating kernelsfrom ear head is to dry under sun shineand put on the road and ply the rolleron it to separate. In contrast themechanized method of drying throughmachine by sucking moisture andputting on the thresher to separate kernelfrom the ear head. The export operationof maize needs adequate care before itgetshipped in containers or in bulkvessels. In a closed space corn generates
heat and tend to become mouldy andbegan to sprout if there is excess moisturein the cargo. In the port premises whenother cargo are stored, insects are boundto be there and they attack the corn as itis sweet commodity.92% of therespondents were in favor of farmersand traders in Odisha to use moderntechnology for harvesting, drying andstorage of corns enabling to meet exportstandards.
6. All of the respondents were in favour oftransparent mandi system in place sothat farmers receive remunerative pricefor their produce. Majority ofrespondents (96%) were of view thatGovernment should intervene forenforcement of Minimum Support Price
Maize Export from Odisha : A Commercial Analysis

83
to the maize growers.About 88% of therespondents attributed lack ofcommercial farming and basicinfrastructural facilities as cause forOdisha lacking in export front.
7. Most of the respondents have expressedthat there is immediate need to buildenough storage space with modernfacilities to facilitate export activities inmaize. The present storage spaceavailable in maize growing region aregenerally in smaller in size capacity1,000 Mt to 2,000 Mts only. An exportershipping in vessel load need minimum4,000 Mt to 5,000 Mt capacityto build upand aggregate the cargo. 20% of therespondent stated that there is elementof VAT on storage of maize and theirconcern need to be addressed.
Conclusion and Recommendation fromthe study:
The present study focused mainly onproblems associated with commercialaspect of maize export from Odisha. Theproblems in export are primarily related toquality and specifications like highermoisture and aflatoxin content, storagespace constraints, unfavorable tax structurefor storage of cargo etc. Apart from agro-climatic conditions the other influencingfactors are poor economic conditions, smallsize holdings, absence of commercialfarming, lack of knowledge about themarket, low productivity, non-applicationof advanced technology and non-growth ofother infrastructural facilities supportingexport activities. Respondents haveexpressed their disappointment that mostof the farming community still employtraditional sun drying technology before
marketing their produce.Despite theseunfavorable factors respondents haveoverwhelmingly supported the fact thatOdisha has all the potential to become majormaize growing state like neighboring stateBihar. The positive sign that the quality ofmaize produced recently in Odisha hasimproved due to introduction of hybridmaize seeds in some pockets and advancedtechnology in farming. Majority ofrespondents have strongly suggested thatOdisha can market their maize as organicand for food use in export markets.
As per Press Information Bureau (PIB)release dated 17th June 2015 various reporthave shown that Eastern belt of the countrygets neglected in so far as procurement isconcerned. The Cabinet directed thatarrangement for procurement in EasternIndia be strengthened. The study supportedthe fact that MSP mechanism is not strictlyenforced in maize growing regions as themarket yard/mandi system is not well-developed (about 92% of the respondents).The study observed that strictimplementation of MSP would provideremunerative prices to producers andprovide incentive to produce maize incommercial scale with enhancedproductivity.
Respondents have strongly recommendedfor development in logistics front such ascreation of more scientific storage space, railand road connectivity between growingand consuming market, testing / laboratoryfacilities. However issue of maize export islinked with lot of associated factors likeclimatic conditions, government support,business environment, viability of exportetc. Sincere steps are required from
Durga Prasad Mishra
84
Government, Policy Makers and other stakeholders to improve all the above factorstowork towards the goal of placing Odisha inthe global maize export map.
REFERENCESKumar, Srinivas & Others (2014) Production
Performance of Maize in India ;Approaching an Inflection Point :Original Article in Intl. J. Agricult StatSci Vol 10, No 1, pp 241-248.
Kumar,Srinivas & Others : Assessment of themaize situation, outlook andinvestment opportunities in India:Country Report-Regional AssessmentAsia
Sain&Dass&Chikkappa& Others (April 2012):Genetic enhancement and cromanagement lead maize revolution inIndia ; Maize Journal 1 (1) 7-12
Kachroo, Sharma & Others (2013): Study ongrowth nand Instability of Maize inJammu and Kashmir Published online.
Maize in India : India Maize Summit"14
A Fact Finding Report, April 2011,Popularization of Hybrid Maize inOrissa as part of Green Revolution ineastern India published by LivingFarms.
Strategic Plan for Green Revolution in Orissaunder RKVY, 2010-11 to 2014-15published by Directorate of Agricultureand Food Production, Orissa,Bhubaneswar.
Sood (2011)Odisha's corn push, Printed online.State Agriculture Policy 2013, Agriculture
Department OdishaWebsite Ministyr of Agriculture, government
of IndiaEconomic Survey 2014-15 Published by
Government of India.Economic Survey 2014-15 Published by
Government of Odisha.Website USDA & Index MundiPress Information Bureau (PIB) release dated
17th June 2015 by Government of India.
Maize Export from Odisha : A Commercial Analysis
ISSUES AND OPTIONS OF SKILL INDIA
*School of Humanities, KIIT University, Bhubaneswar
Dr. Nishi Kanta Mishra*Mr. Dhyanadipta Panda*
INTRODUCTION
Skill India is an initiative taken by theGovernment of India. It was launched byPrime Minister sri Narendra Modi on 16July 2015 with an aim to train people in Indiadifferent skills. The initiatives includeNational Skill Development Mission,National Policy for Skill Development andEntrepreneurship 2015, Pradhan MantriKaushal Vikas Yojana (PMKVY) schemeand the Skill Loan scheme. After 'DigitalIndia' and 'Make in India', the Governmentlunched another programme. This one is arevised version of programmes launchedearlier under the skill development policy.This new programme called 'Skill India' issupposed to be a multi-skill programme.
Like all other programmes 'Skill India' toois a dream project of sri Narendra Modi andthe work to launch this programme hasalready been initiated. The main goal is tocreate opportunities, space and scope forthe development of the talents of the Indianyouth and to develop more of those sectorswhich have already been put under skilldevelopment for the last so many years andalso to identify new sectors for skilldevelopment. The new programme aims atproviding training and skill developmentto 500 million youth of our country by 2020,covering each and every village. Variousschemes are also proposed to achieve thisobjective.
ABSTRACTThe present central government led by Shri Narendra Modi has taken the initiative for improvement ofskill among the educated youth of our country so that the employability will increase which willultimately improve the national productivity. In this connection some new skill development programhas been taken into consideration both in central and state level of our country. Demand for skilled workforce is the need of the hour and keeping this in mind the government has targeted to improve the skillof 500 millions of youth of our country by 2020. This initiative not only provide employment opportunityin the country but also enable the youth force to compete with other developed nations. In order to meetthe program the govt. has set up a fund monitoring committee at the central level so that the financialposition of organizations associated with this program will improve. Different technical courses andvocational education course should change and prepared as per the requirement of the corporate atlarge. Fund allocation and fund utilization can be made properly in order to achieve the maximumbenefit from all these program. The target group will be the traditional, non- traditional, technical andnon- technical youth of our country.
Key Words : Digital India, Make -in-India, job creation, youth skilling, Apprenticeship training, Saleof ambition, Inclusive growth, demand based system.
The Utkal Business ReviewDecember, 2015, Vol - XXIX, pp.-85-90

86
The emphasis is to develop skill among theeducated youths in such a way so that theyget employment and also interested inentrepreneurship. This scheme will Providetraining, support and guidance for alloccupations those were of traditional typelike carpenters, cobblers, welders,blacksmiths, masons, nurses, tailors,weavers etc. More emphasis will be givenon new areas like real estate, construction,transportation, textile, gem industry,jewellery designing, banking, tourism andvarious other sectors, where skilldevelopment is inadequate. The trainingprogrammes would be on the lines ofinternational level so that the youths of ourcountry can not only meet the domesticdemands but also have the capacity tocompete with other countries like US, Japan,China, Germany, Russia and those in theWest Asia.
Objective:
1. To analyse the need for skill developmnin India.
2. To highlight various skill developmetscheme available.
3. To discuss the initiative.
4. To stydy the operating strategy of skillIndia.
Methodology:
The present study is based on secondarydata. The data are collected from journals,magazines, research articles and web sites.
Need For Skill Developmn in India:
Livelihood opportunities are affected bysupply and demand side issues. On thesupply side, India is failing to create enough
job opportunities and on the demand sideprofessionals entering the job market arelacking in skill sets.This is resulting in ascenario of rising unemployment rates andemployability. Skill development in Indiais necessary due to the following reasons.
a) Job Creation: Between 1999-2000 and2004-05, the number of jobs increasedby around 60 million persons againstan increase in labour force of 62million.Though, the increase inemployment kept pace with increase inlabour force for the next 5 years, the totalincrease in jobs was only 1 million.Employment generation picked up from2009-10, with around 14 million peoplefinding jobs in 3 years. However, 15million people entered the job marketduring this period. Currently about 26million people enter the working agegroup every year with about 65% of themlooking for jobs.
b) Youth Skilling: While keeping pace withemployment generation is one issue,employability and productivity of thoseentering the labour market is anotherissue. As per the India Skills report 2015,only 37% of surveyed people were foundemployable. Report says only 10% of thelabour force had received vocationaltraining, with only around 25% amongthem receiving a formal vocationaltraining. India ranked last among 60countries on labour productivity.
c) Demand for Skilled Workforce: It isprojected that Human ResourceRequirement till 2022 at 201 million,making the total requirement of skilledwork force by 2022 at 300 million. Amajor share of these jobs was to be added
Issues and Options of Skill India

87
in the manufacturing sector targeting100 million new jobs in manufacturingby 2022. The National Skill DevelopmentPolicy had set a target of skilling 500million people by 2022. More recently,study reports commissioned andreleased by Ministry of SkillDevelopment assessed an incrementalhuman resource requirement across 24sectors around 110 million by 2022.
Skill Developmet Scheme:
At central level the nodal institution forvocational training is the Director Generalof Employment & Training (DGET) underthe Ministry of Labour and Employmentfocus on skill development programmes.The DGET is responsible for formulatingpolicies, establishing standards, grantingaffiliation, trade testing and certification,and matters connected to vocationaltraining and providing employmentservices. The National Skill DevelopmentCouncil (NSDC) - now a part of the newlycreated Ministry of Skill Development andEntrepreneurship was initially set up underthe Ministry of Finance to provide viabilitygap funding and promote private skillinitiatives. Three major skill developmentschemes of the DGET that are beingimplemented through government ITIs andprivate ITCs include the Craftsmen TrainingScheme, the Apprenticeship TrainingScheme and the Modular EmployabilityScheme.
i) Craftsmen Training Scheme: The schemeis being run in over 10,000 instituteswith a seating capacity of about 1.3million. The training is available forabout 116 trades and the coursegenerally has duration of 2 years. The
courses generally require a minimumeducational qualification of havingpassed the 10th or 12th grade (sometrades accept students who have passedthe 8th grade). Under these schemes,emphasis is largely on the practicalaspects, with practical to theoryteaching ratio being 70:30.
ii) Apprenticeship Training Scheme: Asmentioned earlier, around 27,000establishments are providingapprenticeship training to 211,632youths in 2013-14. The training usuallyvaries between 6 months to 4 years. Theminimum educational qualification isdifferent for different trades. For sometrades, educational qualification is SSCpassed or equivalent, whereas for someit is two classes below SSC. There isprovision of Apprenticeship Trainingfor ex-ITI students based on a biannualnational level test.\
iii) Modular Employable Skills: Theprogramme was initiated in 2007 withthe objective of expanding the outreachof the training facilities to schooldropouts and in recognition of need forprior learning of workers in theunorganized sector. The target workersinclude those who have left school after5th or 6th grade or have acquired on-job-training but do not have formalcertification. Under this scheme shortduration courses are provided toprospective trainees using bothgovernment and private infrastructure.
Some private sectors has also taken variousinitiatives on its own and in collaborationwith the government and internationalentities, to upgrade in-house training
Dr. Nishi Kanta Mishra & Mr. Dhyanadipta Panda
88
facilities and also to provide training topotential employees to make them job-ready. Many large corporations like Larsen& Toubro, Bharti Group, Hero Group,Maruti, ITC, Infrastructure Leasing &Finance Services Ltd. etc., have establishedtraining facilities that offer world-classtraining programmes. The governmentprovides partial support in funding by wayof sponsoring the tuition fee of the students.NSDC has 203 training partners whichinclude for profit as well as non-profitentities. In the last four years, these trainingpartners have trained over 2 million peoplein more than 25 sectors, at 2500 fixed andmobile centres, in over 350 districts acrossthe country.
Initiative of Skill India:
Following are some of the initiatives of skillIndia:
i) Scale of ambition: At present the capacityof skill development in India is around3.1 million persons per year. The 11thFive Year Plan envisions an increase inthat capacity to 15 million annually.India has target of creating 500 millionskilled workers by 2022. Thus, there is aneed for increasing capacity andcapability of skill developmentprograms.
ii) High inclusivity: The skill developmentinitiatives will harness inclusivity andreduce divisions such as male/female,rural/urban, organized/unorganizedemployment and traditional/contemporary workplace.
iii) Dynamic and demand-based systemplanning: The skill developmentinitiatives support the supply of trained
workers who are adjustable dynamicallyto the changing demands of employmentand technologies. This policy willpromote excellence and will meet therequirements of knowledge economy.
iv) Choice, competition and accountability: Theskill development initiative does notdiscriminate between private or publicdelivery and places importance onoutcomes, users choice and competitionamong training providers and theiraccountability.
v) Policy coordination and coherence: The skilldevelopment initiatives supportemployment generation, economicgrowth and social developmentprocesses. Skill development policy willbe an integral part of comprehensiveeconomic, labour and social policiesand programmes. A framework for bettercoordination among various Ministries,States, industry and other stakeholderswill be established.
Operating Strategy of Skill India:
Following are some of the operatingprinciples of skill India:
i) Government financial support mustcomplement private investment: The CentralMinistries must focus on areas whereprivate investment in skilleddevelopment is unlikely to be availableor forthcoming. The Government wouldaim at useful public-privatepartnerships.
ii) States as key actors: The States being thekey actors in Skill Development wouldset up overarching integratedframework for action for Skill
Issues and Options of Skill India
89
Development through State level SkillDevelopment Missions.
iii) Deployment of funds: The funds wouldbe deployed more for activities than forbuildings and other hard assets.However, upgradation of machineryand equipment, teaching and learningaids will be a continuous process.Creation of infrastructure in latesttechnology, needbased new initiatives,creation of infrastructure in rural,remote and difficult areas will continue.
iv) Focus of modular courses, open architectureand short term courses: With fast changingskills in the labour market, focus wouldbe on short, relevant and effectivecourses that would get candidates intothe workplace. They will be weldedthrough NVQF to maintain dynamismand open to feedback.
v) Separate financing from delivery: TodayGovernment funds are only available forgovernment delivery. National SkillDevelopment Corporation will supportprivate skill development initiatives.Following financing options will beexplored.
vi) Link financing to outcomes: Today publicand private training is financed largelyon inputs viz. number of courses,number of students, faculty, etc.
a) Efforts would be made to movetowards Government financinglinked to placement ratios andoutcomes.
b) Focus funding on candidates: Thefocus would be on funding thecandidates ratherthan institutions to
create choice. This could bestructured as a scholarship, skillvoucher, outcome basedreimbursement, etc.
vii) Create infrastructure for on-the-job-training and encourage apprenticeships:The enabling infrastructure for largenumber of formal apprentices needs tobe built that includes modification to theApprentices Act, 1961.
viii) Publicise rating and outcomeinformation on training institutions: Aframework of accreditation andinfrastructure for informationdissemination around measurablecriteria on institutions will be created.Ratings of public and private institutionswould be put on public domain.
ix) Effective assessment and crediblecertification: Quality assured learning,credible assessment and certificationwill be developed. This will allowemployers to use the certificate as aproxy to fast track job applicants.
x) Restructure employment exchanges ascareer guidance centres: EmploymentExchanges will be restructured as careerguidance centres to channelizecandidates into jobs, apprenticeshipsand training.
xi) Expand formal employment: Formalemployment is not only fiscally attractivebut more amenable to financinginnovations. This will require a reviewof existing State and Central legislationswhich encourage informal andunorganized employment.
Dr. Nishi Kanta Mishra & Mr. Dhyanadipta Panda

90
CONCLUSION
i) Skill development is imperative in orderto create job opportunity for theeducated youth of our country.
ii) The requirement of manufacturingsector can be fulfilled by skilling at least500 million youth by year 2020 in orderto provide employment opportunity.
iii) The Apprenticeship Training programcan solve the requirement of technicalmanpower in different technicalorganizations in near future.
iv) The initiative of skill development willenhance not only the employability butalso the economic growth and socialdevelopment of our country in nearfuture.
v) The strategy of skill India should focuson modular courses in different traininginstitutions so that skill training to thestudents can be useful for employmentpurposes.
vi) Effective assessment and crediblecertification is the need of the hour sothat qualitative skill training can bepossible which improve theemployability of our country.
REFERENCESDahlman, C., &Anuja, U. (2005).India and the
Knowledge Economy: LeveragingStrengths and Opportunities.Washington, D.C: World Bank.
Federation of Indian Chamber of Commerce& Industry.(2013). Knowledge paper onskill development in India. GlobalSkills Summit 2013. New Delhi: Ernst& Young Pvt. Ltd.
Federation of Indian Chamber of Commerce& Industry. (2014). Reaping India'spromised demographic dividend -industry in driving seat. New Delhi:Ernst & Young Pvt. Ltd.
Government of India (2012).Reports andPublications. Ministry of Statistics andProgramme Implementation.Government of India. New Delhi.
International Labour Organization. (2012).Global employment trends- Preventinga Deeper Jobs Crisis. Geneva: ILO.
National Sample Survey Organization. (2010).Employment and UnemploymentSituation in India (66th Rounds).Ministry of Statistics and PlanImplementation, Government of India.New Delhi.
Issues and Options of Skill India

AN ANALYSIS OF FOREIGN DIRECT INVESTMENTAND ITS IMPACT ON INDIAN ECONOMY
* Asst. Prof, P.G. Department of Business Administration, Kalam Institute of Technology, Berhampur,Odisha; PIN: 761003, E-Mail:[email protected]**Faculty Member, P.G. Department of Business Administration, Berhampur University, Berhampur, Odisha;PIN: 760007. E-Mail: [email protected].***Research Scholar, P.G. Department of Business Administration, Berhampur University, Berhampur, Odisha;PIN: 760007
Dr. Santanu Kumar Das*Dr. Suman Kalyan Chaudhary**
Mr. Monaj Kumar Panda***
INTRODUCTION
Foreign Direct Investment (FDI) is fund flowbetween the countries in the form of inflowor outflow by which one can exploit theopportunity enhance the productivity andfind out better position throughperformance. In simple terms it is the directinvestment by a corporation in a commercialventure in another country. Theeffectiveness and efficiency depends uponthe investor's perception. If investment witha purpose of long-term then it is contributes
positively towards economy. On the otherhand if it is for short-term for the purpose ofmaking profit then it may be less significant.Depending upen the industry sector andtype of business a Foreign Direct Investmentmay be an attractive and viable option. Anydecision on investing is thus a combinationof an assessment of enterer recourses. Thisunprecedented growth of global FDI in 1990around the world make FDI an importantstrategy in both developed and developingnations and policies are designed in-order
ABSTRACTForeign Direct investment in any country has been a driver of growth. While allowing FDI the countryopens and gives the multinational organization an opportunity to exploit the untapped market. At thesame time it gives lots of opportunities to the host country in terms of providing new job opportunities,bringing capital, technology, new skills, better work culture and expertise and so on. It leads to a bettereconomic phase and become an important factor which gives the country's GDP a boost. In India afterliberalization privatization and globalization act 1991, the market became open. It led the country in anera of better economic development which leads to continuous growth in GDP. By the entrance of MNCsin different sectors, which were closed till now; Country has become one of the fastest growing economiesof the world. Because of FDI a huge flow of capital came in the country which helped and helping thedifferent sectors a various ways. And all these sectors are contributing more in the growth of country'sGDP. Now it is the third largest economy of the world in terms of Purchasing power parity. Thecountry has gained the growth rate of over 6% after the LPG act on an average. The flow of FDI startedafter the LPG act. This research focuses on the flow of FDI in India and its impact on the economy whilecritically evaluating the impact on GDP.
The Utkal Business ReviewDecember, 2015, Vol - XXIX, pp.-91-103
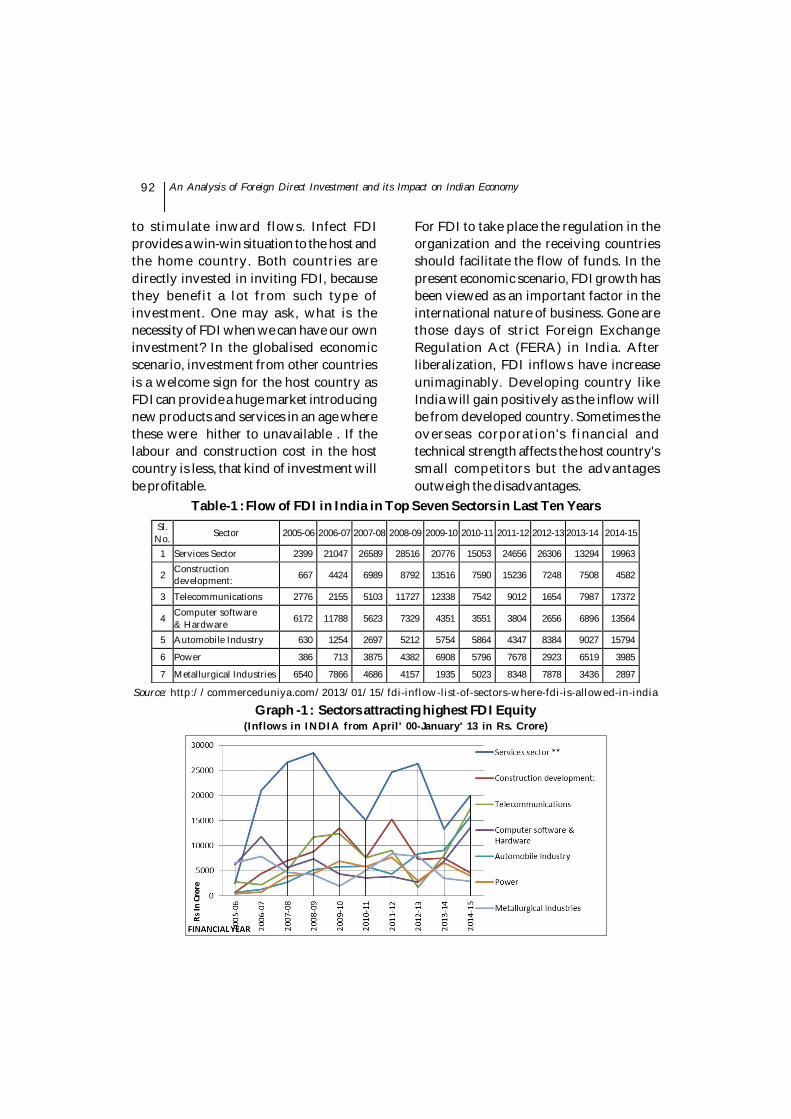
92
to stimulate inward flows. Infect FDIprovides a win-win situation to the host andthe home country. Both countries aredirectly invested in inviting FDI, becausethey benefit a lot from such type ofinvestment. One may ask, what is thenecessity of FDI when we can have our owninvestment? In the globalised economicscenario, investment from other countriesis a welcome sign for the host country asFDI can provide a huge market introducingnew products and services in an age wherethese were hither to unavailable . If thelabour and construction cost in the hostcountry is less, that kind of investment willbe profitable.
For FDI to take place the regulation in theorganization and the receiving countriesshould facilitate the flow of funds. In thepresent economic scenario, FDI growth hasbeen viewed as an important factor in theinternational nature of business. Gone arethose days of strict Foreign ExchangeRegulation Act (FERA) in India. Afterliberalization, FDI inflows have increaseunimaginably. Developing country likeIndia will gain positively as the inflow willbe from developed country. Sometimes theoverseas corporation's financial andtechnical strength affects the host country'ssmall competitors but the advantagesoutweigh the disadvantages.
Table-1 : Flow of FDI in India in Top Seven Sectors in Last Ten YearsSl.
No. Sector 2005-06 2006-07 2007-08 2008-09 2009-10 2010-11 2011-12 2012-13 2013-14 2014-15
1 Services Sector 2399 21047 26589 28516 20776 15053 24656 26306 13294 19963
2 Construction development: 667 4424 6989 8792 13516 7590 15236 7248 7508 4582
3 Telecommunications 2776 2155 5103 11727 12338 7542 9012 1654 7987 17372
4 Computer software & Hardware 6172 11788 5623 7329 4351 3551 3804 2656 6896 13564
5 Automobile Industry 630 1254 2697 5212 5754 5864 4347 8384 9027 15794
6 Power 386 713 3875 4382 6908 5796 7678 2923 6519 3985
7 Metallurgical Industries 6540 7866 4686 4157 1935 5023 8348 7878 3436 2897
Source: http://commerceduniya.com/2013/01/15/fdi-inflow-list-of-sectors-where-fdi-is-allowed-in-india
Graph -1 : Sectors attracting highest FDI Equity(Inflows in INDIA from April' 00-January' 13 in Rs. Crore)
An Analysis of Foreign Direct Investment and its Impact on Indian Economy
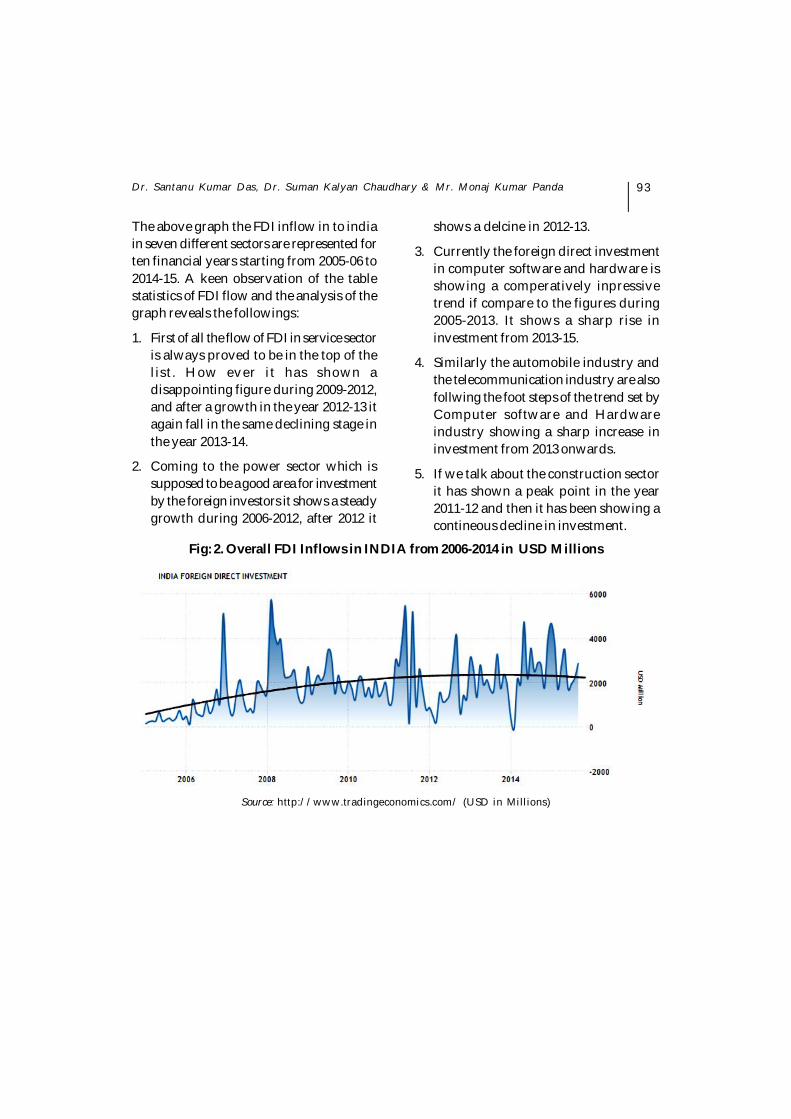
93
The above graph the FDI inflow in to indiain seven different sectors are represented forten financial years starting from 2005-06 to2014-15. A keen observation of the tablestatistics of FDI flow and the analysis of thegraph reveals the followings:
1. First of all the flow of FDI in service sectoris always proved to be in the top of thelist. How ever it has shown adisappointing figure during 2009-2012,and after a growth in the year 2012-13 itagain fall in the same declining stage inthe year 2013-14.
2. Coming to the power sector which issupposed to be a good area for investmentby the foreign investors it shows a steadygrowth during 2006-2012, after 2012 it
shows a delcine in 2012-13.
3. Currently the foreign direct investmentin computer software and hardware isshowing a comperatively inpressivetrend if compare to the figures during2005-2013. It shows a sharp rise ininvestment from 2013-15.
4. Similarly the automobile industry andthe telecommunication industry are alsofollwing the foot steps of the trend set byComputer software and Hardwareindustry showing a sharp increase ininvestment from 2013 onwards.
5. If we talk about the construction sectorit has shown a peak point in the year2011-12 and then it has been showing acontineous decline in investment.
Fig: 2. Overall FDI Inflows in INDIA from 2006-2014 in USD Millions
Source: http://www.tradingeconomics.com/ (USD in Millions)
Dr. Santanu Kumar Das, Dr. Suman Kalyan Chaudhary & Mr. Monaj Kumar Panda

94
Table-2: Total FDI Flows in Equity Capital Components (amount USD Million)
Sl. No. Financial Year
Total FDI Flows (as per
international best practices)
%growth over previous year (in US$ terms)
Total FDI Flows (As per DIPP’s FDI data
base – equity capital components only)
% growth over previous year (in US$ terms)
1. 2000-01 4,029 - 2,463 - 2. 2001-02 6,130 (+) 52 % 4,065 ( + ) 65 % 3. 2002-03 5,035 (-) 18 % 2,705 ( - ) 33 % 4. 2003-04 4,322 (-) 14 % 2,188 ( - ) 19 % 5. 2004-05 6,051 (+) 40 % 3,219 ( + ) 47 % 6. 2005-06 8,961 (+) 48 % 5,540 ( + ) 72 % 7. 2006-07 22,826 (+) 155 % 12,492 (+ )125 % 8. 2007-08 34,843 (+) 53 % 24,575 ( + ) 97 % 9. 2008-09 41,873 (+) 20 % 31,396 ( + ) 28 % 10. 2009-10 (P) 37,745 (-) 10 % 25,834 ( - ) 18 % 11. 2010-11 (P) 34,847 (-) 08 % 21,383 ( - ) 17 % 12. 2011-12 (P) 46,556 (+) 34 % 35,121 (+) 64 % 13. 2012-13 (P) 34,298 (-) 26% 22,423 (-) 36 % 14 2013-14 (P) 36,046 ( + ) 5% 24,299 (+) 8% 15. 2014-15 (P) 44,877 ( + ) 24% 30,931 (+) 27%
Source: http://dipp.nic.in/English/Publications/FDI_Statistics/2015/india_FDI_March2015.pdf(P): Figures for the years 2009-10 to 2014-15 are provisional subject to reconciliation with RBI.
Fig-3: Total FDI Flows in Equity Capital Components (amount USD Million)
An Analysis of Foreign Direct Investment and its Impact on Indian Economy

95
The above figure shows the overall pictureof the foreign direct investment in all thesectors put together. The analysis of thetrend reveals that the investment iscontinuously rising but the magnitude ofincrease is not that impressive. It is inferredthat some sectors are outperforming and theoverall impact is neutralizing where as theother sectors performance is bad. Whatevermay be the reason, one thing is clear fromthe above graph that the overall increase inFDI investment is possible only if each andevery individual sector has given specialattention.
The above graph shows the trends of totalFDI flow as per international best practicesand as per DIPP's FDI data Base-Equitycapital componants only. Both the graphsare moving in a similar direction showinga good correlation between both thestatistics. The total FDI flow up to 2008-09was exceptionally good. However, it hasshown a great degree of fluctuation in theperiod form 2009 to 2015. In the year 2011-12 it has touched the highest point ever inthe history of FDI flow in india.
Review of literature:
Nayak D.N (2004) in his paper "CanadianForeign Direct Investment in India: SomeObservations", analyse the patterns andtrends of Canadian FDI in India. He findsout that India does not figure very much inthe investment plans of Canadian firms.The reasons for the same is the indifferentattitude of Canadians towards India andlack of information of investmentopportunities in India are the importantcontributing factor for such an unhealthytrends in economic relation between Indiaand Canada. He suggested some measures
such as publishing of regular documentslike newsletter that would highlightopportunities in India and a detailed focuson India's area of strength so that Canadianfirms could come forward and discuss theirareas of expertise would got long way inenhancing Canadian FDI in India.
Balasubramanyam V.N Sapsford Davi(2007) in their article "Does India need a lotmore FDI" compares the levels of FDIinflows in India and China, and found thatFDI in India is one tenth of that of china.The paper also finds that India may notrequire increased FDI because of thestructure and composition of India'smanufacturing, service sectors and herendowments of human capital. Therequirements of managerial andorganizational skills of these industries aremuch lower than that of labour intensiveindustries such as those in China. Also,India has a large pool of well - Trainedengineers and scientists capable of adaptingand restructuring imported know - how tosuit local factor and product marketcondition all of these factors promoteeffective spillovers of technology and know-how from foreign firms to locally own firms.The optimum level of FDI, which generatessubstantial spillovers, enhances learningon the job, and contributes to the growth ofproductivity, is likely to be much lower inIndia than in other developing countriesincluding China. The country may needmuch larger volumes of FDI than it currentlyattracts if it were to attain growth rates inexcess of 10 per cent per annum. Finally,they conclude that the country is now in aposition to unbundle the FDI packageeffectively and rely on sources other thanFDI for its requirements of capital.
Dr. Santanu Kumar Das, Dr. Suman Kalyan Chaudhary & Mr. Monaj Kumar Panda

96
Naga Raj R (2003) in his article "ForeignDirect Investment in India in the 1990s:Trends and Issues" discusses the trends inFDI in India in the 1990s and compare themwith China. The study raises some issues onthe effects of the recent investments on thedomestic economy. Based on the analyticaldiscussion and comparative experience, thestudy concludes by suggesting a realisticforeign investment policy.
Morris Sebastian (1999) in his study"Foreign Direct Investment from India: 1964-83" studied the features of Indian FDI andthe nature and mode of control exercised byIndians and firms abroad, the causal factorsthat underlie Indian FDI and their specificstrengths and weaknesses using data fromgovernment files. To this effect, 14 casestudies of firms in the textiles, paper, lightmachinery, consumer durables and oilindustry in Kenya and South East Asia arepresented. This study concludes that theindigenous private corporate sector is themajor source of investments. The currentregime of tariff and narrow export policyare other reasons that have motivatedmarket seeking FDI. Resources seeking FDIhas started to constitute a substantialportion of FDI from India. Neither the"advantage concept" of Kindlebrger, nor theconcept of large oligopolies trying to retaintheir technological and monopoly powerinternationally of Hymer and Vaitsos arerelevant in understanding Indian FDI, andhence are not truly general forces thatunderlie FDI. The only truly general force isthe inexorable push of capital to seekmarkets, whether through exports or whenconditions at home put a brake onaccumulation and condition abroad permitits continuation.
Nirupam Bajpai and Jeffrey D. Sachs (2006)in their paper "Foreign Direct Investment inIndia: Issues and Problems", attempted toidentify the issues and problems associatedwith India's current FDI regimes, and moreimportantly the other associated factorsresponsible for India's unattractiveness asan investment location. Despite Indiaoffering a large domestic market, rule of law,low labour costs, and a well workingdemocracy, her performance in attractingFDI flows have been far from satisfactory.
The conclusion of the study is that arestricted FDI regime, high import tariffs,exit barriers for firms, stringent labor laws,poor quality infrastructure, centralizeddecision making processes, and a verylimited scale of export processing zonesmake India an unattractive investmentlocation.
Kulwinder Singh (2005) in his study"Foreign Direct Investment in India: ACritical analysis of FDI from 1991-2005"explores the uneven beginnings of FDI, inIndia and examines the developments(economic and political) relating to thetrends in two sectors: industry andinfrastructure. The study concludes that theimpact of the reforms in India on the policyenvironment for FDI presents a mixedpicture. The industrial reforms have gonefar, though they need to be supplementedby more infrastructure reforms, which are acritical missing link.
Chandan Chakraborty, Peter Nunnenkam(2004) in their study "Economic Reforms,FDI and its Economic Effects in India"assess the growth implications of FDI inIndia by subjecting industry - specific FDIand output data to Granger causality tests
An Analysis of Foreign Direct Investment and its Impact on Indian Economy

97
within a panel co -integration framework.It turns out that the growth effects of FDIvary widely across sectors. FDI stocks andoutput are mutually reinforcing in themanufacturing sector. In sharp contrast, anycausal relationship is absent in the primarysector. Most strikingly, the study finds onlytransitory effects of FDI on output in theservice sector, which attracted the bulk ofFDI in the post - reform era. These differencesin the FDI - Growth relationship suggest thatFDI is unlikely to work wonders in India ifonly remaining regulations were relaxedand still more industries opened up o FDI.
Basu P., Nayak N.C, Vani Archana (2007)in their paper "Foreign Direct Investment inIndia: Emerging Horizon", intends to studythe qualitative shift in the FDI inflows inIndia in - depth in the last fourteen odd yearsas the bold new policy on economic frontmakes the country progress in both quantityand the way country attracted FDI. It revealsthat the country is not only cost - effectivebut also hot destination for R&D activities.The study also finds out that R&D as asignificant determining factor for FDIinflows for most of the industries in India.The software industry is showing intensiveR&D activity, which has to be channelizedin the form of export promotion forpenetration in the new markets. The studyalso reveals strong negative influence ofcorporate tax on FDI inflows.
To sum up, it can be said that large domesticmarket, cheap labour, human capital, arethe main determinants of FDI inflows toIndia , however, its stringent labour laws,poor quality infrastructure, centralizedecision making processes, and a verylimited numbers of SEZs make India anunattractive investment location.
Significance of the Study:
One of the most striking developmentsduring the last two decades is thespectacular growth of FDI in the globaleconomic landscape. It is one of the fastestgrowing strategic activities thatcorporations are pursing around the world.Foreign Direct Investment (FDI) is fund flowbetween the countries in the form of inflowor outflow by which one can exploit theopportunity enhance the productivity andfind out better position throughperformance. In simple terms it is the directinvestment by a corporation in a commercialventure in another country. Theeffectiveness and efficiency depends uponthe investor's perception. If investment witha purpose of long-term then it is contributespositively towards economy. On the otherhand if it is for short-term for the purpose ofmaking profit then it may be less significant.Depending upon the industry sector andtype of business a Foreign Direct Investmentmay be an attractive and viable option.
Objectives of the Research:
This paper is intended to achieve thefollowing objectives.
a) To determine the trend of FDI in Indiafor the past as well as the coming years.
b) To analyze the sectors attracting the FDI.
c) To know the relation between FDI andthe various economic indicators.
Research Methodology:
In this research paper, the research designis descriptive in nature. The historical datahas been collected from the various sourceswhich are secondary in nature. The researchpaper is mainly based on secondary data
Dr. Santanu Kumar Das, Dr. Suman Kalyan Chaudhary & Mr. Monaj Kumar Panda
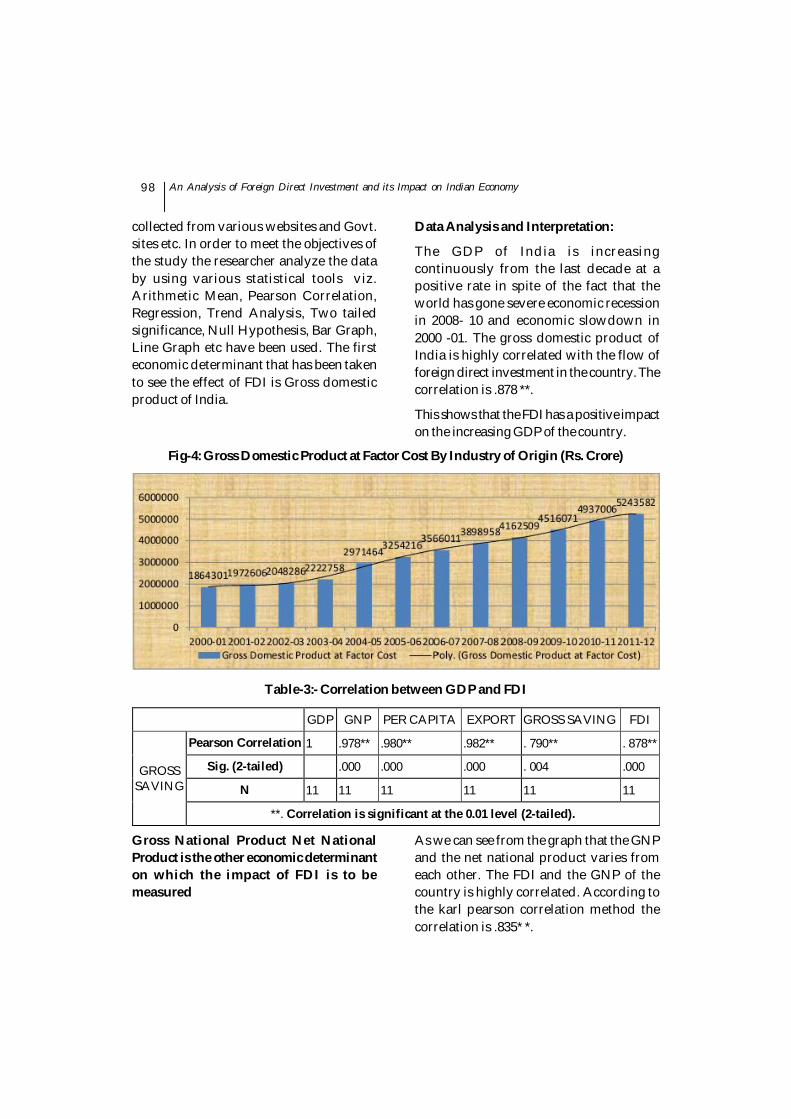
98
collected from various websites and Govt.sites etc. In order to meet the objectives ofthe study the researcher analyze the databy using various statistical tools viz.Arithmetic Mean, Pearson Correlation,Regression, Trend Analysis, Two tailedsignificance, Null Hypothesis, Bar Graph,Line Graph etc have been used. The firsteconomic determinant that has been takento see the effect of FDI is Gross domesticproduct of India.
Fig-4: Gross Domestic Product at Factor Cost By Industry of Origin (Rs. Crore)
Table-3:- Correlation between GDP and FDI
GDP GNP PER CAPITA EXPORT GROSS SAVING FDI
GROSS SAVING
Pearson Correlation 1 .978** .980** .982** . 790** . 878**
Sig. (2-tailed) .000 .000 .000 . 004 .000
N 11 11 11 11 11 11
**. Correlation is significant at the 0.01 level (2-tailed).
Data Analysis and Interpretation:
The GDP of India is increasingcontinuously from the last decade at apositive rate in spite of the fact that theworld has gone severe economic recessionin 2008- 10 and economic slowdown in2000 -01. The gross domestic product ofIndia is highly correlated with the flow offoreign direct investment in the country. Thecorrelation is .878 **.
This shows that the FDI has a positive impacton the increasing GDP of the country.
Gross National Product Net NationalProduct is the other economic determinanton which the impact of FDI is to bemeasured
As we can see from the graph that the GNPand the net national product varies fromeach other. The FDI and the GNP of thecountry is highly correlated. According tothe karl pearson correlation method thecorrelation is .835* *.
An Analysis of Foreign Direct Investment and its Impact on Indian Economy

99
Fig-5. Gross National Product & Net National Product at Factor Cost (Rs. Crore)- At Current Prices
Table-4:-Correlation between GNP and FDI
GDP GNP PER CAPITA EXPORT GROSS SAVING FDI
GNP
Pearson Correlation .978** 1 1.000** .991** .832** .835**
Sig. (2-tailed) .000 .000 .000 . 001 .001
N 11 11 11 11 11 11
**. Correlation is significant at the 0.01 level (2-tailed).
The next economic factor is Per Capita NetNational Product in Rupees at CurrentPrices
As we can see the per capita income of thecountry is raising at a very high rate. Whilethe world was facing the great economic
recession in India the per capita income wasraising at a very faster rate. This leads to theattraction for the foreign investment. Fromthe correlation table it is significant that boththese factors are very highly correlated.
Fig-6: Per Capita Net National Product in Rs. At Current Prices
Dr. Santanu Kumar Das, Dr. Suman Kalyan Chaudhary & Mr. Monaj Kumar Panda

100
Table-5: Correlation between Per Capital Income and FDI
GDP GNP PER CAPITA EXPORT GROSS SAVING FDI
Per Capita
Pearson Correlation .980** 1.000** 1 .992** .831** .840**
Sig. (2-tailed) .000 .000 .000 . 002 .001
N 11 11 11 11 11 11
**. Correlation is significant at the 0.01 level (2-tailed).
Fig-7: Exports (Including Re-Export) In Rs. Crore
Table-6: Correlation between Export and FDI
GDP GNP PER CAPITA EXPORT GROSS SAVING FDI
EXPORT
Pearson Correlation .982** .991** .992** 1 .804** .883**
Sig. (2-tailed) .000 .000 . 000 . 003 .000
N 11 11 11 11 11 11
**. Correlation is significant at the 0.01 level (2-tailed).
Exports (Including Re-Export) In Rs. Crore.
As export is the greatest factor for thegrowth of any economy. Increasing exportresemble the economy which is growing.The foreign investment done in varioussector leads to higher production due to
increased technology and with lesser laborcost the per unit cost decreases which leadsto better Export. The FDI and EXPORT gotogether for any economy. We can see fromthe correlation table that both theseeconomic factors highly correlated witheach other.
An Analysis of Foreign Direct Investment and its Impact on Indian Economy

101
Fig-8: Gross Domestic Saving (household/Private Corporate And Public)
Table-7: Correlations between gross saving and FDI
GDP GNP PER CAPITA EXPORT GROSS SAVING FDI
GROSS SAVING
Pearson Correlation .790** .832** .831** .804** 1 .597
Sig. (2-tailed) .004 .001 .002 .003 .053
N 11 11 11 11 11 11
**. Correlation is significant at the 0.01 level (2-tailed).
Gross Domestic saving (Household/Private Corpora e & Public) is the factorbased on which the strength of an economyis to be considered. As the savings of thecommon people rises the economy leads tosituation where people are earning morethan their daily necessities. So it veryimportant economic factor of any countrywhich shows the extra income generated
by the people of the country. In India wecan see that it is increasing at very goodrate. The relation between foreigninvestment and the savings is once againcorrelated. It shows as the investment risesin the country the opportunity for extraincome (more than the daily householdnecessities) increases.
Dr. Santanu Kumar Das, Dr. Suman Kalyan Chaudhary & Mr. Monaj Kumar Panda

102
Table-8 : Correlations
GDP GNP PER CAPITA EXPORT GROSS SAVING FDI
GDP
Pearson Correlation 1 .978** .980** .982** .790** .878**
Sig. (2-tailed) .000 .000 .000 .004 .000 N 11 11 11 11 11 11
GNP
Pearson Correlation .978** 1 1.000** .991** .832** .835**
Sig. (2-tailed) .000 .000 .000 .001 .001 N 11 11 11 11 11 11
PER CAPITA
Pearson Correlation .980** 1.000** 1 .992** .831** .840**
Sig. (2-tailed) .000 .000 .000 .003 .000 N 11 11 11 11 11 11
EXPORT
Pearson Correlation .982** .991** .992** 1 .804** .883**
Sig. (2-tailed) .000 .000 .000 .003 .000 N 11 11 11 11 11 11
GROSS SAVING
Pearson Correlation .790** .832** .831** .804** 1 .597
Sig. (2-tailed) .004 .001 .002 .003 .053 N 11 11 11 11 11 11
FDI
Pearson Correlation .878** .835** .840** .883** .597 1
Sig. (2-tailed) .000 .001 .001 .000 .053 N 11 11 11 11 11 11
**. Correlation is significant at the 0.01 level (2-tailed)
CONCLUSION
India's Foreign Direct Investment (FDI) policyhas been gradually liberalised to make themarket more investor friendly. The resultshave been encouraging. These days thecountry is consistently ranked among the topthree global investment destinations by allinternational bodies including the WorldBank according to a United Nations (UN)report. For Indian economy which has
tremendous potential FDI has had a positiveimpact. FDI inflow supplements domesticcapital as well as technology and skills ofexisting companies. It also helps to establishnew companies. All of these contribute toeconomic growth of the Indian Economy.India is definitely a lucrative place for FDIbut there are certainly some challenges andareas for improvement still present. Untilthese areas are honed to perfection India willnot become the number one place for FDI.
An Analysis of Foreign Direct Investment and its Impact on Indian Economy

103
REFERENCESBalasubramanyam V.N Sapsford David (2007)
"Does India need a lot more FDI"Economic and Political Weekly,pp.1549-1555.
Basu P. Nayak N.C Archana (2007) "ForeignDirect Investment in India: EmergingHorizon" Indian Economic Review, Vol.XXXXII, No.2, pp. 255-266.
Brimble Peter (2002) The Foreign DirectInvestment: Performance andAttraction The Case of Thailand 2002.Workshop on Foreign DirectInvestment: Opportunities andChallenges for Cambodia Laos andVietnam in Hanoi August.
Chandan Chakraborty Peter Nunnenkamp(2006) "Economic Reforms FDI and itsEconomic Effects in India"w w w . i i p m t h i n k t a n k . c o m /publications/archieve.
Department of Industrial Policy & Promotion.(n.d.). Retrieved may 20 2015 fromdipp.nic.in .
Eichengreen Barry and Hui Tong (2005) 'IsChina's FDI coming at the Expense ofOther Countries'? NBER Working PaperNo. 11335 May.
Fortanier Fabienne (2001) Foreign DirectInvestment and SustainableDevelopment OECD November.
Fung K.C. HitomiIizaka Sarah Tong (2002)Foreign Direct Investment in China:Policy Trend and Impact IMF WorkingPaper No.74
http://commerceduniya.com/2013/01/15/fdi-inflow-list-of-sectors-where-fdi-is-allowed-in-india
h t t p : / / w w w . r b i . o r g . i n / s c r i p t s /bs_viewcontent.aspx?Id=2513
Jenkins Carolyn and Lynne Thomas (2002)Foreign Direct Investment in SouthernAfrica: Determinants Characteristicsand Implications for Economic Growthand Poverty Alleviation' October.
Kearney A.T. (2010) "A. T. Kearney GlobalManagement Consultants : ExpandingOpportunities for Global Retailers 'The2010 A.T. Kearney Global RetailDevelopment Index'.
Kulwinder Singh (2005) "Foreign DirectInvestment in India: A Critical analysisof FDI from 1991-2005" papers.ssrn.com/sol3/papers. cfm_id_822584.
Lapse Robert E. (2007) 'Defining and Measuringthe Location of FDI Output' NBERWorking Paper No. 12996 March.
Long Guoqiang (2005) 'China's Policies on FDI:Review and Evaluation' In Does ForeignDirect Investment PromoteDevelopment? eds . Moran TheodoreH Edward M. Graham and MagnusBlomström Institute of InternationalEconomics.
Morris Sebastian (1990) "Foreign DirectInvestment from India: 1964-83"Economic and Political Weekly Vol.31 pp. 2314-2331.
NagaRaj R (2003) "Foreign Direct Investmentin India in the 1990s: Trends and Issues"Economic and Political Weeklypp.1701-1712.
Nayak D.N (1999) "Canadian Foreign DirectInvestment in India: SomeObservations" Political EconomyJournal of India Vol 8 No. 1 pp. 51-56.
Piteli Eleni E. N. (2010) Determinants ofForeign Direct Investment inDeveloped Countries: A Comparisonbetween European and Non-EuropeanCountries Contributions to PoliticalEconomy Vol. 29, pp.111-128.
RajanRamkishen S. Sunil Rongala and RamyaGhosh (2008) 'Attracting Foreign DirectInvestment (FDI) to India' April.
http://commerceduniya.com/2013/01/15/fdi-inflow-list-of-sectors-where-fdi-is-allowed-in-india.
h t t p : / / w w w . r b i . o r g . i n / s c r i p t s /bs_viewcontent.aspx?Id=2513.
Dr. Santanu Kumar Das, Dr. Suman Kalyan Chaudhary & Mr. Monaj Kumar Panda

COMPARATIVE ANALYSIS OF MUTUAL FUNDS/SCHEMES AMONGST THE REGIONS OFAMERICAS, ASIA - PACIFIC AND EUROPE - AFRICA
- MIDDLE EAST
*Assistant Professor, Department of Management Studies, Andhra University Campus, Tadepalligudem,West Godavari-District-AP-India. He can be reached at [email protected].
Dr. K. Kanaka Raju*
INTRODUCTION
It is a non-depository or non bankingfinancial intermediary which acts animportant vehicle for bringing wealthholders and deficit units together indirectly.Mutual funds are corporation which acceptdollars from savers and then use thesedollars to buy stocks, long term bonds, shortterm debt instruments issued by businessor government units, these corporationspool funds and thus reduce risk bydiversification. The mutual funds availablein the form of income fund, Money MarketFunds, Balanced Funds, Specialized funds,leveraged funds, dual purpose fund, Real
estate fund, performance funds, andSpecialty funds are constituted as aportfolio classification of mutual funds. Thefunctional classification of funds consistsof open-end fund and close-end fund. Thegeographical classification of mutual fundsconsists of domestic mutual funds andoffshore mutual fund. The main advantageof mutual funds, reduce the risk specificallyfor small investors through thediversification, economies of scale intransaction cost and professional financemanagement. The other benefits arediversified investment, revolving nature ininvestments. The holders of mutual funds
ABSTRACTMutual funds are useful to capital formation. The main objectives of this paper are to test whether thereis any significant difference from one region to another region in terms of number of mutual funds aswell as the total net assets value. The SPSS 16.0 version was applied to derive the results by applyingthe techniques of paired sample statistics, paired samples correlations and paired samples test. Thestudy found that the number of mutual funds as well as total net assets of one region to another regionwas positively correlated. The Europe - Africa - Middle East holding higher number of mutual funds/schemes followed by the Americas and Asia - Pacific. The higher total net assets owned by the Europe -Africa - Middle East followed by the Asia - Pacific and Americas, due to concentration of higher numberof countries or stock exchanges were prevailing with the available market. Hence it is suggested tostrengthen the total net assets value of mutual funds to view a better capital formation in all thecountries which is useful to develop the world.
Key Words : Number of Mutual Funds, Total Net assets value, Americas, Asia - Pacific and Europe -Africa - Middle East.
The Utkal Business ReviewDecember, 2015, Vol - XXIX, pp.-104-113

105
procured returns in the form of dividends,capital gains, increase or decrease in netasset value and sale shares and purchaseof mutual funds. The concept of mutualfund originated in Britain during the 19thcentury and spread across the EuropeanNations. In United States of America theconcept of mutual fund attract the attentionof investment professionals around thebeginning of the twentieth century.
The mutual funds sell their shares to publicand redeem at Current Net Asset Value(CNAV) of shares which is calculated asfollows
NAV = Total market value of all mutualfund holdings -Liabilities/ No of fundsoutstanding shares
The holding period return (HPR) ismeasured as follows
HPR = Income from Charge + Interest orCapital or Cash gains or dividend +disbursements/ NAV at beginning ofperiod.
The sharpe's index is applied to determinethe efficiency of mutual funds as it takes therisk and return of investment.
Sharpe's Index = Portfolio Return -Risklessrate of return/ standard deviation
Treynor Index = Portfolio Return -Risklessrate of return/ Beta
Jensen's Index = Risk -free rate+(MarketRate of Return-Risk free rate)X Beta.
Review of Literature: Laura T. Starks(2015) opined that actively managed fundsare more active and charge lower fees whenthey face more competitive pressure fromlow-cost explicitly indexed funds. Overall,
our evidence suggests that explicit indexingimproves competition in the mutual fundindustry. William G. Droms andDavid A.Walker, (2014) concluded that risk-adjustedand unadjusted investment returns are notrelated to whether a fund is load or no-load,and asset size, expense ratios, and turnoverrates are not related to investmentperformance. They emphasized thatperformance is not affected by fund size,given the explosive growth of internationalmutual funds Zoran Ivkovi (2009)emphasized on Socially responsible mutualfunds have shown an increase both in totalnet assets and in number of investors; butthe sector is by far behind the United States.Chiulien C. Venezia, v (2007) Opined thathigher degree of market concentrationalways associates with poor performance,a fund's market share becomes larger, thenegative influence on fund performance ofmarket concentration will get stronger. Thesmaller a fund's market share the strongernegative impact on fund performance ofmarket concentration, suggesting thatmutual funds endowed with too weak ortoo strong market power can erode theirperformance. Miranda Detzler,JamesWiggins (1997) said that internationalmutual funds allow individual investors todiversify abroad at a reasonable cost. Theactive international funds provide globaldiversification of benefits. OverviewGraciela L. Kaminsky, Richard K. Lyonsand Sergio L. Schmukler, opined thatinternational mutual funds are keycontributors to the globalization of financialmarkets and one of the main sources ofcapital flows to emerging economies. Dueto large redemptions and injections, funds'flows are not stable. Withdrawals from
Dr. K. Kanaka Raju

106
emerging markets during recent crises werelarge, which is consistent with the evidenceon financial contagion's of the mutual fundindustry devoted to screened funds.
Research problem : Is there any significantdifference from one region (America to Asia- Pacific, Asia - Pacific to Europe - Africa -Middle East, Europe - Africa - Middle Eastto Americas) to another region in terms ofmutual funds/ schemes.
Objectives of the Study: Based on theresearch problem the following objectiveshave adopted
1) To test whether there is any significantdifference from one region of world toanother region of world in terms ofmutual funds and schemes.
2) To know relationship between mutualfunds of one geography of worldgeography of world.
3) To offer a suitable suggestions to viewthe better performance of mutual funds.
Methodology of the Study : The datacollected from the SEBI, Hand book statisticsof 2013, PP 239, as a source of InvestmentCompany Institute. The data obtained fromthe year 2005 to 2013 regarding worldwidenumber of mutual funds/ schemes. For thispurpose all countries are divided intoAmericas, Asia - Pacific and Europe - Africa- Middle East .Region of Americas consistsof Argentina, Brazil, Canada, Chile, CostaRica, Mexico, United States. The aggregationof mutual funds in all the countries of aparticular concern to the total number ofmutual funds of America's in a particularyear. The Asia - Pacific region consists ofChina, Japan, Korea Rep, Newzeland,Pakistan , Philippines and Taiwan. The
Europe - Africa - Middle East comprisesAustria, Belgium, Czech Republic,Denmark, Finland, France, Germany,Greece, Hungary, Ireland, Italy,Liechtenstein, Luxembourg, Netherlands,Norway, Poland, Portugal, Romania,Russia, Slovakia, Slovenia, Spain, Sweden,Switzerland, Turkey, United Kingdom andSouth Africa. The aggregation of all thesecountries mutual funds equaling to themutual funds of the Europe - Africa - MiddleEast. The data are as of September 2013. Thesame application available for the total netassets of mutual funds (Hand BookStatistics of SEBI, PP 240). Techniques : TheSPSS 16.0 version was applied to derive theresults. The paired sample tests, pairedsamples correlations and paired samplestatistics applied to infer the results.
Formation of Hypothesis:
Hypothesis -1 :
Null Hypothesis (Ho) : There is nosignificant difference between number ofmutual funds of Americas to number ofmutual funds of Asia - Pacific.
Alternative Hypothesis (Ha) : There is asignificant difference between number ofmutual funds of Americas to number ofmutual funds of Asia - Pacific.
Hypothesis -2 :
Null Hypothesis (Ho) : There is nosignificant difference between number ofmutual funds of Asia - Pacific to Europe -Africa - Middle East.
Alternative Hypothesis (Ha): There is asignificant difference from number ofmutual funds of Asia - Pacific to number ofmutual funds of Europe - Africa - MiddleEast.
Comparative analysis of Mutual Funds / Schemes amongst the Regions of Americas...

107
Hypothesis -3 :
Null Hypothesis (Ho) : The is no significantdifference from number of mutual funds ofEurope - Africa - Middle East to number ofmutual funds of Americas.
Alternative Hypothesis (Ha) : There is asignificant difference from number ofmutual funds of Europe - Africa - MiddleEast to number of mutual funds of Americas.
Hypothesis-4 :
Null Hypothesis (Ho) : There is nosignificant difference regarding total netassets mutual funds of Americas to the totalnet assets of mutual funds of Asia-Pacific.
Alternative Hypothesis (Ha) : There is asignificant difference regarding total netassets of mutual funds of Americas to thetotal net assets of mutual funds of Asia -Pacific.
Hypothesis-5 :
Null Hypothesis (Ho) : There is nosignificant difference from total net assetsof mutual funds of Asia - Pacific to the totalnet assets of mutual funds of Europe - Africa- Middle East.
Alternative Hypothesis (Ha) : There is asignificant difference from total net assetsof mutual funds of Asia - Pacific to the totalnet assets of mutual funds of Europe - Africa- Middle East.
Hypothesis-6 :
Null Hypothesis (Ho) : There is nosignificant difference from total net assetsof mutual funds of Europe - Africa - MiddleEast to total net assets of mutual funds ofAmericas.
Alternative Hypothesis (Ha) : There is asignificant difference from total net assetsof mutual funds of Europe - Africa - MiddleEast to total net assets of mutual funds ofAmericas.
Input Table 1: Information RegardingWorld Wide Number of Mutual Funds/Schemes Regarding Various Countries ofDifferent Regions in the World from theYear 2005-2013.
Name of the Region in the World
Year Americas Asia-Pacific Europe-Africa-Middle East
2005 13763.0 10973.0 30677.0
2006 14475.0 11912.0 33901.0
2007 15460.0 13130.0 36041.0
2008 16459.0 14358.0 37583.0
2009 16918.0 14205.0 35718.0
2010 17984.0 14605.0 36145.0
2011 19763.0 15518.0 36509.0
2012 21061.0 16011.0 35754.0
2013 21577.0 17236.0 35603.0
Source : Investment Company Institute: SEBI, HandBook Statistics of 2013,pp:240.
Input Table -1 : This table reveals that worldnumber of mutual funds/schemesregarding various countries of differentregions (Americas, Asia-Pacific andEurope-Africa-Middle East) from the year2005 to 2013. The number of mutual fundshas been increasing from the year 2005 withreference to Americas, Asia - Pacific butmutual funds of Europe - Africa - MiddleEast had been increasing up to the year 2011and afterwards has been decreasing.
Dr. K. Kanaka Raju

108
Output Table -1 : Shows the paired samplesstatistics from one region to another region.,It reflected that mean value of Americanmutual funds were higher than that of Asia- Pacific implies that the more number ofmutual funds traded in Americas ratherthan Asia - Pacific like Europe - Africa -Middle East exceeds the Asia - Pacific aswell as the Americas. Hence it can beconcluded that more number of mutualfunds traded in Europe - Africa - MiddleEast, followed by Americas and Asia -Pacific.
Output Table 2: Paired Samples CorrelationsRegarding World Wide Number of MutualFunds/Schemes Regarding Various Countriesof Different Regions in the World from theYear 2005-2013.
N Correlation Sig.
Pair 1 Americas & Asia-Pacific 9 .967 .000
Pair 2 Asia-Pacific & Europe-Africa-Middle East 9 .679 .044
Pair 3 Europe-Africa-Middle East & Americas 9 .521 .150
Source : SPSS
Output Table -2 :This table discloses thatrelationship between numbers of mutualfunds traded from one region to anotherregion. The table tell us that very strongrelationship existed between mutual fundsof America's to mutual funds of Asia -Pacific and also suggested that there was asignificant difference between each other, italso revealed that the strong relationshipexisted from mutual funds of Asia - Pacificand Europe - Africa - Middle East, and themoderate relationship witnessed Europe'straded mutual funds to the Middle East,America's Mutual funds. Finally it waswitnessed that Asia - Pacific's mutual fundsestablished very strong relationship withAmerica's mutual funds, strongrelationship with Europe - Africa - MiddleEast.
Out Put Table 1: Paired Samples Statistics Regarding World Wide Number of Mutual Funds/Schemes Regarding Various Countries of Different Regions in the World from the Year 2005-2013.
Mean N Std. Deviation Std. Error Mean
Pair 1 Americas 1.7496E4 9 2814.19829 938.06610
Asia-Pacific 1.4216E4 9 1975.28777 658.42926
Pair 2 Asia-Pacific 1.4216E4 9 1975.28777 658.42926
Europe-Africa-Middle East 3.5326E4 9 1991.63645 663.87882
Pair 3 Europe-Africa-Middle East 3.5326E4 9 1991.63645 663.87882
Americas 1.7496E4 9 2814.19829 938.06610
Source : SPSS
Comparative analysis of Mutual Funds / Schemes amongst the Regions of Americas...

109
Hypothesis -1 :
Null Hypothesis (Ho) : There is nosignificant difference between number ofmutual funds of Americas to number ofmutual funds of Asia - Pacific.
Alternative Hypothesis (Ha) : There is asignificant difference between number ofmutual funds of Americas to number ofmutual funds of Asia - Pacific.
Analysis : The Value of t was 9.506 at dfwas 8 and significant value was 0.000,hence it can be concluded that the proposednull hypothesis was rejected and alternativehypothesis was accepted and inferred thatthere was a significant difference frommutual funds of America's to the mutualfunds of Asia - Pacific.
Hypothesis -2 :
Null Hypothesis (Ho) : There is nosignificant difference between number ofmutual funds of Asia - Pacific to Europe -Africa - Middle East.
Alternative Hypothesis (Ha): There is asignificant difference from number of mutualfunds of Asia - Pacific to number of mutualfunds of Europe - Africa - Middle East.
Analysis : This table shows that the valueof t was -39.833 at df was 8 and significantvalue was 0.000, hence, it can be inferredthat proposed null hypothesis was rejectedand concluded that there was a significantdifference from mutual funds of Asia -Pacific region to the mutual funds of Europe- Africa - Middle East.
Hypothesis -3 :
Null Hypothesis (Ho) : The is no significantdifference from number of mutual funds ofEurope - Africa - Middle East to number ofmutual funds of Americas.
Alternative Hypothesis (Ha) : There is asignificant difference from number ofmutual funds of Europe - Africa - MiddleEast to number of mutual funds of Americas.
Analysis : This table tells us that the valueof t was 21.760 at df was 8 and significantat 0.000, hence it confirmed that proposednull hypothesis was rejected and alternativehypothesis was accepted and came to knowthat there was a significant difference fromEurope mutual funds to Middle - East -America's mutual funds.
Out Put Table 3: Paired Samples Test Regarding World Wide Number of Mutual Funds/SchemesRegarding Various Countries of Different Regions in the World from the Year 2005-2013.
Paired Differences
t df Sig. (2-tailed) Mean Std.
Deviation Std. Error
Mean
95% Confidence Interval of the Difference
Lower Upper
Pair 1 Americas - Asia-Pacific 3.27911E3 1034.88278 344.96093 2483.62979 4074.59243 9.506 8 .000
Pair 2 Asia-Pacific - Europe-Africa-Middle East -2.11092E4 1589.83118 529.94373 -22331.27465 -19887.16979 -39.833 8 .000
Pair 3 Europe-Africa-Middle East - Americas 1.78301E4 2458.18558 819.39519 15940.58240 19719.63982 21.760 8 .000
Source : SPSS
Dr. K. Kanaka Raju

110
Input Table 2 : Information Regarding TotalNet Assets of Mutual Funds/SchemesRegarding Various Countries of DifferentRegions in the World from the Year 2005-2013.
Name of the Region in the World
Year Americas Asia-Pacific Europe-Africa-
Middle East
2005 2006 2007 2008 2009 2010 2011 2012 2013
9750205 11470489 13423909 10581943 12579987 13581058 13518371 15133487 16458588
1438188.0 1767218.0 2751322.0 1974731.0 2584950.0 2955902.0 2833757.0 3207709.0 3232532.0
6067904.0 7881903.0 9030082.0 6300307.0 7651540.0 8044147.0 7344851.0 8374729.0 9084985.0
Source : Investment Company Institute: SEBI, HandBook Statistics of 2013, pp:240.
Input Table -2 : This table discloses theinformation of total net assets value ofmutual funds/ schemes, from the year 2005to 2013. The table reflects that the mixedresponse from the total net assets of thedifferent regions.
OutPut Table 4: Paired Samples StatisticsRegarding Total Net Assets of Mutual Funds/Schemes Regarding Various Countries ofDifferent Regions in the World from the Year2005-2013.
Mean N Std. Deviation
Std. Error Mean
Pair 1 Americas 1.2944E7 9 2.12708E6 7.09025E5 Asia-Pacific 2.5274E6 9 6.48137E5 2.16046E5
Pair 2 Asia-Pacific 2.5274E6 9 6.48137E5 2.16046E5 Europe-Africa-Middle East 7.7534E6 9 1.06183E6 3.53942E5
Pair 3 Europe-Africa-Middle East 7.7534E6 9 1.06183E6 3.53942E5
Americas 1.2944E7 9 2.12708E6 7.09025E5
Source: SPSS
Output Table -4 :This table reflects that thetotal net assets of Asia - Pacific were morethan that of total net assets of America's andthe net assets of Europe - Africa - MiddleEast higher than that of Asia - Pacific aswell as the America's. Hence it can beconcluded that higher amount of total netassets of mutual funds owned by theEurope - Africa - Middle East, followed byAsia Pacific and America's.
OutPut Table 5: Paired Samples CorrelationsRegarding Total Net Assets of Mutual Funds/Schemes Regarding Various Countries ofDifferent Regions in the World from the Year2005-2013.
N Correlation Sig.
Pair 1 Americas & Asia-Pacific 9 .944 .000
Pair 2 Asia-Pacific & Europe-Africa-Middle East
9 .760 .018
Pair 3 Europe-Africa-Middle East & Americas
9 .845 .004
Source: SPSS
Output Table -5 :This table tell us that therelationship between two net assets ofmutual funds of two different regions. Itreveals that there was a very strongrelationship from total net assets ofAmerica's to the total net assets of Asia -Pacific and from total net assets of Europe -Africa - Middle East America's and strongrelationship existed between total net assetsof Asia - Pacific to the total net assets ofEurope - Africa - Middle East. Hence it waswitnessed that total net assets of one regionto another region was positively correlated.
Comparative analysis of Mutual Funds / Schemes amongst the Regions of Americas...

111
Hypothesis-4 :
Null Hypothesis (Ho) : There is nosignificant difference regarding total netassets mutual funds of Americas to the totalnet assets of mutual funds of Asia-Pacific.
Alternative Hypothesis (Ha) : There is asignificant difference regarding total netassets of mutual funds of Americas to thetotal net assets of mutual funds of Asia -Pacific.
Analysis : This table reveals that the valueof t was 20.418 at df was 8 and significantvalue was 0.000, hence it came to know thatthe proposed null hypothesis was rejectedand alternative hypothesis was acceptedand confirmed that there was a significantdifference from the total net assets ofAmerica's to the total net assets of Asia -Pacific.
Hypothesis-5 :
Null Hypothesis (Ho) : There is nosignificant difference from total net assetsof mutual funds of Asia - Pacific to the totalnet assets of mutual funds of Europe - Africa- Middle East.
Alternative Hypothesis (Ha) : There is asignificant difference from total net assetsof mutual funds of Asia - Pacific to the totalnet assets of mutual funds of Europe - Africa- Middle East.
Analysis : This table depicts that the valueof t was -22.128 at df was 8 and significantvalue was 0.000, hence it came to know thatproposed null hypothesis was rejected andconcluded that there was a significantdifference from the total net assets of Asia -Pacific to the total net assets of the Europe -Africa - Middle East.
Hypothesis-6 :
Null Hypothesis (Ho) : There is nosignificant difference from total net assetsof mutual funds of Europe - Africa - MiddleEast to total net assets of mutual funds ofAmericas.
Alternative Hypothesis (Ha) : There is asignificant difference from total net assetsof mutual funds of Europe - Africa - MiddleEast to total net assets of mutual funds ofAmericas.
Analysis : This table represents that thevalue of t was -11.495 at df was 8 and
OutPutTable 6: Paired Samples Test Regarding Total Net Assets of Mutual Funds/SchemesRegarding Various Countries of Different Regions in the World from the Year 2005-2013.
Paired Differences
t df Sig. (2-tailed) Mean Std.
Deviation Std. Error
Mean
95% Confidence Interval of the Difference
Lower Upper
Pair 1 Americas - Asia-Pacific 1.04169E7 1.53057E6 5.10191E5 9.24036E6 1.15934E7 20.418 8 .000
Pair 2 Asia-Pacific - Europe-Africa-Middle East -5.22602E6 7.08500E5 2.36167E5 -5.77062E6 -4.68141E6 -22.128 8 .000
Pair 3 Europe-Africa-Middle East - Americas -5.19084E6 1.35471E6 4.51570E5 -6.23216E6 -4.14952E6 -11.495 8 .000
Source : SPSS
Dr. K. Kanaka Raju

112
significant value was 0.000, hence it wasobserved that the proposed null hypothesiswas rejected and confirmed that there wasa significant difference from the total netassets of Europe to the total net assets ofMiddle - East America's.
Finding of the Study :
The study observed the following findings,after interpretation of the results and issues.
1. The number of mutual funds has beenincreasing from the year 2005 withreference to region of Americas, Asia -Pacific but mutual funds of Europe -Africa - Middle East had been enhancedup to the year 2011 and afterwards havebeen decreasing, but occupied a highernumber of mutual funds than the othertwo.
2. The study found that Americas mutualfunds higher than the Asia - Pacific,Europe - Africa - Middle East mutualfunds higher than the Asia - Pacific aswell as Americas, then Europe - Africa -Middle East followed by the Americasand Asia - Pacific.
3. The study observed that there was astrong relationship existed betweennumbers of mutual funds of Americasto the number of mutual funds of theAsia - Pacific and there was a significantdifference between each other.
4. The study also observed that there wasa strong relationship between numberof mutual funds of Asia - Pacific to thenumber of Europe - Africa - Middle Eastand also further identified that therewas a significant difference betweeneach other.
5. The study found that moderaterelationship existed between from totalnumber of mutual funds of Europe -Africa - Middle East to the total numberof number of mutual funds of Americas.
6. The study found that Europe - Africa -Middle East owning of higher total netassets followed by the Asia - Pacific andAmericas.
7. The study found that very strongrelationship existed between total netassets of Americas to the total net assetsof Asia - Pacific, strong relationshipexisted from Europe - Africa - MiddleEast to the Americas and Asia - Pacificand further stated there was a significantdifference from the total net assets of theone region to the total net assets of theanother region.
CONCLUSION AND SUGGESTIONS
The study finally came to know that thenumber of mutual funds as well as total netassets of one region to another region waspositively correlated. The Europe - Africa -Middle East owning higher number ofmutual funds/ schemes followed by theAmericas and Asia - Pacific. The higher totalnet assets possessed by the Europe - Africa- Middle East followed by the Asia - Pacificand Americas because of in this area highernumber of countries / stock exchanges wereprevailing with the available market. Henceit is suggested to strengthen the total netassets value of mutual funds to view a bettercapital formation in all the countries whichis useful to develop the world.
Comparative analysis of Mutual Funds / Schemes amongst the Regions of Americas...

113
REFERENCESLaura T. Starks (2015) Indexing and Active Fund
Management: International EvidenceUniversity of Texas at Austin - Department of
Finance, January 5, 2015 William G. Droms andDavid A. Walker, (2014)
Investment Performance ofInternational Mutual Funds Article firstpublished online: 27 AUG 2014, DOI:10.1111/j.1475-6803.1994.tb00170.x
Zoran Ivkovi? (2009): Machine-readablebibliographic record - MARC, RIS,BibTeX, Document Object Identifier(DOI):10.3386/w14583, Published:"Individual Investor Mutual FundFlows," (with Zoran Ivkovi?), Journalof Financial Economics, VoNol. 92,2,2009, p. 223-237.
Chiulien C. Venezia,v (2007) The InternationalJournal of Applied Economics andFinance,Year: 2007 | Volume: 1 | Issue:2 | Page No.: 120-125, DOI: 10.3923/ijaef.2007.120.125
Miranda Detzler, James Wiggins,(1997) ThePerformance of Actively ManagedInternational Mutual Funds Review ofQuantitative Finance and Accounting,May 1997, Volume 8, Issue 3, pp 291-313
Dr. J.C. Verma, Bharat's Manual of MerchantBanking (Concepts, Practices,Procedures) with SEBI clarifications,guidelines, rules and regulations,Bharat Law House, New Delhi, 4thEdition, 1996. PP. 1320-1360.
Pierce James L : Monetary and FinancialEconomies - John Wilay & Sons, 1984Edn. P. 81,
Weston J. Fred and Brigham, Eugene F :Essentials of Managerial Finance, DryenPress, 7th Edn. 1985, P. 36.
Dr. K. Kanaka Raju

"WHYS AND WHEREFORES" OF THE CYNICISMOF MGNREGS' SUCCESS IN ARUNACHAL
PRADESH: AN ANALYSIS
*Associate Professor, Department of Commerce, Rajiv Gandhi University, Rono Hills, Doimukh - 791112,Arunachal Pradesh, Mob.: +91 9437375088, +91 9402081875, email: [email protected]
Dr. Sanjeeb K Jena*
INTRODUCTION
"… theNREGS is one imaginative programmewhere the wretched idleness of our poor couldget converted into social wealth."
Empty stomachs, unlike empty vessels,rarely make much noise, but when they do,it makes impact. This impact of age 60 yearssince independence, comes as an imperativeintervention in the wake of MahatmaGandhi National Rural EmploymentGuarantee Act, 2005 (MGNREGA) cameinto effect as a result of the legislationordained on August 25, 2005, and which isbeing implemented all over India from 1stApril 2008. The idea premised on the
widely held belief that MGNREGA isfoundationally capable of transmuting therural lives by improving living conditions,increasing sustainable agrarian activitiesand wholesome economic support. One canreiterate what the Directive Principles inthis regard says and how this is being wellsubstantiated in the EGA as the DirectivePrinciples upholds "The State shall inparticular direct its policy towards securing... that the citizens, men and women equallyhave the right to an adequate means oflivelihood".The MGNREGA provides alegal guarantee for one hundred days ofemployment in every financial year to adultmembers of a rural household willing to do
ABSTRACTMahatma Gandhi National Rural Employment Guarantee Act (MGNREGA) is considered as a "SilverBullet" for eradicating rural poverty and unemployment, by way of generating demand for productivelabour force in villages. It provides an alternative source of livelihood which will have an impact onreducing migration, restricting child labor, alleviating poverty, and making villages self-sustainingthrough productive assets creation such as road construction, cleaning up of water tanks, soil and waterconservation work, etc. For which it has been considered as the largest and most successful anti-povertyprogramme in the world. But the success of this Act depends upon its proper implementation. It has beenfound that the performance of the scheme and its effectiveness with respect to various parameters arevery poor in the North-Eastern states of India, excepting Assam. The most successful rural livelihooddevelopment scheme of the Indian government had failed to achieve its pre-defined objectives in one ofthe most backward and underdeveloped states of the country, Arunachal Pradesh, and is surely analarming issue to be researched for. The current research paper had made a humble attempt to study the"Whys and Wherefores" of the poor performances of the MGNREGS in the state of Arunachal Pradesh.
Key Words : MGNREGS, Arunachal Pradesh, Poor Performances, Loopholes.
The Utkal Business ReviewDecember, 2015, Vol - XXIX, pp.-114-126

115
public work, related to unskilled manualwork at the statutory minimum wage. It isreally encouraging to see that MGNREGAhas completed nearly one decade of itsoperation and the statistics are good enoughto convince us that job cards have beendistributed and individuals / families havebeen covered under the Act and that wagesare benefiting those who used to migrate tocities for their livelihood. But perhaps that'snot all and that's not what MGNREGAultimately aims to achieve. Geographychanges so as the performance, impact andachievement varies and the same in case ofArunachal Pradesh too.
02. POOR PERFORMANCES OFMGNREGS IN ARUNACHAL PRADESH1
MGNREGA was introduced in the year2006 in many parts of India but this schemewas launched in Arunachal Pradesh in the2009 only in Upper Subansiri in the firstphase and Lohit District and ChanglangDistrict were covered in the second phase.The rest of the district introduced theMGNREGS in the third phase. No job wasissued in the first phase. The Governmentof Arunachal Pradesh had started to issuejob card from the second phase of theintroduction of scheme. If we look into thejob cards issued in Arunachal Pradeshduring various financial yearsfrom 2009-10 to 2014 - 15, we find that total 189,492job cards were issued during the FY 2011-12 and there was a declining trend till 2013-14. But a massive jump of nearly three timeswas experienced during 2014-15 and thenumber of job cards issued during the yearwas 747,077 (Table - 01).
It was observed from the table - 02 that total106 works have been started underMGNREGS during the financial year 2011- 12, out of the total number of work startedonly 9.43 per cent of works have beencompleted during financial year 2011 - 12,only 7.45 per cent of works have beencompleted during financial year 2012 - 13,only 6.01 per cent of works have beencompleted during financial year 2013 -14.Moreover, there are 1418 numbers of workshavebeen started out of which only 1.12 percent of works have been completed duringthe financial year of 2014 - 15. Atotal of 7218works have been startedin various financialyears since 2009 -10 under MGNREGS inthe state and only 6.84 per cent of workshave completed.
The performance of MGNREGS is mostlydepended upon financial prospects (Table04).It is found that Rs 8100.47 lakhs wasavailable for the financial year 2014 - 2015which comprised of Rs 3987.08 lakhs fromthe unutilized funds from the previousfinancial year, Rs 2947.88 lakhs sanctionedduring the current financial year, Rs 35.75lakhs released from last financial year butreceived in current financial year and4995.08 lakhs release from state fund todistrict and Rs 121.7 lakhs frommiscellaneous sources. The statisticsprovided in the table -05 is very dismal astotal funds available for the MGNREGS isonly Rs. 8100.47 lakhs during the FY 2014-15 which is 42.94% lesser than the previousFY (Rs. 14,197.57 lakhs) and the similartrend is also experienced with respect to thetotal expenditure. Total amount unspentduring the three FYs, since 2012-13, was Rs.14292.44 lakhs which is 39.16% whichshowed a sorry state of affairs with repsct1www. mgnrega.nic.in
Dr. Sanjeeb K Jena
116
to the implementation of the MGNREGS inthe state.
The physical asset created refers to the assetor work completed by government orconcerned authority of the MNREGA. Total590 assets have been created during the FY2009 - 10 to FY 2014 -15.From table 06, it isshowed that the highest numbers of ruralconnectivity has been created during thefinancial years, from 2009 - 10 to 2014 -15,followed by flood control. It is found thatPapumpare district and Longding have notcreate any kind of assets from the inceptiontill financial year 2014-15. The reason maybe behind that lack implementing processand lack of effective monitoring fromgovernment.
The government of India has decided todisburse the amount to beneficiariesthrough bank and post office. Therefore,they instructed all the beneficiaries to openan account in a bank or a post office for fasttransaction and to reduce corruption. Thegovernment of Arunachal Pradesh has alsodirected all the beneficiaries to open anaccount in a bank or a post office. Totalindividual savings bank accounts in alldistricts of Arunachal Pradesh till end ofthe FY 2014-15 were 55,800 and total postoffice account was 21,613. The amountdisbursed during the same period was Rs.5, 68, 79,324 by the banks and Rs.3,07,40,590 by the post offices.
03. RESEARCH GAP
Workfare programs are common anti-poverty policies. Many developingcountries have programs that hire workersat competitive wage rates with the goal ofincreasing the income of the poor. Asubstantial literature estimates the income
and consumption benefit of these programsby comparing participants with matchednon-participants (Datt and Ravallion,19942; Ravi and Engler, 2009 3). India hasmore than three decades of experience inimplementing different EmploymentGeneration Programmes which haveevolved into employment creation andpoverty alleviation. These programmes havebeen used and advocated for alleviatingboth chronic and transient poverty in theIndian context for a long time (Hirway,Saluja and Yadav, 2008)4.
The National Rural EmploymentGuarantee Act (NREGA) was launched in2005. NREGA came into force in 200districts on 2 February 2006 and was thenextended to an additional 130 districts inthe financial year 2007-08. The mission ofNREGA is to provide "at least one hundreddays of guaranteed wage employment inevery financial year to every householdwhose adult members volunteer to dounskilled manual work and for mattersconnected therewith or incidental thereto."Participation in the program requiresregistration with the Gram Panchayat (localofficial) to obtain a job card. Holders of thiscard become eligible to apply for jobsallocated under the program in India, The2Gaurav Datt and Martin Ravallion. TransferBene?ts from Public-Works Employment: Evidencefor Rural India. The Economic Journal,104(427):1346-1369, 1994.3Shamika Ravi and Monika Engler. Workfare in LowIncome Countries: An E?ective Way to FightPoverty? The Case of NREGS in India. 2009.4Hirway, I., Saluja, M. R. and Yadav, B. (2008),"Analysing Multiplier Impact of NREGA Worksthrough Village SAM Modelling", Paper presentedat a seminar on NREGA in India: Impacts andImplementation Experienced by Institute forHuman Development and Centre de ScienceHumanities, 16-17 September, IIC, New Delhi.
“Whys and Wherefores” of the Cynicism of MGNREGS' Success in Arunachal Pradesh: An Analysis
117
NREGA ranks first among the mostpowerful initiatives ever undertaken fortransformation of rural livelihoods in India(Ghosh, 2009)5 . In many ways the NREGAis a replication of earlier schemes with alegal guarantee. The most critical differencenow is that people's entitlement, by law, theemployment is mandated through NREGA.While other programmes are allocation-based, NREGA is demand-driven (Dreze,2008)6.
It is imperative that the empowermentdrives, when linked to livelihooddevelopment schemes such as NREGA cancomplement each other. NREGA can createan opportunity for the poor to open asavings account, make transactions andsave surplus cash. A financial inclusiondrive offering no-frills bank accounts canprovide the poor a secure interest bearingplace to save that surplus cash. In turn,provides a greater outlook for thedevelopment of livelihood and economicempowerment for the poor.
MGNREGA was introduced in the year2006 in many parts of the country but it waslaunched in Arunachal Pradesh in the year2009. Since from its inception to financialyear 2014 -15 the performance of the schemereveals a very depressing outcome. It hasalso been found that the performance of thescheme and its effectiveness with respect tovarious parameters are very poorin theNorth-Eastern states of India, exceptingAssam. The most successful rural livelihooddevelopment scheme of the Indian
government had failed to achieve its pre-defined objectives in one of the mostbackward and underdeveloped states of thecountry, Arunachal Pradesh, and is surelyan alarming issue to be researched for.
04. OBJECTIVES
With these above backdrops, the currentresearch paper had made a humble attemptto study the reasons of the poor performanceof the MGNREGS in the state of ArunachalPradesh.
05. METHODOLOGY
The present study is an exploratory studywhich is based on interviews, groupdiscussions and brain-storming sessionswith various stakeholders of the MGNREGSin the state of Arunachal Pradesh. Theresearcher had covered 07 districts ofArunachal Pradesh (Upper Subansiri,Lohit, Anjaw, East Kameng, EastSiang,Lower Subansiri and Papum Pare)which were selected as per convenience andfurther sampled out 2 villages from eachcircles. In total 100 villages were coveredand 320 interview sessions were conductedto record the views of various stakeholderswho are either the beneficiaries orimplementers or the evaluators. Thesecondary data were collected from thewebsites of MGNREGA(www.mgnrega.nic.in) and from the officialrecords of the state authorities.
06. LOOPHOLES IN MGNREGS INARUNACHAL PRADESH
The present study findings had establisheda view that Arunachal Pradesh'sEmployment Guarantee Scheme is highlyvulnerable to corruption. Ten specificsources of vulnerability are identified during
5Ghosh J (2009), "Equity and Inclusion throughpublic expenditure: the potential of the NREGA",Progoti.6Drèze, J (2008): "Employment Guarantee: BeyondPropaganda", The Hindu, January 11, 2008.
Dr. Sanjeeb K Jena

118
the field visit, interview with the villagepeer groups, personal interactions with thestakeholders and government officials. Themain focus is on works implemented by theGram Panchayats. The term "loophole"should not obscure the possibly intentionalcharacter of some of these vulnerabilities.At least some of them reflect a deliberatesabotage of the transparency safeguards,aimed at perpetuating the traditional systemof extortion in rural employmentprogrammes.
1. Faulty Design of Job Cards: The mainpurpose of the Job Card is to enableMGNREGA labourers to "verify" theirown employment and wage details. Inthe state, this purpose has been defeatedfrom the start due to faulty design of theJob Card. In particular, there is nocolumn for "wages paid" in the Job Card,making it impossible for workers toverify their wage payments. Even thenumber of days worked is hard to verify,as the names of the labourer andworksite have been replaced by "codes".To decipher a labourer's code, one hasto refer to page one of the Job Card, whichis often in English! The worksite code,for its part, is plain Greek for thecardholder. As for employment dates,they are supposed to be written in arectangle divided into four boxes, butthese are filled in different ways bydifferent functionaries, furtherconfusing the reader. In this and otherways, the Job Card is virtuallyunreadable, even for trainedinvestigators - let alone semi-literatelabourers.
2. Erratic Maintenance of Job Cards: Theproblem of faulty design of Job Cards iscompounded by irregular maintenance.In most of the sample villages, Job Cardentries were incomplete or even blank.Even when entries were made, they wereoften illegible, or hard to read for onereason or another. Perhaps it is notsurprising that little attention is paid tothe maintenance of Job Cards, since thecards (as presently designed) are littlemore than symbolic documents. Further,there is some lack of clarity as to who isto be held accountable in the event whereJob Cards are not adequatelymaintained.
3. Incomplete Distribution of Job Cards:In many of the sample villages, thedistribution of Job Cards wasincomplete. Cases were even found ofentire hamlets where just a fewhouseholds had a Job Card (in spite ofan evident demand for Job Cards fromothers also). Even among those whowere given a dated receipt after applyingfor registration, some did not have a JobCard. Aside from depriving many ruralhouseholds of their entitlements underthe Act, the incomplete distribution ofJob Cards has led to problematic"adjustments" in the records toaccommodate workers without Job Cardat the worksites. These adjustmentsopen the door to further adjustments thatserve different purposes.
4. "Adjustments" in the Muster Rolls andJob Cards: In many of the sample GPs, itwas observed that various "adjustments"in the muster rolls and/or Job Cards had
“Whys and Wherefores” of the Cynicism of MGNREGS' Success in Arunachal Pradesh: An Analysis
119
become routine practice. For instance, aworker without Job Card is oftenaccommodated by "clubbing" his/herwages with those of someone who has aJob Card, under the latter's name.Similarly, team work performed underthe piece-rate system is often recordedunder the name of the team leader alone.Sometimes adjustments are also madeto meet the requirements of the on-lineMonitoring and Information System(MIS). These and related practices, well-intentioned as they might be in somecases, send a dangerous signal thatrecords can be "adjusted", and open thedoor to further, arbitrary "adjustments".In fact, the pressure to make adjustmentsin some circumstances (e.g. meeting therequirements of the MIS) seems to havebecome a convenient excuse forfraudulent practices.
5. Lack of Transparency in Muster Rolls:Lack of transparency in muster rolls hadseveral aspects in the sample GPs. First,there are "dual" records: for instance,authentic attendance details are takenin informal notebooks ("kaccha musterrolls") at the worksite while official("pacca") muster rolls are filled - andoften fudged - elsewhere. Second, musterrolls are rarely accessible for publicscrutiny. "Live" muster rolls were notkept at the worksite (as per NREGAGuidelines) in any of the sample GPs,and "completed" muster rolls weretypically kept at someone's home ratherthan at the Panchayat Bhawan. Third,like the Job Cards, muster rolls aredifficult to verify. Indeed, the above-mentioned "adjustments" make itpossible to justify almost any
discrepancy between the muster rollsand workers' testimonies. The lack oftransparency in work measurementfurther exacerbates this problem.
6. Rigid MIS: The Government ofArunachal Pradesh has taken apioneering initiative in operationalizingthe centrally designed Monitoring andInformation System (MIS). This MIS canbe of great help in achieving somediscipline and consistency in record-keeping. However, in this initial phase,the rigidities of the MIS have played arole in promoting "adjustments" in thewritten records. For instance, a musterroll can accommodate a worker withoutjob card, but the MIS cannot. Similarly,the MIS does not allow employment tobe given to a household that has alreadysecured 100 days of MGNREGAemployment in the current financial year.These hurdles are typically overcome bymaking "adjustments", either in thewritten records or at the data entry stage(e.g. "clubbing" two workers' wages inthe same muster roll entry). Thus,instead of alerting users to possibleinconsistencies and irregularities inrecord-keeping, the MIS often coversthem up.
7. Continued Hold of Contractors: Privatecontractors are banned under NREGA.However, in a majority of the places, theresearcher found evidences of continuedinvolvement of contractors, eitherdirectly, or indirectly. The contractors,in turn, are often under the control oflocal political leaders. They milk thesystem by exploiting labourers, fudgingmuster rolls, and cheating on the
Dr. Sanjeeb K Jena
120
material component. A major part of theloot is recycled through the so-called"PC" (percentage) system, wherebyvarious functionaries receive fixedpercentages of MGNREGA funds.
8. Vulnerability to Local Collusion: InArunachal Pradesh, MGNREGA fundsare transferred directly from the Districtto Gram Panchayat accounts after aproject is sanctioned. Thereafter, GPfunctionaries (the sarpanch, secretary,Executive Officer and Village LabourLeader) are in control of almosteverything: funds, accounts, payments,muster rolls, job cards, and even workmeasurements. The Junior Engineer's(JE) work measurements are supposedto act as a "check" against inflatedmuster rolls, but in practice themeasurements are often done by GPfunctionaries and copied or endorsed bythe JE in the "measurement book". In anycase, suitable inducements can oftensecure the cooperation of the JuniorEngineer. Thus, in the event of collusionamong GP functionaries, very little is leftby way of checks and balances.
9. Cryptic Work Measurement: InArunachal Pradesh, Junior Engineersare supposed to carry out regular (e.g.weekly) measurements of the individualoutput of each NREGA worker, and tonote the individual measurements intheir "measurements books". In practice,this is rarely done, and indeed it wouldinvolve an unmanageable work burdenfor the Junior Engineers, at currentstaffing levels. What seems to happen,instead, is that GP functionaries(usually the Executive Officer and/orVillage Labour Leader) do most of the
measurements, and the Junior Engineersjust check them, e.g. by measuring thecollective output at the end of the week.Since the initial measurements are"unofficial", there is no authorizedrecord of them. Further, "teammeasurement" is often practiced insteadof individual measurement, to keepthings manageable. While muster rollsinclude a column for "wages as permeasurement", it is impossible to verifywage calculations without having accessto the measurement book or theunofficial notebook, both of which arejealously sheltered from public scrutiny.This expands the scope for makingcreative entries in the muster rolls, andmakes it all the more difficult to verifythem
10. Other Vulnerabilities: So far, we havefocused on vulnerabilities that arespecific to Arunachal Pradesh'sEmployment Guarantee Scheme (as itfunctions on the ground). To these mustbe added some general vulnerabilitiesof MGNREGA, not confined to the state.These include:
a. Staff Shortages: In ArunachalPradesh as in many other states, thereis a severe shortage of MGNREGAstaff, from top to bottom. For instance,the responsibility for implementingMGNREGA is typically imposed asan "additional charge" on over-worked Block Development Officers(at the Block level) and ExecutiveOfficers (at the GP level). GramRozgar Sevaks are yet to be appointedin most GPs, and the system is alsoshort of technical staff such as JuniorEngineers. All this makes it harder,
“Whys and Wherefores” of the Cynicism of MGNREGS' Success in Arunachal Pradesh: An Analysis
121
in many ways, to ensure effectivemonitoring of MGNREGA, and alsocreates a temptation to rely oncontractors to fill the gap.
b. Dormant Gram Sabhas: There waslittle evidence of active involvementof the Gram Sabhas with MGNREGAin the sample GPs. Typically, GramSabhas are poorly attended andcontrolled by the local elite.Resolutions are easily "passed" byvested interests in the name of thewhole village community. Thismakes it possible, for instance, forinfluential contractors to installthemselves (or their chamchas) as"Village Labour Leaders" with thesanction of the Gram Sabha.
c. Ritualistic Vigilance Procedures: Inthe sample blocks, VigilanceCommittees were inactive, when theyexisted at all. Similarly, Social Audits(where they had taken place) werestill at a largely ritualistic stage,where government officials hastilyread out various MGNREGA records(often in "summary" form) tobemused villagers.
d. Lack of Grievance Redressal: Last butnot least, one of the major flaws ofNREGA in the state as elsewhere isthe lack of grievance redressalprocedures. The grievance redressalauthorities (e.g. Programme Officerand District ProgrammeCoordinator) are essentially the sameas the implementing authorities,making it difficult to hold anyoneaccountable. And while Section 25of NREGA provides for penalties
against anyone who "contravenesthe provisions" of the Act, there is noclarity as to when or how or by whompenalties are to be imposed.
07. CONCLUSION
Summing up the analysis ofimplementation, performance andeffectiveness of the MGNREGS and theproblems and prospects thereof, it can beconcluded that the scheme has a mild levelof success in developing the beneficiarieseconomically, socially, politically andpsychologically in the state of ArunachalPradesh but cannot be analogous to the restof the country.It can be believed thatproliferating corruptionand lack ofawareness about the Act continues to be amajor concern as it has become detrimentalto the successful participation in the scheme.The role of the Blocks and Gram Panchayatshas started figuring very prominently. Thereis a great deal of role to be delivered by theGram Panchayats. MGNREGA places animportant role with GPs in terms ofimplementing, submitting proposals forwork, listing of households, taking jobapplications and distribution of job cards.Another major bottleneck of the scheme isthe provisions of a good workingenvironment as suggested by the provisionsare lacking in the work sites. With theexception of drinking water, the availabilityof other facilities like first-aid kit, shade andcrèche facility, at respective work sites underMGNREGA, were virtually negligible.Finally, the impact of MGNREGA isabridged due to the presence of some majorproblems with respect to the work sitemanagement and administrativeimplementation of the scheme in thebackward areas.
Dr. Sanjeeb K Jena
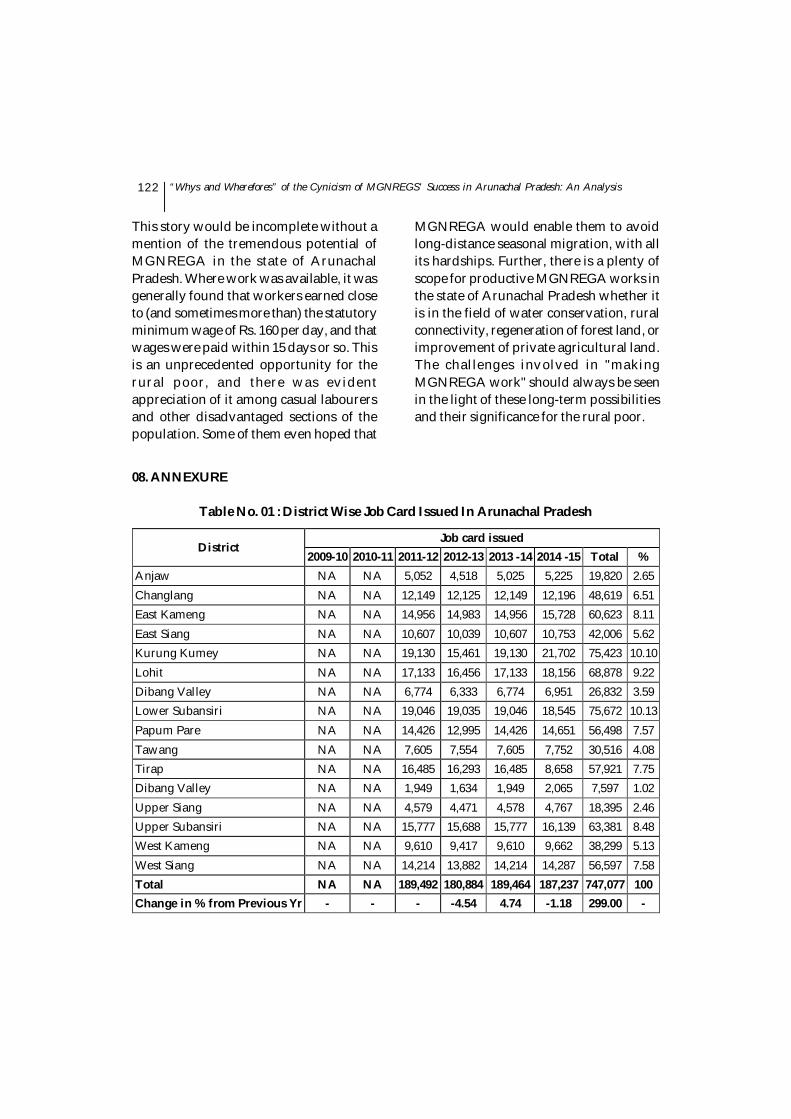
122
This story would be incomplete without amention of the tremendous potential ofMGNREGA in the state of ArunachalPradesh. Where work was available, it wasgenerally found that workers earned closeto (and sometimes more than) the statutoryminimum wage of Rs. 160 per day, and thatwages were paid within 15 days or so. Thisis an unprecedented opportunity for therural poor, and there was evidentappreciation of it among casual labourersand other disadvantaged sections of thepopulation. Some of them even hoped that
MGNREGA would enable them to avoidlong-distance seasonal migration, with allits hardships. Further, there is a plenty ofscope for productive MGNREGA works inthe state of Arunachal Pradesh whether itis in the field of water conservation, ruralconnectivity, regeneration of forest land, orimprovement of private agricultural land.The challenges involved in "makingMGNREGA work" should always be seenin the light of these long-term possibilitiesand their significance for the rural poor.
Table No. 01 : District Wise Job Card Issued In Arunachal Pradesh
District Job card issued
2009-10 2010-11 2011-12 2012-13 2013 -14 2014 -15 Total % Anjaw NA NA 5,052 4,518 5,025 5,225 19,820 2.65 Changlang NA NA 12,149 12,125 12,149 12,196 48,619 6.51 East Kameng NA NA 14,956 14,983 14,956 15,728 60,623 8.11 East Siang NA NA 10,607 10,039 10,607 10,753 42,006 5.62 Kurung Kumey NA NA 19,130 15,461 19,130 21,702 75,423 10.10 Lohit NA NA 17,133 16,456 17,133 18,156 68,878 9.22 Dibang Valley NA NA 6,774 6,333 6,774 6,951 26,832 3.59 Lower Subansiri NA NA 19,046 19,035 19,046 18,545 75,672 10.13 Papum Pare NA NA 14,426 12,995 14,426 14,651 56,498 7.57 Tawang NA NA 7,605 7,554 7,605 7,752 30,516 4.08 Tirap NA NA 16,485 16,293 16,485 8,658 57,921 7.75 Dibang Valley NA NA 1,949 1,634 1,949 2,065 7,597 1.02 Upper Siang NA NA 4,579 4,471 4,578 4,767 18,395 2.46 Upper Subansiri NA NA 15,777 15,688 15,777 16,139 63,381 8.48 West Kameng NA NA 9,610 9,417 9,610 9,662 38,299 5.13 West Siang NA NA 14,214 13,882 14,214 14,287 56,597 7.58 Total NA NA 189,492 180,884 189,464 187,237 747,077 100 Change in % from Previous Yr - - - -4.54 4.74 -1.18 299.00 -
08. ANNEXURE
“Whys and Wherefores” of the Cynicism of MGNREGS' Success in Arunachal Pradesh: An Analysis

123
Table No. 03 : Yearly West Siang District Work Completion Rate of MGNREGAin Arunachal Pradesh
Note: NWS-No. of work started, NWSWECDO-No. Of work started whose estimated completion date isover, NWC-No. of work completed, WCR- Work completed Rate
Year NWS NWSWECDO NWC WCR Year NWS NWSWECDO NWC WCR 2009-10 547 547 121 22.12 2013-14 2366 2362 142 6.01 2010-11 1 1 0 0 2014-15 1418 1346 16 1.18 2011-12 106 106 10 9.43 Total 7218 7113 494 6.84 2012-13 2780 2751 205 7.45
Table No. 02 : District wise work progress report of MGNREGS in Arunachal Pradesh
District
2011-2012 2012-2013 2013-2014 2014-2015
NW
S N
WS
WEC
DO
N
WC
NW
S
NW
SWEC
DO
NW
C
NW
C
NW
S
NW
S W
ECD
O
NW
C
NW
S
NW
S W
ECD
O
NW
C
Anjaw 0 0 0 157 153 0 2 2 0 15 15 0
Changlang 1 1 0 321 320 54 147 145 1 108 108 0
East Kameng 0 0 0 152 136 0 84 83 0 70 66 0
East Siang 0 0 0 118 118 22 216 216 44 195 195 0
Kurung Kurmey 43 43 0 181 181 1 175 175 0 71 71 0
Lohit 0 0 0 85 85 1 65 65 5 69 67 2
Longding 0 0 0 11 11 0 107 107 0 33 21 0
Lower Dibang 4 4 0 62 62 5 32 32 0 64 64 0
Lower Subansiri 0 0 0 220 220 1 166 166 0 206 1 0
PapumPare 0 0 0 58 58 1 218 218 0 72 72 0
Tawang 41 41 0 237 237 0 87 87 9 80 72 0
Tirap 10 10 10 85 85 45 125 125 37 31 31 0
Upper Dibang 0 0 0 1 1 1 27 27 5 18 18 0
Upper Siang 0 0 0 3 3 0 122 122 0 99 65 0
Upper Subansiri 1 1 0 439 432 0 393 393 0 4 0 0
West Kameng 6 6 0 316 315 3 298 298 0 224 223 0
West Siang 0 0 0 234 234 71 102 101 41 59 59 14
Total 106 106 10 2780 2751 205 2366 2362 142 1418 1346 16
Dr. Sanjeeb K Jena

124
Table No. 04 : District Wise Financial Progress of MGNREGA of Arunachal Pradesh
Dis
tric
t Opi
ning
Ba
lanc
e (O
B)
Rel
ease
of
Last
FY
but
Rec
eive
d du
ring
C
urre
nt F
Y
Rel
ease
from
Sta
te F
und(
*)
to d
istr
icts
Mis
c. R
ecei
pt
Borr
owed
Fu
nd
Tota
l ava
ilabl
e
CB
as O
B
Ente
red
OB
Cen
tre
Stat
e
Ref
unde
d to
di
stri
ct/S
tate
Upper Subansiri 750.77 700.91 0 35.75 713.06 0.04 0 1449.76 Changlang 93.46 87.41 0 0 215.48 3.79 0 306.68
Lohit 414.32 234.77 0 0 595.16 4.08 0 834.01 Anjaw 69.92 73.78 0 0 86.8 0 0 160.58
East Kameng 701.15 701.15 0 0 440.43 0 0 1141.58 East Siang 644.79 93.55 0 0 109.18 0.95 0 203.68
Kurung Kumey 26.32 11.6 0 0 598.71 9.15 0 619.46 Lower Dibang 16.74 17.56 0 0 190.98 1.98 0 210.53
Lower Subansiri 251.73 320.05 0 0 580.42 4.06 0 904.53 Papum Pare 99.96 9.02 0 0 281.88 0.84 0 291.74
Tawang 188.29 55.16 0 0 103.2 1.1 0 159.46 Tirap 83.12 23.16 0 0 166.93 0.2 0 190.29
Upper Dibang 6.21 6.21 0 0 95.77 0.17 0 102.15 Upper Siang 3.37 3.43 0 0 218.56 0.65 0 222.64
West Kameng 43.72 29.04 0 0 435.38 1 0 465.42 West Siang 518.16 518.16 0 0 163.14 2.99 0 684.3 Longding 81.08 62.92 0 0 0 90.74 0 153.66
Total 3987.08 2947.88 0 35.75 4995.08 121.7 0 8100.47
Table No. 05 : Overall Financial Performance of MGNREGS (in lakhs)
Year Total Available fund Change from Previous Year Total Expenditure Balance 2012-13 14,197.57 - 9,475.72 4721.85 2013-14 14,197.57 0.00% 9,475.72 4721.85 2014-15 8,100.47 (-) 42.94% 3251.73 4848.74 Total 36,495.61 - 22,203.17 14292.44
“Whys and Wherefores” of the Cynicism of MGNREGS' Success in Arunachal Pradesh: An Analysis

125
Note: FC - Flood Control, RS - Rural Connectivity, WCWH - Water Conservation and Water Harvesting, DP- Drought Proofing, IC - Irrigation Canals, LD - Land Development, RDW - Rural Drinking Water, Fsh -Fisheries, RS - Rural Sanitation.
District FC RC LD WCWH DP RDW Fsh RS IC Total Upper Subansiri 4 6 3 0 0 0 0 4 0 17 Changlang 3 30 0 0 0 0 1 0 13 47 Lohit 4 17 0 0 0 0 0 0 2 23 Anjaw 10 50 8 0 0 0 5 12 0 85 East Kameng 60 8 0 0 0 0 0 3 0 71 East Siang 4 31 2 0 0 2 0 0 20 59 Kurung Kumey 10 10 16 0 0 0 0 5 0 41 Longding 0 0 0 0 0 0 0 0 0 0 Lower Dibang 1 2 0 0 0 0 0 0 0 3 Lower Subansiri 10 8 0 0 0 0 0 0 0 18 Papum Pare 0 0 0 0 0 0 0 0 0 0 Tawang 12 9 0 0 0 0 0 8 0 29 Tirap 10 26 5 3 12 0 0 0 5 61 Upper Dibang 4 6 0 0 1 0 0 6 15 32 Upper Siang 11 8 0 0 0 0 0 0 19 West Kameng 5 1 5 0 0 0 0 0 0 11 West Siang 3 48 7 0 0 3 8 3 2 74 Total 140 263 54 3 13 5 14 41 57 590
Table No. 06 : Asset Created During Financial Year 2009 - 10 to 2014 -15
Dr. Sanjeeb K Jena

126
Districts Total bank
accounts
Total individual
bank account
Amount disbursed to bank account
Total post office
accounts
Total individual post office
account
Amount disbursed to post office
account Anjwa 4,457 4,457 66,48,689 2 2 2,160 Changlang 6,506 5,795 36,64,850 2,579 2,552 26,58,475 East Kameng 3,351 3,347 19,20,295 2 2 1,085 East Siang 5,670 5,666 35,69,340 0 0 0 Kurung Kumey
2,914 2,914 35,92,240 27 27 20,205
Lohit 7,847 7,847 1,45,01,645 2,762 2,636 46,23,495 Lower Dibang
1,751 1,743 29,37,250 3,786 3,741 69,87,330
Lower Subansiri
15 15 18,910 2 2 1,240
PapumPare 3,379 3,208 31,04,960 3 2 9,920 Tawang 5,080 5,041 60,33,375 2,291 2,284 23,32,340 Tirap 7,043 6,489 35,48,060 633 631 3,14,575 Upper Dibang
0 0 0 1,294 1,294 3,12,555
Upper Siang 2,639 2,633 45,32,665 1,556 1,517 25,68,040 Upper Subansiri
2,796 2,747 7,59770 3 3 0
West Kameng
871 871 11,49,055 7,957 5,951 1,0523,88
West Siang 3,147 3,027 8,98,220 995 969 3,95,290 Total 57,466 55,800 5,68,79,324 23,982 21,613 3,07,40,590
Table No. 07 : District wise Total Bank and Post Office Account till FY 2014 -2015
“Whys and Wherefores” of the Cynicism of MGNREGS' Success in Arunachal Pradesh: An Analysis
BANKING SECTOR REVOLUTION IN INDIA
*Research scholor, Faculty of Commerce, Banaras Hindu University, Varanasi (U.P.)
Sumit Kumar Singh*
INTRODUCTION
Financial sector reforms have long beenregarded as an important part of the agendafor policy reform in developing countries.Traditionally, this was because they wereexpected to increase the efficiency ofresource mobilization and allocation in thereal economy which in turn was expectedto generate higher rates of growth. Morerecently, they are also seen to be critical formacroeconomic stability.
Developing countries can expect increasingscrutiny on this front by internationalfinancial institutions, and rating agenciesand countries which fail to come up to thenew standards are likely to suffer throughlower credit ratings and poorer investorperceptions. In this background it is bothrelevant and timely to examine how far
India's financial sector measures up to whatis now expected. Reform of the financialsector was identified, from the verybeginning, as an integral part of theeconomic reforms initiated in 1991. As earlyas August 1991, the government appointeda high level Committee on the FinancialSystem (the Narasimhan Committee) to lookinto all aspects of the financial system andmake comprehensive recommendations forreforms. The Committee submitted its reportin November 1991, making a number ofrecommendations for reforms in the bankingsector and also in the capital market. Shortlythereafter, the government announcedbroad acceptance of the approach of theNarasimhan Committee and a process ofgradualist reform in the banking sector andin the capital market was set in motion
ABSTRACTFinancial sector reforms have long been regarded as an important part of the agenda for policy reformin developing countries. Traditionally, this was because they were expected to increase the efficiency ofresource mobilization and allocation in the real economy which in turn was expected to generate higherrates of growth. Developing countries can expect increasing scrutiny on this front by internationalfinancial institutions, and rating agencies and countries which fail to come up to the new standards arelikely to suffer through lower credit ratings and poorer investor perceptions. Reform of the financialsector was identified, from the very beginning, as an integral part of the economic reforms initiated in1991. As early as August 1991, the government appointed a high level Committee on the FinancialSystem (the Narasimhan Committee) to look into all aspects of the financial system and makecomprehensive recommendations for reforms. This paper is an attempt to study the reforms that hasbeen taking place in financial sector in India. The data and evidences are collected from various booksand journals. The study finds a detail picture of reforms that has been taking place in the financialsector in India and also a good overview of banking system.
Key Words : Financial sector, Financial sector reforms, Resource mobilization, Banking system
The Utkal Business ReviewDecember, 2015, Vol - XXIX, pp.-127-137

128
OBJECTIVES OF THE STUDY
The Present study is addressed on thebackdrop of following two objectives:
To evaluate the overall scenario ofbanking system in India.
To know the reforms that that took placein the financial sector
Evolution of Banking System in India
A bank is a financial institution thatprovides banking and other financialservices to their Customers. A bank isgenerally understood as an institutionwhich provides fundamental Bankingservices such as accepting deposits andproviding loans. There are also nonbankinginstitutions that provide certain bankingservices without meeting the legal definitionof a bank. Banks are a subset of the financialservices industry.
History of Indian Banking System
The first bank in India, called The GeneralBank of India was established in the year1786. The East India Company establishedThe Bank of Bengal/Calcutta (1809), Bankof Bombay (1840) and Bank of Madras(1843). The next bank was Bank ofHindustan which was established in 1870.These three individual units (Bank ofCalcutta, Bank of Bombay, and Bank ofMadras) were called as Presidency Banks.Allahabad Bank which was established in1865 was for the first time completely runby Indians. Punjab National Bank Ltd. wasset up in 1894 with headquarters at Lahore.Between 1906 and 1913, Bank of India,Central Bank of India, Bank of Baroda,Canara Bank, Indian Bank, and Bank ofMysore were set up. In 1921, all presidency
banks were amalgamated to form theImperial Bank of India which was run byEuropean Shareholders. After that theReserve Bank of India was established inApril 1935. At the time of first phase thegrowth of banking sector was very slow.
Between 1913 and 1948 there wereapproximately 1100 small banks in India.
To streamline the functioning and activitiesof commercial banks, the Government ofIndia came up with the Banking CompaniesAct, 1949 which was later changed toBanking Regulation Act 1949 as peramending Act of 1965 (Act No.23 of 1965).Reserve Bank of India was vested withextensive powers for the supervision ofbanking in India as a Central BankingAuthority. After independence, Governmenthas taken most important steps in regard ofIndian Banking Sector reforms. In 1955, theImperial Bank of India was nationalizedand was given the name "State Bank ofIndia", to act as the principal agent of RBIand to handle banking transactions all overthe country. It was established under StateBank of India Act, 1955. .Seven banksforming subsidiary of State Bank of Indiawas nationalized in 1960. On 19thJuly,1969, major process of nationalization wascarried out. At the same time 14 majorIndian commercial banks of the countrywere nationalized. In 1980, another sixbanks were nationalized, and thus raisingthe number of nationalized banks to 20.Seven more banks were nationalized withdeposits over 200 Crores. Till the year 1980approximately 80% of the banking segmentin India was under government?sownership. On the suggestions ofNarsimhan Committee, the Banking
Banking Sector Revolution in India

129
Regulation Act was amended in 1993 andthus gates for the new private sector bankswere opened.
The following are the major steps taken bythe Government of India to RegulateBanking
Institutions in the country:-1949 : Enactment of Banking Regulation
Act.1955 : Nationalization of State Bank of
India.1959 : Nationalization of SBI subsidiaries.1961 : Insurance cover extended to
deposits.1969 : Nationalization of 14 major Banks.1971 : Creation of credit guarantee
corporation.1975 : Creation of regional rural banks.1980 : Nationalization of seven banks with
deposits over 200 Crores.
Nationalization
By the 1960s, the Indian banking industryhas become an important tool to facilitatethe development of the Indian economy. Atthe same time, it has emerged as a largeemployer, and a debate has ensured aboutthe possibility to nationalize the bankingindustry. Indira Gandhi, the-then PrimeMinister of India expressed the intention ofthe Government of India (GOI) in theannual conference of the All India Congress
Meeting in a paper entitled "Stray thoughtson Bank Nationalization". The paper wasreceived with positive enthusiasm.Thereafter, her move was swift and sudden,and the GOI issued an ordinance andnationalized the 14 largest commercialbanks with effect from the midnight of July19, 1969. Jayaprakash Narayan, a nationalleader of India, described the step as a"Masterstroke of political sagacity" Withintwo weeks of the issue of the ordinance, theParliament passed the Banking Companies(Acquisition and Transfer of Undertaking)Bill, and it received the presidentialapproval on 9 August, 1969. A second stepof nationalization of 6 more commercialbanks followed in 1980. The stated reasonfor the nationalization was to give thegovernment more control of credit delivery.With the second step of nationalization, theGOI controlled around 91% of the bankingbusiness in India. Later on, in the year 1993,the government merged New Bank of Indiawith Punjab National Bank. It was the onlymerger between nationalized banks andresulted in the reduction of the number ofnationalized banks from 20 to 19. After this,until the 1990s, the nationalized banksgrew at a pace of around 4%, closer to theaverage growth rate of the Indian economy.The nationalized banks were credited bysome; including Home minister P.Chidambaram, to have helped the Indianeconomy withstand the global financialcrisis of 2007-2009.
Sumit Kumar Singh
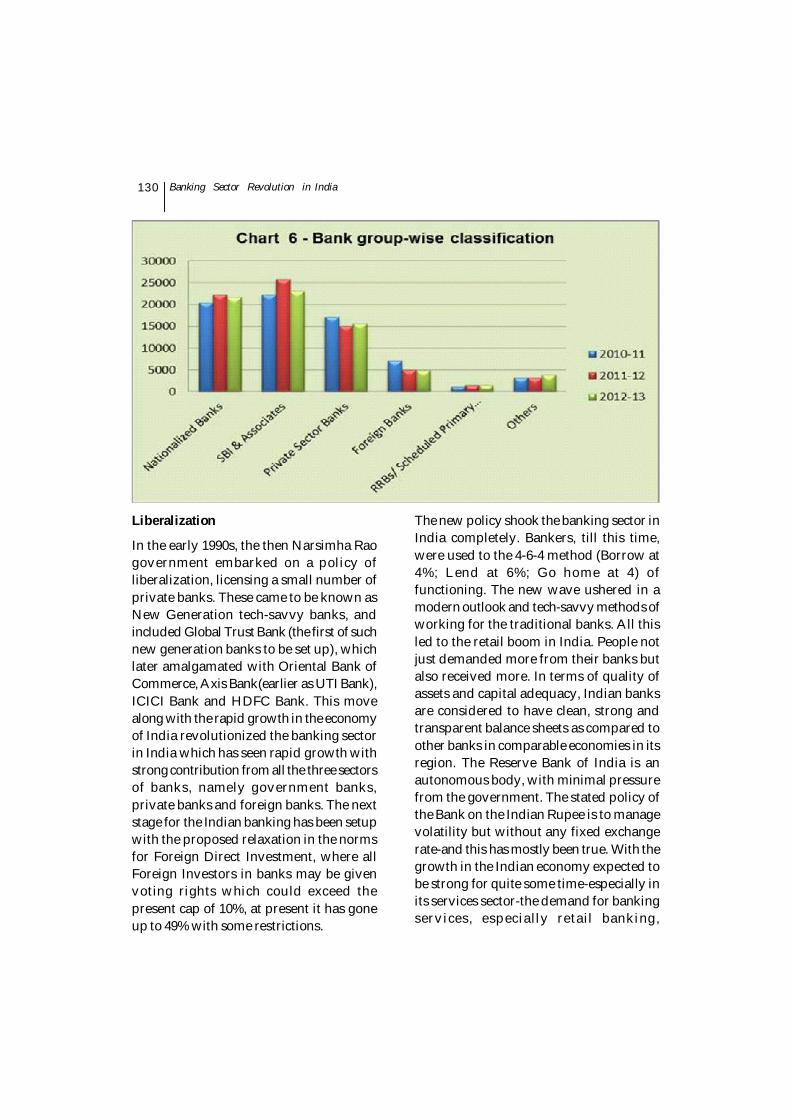
130
Liberalization
In the early 1990s, the then Narsimha Raogovernment embarked on a policy ofliberalization, licensing a small number ofprivate banks. These came to be known asNew Generation tech-savvy banks, andincluded Global Trust Bank (the first of suchnew generation banks to be set up), whichlater amalgamated with Oriental Bank ofCommerce, Axis Bank(earlier as UTI Bank),ICICI Bank and HDFC Bank. This movealong with the rapid growth in the economyof India revolutionized the banking sectorin India which has seen rapid growth withstrong contribution from all the three sectorsof banks, namely government banks,private banks and foreign banks. The nextstage for the Indian banking has been setupwith the proposed relaxation in the normsfor Foreign Direct Investment, where allForeign Investors in banks may be givenvoting rights which could exceed thepresent cap of 10%, at present it has goneup to 49% with some restrictions.
The new policy shook the banking sector inIndia completely. Bankers, till this time,were used to the 4-6-4 method (Borrow at4%; Lend at 6%; Go home at 4) offunctioning. The new wave ushered in amodern outlook and tech-savvy methods ofworking for the traditional banks. All thisled to the retail boom in India. People notjust demanded more from their banks butalso received more. In terms of quality ofassets and capital adequacy, Indian banksare considered to have clean, strong andtransparent balance sheets as compared toother banks in comparable economies in itsregion. The Reserve Bank of India is anautonomous body, with minimal pressurefrom the government. The stated policy ofthe Bank on the Indian Rupee is to managevolatility but without any fixed exchangerate-and this has mostly been true. With thegrowth in the Indian economy expected tobe strong for quite some time-especially inits services sector-the demand for bankingservices, especially retail banking,
Banking Sector Revolution in India

131
mortgages and investment services areexpected to be strong. In March 2006, theReserve Bank of India allowed WarburgPincus to increase its stake in KotakMahindra Bank (a private sector bank) to10%. This is the first time an investor hasbeen allowed to hold more than 5% in aprivate sector bank since the RBIannounced norms in 2005 that any stake
exceeding 5% in the private sector bankswould need to be voted by them. In recentyears critics have charged that the non-government owned banks are too aggressivein their loan recovery efforts in connectionwith housing, vehicle and personal loans.There are press reports that the banks' loanrecovery efforts have driven Defaultingborrowers to suicide.
Classification of Banking Industry in India
Indian banking industry has been dividedinto two parts, organized and unorganizedsectors. The organized sector consists ofReserve Bank of India, Commercial Banksand Co-operative Banks and SpecializedFinancial Institutions (IDBI, ICICI, IFC etc.).The Unorganized sector, which is nothomogeneous, is largely made up of moneylenders and Indigenous bankers.
An outline of the Indian Banking structuremay be presented as follows:-
1. Reserve banks of India.
2. Indian Scheduled Commercial Banks.
3. SBI and its associates banks
Twenty nationalized banks.
Regional rural banks.
Other scheduled commercial banks.
3. Foreign Banks
4. Non-scheduled banks.
5. Co-operative banks.
Sumit Kumar Singh
132
Banking Sector Reforms
The efficient, dynamic and effective bankingsector plays a decisive role in acceleratingthe rate of economic growth in any economy.In the wake of contemporary economicchanges in the world economy and otherdomestic crises like adverse balance ofpayments problem, increasing fiscal deficitsour country too embarked upon economicreforms. The Government of Indiaintroduced economic and financial sectorreforms in 1991 and banking sector reformswere part and parcel of financial sectorreforms. These were initiated in 1991 tomake Indian banking sector more efficient,strong and dynamic.
The recommendations of the NarasimhanCommission-I in 1991 provided the blueprint for the first generation reforms of thefinancial sector, the period 1992-97witnessed the laying of the foundations forreforms in the banking system. This periodsaw the implementation of prudentialnorms (relating to capital adequacy, incomerecognition, asset classification andprovisioning, exposure norms etc.). Thestructural changes accomplished during theperiod provided foundation of furtherreforms. Against such backdrop, the Report
of the Narasimhan Committee- II in 1998provided the road map of the secondgeneration reforms processes. Otherimportant developments are :
1. Financial regulation through statutorypre-emotions (Bank rate, deposit rate,Credit Reserve Ration, StatutoryLiquidity ratio) has been lowered whilestepping up prudential regulations atthe same time.
2. Interest rates have been deregulated,allowing banks the freedom to determinedeposits and lending rates.
3. Steps have been initiated to strengthenpublic sector banks, through increasingtheir autonomy recapitalization from thefiscal, several banks capital base hasbeen written off and some have evenreturned capital to govt. Allowing newprivate sector banks and more liberalentry of foreign banks has infusedcompetition.
4. A set of prudential measures have beenstipulated to impart greater strength tothe banking system and also, ensuretheir safety and soundness with theobjective of moving towardsinternational practices.
Banking Sector Revolution in India

133
The reforms that took place are
Reduction of Statutory Liquidity Ratio(SLR) to 25 per cent over a period of fiveyears
Progressive reduction in Cash ReserveRatio (CRR)
Phasing out of directed credit programsand redefinition of the priority sector
Stipulation of minimum capitaladequacy ratio of 4 per cent to riskweighted assets
Adoption of uniform accountingpractices in regard to incomerecognition, asset classification andprovisioning against bad and doubtfuldebts
Imparting transparency to bank balancesheets and making more disclosures
Setting up of special tribunals to speedup the process of recovery of loans
Setting up of Asset ReconstructionFunds (ARFs) to take over from banks aportion of their bad and doubtfuladvances at a discount
Restructuring of the banking system, soas to have 3 or 4 large banks, which couldbecome international in character, 8 to10 national banks and local banksconfined to specific regions
Abolition of branch licensing
Liberalizing the policy with regard toallowing foreign banks to open officesin India
Rationalization of foreign operations ofIndian banks
Giving freedom to individual banks torecruit officers
Sumit Kumar Singh

134
Inspection by supervisory authoritiesbased essentially on the internal auditand inspection reports
Ending duality of control over bankingsystem by Banking Division and RBI
A separate authority for supervision ofbanks and financial institutions whichwould be a semi-autonomous bodyunder RBI
Revised procedure for selection of ChiefExecutives and Directors of Boards ofpublic sector banks
Obtaining resources from the market oncompetitive terms by DFIs
Speedy liberalization of capital market.
1. Reduced CRR and SLR: The CashReserve Ratio (CRR) and StatutoryLiquidity Ratio (SLR) are graduallyreduced during the economic reformsperiod in India. By Law in India theCRR remains between 3-15% of the NetDemand and Time Liabilities. It isreduced from the earlier high level of15% plus incremental CRR of 10% tocurrent 4% level. Similarly, the SLR Isalso reduced from early 38.5% to currentminimum of 25% level. This has left moreloanable funds with commercial banks,solving the liquidity problem.
2. Deregulation of Interest Rate: Duringthe economic reforms period, interestrates of commercial banks werederegulated. Banks now enjoy freedomof fixing the lower and upper limit ofinterest on deposits. Interest rate slabsare reduced from Rs.20 Lakhs to just Rs.2 Lakhs. Interest rates on the bank loansabove Rs.2 lakhs are full decontrolled.
These measures have resulted in morefreedom to commercial banks in interestrate regime.
3. Fixing prudential Norms: In order toinduce professionalism in itsoperations, the RBI fixed prudentialnorms for commercial banks. It includesrecognition of income sources.Classification of assets, provisions forbad debts, maintaining internationalstandards in accounting practices, etc.It helped banks in reducing andrestructuring Non-performing assets(NPAs).
4. Introduction of CRAR: Capital to RiskWeighted Asset Ratio (CRAR) wasintroduced in 1992. It resulted in animprovement in the capital position ofcommercial banks, all most all the banksin India has reached the CapitalAdequacy Ratio (CAR) above thestatutory level of 9%.
5. Operational Autonomy: During thereforms period commercial banksenjoyed the operational freedom. If abank satisfies the CAR then it getsfreedom in opening new branches,upgrading the extension counters,closing down existing branches and theyget liberal lending norms.
6. Banking Diversification: The Indianbanking sector was well diversified,during the economic reforms period.Many of the banks have stared newservices and new products. Some ofthem have established subsidiaries inmerchant banking, mutual funds,insurance, venture capital, etc. whichhas led to diversified sources of incomeof them.
Banking Sector Revolution in India
135
7. New Generation Banks: During thereforms period many new generationbanks have successfully emerged on thefinancial horizon. Banks such as ICICIBank, HDFC Bank, UTI Bank have givena big challenge to the public sector banksleading to a greater degree ofcompetition.
8. Improved Profitability and Efficiency:During the reform period, theproductivity and efficiency of manycommercial banks has improved. It hashappened due to the reduced Non-performing loans, increased use oftechnology, more computerization andsome other relevant measures adoptedby the government.
The Future of Banking Reform
Prior to the economic reforms, the financialsector of India was on the crossroads. Toimprove the performance of the Indiancommercial banks, first phase of bankingsector reforms were introduced in 1991 andafter its success; government gave muchimportance to the second phase of thereforms in 1998. The efficient, dynamic andeffective banking sector plays a decisive rolein accelerating the rate of economic growthin any economy. In the wake ofcontemporary economic changes in theworld economy and other domestic criseslike adverse balance of payments problem,increasing fiscal deficits etc., our countrytoo embarked upon economic reforms. Thegovt. of India introduced economic andfinancial sector reforms in 1991 andbanking sector reforms were part and parcelof financial sector reforms. These wereinitiated in 1991 to make Indian bankingsector more efficient, strong and dynamic.
Rationale of Banking Sector Reforms Tocope up with the changing economicenvironment, banking sector needs somedose to improve its performance. Since 1991,the banking sector was faced with theproblems such as tight control of RBI, erodedproductivity and efficiency of public sectorbanks, continuous losses by public sectorbanks year after year, increasing NPAs,deteriorated portfolio quality . poor customerservice, obsolete work technology andunable to meet competitive environment.Therefore, Narasimhan Committee wasappointed in 1991 and it submitted its reportin November 1991, with detailed measuresto improve the adverse situation of thebanking industry. The main motive of thereforms was to improve the operationalefficiency of the banks to further enhancetheir productivity and profitability. poorcustomer service, obsolete work technologyand unable to meet competitiveenvironment. Therefore, NarasimhanCommittee was appointed in 1991 and itsubmitted its report in November 1991, withdetailed measures to improve the adversesituation of the banking industry. The mainmotive of the reforms was to improve theoperational efficiency of the banks to furtherenhance their productivity and profitability.
First Phase of Banking Sector Reforms
The first phase of banking sector reformsessentially focused on the following:
1. Reduction in SLR & CRR
2. Deregulation of interest rates
3. Transparent guidelines or norms forentry and exit of private sector banks
4. Public sector banks allowed for directaccess to capital markets
Sumit Kumar Singh

136
5. Branch licensing policy has beenliberalized
6. Setting up of Debt Recovery Tribunals
7. Asset classification and provisioning
8. Income recognition
9. Asset Reconstruction Fund (ARF)
Second Phase of Banking Sector Reforms
In spite of the optimistic views about thegrowth of banking industry in terms ofbranch expansion, deposit mobilization etc.,several distortions such as increasing NPAsand obsolete technology crept into thesystem, mainly due to the global changesoccurring in the world economy. In thiscontext, the government of India appointedsecond Narasimhan Committee under thechairmanship of Mr. M. Narasimhan toreview the first phase of banking reformsand chart a programme for further reformsnecessary to strengthen India?s financialsystem so as to make it internationallycompetitive. The committee reviewed theperformance of the banks in light of firstphase of banking sector reforms andsubmitted its report with some more focusand new recommendations. There were nonew recommendations in the secondNarasimhan Committee except thefollowings:
- Merger of strong units of banks
- Adaptation of the "narrow banking?concept to rehabilitate weak banks. As theprocess of second banking sector reforms isgoing on since 1999, one may say that thereis an improvement in the performance ofbanks. However, there have been manychanges and challenges now due to theentry of our banks into the global market.
Third Phase of banking sector reforms
Rethinking for financial sector reforms haveto be accorded, restructuring of the publicsector banks in particular, to strengthen theIndian financial system and make it able tomeet the challenges of globalization. The on-going reform process and the agenda forthird reforms will focus mainly to make thebanking sector reforms viable and efficientso that it contribute to enhance thecompetitiveness of the real economy andface the challenges of an increasinglyintegrated global financial architectureHistorically, a crucial difference betweenpublic and private sector banks has beentheir willingness to lend to the prioritysector. The recent broadening of thedefinition of priority sector hasmechanically increased the share of creditfrom both public and private sector banksthat qualify as priority sector. The share ofpriority sector lending from public sectorbanks was 42.5 percent in 2003, up from36.6 percent in 1995. Private sector lendinghas shown a similar increase from its 1995level of 30 percent. In 2003 it may havesurpassed for the first time ever public sectorbanks, with a share of net bank credit to thepriority sector at 44.4 percent to the prioritysector.
It could be noted that there has been nobanking crisis at the same time, efficiencyof banking system as a whole, measured bydeclining spread has improved. This is notsay that they have no challenges. There areemerging challenges, which appear in theforms of consolidation; recapitalization,prudential regulation weak banks, and non-performing assets, legal framework etc.needs urgent attention.
Banking Sector Revolution in India

137
EXTRACT
We have got a detail picture of reforms thathas been taking place in the financial sectorin India and also a good overview ofbanking system.
INFERENCES
In the post-era of IT Act, global environmentis continuously changing and providingnew direction, dimensions and immenseopportunities for the banking industry.Keeping in mind all the changes, RBIshould appoint another committee toevaluate the on-going banking sectorreforms and suggest third phase of thebanking sector reforms in the light of abovesaid recommendations. Need of the hour isto provide some effective measures to guardthe banks against financial fragilities andvulnerability in an environment of growingfinancial integration, competition and
global challenges. The challenge for thebanks is to harmonize and coordinate withbanks in other countries to reduce the scopefor contagion and maintain financialstability. However, a few trends are evident,and the coming decade should be asinteresting as the last one.
REFERENCESBhole, L M & Mahakud. "Financial Institutions
and Markets", Tata McGraw-HillEducation.
Pathak, Bharati, V. "Indian Financial System",Pearson Publication.
Rambhia, Ashok. "Fifty years of Indian CapitalMarket." Capital Market, August 1997.
Rangarajan, C, (1997), "The Financial SectorReforms: The Indian Experience," RBIBulletin, July 1997.
Sundharam & Varshney. "Banking theory Law& Practice", Sultan Chand & Sons.
Sumit Kumar Singh
STUDENTS ATTITUDE AND PERCEPTION TOWARDSONLINE SHOPPING: AN EMPIRICAL STUDY
*Research Scholar, P.G. Department of Commerce, Utkal University,Bhubaneswar-4, Odisha, Mob 09658279278,[email protected]**Research Scholar, (UGC NET), P.G. Department of Commerce, Utkal University, Bhubaneswar-4, Odisha, Mob-09583754336, [email protected]
Sakti Ranjan Dash*Roji Kanungo**
INTRODUCTION
In the era of digital world internet hastransformed the way, people living theirlives. Now everything can be done with aclick, which makes our life faster, smarterand smoother. The recent launch of 4G hasbrought many netizens to the platform ofelectronic communication. Online shoppingis one of such aspect which enables theconsumers for enjoying better shoppingexperience.
There are various reasons of shifting thecustomers buying patterns towards onlineretail shops. The facility of comparing theproduct with competitive products on thebasis of price, colour, size and quality is
one of the biggest benefits of onlineshopping. It looks hilarious but this is alsoone of the most significant reasons reportedby the online shoppers. The other popularnames for online shopping are virtual store,e-shop, web-shop, internet shop, web-storeand online storefront etc. These days Mobilecommerce or m-commerce is also one of thepopular means of shopping. The facilitiesof various coupon and discount scheme arealso fascinating the customers in onlineshopping.
LITERATURE REVIEW:
Karve, Sunil (Jan 2014) He explored thatmost of the youth go for online shoppingand unearth some of the habits of the
ABSTRACTIndia has witnessed a sporadic growth of online shopping due to rapid internet penetration as well asmulti feature of online shopping like large product portfolio, home delivery, easy product comparison,convenient mode of payment, time saving , 24*7 hour service and many more. Among the consumers ofonline shopping "the youth," particularly students occupy a major proportion. This happens becausethe e-literacy is highest among them and they easily adopt the changing trends of the world. This paperexclusively focuses on the attitude and perception of students towards online shopping in two aspects.The first aspect covers the relationship between frequency of online shopping with respect to gender &educational level, while the second aspect deals with relationship between gender and motivation foronline shopping. It also discusses different dimensions of online shopping as well as the barriers whichhinder them to purchase from virtual source.
Key Words : Online shopping, Cash on delivery, Internet penetration, E-literacy
The Utkal Business ReviewDecember, 2015, Vol - XXIX, pp.-138-148

139
youth while buying online like theypurchase on monthly basis the most andalso the mode of payment is preferredthrough credit card and spendmoderately. He also discovered that Flipkart was ranked highest followed byAmazon by the respondent. 76%respondents felt that it was safe andsecure to do online shopping. 67%respondents felt that there can bechances of being cheated while shoppingonline.
Preeti Khitoliya (June 2014) has made astudy on Customers Attitude andPerception towards Online Shoppingand the scope of the study was confinedto delhities.The result unveiled that 47%respondents shop online frequentlyfollowed by 30% who shop onlineseldom and 23% respondent had nevertried it, Which suggests that onlineshopping is relatively less popular inIndia. Online shopping is majorly doneby post graduate respondents. Male andfemale respondent had shown similartrend in online shopping behaviour.
Gagandeep Nagra, R Gopal wrote thatthe frequency of online shopping isrelatively less in the country and testifiedstatistically that gender does impactPossession of internet and Frequency ofonline purchase. Their study revealedthat the respondents had perceivedonline shopping in a positive manner.They projected the growth of onlineshopping in near future on the basis oftheir results.
RESEARCH GAP:
Online shopping is an emerging topic inthis 211st century. Youth particularly
students constitute a major part among theconsumers of online shopping. UtkalUniversity is one of the oldest and leadinginstitution of Odisha which comprises ofhuge number of students from diversifiedareas from within and outside the state.Therefore it is a good platform for studyingattitude and behaviour towards onlineshopping. Very few research have beenconducted in this aspect which induce usto conduct a study on this areas and to givean updated findings.
OBJECTIVE OF THE STUDY :
To examine the attitude and perceptionof students of Utkal University towardsonline shopping.
To identify the prime concern of studentsof Utkal University that hindered themto shop online.
SCOPE OF THE STUDY :
The scope of the study is confined to UtkalUniversity only. Data is collected from the150 respondent by using random samplingmethod. Out of 150questionnaire only 125were found valid and considered forhypothesis testing.
RESEARCH METHODOLOGY :
Questionnaire designed : To achieve theresearch objective a questionnaire havingboth open-ended & close-ended has beenframed, which consists of 2 sections. SectionA consists of 11 questions including 5 pointLikert scale and section B included thedemographic profile of the respondent,which includes gender, age and educationlevel of the respondents.
Sample size : The target sample was of 150respondents in the age group of 20-35 years,
Sakti Ranjan Dash & Roji Kanungo
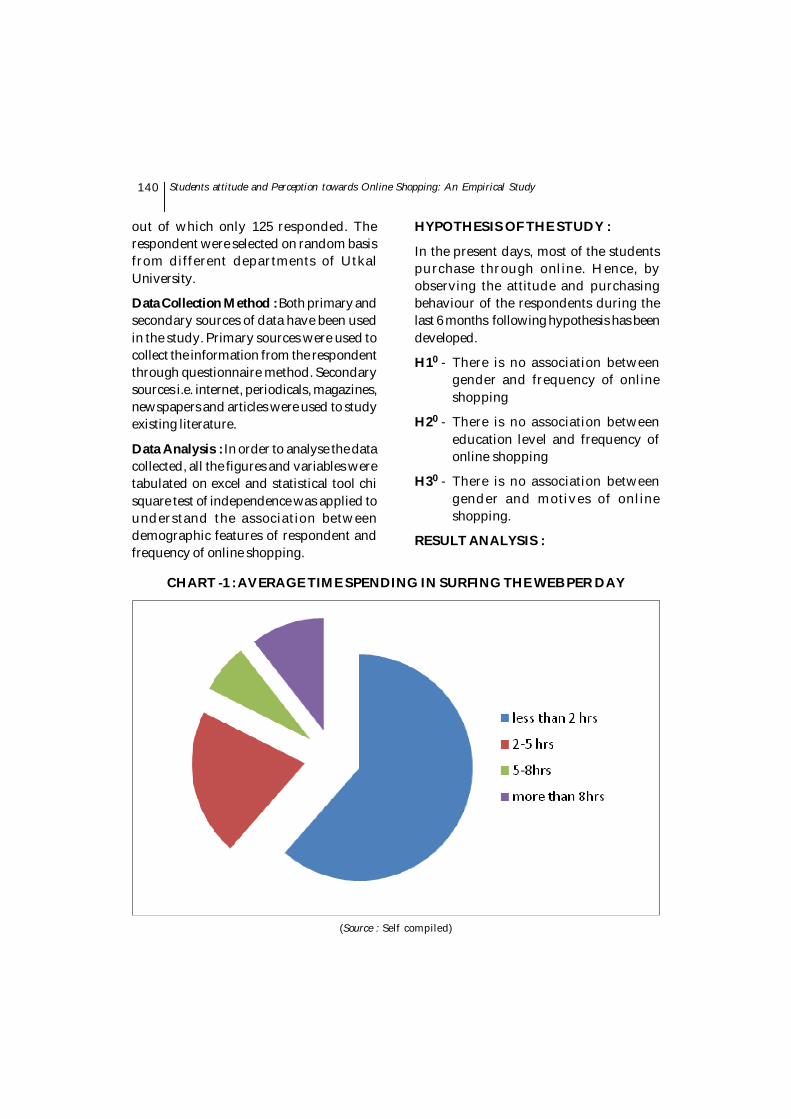
140
out of which only 125 responded. Therespondent were selected on random basisfrom different departments of UtkalUniversity.
Data Collection Method : Both primary andsecondary sources of data have been usedin the study. Primary sources were used tocollect the information from the respondentthrough questionnaire method. Secondarysources i.e. internet, periodicals, magazines,newspapers and articles were used to studyexisting literature.
Data Analysis : In order to analyse the datacollected, all the figures and variables weretabulated on excel and statistical tool chisquare test of independence was applied tounderstand the association betweendemographic features of respondent andfrequency of online shopping.
HYPOTHESIS OF THE STUDY :
In the present days, most of the studentspurchase through online. Hence, byobserving the attitude and purchasingbehaviour of the respondents during thelast 6 months following hypothesis has beendeveloped.
H10 - There is no association betweengender and frequency of onlineshopping
H20 - There is no association betweeneducation level and frequency ofonline shopping
H30 - There is no association betweengender and motives of onlineshopping.
RESULT ANALYSIS :
CHART -1 : AVERAGE TIME SPENDING IN SURFING THE WEB PER DAY
(Source : Self compiled)
Students attitude and Perception towards Online Shopping: An Empirical Study

141
This chart shows that on an average mostof the respondents use internet less than 2hours per day for surfing the web. Thisshows that there is a regular connection of
students with internet which is likely to beincreased in the near future as universitycampus is going to be wi-fi. This is a positivefactor which will influence online shoppingto a larger extent.
CHART -2 : INFORMATION SOURCE OF RESPONDENTS
(Source : Self compiled)
This graph expresses that friendsrecommendation acts as a most importantsource of information for the respondentsregarding online shopping followed bylinks i.e. e-mails and social networking sites.That means respondents mostly influenced
by word-of-mouth advertising (W.O.M).Hence the online shopping websites shouldbecome more concern towards the word-of-mouth marketing in order to increase theirmarket share.
Sakti Ranjan Dash & Roji Kanungo

142
CHART -3 : CATAGORIES OF PRODUCTS RESPONDENTS BOUGHT
(Source : Self compiled)
By analysing the above graph it is foundthat books are the most demanding itemwhich has been purchased by therespondents followed by electronic gadgetsand dress materials. In case of books bothmale and female have same share. Malesare dominating in purchasing electronicgadget items followed by dress materials aswell as travel & event tickets. But females
have a large share in purchasing dressmaterials followed by electronic gadgetsand gifts.
This happens because these items are morecheaply available in the internet. So onlineshopping sites should focus their attentiontowards the other items as well as try tomaintain the level in leading items.
Students attitude and Perception towards Online Shopping: An Empirical Study

143
CHART -4 : TOP 5 MOST PREFERED ONLINE SHOPING COMPANIES BY RESPONDENT
(Source : Self compiled)
Flipkart has gained largest share amongstudents followed by amazon and snapdeal.Most of the male are preferring amazonwhile female are preferring flipkart for theire-shopping. Amazon is popular amongmale as it provides more male-friendly
product as well as large product portfolioand quick delivery service. As flipkart isproviding more trendy product withaffordable cost, thus it is popular amongfemales.
Sakti Ranjan Dash & Roji Kanungo

144
CHART -6 : EXPERIENCE OF RESPONDENTS ON ONLINE SHOPPING
(Source : Self compiled)
CHART -5 : MODE OF PAYMENT BY THE RESPONDENTS
(Source : Self compiled)
Cash on delivery is the most convenientmode of payment among the students. asstudents are more risk averse so they prefercash on delivery rather than internet
banking for their e-shopping. Credit cardis not popular among students because theyare unemployed Among the online modesdebit card is more popular as it is mostlyused by the respondents.
Students attitude and Perception towards Online Shopping: An Empirical Study

145
This chart advocates that most of therespondents are satisfied in their onlineshopping experience. This highlights thatmost of the online shopping sites arefulfilling needs of the customer in an activemanner. It is a very positive sign for thegrowth of online shopping sites. Still theyshould focus on the different aspects of theirservices so that they can provide highsatisfaction to customers.
Respondents were asked to assign rank totheir barriers which they face when buyonline. The results revealed that respondentfind maintenance of privacy and securityare the primary concern for them. Thesecond apprehension for them that the aftersale services. Followed by quality, size andcolour differ from what displayed on thewebsites and delay in delivery of articles
purchased. Least bothering factor wasnetwork & navigation problem.This istabulated hereunder in table 1
Table 1: Respondents Barriers Rankedby the Respondents
BARRIERS RANK
Privacy & security issues 1
After sale services 2
Window dressing of website to attract customers
3
Poor delivery services 4
Problem of network & navigation
5
HYPOTHESIS TESTING:HYPOTHESIS 1
TABLE - 2RELATION BETWEEN GENDER AND FREQUENCY OF ONLINE SHOPPING
Online shopping frequency
Onlyonce Sometimes Frequent Never Total
Gender
Female Count 13 26 10 8 57
% with online shopping frequency 52% 50% 28.57% 61.53% 45.60%
Male Count 12 26 25 5 68
% with online shopping frequency 48% 50% 71.42% 38.46% 54.40%
Total Count 25 52 35 13 125
% with online
shopping frequency 100.00% 100.00% 100.00% 100.00% 100.00%
By analysing the above facts with the help of chi-square test following results have been foundTABLE 3 : CHI-SQUARE TEST FOR H10
Degree of freedom
P (Level of significance)
Calculated value
Table value
3 0.05 6.34 7.81
Sakti Ranjan Dash & Roji Kanungo

146
Here the calculated value (6.34) is less thanthe table value (7.81) which leads toacceptance of hypothesis 1.It can be inferred
that there is no association between genderand frequency of online shopping.
HYPOTHESIS 2TABLE - 4
EDUCATION LEVEL VS. FREQUENCY OF ONLINE SHOPPING
Frequency of Online Shopping Only once Sometimes Frequently Never Total
Education Level
Post Graduate 14 30 22 9 75 RESEARCH SCHOLAR 11 22 13 4 50
Total 25 52 35 13 125 By analysing the above facts with the help of chi-square test following results have been found
TABLE 5 : CHI-SQUARE TEST FOR H20
Degree of freedom
P (Level of significance)
Calculated value
Table value
3 0.05 0.69 7.81
TABLE - 6GENDER * MOTIVES OF ONLINE SHOPPING CROSS TABULATION
Motives of online shopping Convenience Time
saving Superior
selection/Availability Product
comparison Total
Gender Female 25 17 9 6 57 Male 33 17 10 8 68
Total 58 34 19 14 125
By analysing the above facts with the help of chi-square test following results have been found
TABLE 7: CHI-SQUARE TEST FOR H30
Degree of freedom
P value (Level of significance)
Calculated value
Table value
3 0.05 0.19 7.81
Here the calculated value (0.69) is less thanthe table value (7.81) which leads toacceptance of hypothesis 1.It can be inferredthat there is no association between the
education level and frequency of onlineshopping.
HYPOTHESIS 3
Students attitude and Perception towards Online Shopping: An Empirical Study
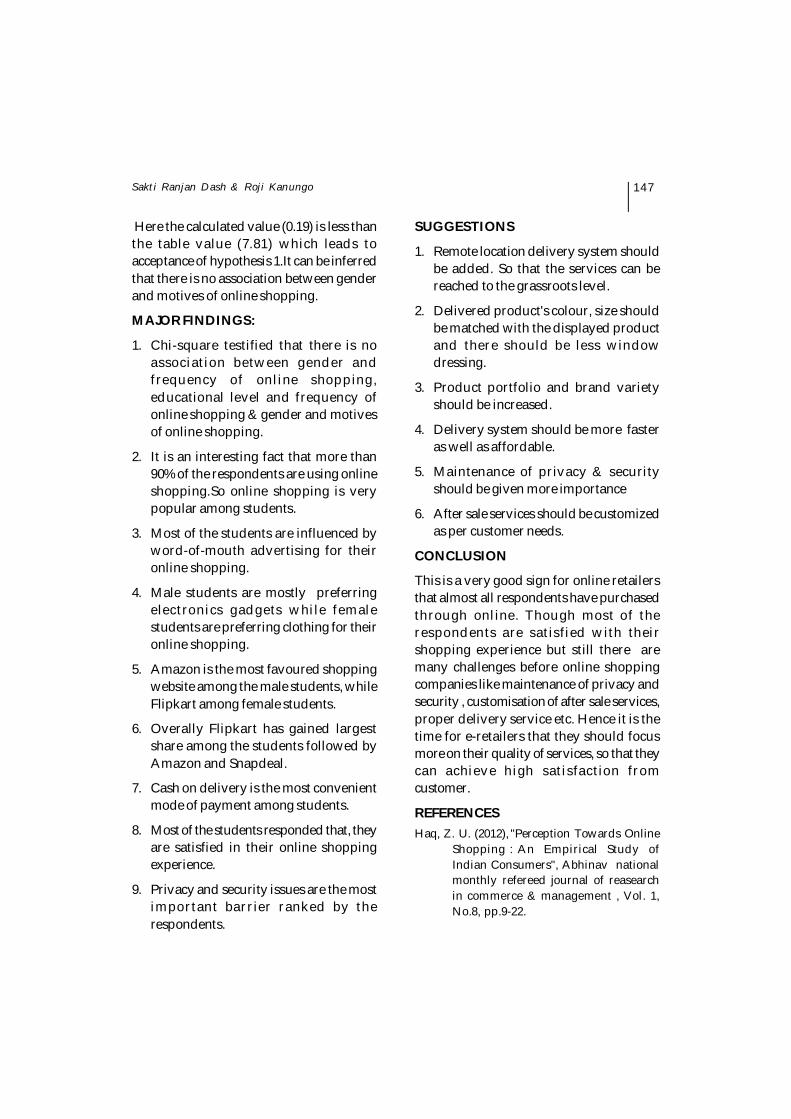
147
Here the calculated value (0.19) is less thanthe table value (7.81) which leads toacceptance of hypothesis 1.It can be inferredthat there is no association between genderand motives of online shopping.
MAJOR FINDINGS:
1. Chi-square testified that there is noassociation between gender andfrequency of online shopping,educational level and frequency ofonline shopping & gender and motivesof online shopping.
2. It is an interesting fact that more than90% of the respondents are using onlineshopping.So online shopping is verypopular among students.
3. Most of the students are influenced byword-of-mouth advertising for theironline shopping.
4. Male students are mostly preferringelectronics gadgets while femalestudents are preferring clothing for theironline shopping.
5. Amazon is the most favoured shoppingwebsite among the male students, whileFlipkart among female students.
6. Overally Flipkart has gained largestshare among the students followed byAmazon and Snapdeal.
7. Cash on delivery is the most convenientmode of payment among students.
8. Most of the students responded that, theyare satisfied in their online shoppingexperience.
9. Privacy and security issues are the mostimportant barrier ranked by therespondents.
SUGGESTIONS
1. Remote location delivery system shouldbe added. So that the services can bereached to the grassroots level.
2. Delivered product's colour, size shouldbe matched with the displayed productand there should be less windowdressing.
3. Product portfolio and brand varietyshould be increased.
4. Delivery system should be more fasteras well as affordable.
5. Maintenance of privacy & securityshould be given more importance
6. After sale services should be customizedas per customer needs.
CONCLUSION
This is a very good sign for online retailersthat almost all respondents have purchasedthrough online. Though most of therespondents are satisfied with theirshopping experience but still there aremany challenges before online shoppingcompanies like maintenance of privacy andsecurity , customisation of after sale services,proper delivery service etc. Hence it is thetime for e-retailers that they should focusmore on their quality of services, so that theycan achieve high satisfaction fromcustomer.
REFERENCESHaq, Z. U. (2012), "Perception Towards Online
Shopping : An Empirical Study ofIndian Consumers", Abhinav nationalmonthly refereed journal of reasearchin commerce & management , Vol. 1,No.8, pp.9-22.
Sakti Ranjan Dash & Roji Kanungo
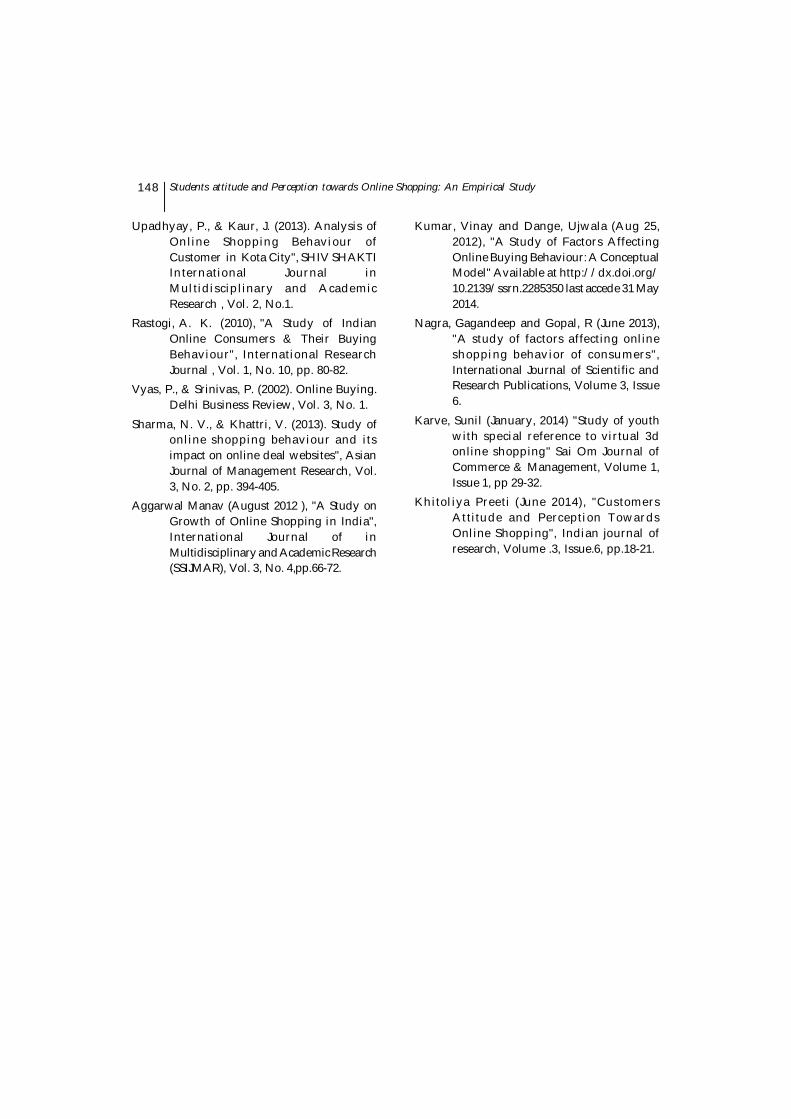
148
Upadhyay, P., & Kaur, J. (2013). Analysis ofOnline Shopping Behaviour ofCustomer in Kota City", SHIV SHAKTIInternational Journal inMultidisciplinary and AcademicResearch , Vol. 2, No.1.
Rastogi, A. K. (2010), "A Study of IndianOnline Consumers & Their BuyingBehaviour", International ResearchJournal , Vol. 1, No. 10, pp. 80-82.
Vyas, P., & Srinivas, P. (2002). Online Buying.Delhi Business Review, Vol. 3, No. 1.
Sharma, N. V., & Khattri, V. (2013). Study ofonline shopping behaviour and itsimpact on online deal websites", AsianJournal of Management Research, Vol.3, No. 2, pp. 394-405.
Aggarwal Manav (August 2012 ), "A Study onGrowth of Online Shopping in India",International Journal of inMultidisciplinary and Academic Research(SSIJMAR), Vol. 3, No. 4,pp.66-72.
Kumar, Vinay and Dange, Ujwala (Aug 25,2012), "A Study of Factors AffectingOnline Buying Behaviour: A ConceptualModel" Available at http://dx.doi.org/10.2139/ssrn.2285350 last accede 31 May2014.
Nagra, Gagandeep and Gopal, R (June 2013),"A study of factors affecting onlineshopping behavior of consumers",International Journal of Scientific andResearch Publications, Volume 3, Issue6.
Karve, Sunil (January, 2014) "Study of youthwith special reference to virtual 3donline shopping" Sai Om Journal ofCommerce & Management, Volume 1,Issue 1, pp 29-32.
Khitoliya Preeti (June 2014), "CustomersAttitude and Perception TowardsOnline Shopping", Indian journal ofresearch, Volume .3, Issue.6, pp.18-21.
Students attitude and Perception towards Online Shopping: An Empirical Study

REGIONAL RURAL BANKS IN INDIA :A STUDY ON ITS PERFORMANCE
*Research Scholar, PG Department of Commerce, Berhampur University, Berhampur; Odisha. Mobile No: 09438853375
Mr. Hara Mohan Panigrahi*
INTRODUCTION
Regional Rural Banks have been inexistence for around 36 years in the Indianfinancial scene. The institution of RegionalRural Banks (RRBs) was created to meet theexcess demand for institutional credit in therural areas, particularly among theeconomically and socially marginalizedsections. The Banking Commission (1972)recommended establish an alternativeinstitution for rural credit and ultimatelyGovernment of India established RegionalRural Banks as a separate institutionbasically for rural credit on the basis of therecommendations of the Working Groupunder the Chairmanship of M.Narashimham. In order to provide access
to low-cost banking facilities to the poor,the Narashimham Working Group (1975)proposed the establishment of a new set ofbanks, as institutions which "combine thelocal feel and the familiarity with ruralproblems which the cooperatives possessand the degree of business organization,ability to mobilize deposits, access to centralmoney markets and modernized outlookwhich the commercial banks have".
Subsequently, the Regional Rural Bankswere setup through the promulgation ofRRB Act of
1976. The RRBs Act, 1976 succinctly sumsup this overall vision to sub-serve both thedevelopmental and the redistributive
ABSTRACTRegional rural Banks plays a vital role in the agriculture and rural development of India. The RRBShave more reached to the rural area of India, through their huge network. The success of rural credit inIndia is largely depends on their financial strength. RRBs are key financing institution at the rurallevel which shoulders responsibility of meeting credit needs of different types of agriculture credit inrural areas. At present, most of the regional rural banks are facing the problems of overdue, recovery,nonperforming assets and other problems. Therefore, it is necessary to study financial performance ofRRBs in India. This paper attempts to analyze the financial performance of RRBs in India during theperiod 2006-07 to 2010-2011. The study is based on secondary data collected form annual reports ofNABARD and RBI. An analytical research design of Key Performance Indicators Analysis such asnumber of banks and branches, deposits, loans, loans, investments and growth rate index is followed inthe present study. The study is diagnostic and exploratory in nature and makes use of secondary data.The study finds and concludes that performance of RRBs has significantly improved.
Key Words : Regional Rural Banks, Key Performance Indicators, Growth Rate, Rural Economy,NABARD.
The Utkal Business ReviewDecember, 2015, Vol - XXIX, pp.-149-160

150
objectives. The RRBs were established "witha view to developing the rural economy byproviding, for the purpose of developmentof agriculture, trade, commerce, industryand other productive activities in the ruralareas, credit and other facilities, particularlyto small and marginal farmers, agriculturallabourers, artisans and smallentrepreneurs, and for matters connectedtherewith and incidental thereto". Theirequity is held by the Central Government,Concerned State Government and theSponsor Bank in the proportion of 50:15:35respectively. The mandates of these ruralfinancial institutions were:1. To take banking to the doorsteps of the
rural masses, particularly in areaswithout banking facilities;
2. To make available cheaper institutionalcredit to the weaker sections of society,who were to be the only clients of thesebanks?
3. To mobilize rural savings and canalizethem for supporting productive activitiesin the rural areas;
4. To generate employment opportunitiesin the rural areas
5. To bring down the cost of providingcredit in rural areas.
REVIEW OF LITERATURE
A number of studies have been conductedto see the functioning and performance ofregional rural bank in the country. Theliterature available in the working andperformance of RRBs in India is a littlelimited. The literature obtained byinvestigators in the form of reports ofvarious committees, commissions andworking groups established by the Union
Government, NABARD and Reserve Bankof India, the research studies, articles ofresearchers, bank officials, economists andthe comments of economic analysts andnews is briefly reviewed in this part. Someof the related literatures of reviews are asfollows. The Kelkar Committee (1986) madecomprehensive recommendations coveringboth the organizational and operationalaspects. Several of these were incorporatedas amendments to the RRB Act, 1976 suchas:
1. Enhancement of authorized capital ofRRBs from Rs 1 crore to Rs 5 crore andpaid-up share capital from Rs 25 lakhsto Rs 1 crore;
2. Appointment of Chairman of RRBs bythe concerned sponsor bank inconsultation with NABARD;
3. Provision of assistance to RRBs ingreater measure by sponsor banks intraining RRB staff and giving financialassistance to RRBs in their first five yearsof their existence;
4. Provision for amalgamation of RRBs inconsultation with all the concernedparties.
5. Empowering the sponsor banks tomonitor the progress of RRBs and alsoto arrange for their inspection, internalaudit etc.
Though the progress of implementation wastardy (the amended act came into force onlyby end-September, 1988), there was enoughscope for improvement thereon.
NABARD (1986) published "A study onRRBs viability", which was conducted byAgriculture Finance Corporation in 1986 on
Regional Rural Banks in India : A Study on its Performance

151
behalf of NABARD. The study revealed thatviability of RRBs was essentially dependentupon the fund management strategy, marginbetween resources mobility and theirdeployment and on the control exercised oncurrent and future costs with advances. Theproportion of the establishment costs to totalcost and expansion of branches were thecritical factors, which affected their viability.The study further concluded that RRBsincurred losses due to defects in theirsystems as such, there was need to rectifythese and make them viable. The mainsuggestions of the study includedimprovement in the infrastructure facilitiesand opening of branches by commercialbanks in such areas where RRBs werealready in function.
In the year 1989 for the first time, theconceptualization of the entire structure ofRegional Rural Banks was challenged bythe Agricultural Credit Review Committee(Khusro Committee), which argued thatthese banks have no justifiable cause forcontinuance and recommended theirmergers with sponsor banks.
The Committee was of the view that "theweaknesses of RRBs are endemic to thesystem and non-viability is built into it, andthe only option was to merge the RRBs withthe sponsor banks. The objective of servingthe weaker sections effectively could beachieved only by self-sustaining creditinstitutions." The Committee on FinancialSystems, 1991 (Narasimham Committee)stressed the poor financial health of theRRBs to the exclusion of every otherperformance indicator. 172 of the 196 RRBswere recorded unprofitable with anaggregate loan recovery performance of 40.8percent. (June 1993). The low equity base of
these banks (paid up capital of Rs. 25 lakhs)didn't cover for the loan losses of most RRBs.In the case of a few RRBs, there had alsobeen an erosion of public deposits, besidescapital. In order to impart viability to theoperations of RRBs, the NarasimhamCommittee suggested that the RRBs shouldbe permitted to engage in all types ofbanking business and should not be forcedto restrict their operations to the targetgroups, a proposal which was readilyaccepted. This recommendation marked amajor turning point in the functioning ofRRBs.
The contemporary literature on bankingefficiency spells out two distinct approachesto measure efficiency (1) accountingmeasure (2) economic measure.
Accounting measure refers to the use ofvarious financial ratios that focus on one ormore outputs and their relevant inputs tomeasure the performance of a banking unit.The financial ratio approach has beenwidely used by the researchers and workinggroups/committees to analyze theperformance of RRBs. Most of the studieson the performance evaluation of RRBsconcentrated on the banks in particularstate/region. Some of the studies are: Singh(1992) analyzed the performance of RRBsbanks in Punjab. Prasad (2003) evaluatedthe performance of RRBs in India.Moreover, Pati (2005) developed theperformance of RRBs in the north-eastregion. The study of Bagchi and Hadi (2006)concentrated on the performance of regionalrural banks in West Bengal. Few studies alsoexist in the literature which concentratedon the efficiency of a single regional ruralbank. Some of the studies conducted so farare: Sudhaker et al., (1984) evaluated the
Mr. Hara Mohan Panigrahi

152
performance of Cauvery Grameen Bank inMysore district; Parmar (1986) assessed theperformance of Banaskantha MehsaneGrameen Bank in Gujarat; Sangwan (1988)analyzed the performance of ChattanjaGrameen Bank in Andhra Pradesh;Jagadeesha et al., (1990) evaluated theperformance of Tungabhadra GarmeenBank in Karnataka. Further, Hosamani(2002) explored the performance ofMalaprabha Garmeen Bank in Karnatakaand Yadappanvar and Nath (2003)assessed the performance of Aurangabadand Jalna Grameen Bank in Maharashtra.Though financial accounting ratios aresimple to use and relatively easy tounderstand, but their use to measure bankperformance is plagued by variousproblems. As a precautionary measure,regulatory frame works (such as CAMELrating) based on these ratios has been putin place in most of the supervisory systemsacross the globe. Further, Sherman and Gold(1985) noted that financial ratios do notcapture the long-term performance. Thismeasure also helps in the analysis of bank'sperformance in terms of individualparameters determining the overallefficiency level as it is difficult to preciselymeasure the efficiency of banks.
Therefore, in recent years, there is a trendtowards measuring bank performanceusing economic measure. This measureprovides accurate, composite and preciseestimate of efficiency of banks comparingeach bank against the top performers in thebanking industry.
A scan of the existing literature on theefficiency of Indian banks provides thatthere exists various studies that analyzed
the efficiency of Indian commercial banksusing most popularly used parametrictechnique of Stochastic Frontier Analysis(SFA) and nonparametric technique of DataEnvelopment Analysis. The notable studiesbelonging to this group are: Noulas andKetkar (1996), Bhattacharyya et al., (1997),Das (1997), Saha and Ravisankar (2000),Mukherjee et al., (2002), Kumar and Verma(2003), De Kumar (2004), Chakrabarti andChawla (2005), Kaur and Sharma (2005-06),Kumar and Gulati (2008), etc. To theauthor's knowledge, there is virtually nostudy except Reddy (2005), Khankhoje(2008), Sathye (2008) and Mohindra (2011)which analyzed the performance of RRBsby using Frontier and Data EnvelopmentAnalysis approach respectively.
OBJECTIVES OF THE STUDY
1. To measure financial performance ofRegional Rural banks in India.
2. To analyze the key performanceindicators of RRBs in India
3. To evaluate progress of the RRBs during2006-07 to 2010-11.
4. To study the growth-pattern of RegionalRural Banks in India.
5. To make important suggestions toimprove the working of RRBs.
HYPOTHSIS OF THE STUDY
1. The RRBs in India have made asubstantial quantitative progress.
2. The qualitative progresses of RRBs havebeen found to be highly impressive.
3. The macro performance is highlysubstantial.
Regional Rural Banks in India : A Study on its Performance
153
PROBLEMS OF THE STUDY
1. First and important problem of theresearch work is analysis of financialdata.
2. Information from NABARD and RBIwas difficult to be obtained.
SIGNIFICANCE/ IMPORTANCE OF THESTUDY
The research study is significant to evaluatefinancial performance of RRBs in India. Theresults/ findings of the present study areuseful to the policy planners in their effortsto improve the working of the RRBs in India.
SCOPE AND COVERAGE OF THE STUDY
1. It covers all RRBs working in India.
2. The study covers a specific period from2006-07 to 2010-11 i.e. afterglobalization and amalgamation.
3. There is macro evaluation ofperformance of all the RRBs in India.
Area of the Study
The study is based on the performance ofRRBs in India. Therefore, study covers allRRBs in India to the fulfilment of objectivesof the study.
Period of the Study
For collection of the secondary data onfinancial performance of the RRBs in India,five years i.e. from 2006-2007 to 2010-2011were taken as the reference period. Theaccounting year of the bank commences on1st April of every year and ends on 31stMarch of next year.
RESEARCH METHODOLOGY
The financial performance of the RRBs in
India has been analyzed with the help ofkey performance indicators. The year 2010-2011 was taken as the current year and year2009- 2010 was base year for the calculationof growth rate. Analytical TechniquesEmployed- Growth rate analysis wasundertaken with a view to studyingfinancial performance related to the RRBs.Growth rate is measured with the help offollowing formula-
Growth Rate = Yt -Yt-1 / Yt-1
Yt= Current Year, yt-1=Base Year.
RESEARCH DESIGN
The present study is diagnostic andexploratory in nature and makes use ofsecondary data. The study is confined onlyto the specific areas like number of branches,district coverage, deposits mobilized, creditsand investments made by the IndianRegional Rural Banks (RRBs) for the 5 yearsperiod starting from 2006-07 to the year2010-11.
METHOD OF DATA COLLECTION
The present study is empirical in characterbased on the analytical method. The studyis mainly based on secondary data whichis collected, compiled and calculated mainlyfrom annual reports of the NABARD andRBI. Other related information collected fromjournals, conference proceedings andwebsites.
Key Performance Indicators and Growthof RRBs
Table 1 presents the key performanceindicators and growth of RRBs from year2006-07 to 2010-2011, Graph 1 presents keyperformance indicators and Graph 2presents growth rate of RRBs.
Mr. Hara Mohan Panigrahi

154
Table 1: Key Performance Indicators of RRBs in India(Figures: - Rs. in Crore)
Parameters 2006-07 2007-08 2008-09 2009-10 2010-11 Growth No. of RRBs 96 91 86 82 82 --- Profit/Loss Making 81/15 83/8 80/6 79/3 75/7 --- No. of Branches 14526 14761 15158 15480 16001 3.36 Districts covered 534 594 617 618 620 0.32 Staff 68289 68005 68509 69042 70153 1.61 Owned Fund 7285.98 8732.59 10895.73 12247.16 13838.92 13.00 Deposit 83143.55 99093.46 120184.46 145035.00 166232.34 14.60 Borrowings 9775.80 11494.00 12733.80 18770.00 26490.81 41.10 Investments 45666.14 48559.54 62629.45 79379.16 86510.44 8.98 Gross Loan (O/s) 48492.59 58984.27 67858.48 82819.10 98917.43 19.14 Loan Issued 33043.49 38581.97 43445.59 56079.24 71724.19 27.90 CD Ratio 58.32 59.52 56.46 57.10 59.51 --- Accumulated Losses 2759.49 2624.22 2325.59 1775.06 1532.39 - 13.67 Profit (Before Tax) 926.40 1383.68 1859.36 2514.83 2420.75 - 3.74 Loss 301.25 55.58 35.91 5.65 71.32 1162.30 Tax Paid to Govt. 139.66 301.12 461.14 625.25 634.22 1.44 Gross NPA 3178.01 3566.34 2804.02 3084.82 3712.00 20.32 Gross NPA % 6.55 6.05 4.13 3.72 3.75 --- Net NPA Amount 1625.41 1929.71 1114.54 1423.31 1941.32 36.39 Net NPA % 3.46 3.19 1.68 1.80 2.05 --- Recovery % 79.80 80.84 77.76 80.09 81.18 --- Net Worth 4526.48 6107.37 8570.04 10472.10 12306.53 17.52 Branch Productivity 9.06 10.75 12.41 14.72 16.57 12.57 Staff Productivity 1.93 2.33 2.74 3.70 3.78 2.16
Source: Reports of NABARD and RBI
Regional Rural Banks in India : A Study on its Performance

155
Graph 1 : Key Performance Indicators of RRBs in India
Source : Reports of NABARD and RBI.
Graph 2 : Growth Rate of RRBs in India
Source : Compiled from Reports of NABARD and RBI.
SUMMERY/ OBSERVATION OF THESTUDY (FINDINGS)
Sources of Funds
The sources of funds of RRBs comprise ofowned fund, deposits, borrowings fromNABARD, Sponsor Banks and othersources including SIDBI and NationalHousing Bank.
1. Owned Funds
The owned funds of RRBs comprising ofshare capital, share capital depositsreceived from the shareholders and thereserves stood at Rs. 13838.92 crore as on31 March 2011 as against Rs. 12247.16 croreas on 31 March 2010; registering a growthof 13.0%. The increase in owned funds tothe tune of Rs. 1591.76 crore was mainly onaccount of accretion to reserves by the profit
Mr. Hara Mohan Panigrahi

156
making RRBs. The share capital and sharecapital deposits together amounted to Rs.4273 crore of total owned fund while thebalance amount of Rs. 9566 crorerepresented reserves.
2. Deposits
Deposits of RRBs increased from Rs. 145035crore to Rs. 166232.34 crore during the yearregistering growth rate of 14.60%. GurgaonGB reported the highest deposit growth rateof 37%. There are Sixteen (16) RRBs havingdeposits of more than Rs. 3000 crore each.
3. Borrowings
Borrowings of RRBs increased from Rs.18770 crore as on 31 March 2010 to Rs.26490.81 crore as on 31 March 2011registering an increase of 41.10%.Borrowings viz-a-viz the gross loanoutstanding constituted 26.8% as against22.7% in the previous year.
Uses of Funds
The uses of funds of RRBs comprise ofinvestments and loans and advances.
1. Investments
The investment of RRBs increased from Rs.79379.16 crore as on 31 March 2010 to Rs.86510.44 crore as on 31 March 2011registering an increase of 8.98%. SLRinvestments amounted to Rs. 45022 crorewhere as non-SLR investments stood at Rs.41488 crore. The Investment Deposit Ratio(IDR) of RRBs progressively declined overthe years from 72% as on 31.3.2001 to 52.04% as on 31 March 2011.
2. Loans & Advances
During the year the loans outstandingincreased by Rs. 16098.33 crore to Rs.
98917.43 crore as on 31 March 2011registering a growth rate of 19.4% over theprevious year. Meghalaya Rural Bankrecorded the highest growth rate of 35%during the year 2010-11.
3. Loans Issued
Total loans issued by RRBs during the yearincreased to Rs. 71724.19 crore from Rs.56079.24 crore during the previous yearregistering a growth of 27.90%. SamastipurKGB reported highest growth rate of 123%during 2010-11 followed by AndhraPradesh GVB at 112%.
Working Results:
1. Profitability
75 RRBs (out of 82 RRBs) have earned profit(before tax) to the extent of Rs. 2420.75 croreduring the year 2010-2011. The profit wasmarginally lower than the previous year.After payment of Income Tax of Rs. 634.22crore, the net profit aggregated to Rs.1786.53 crore. The remaining 7 RRBsincurred loss to the tune of Rs. 71.32 crore.
2. Accumulated Losses
As on 31 March 2011, 23 of the 82 RRBscontinued to have accumulated losses to thetune of Rs. 1532.39 crore as againstRs.1775.06 crore (27 RRBs) as on 31 March2010. The accumulated loss decreased byRs. 242.67 crore during the year underreview.
3. Non-performing Assets (NPA)
The Gross NPA of RRBs stood at 3712 croreas on 31.03.2011 (i.e.3.75%). The percentageof Net NPA of RRBs has shown an increasefrom 1.8% to 2.05% during the year. The datarevealed that 15 RRBs had gross NPA
Regional Rural Banks in India : A Study on its Performance

157
percentage of less than 2%, whereas 33RRBs had it above 5%.
4. Recovery Performance
There has been an improvement in therecovery percentage during 2009-10 from80.09% as on 30 June 2009 to 81.18% as on30 June 2010. The aggregate overdue,however, increased by Rs. 934 crore to Rs.9805 crore as on 30 June 2010.
5. Credit Deposit Ratio
The aggregate CDR of RRBs increased overthe years from 57.10% as on 31 March 2010to 59.51% as on 31 March 2011. Eight of theRRBs reported CDR of more than 100%.
6. Productivity of Branch and Staff
The branch productivity increased to Rs.16.57 crore in 2010-11 from Rs.14.72 crorein 2009-10 with a growth of 12.57%.Similarly, staff productivity in 2010-11increased to Rs. 3.78 crore from Rs. 3.70crore in 2009-10 with a growth of 2.16%.
Policy Initiatives during the Year 2010-2011
1. Capital Infusion for improving CRAR
Consequent upon the decision taken in theFinance Minister's Review Meeting of RRBsdated 18.08.2009, a Committee wasconstituted by Government of India,Ministry of Finance, Department ofFinancial Services under the Chairmanshipof Dr. K.C. Chakrabarty, Deputy Governor,Reserve Bank of India, to examine thefinancials of RRBs with reference to CRARand suggest a roadmap for achieving aCRAR of 9% by March 2012. As per Dr. K.C.Chakarbarty Committee Reportrecapitalization to 40 selected RRBs in 21
states was started in 2010-11. Therecapitalization amount is to be shared bythe stake holders in proportion of theirshareholding i.e. 50%, 35% and 15% byCentral Government, concerned sponsorbanks and State Government. As perapproved scheme, the release of CentralGovernment share is subject toproportionate share by the CentralGovernment, concerned sponsor banks andState Government. A sum of Rs. 66.49 crorewas released to 5 RRBs during 2010-11.Accepting the recommendations of thecommittee, the GOI along with othershareholders decided to recapitalize theRRBs by infusing funds to the extent of Rs.2200 Crore. The implementation is alreadyunderway and is expected to be completedduring 2012-13.
2. Regional Rural Bank Service Regulations2010
Based on the recommendations of AmareshKumar Committee, the GOI issued the RRB
Service Regulations 2010.
3. Regional Rural Bank Appointment andPromotion Rules 2010
GOI also notified the RRB Appointment andPromotion Rules 2010, in July 2010.
4. Technology Innovation through CoreBanking Solutions (CBS)
The RRBs were required to ensure that theirbranches are put on CBS platform so thatthey can provide hassle free and any wherebanking services to their clients. 80 RRBshave since been fully migrated to CBS as on30m September 2011. NABARD isproviding financial assistance to identified28 weak RRBs to the extent of 40% for core
Mr. Hara Mohan Panigrahi

158
banking solution from Financial InclusionTechnology Funds (FITF) and rest of the costwill be shared by the Sponsor Bank (50%)and the RRB (10%).
5. Financial Inclusion
As envisaged by the Government of India,RRBs as a group have become a strongintermediary for financial inclusion in ruralareas by opening a large number of "Nofrills" accounts and by financing underGeneral Credit Card (GCC), as per RBIguidelines. Total number of accounts stoodat 1310.17 lakhs in March 2011 which was1188.67 lakhs in March 2010.
6. Interest Subvention to RRBs
The continuance of the interest subventionscheme was announced in the Unionbudget 2010-11. Interest subvention of 1.5%per annum was available to RRBs fordeploying their own funds for crop loan upto Rs. 3 lakhs per farmer, provided theultimate borrower get such loans at 7%interest per annum. An additionalsubvention of 2% was announced duringthe year to those farmers who repaid croploans promptly within one year ofdisbursement. Thus, the interest paid oncrop loans by such farmers was effectivelyat the rate of 5%.
Problems (Weakness) of RRBs
Although RRBs had a rapid expansion ofbranch network and increase in volume ofbusiness, these institutions went through avery difficult evolutionary process due tothe following problems:
1. Very limited area of operations
2. High risk due to exposure only to thetarget group
3. Public perception that RRBs are poorman's banks
4. Mounting losses due to non-viable levelof operations in branches located atresource-poor areas.
5. Switch over to narrow investmentbanking as a turn-over strategy
6. Heavy reliance on sponsor banks forinvestment avenues with low returnsbarring exceptions, step-motherlytreatment from sponsor banks.
7. Chairman of RRBs under the directionof Regional Managers appointed asBoard of Directors by sponsor banks
8. Burden of government subsidy schemesand inadequate knowledge of customersleading to low quality assets
9. Unionized staff with low commitmentto profit orientation and functionalefficiency.
10. Inadequate skills in treasurymanagement for profit orientation.
11. Inadequate exposure and skills toinnovate products limiting the lendingportfolios
12. Inadequate effort to achieve desiredlevels of excellence in staff competencefor managing the affairs and businessas an independent entity
13. Serious undermining of the Board bycompulsions to look up to sponsorbanks, GOI, NABARD and RBI for mostdecisions.
14. RRB hampered by an across the boardban on recruitment of staff.
Regional Rural Banks in India : A Study on its Performance

159
CONCLUSION
To conclude, the rapid expansion of RRBhas helped in reducing substantially theregional disparities in respect of bankingfacilities in India. The efforts made by RRBin branch expansion, deposit mobilization,rural development and credit deploymentin weaker section of rural areas areappreciable. RRB successfully achieve itsobjectives like to take banking to door stepsof rural households particularly in bankingdeprived rural area, to avail easy andcheaper credit to weaker rural section whoare dependent on private lenders, toencourage rural savings for productiveactivities, to generate employment in ruralareas and to bring down the cost ofpurveying credit in rural areas. Thus RRBis providing the strongest banking network.Government should take some effectiveremedial steps to make Rural Banks viable.
Regional Rural Banks plays a key role asan important vehicle of credit delivery inrural areas with the objective of creditdispersal to small, marginal farmers & socioeconomically weaker section of populationfor the development of agriculture, tradeand industry .But still its commercialviability has been questioned due to itslimited business flexibility, smaller size ofloan & high risk in loan & advances. Ruralbanks need to remove lack of transparencyin their operation which leads to unequalrelationship between banker and customer.Banking staff should interact more withtheir customers to overcome this problem.Banks should open their branches in areaswhere customers are not able to availbanking facilities. In this competitive era,RRBs have to concentrate on speedy,
qualitative and secure banking services toretain existing customers and attractpotential customers.
REFERENCESBagachi, K. K. and A. Hadi (2006), Performance
of Regional Rural Banks in WestBengal: an evaluation, Serials Publications:
New Delhi.Bose, S. (2005) Regional Rural Banks: The Past
and the Present DebateDas, U.R. (1998) "Performances and Prospects
of RRBs", Banking Finance November.Gupta, S.K (1996) "Profitability and Regional
Rural Banks", Kurukshetra, July.Gupta and Sodhi (1995), "Economic
Liberalization and Rural Credit",Kurukshetra, Vol.
XLIII, No. 10, p-27-30Horseman, S.B (2002), Performance of Regional
Rural Banks, New Delhi,Ibrahim Dr. M. Syed (2010) "Performance
Evaluation of Regional Rural Banks inIndia", International Business Research Vol. 3,
No. 4; p-203-211Jham Poonam (2012) "Banking Sector Reforms
and Progress of Regional Rural Banksin
India (An Analytical Study)", Online published11 January.
Khankhoje, D. and Sathye, M. (2008) "Efficiencyof Rural Banks: The Case of India",
International Business Research, Vol. 1. No.2,pp. 140-149.
Kannan, R. (2004), Regional Rural BanksMisra, B.S. (2006), "The Performance of
Regional Rural Banks in India: Has PastAnything to Suggest for Future", RBIOccasional Papers, Vol.27, Nos.1 and 2.
Mohindra Versha and Kaur Dr. Gian, TotalFactor Productivity of Regional RuralBanks in India: A Malmquist Approach,
Mr. Hara Mohan Panigrahi
160
Abhinav journal of commerce andmanagement Volume 1 issue 3, p- 75-86
Mohindra Versha and Kaur Gian (2012)Regional Rural Banks in India sinceReforms: A Study of TechnicalEfficiency, Prerana, March.
Prasad, T. S. (2003), Regional Rural Banks:Performance Evaluation, Kurukshetra,Vol. 51, No.10, p. 20-24.
Singha, Kanhaiya (1990) "RestructuringRegional Rural Banks", Kurukshetra, 38(10): 9-11.
Reddy, A. A. (2006) "Productivity Growth inRegional Rural Banks", Economic andPolitical Weekly, Vol. XLI, No.11, pp.1079-1085.
Ramanaa Murty, D.V. (1977) "Regional RuralBanks: An Assessment of Performance",
Southern Economist, No.16 (7), August 1.Reddy, Y.V. (2000) "Rural Credit: Status and
Agenda", Reserve Bank of India Bulletin,November.
Raman Thirumal (2011) "Factors influencingprofitability of Regional Rural Banks(RRBs)", Journal of Banking FinancialServices and Insurance Research,Volume 1, Issue 2, p 76- 84.
Velayudham, T. K., and Sankaranarayanan, V.(1990) "Regional Rural Banks and RuralCredit: Some Issues", Economic andPolitical Weekly, September 22,pp.2157-2164.
REPORTS1. A Study on the Viability of RRBs (1981),
RBI Bulletin, March.2. Government of India, Report of the
Working Group on Regional RuralBanks (1986), New Delhi
3. Government of India (1987), Report ofthe Committee on Agricultural CreditReview Committee, (A. M. Khusro),New Delhi.
3. Government of India (1994), Report ofthe Committee on Restructuring ofRRBs (M. C. Bhandari), New Delhi.
4. NABARD: Reports.5. Reserve Bank of India (2004), Report of
the Advisory Committee on Flow ofCredit to Agriculture and RelatedActivities from the Banking System.
5. Reserve Bank of India (1991), Report ofthe Committee on the Financial System,(chaired by M. Narasimham)
6. Reserve Bank of India (2005), Report ofthe Internal Working Group on RRBs,Chairman: A.V. Sardesai, Mumbai.
7. Report of Trend and Progress inBanking, RBI, Various issues
8. RBI, Monthly Bulletins, Various issues
Regional Rural Banks in India : A Study on its Performance

DIFFUSION OF E-BANKING AND CUSTOMER SATISFACTION:A STUDY ON COMMERCIAL BANKS OF INDIA
*Assistant Professor, BIMIT, Bhubaneswar**Department of Business Administration, Utkal University, Vani Vihar, Bhubaneswar
Mr. Satya Ranjan Dhal*Dr. (Mrs.) Rashmita Sahoo**
INTRODUCTION
The bank customers are the key players ofthe banking industry and all the efforts aremade by the banks to satisfy the desirableneeds of the customers. However,satisfaction of customer depends uponservice quality and service quality isincreasingly offered as a strategy bymarketers to position themselves moreeffectively in the market place (Parasuramanet.al 1988; brown and Swartz 1989; Croninand Taylor 1992). Indian banking industryhas suddenly witnessed a major boom. Dueto the era of e-banking quality of service hasbeen improved a lot as compared to
traditional banking services. AutomatedTeller Machine (ATM), Internet Banking,Smart cards, Credit Cards, Mobile banking,Phone banking, Anywhere-Anytimebanking, etc. have totally changed the wayof providing services by the bank.
Conceptually Internet banking or E-banking is a generic term for the delivery ofbanking services and products through theelectronic channels such as; telephone,internet, cell phone, etc. It means any userwith a personal computer and a browsercan get connected to his bank's website toperform any of the virtual banking function.In fact it allows customers to conduct certain
ABSTRACTE-banking is a delivery channel for banks in India. It is both transactional and informative. Whilelooking at the impact of e-banking in industries, it has been noticed that it has helped to remove theconstraint of time, distance and communication and thus, making world a global village. The study wasconducted with an objective to study the overall satisfaction of the consumers with the quality ofservices and also, to know the perception of customers on all the dimensions of service quality and theirassociation with each other. A structured questionnaire was drafted to collect data regarding the customeropinion on e-banking Provider. The sample size of 210 respondents was taken from commercial banksof Odisha. The data contains the personal details, demographic details and perception of customers onall dimensions of service quality. To achieve the research objective multiple regression analysis wasused to anticipate the impact of independent variables, viz. efficiency, reliability, convenience andflexibility on customer satisfaction. Further it is revealed that though every factor has significantimpact on customer satisfaction, only one factor (i.e., convenience) is positively related with customersatisfaction.
Key Words : E-banking, Customer Satisfaction, Efficiency, Reliability, Convenience and Flexibility.
The Utkal Business ReviewDecember, 2015, Vol - XXIX, pp.-161-168
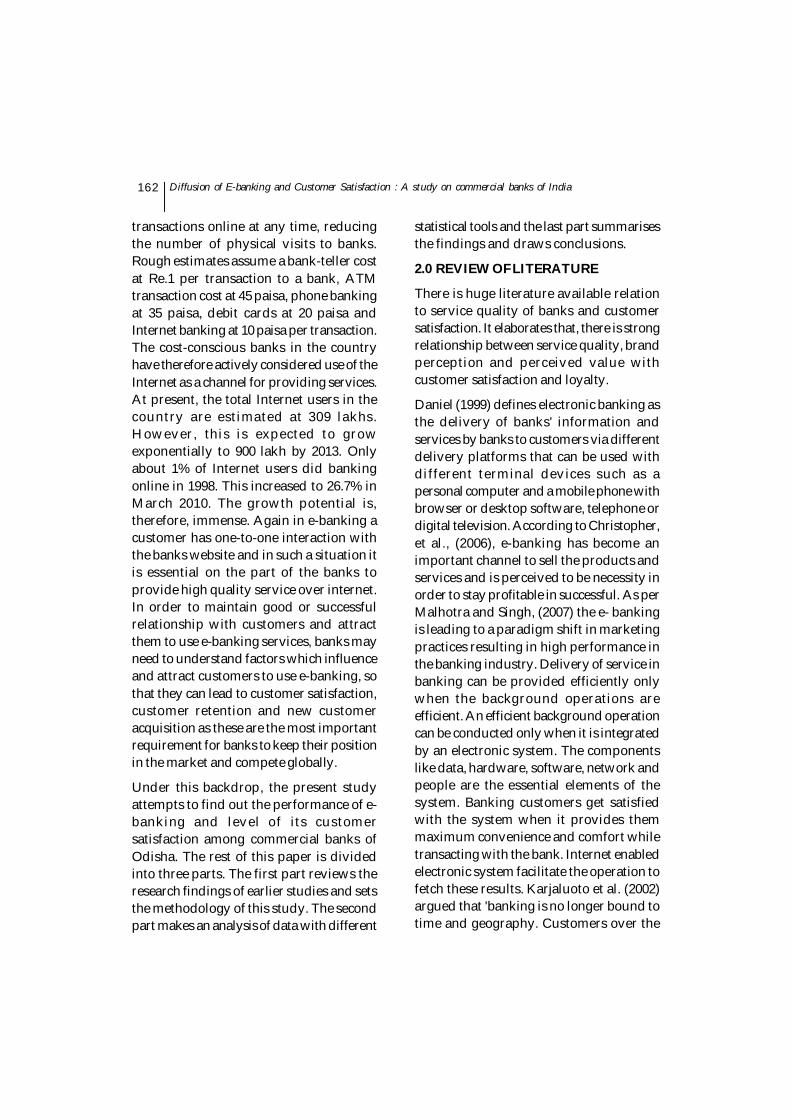
162
transactions online at any time, reducingthe number of physical visits to banks.Rough estimates assume a bank-teller costat Re.1 per transaction to a bank, ATMtransaction cost at 45 paisa, phone bankingat 35 paisa, debit cards at 20 paisa andInternet banking at 10 paisa per transaction.The cost-conscious banks in the countryhave therefore actively considered use of theInternet as a channel for providing services.At present, the total Internet users in thecountry are estimated at 309 lakhs.However, this is expected to growexponentially to 900 lakh by 2013. Onlyabout 1% of Internet users did bankingonline in 1998. This increased to 26.7% inMarch 2010. The growth potential is,therefore, immense. Again in e-banking acustomer has one-to-one interaction withthe banks website and in such a situation itis essential on the part of the banks toprovide high quality service over internet.In order to maintain good or successfulrelationship with customers and attractthem to use e-banking services, banks mayneed to understand factors which influenceand attract customers to use e-banking, sothat they can lead to customer satisfaction,customer retention and new customeracquisition as these are the most importantrequirement for banks to keep their positionin the market and compete globally.
Under this backdrop, the present studyattempts to find out the performance of e-banking and level of its customersatisfaction among commercial banks ofOdisha. The rest of this paper is dividedinto three parts. The first part reviews theresearch findings of earlier studies and setsthe methodology of this study. The secondpart makes an analysis of data with different
statistical tools and the last part summarisesthe findings and draws conclusions.
2.0 REVIEW OF LITERATURE
There is huge literature available relationto service quality of banks and customersatisfaction. It elaborates that, there is strongrelationship between service quality, brandperception and perceived value withcustomer satisfaction and loyalty.
Daniel (1999) defines electronic banking asthe delivery of banks' information andservices by banks to customers via differentdelivery platforms that can be used withdifferent terminal devices such as apersonal computer and a mobile phone withbrowser or desktop software, telephone ordigital television. According to Christopher,et al., (2006), e-banking has become animportant channel to sell the products andservices and is perceived to be necessity inorder to stay profitable in successful. As perMalhotra and Singh, (2007) the e- bankingis leading to a paradigm shift in marketingpractices resulting in high performance inthe banking industry. Delivery of service inbanking can be provided efficiently onlywhen the background operations areefficient. An efficient background operationcan be conducted only when it is integratedby an electronic system. The componentslike data, hardware, software, network andpeople are the essential elements of thesystem. Banking customers get satisfiedwith the system when it provides themmaximum convenience and comfort whiletransacting with the bank. Internet enabledelectronic system facilitate the operation tofetch these results. Karjaluoto et al. (2002)argued that 'banking is no longer bound totime and geography. Customers over the
Diffusion of E-banking and Customer Satisfaction : A study on commercial banks of India

163
world have relatively easy access to theiraccounts, 24 hours per day, and seven daysa week'. The author further argued that, withinternet banking services, the customerswho felt that branch banking took too muchtime and effort are now able to maketransactions at the click of their fingers.Reeti Agarwal et al (2011) in their paper'Customers' perspectives regarding bankingin an emerging economy' conducted on thenorthern part of India consider security andtrust most important in affecting theirsatisfaction level and find slow transactionspeed the most frequently faced problemwhile using e-banking. Robinson (2000)believes that the supply of Internet bankingservices enables banks to establish andextend their relationship with thecustomers. There are other numerousadvantages to banks offered by onlinebanking such as mass customization to suitthe likes of each user, innovation of newproducts and services, more effectivemarketing and communication at lowercosts (Tuchilla, 2000), development of non-core products such as insurance and stockbrokerage as an expansion strategy,improved market image, better and quickerresponse to market evolution(Jayawardhena & Foley, 2000). Routray(2008) observed mobile and wirelesscommunication devices are becomingenablers for organizations to conductbusiness more effectively and efficiently.One of the most effective applications ismobile banking (m-banking). The increasedflexibility and mobility feature of wirelessATM and its bandwidth on demandfunction is motivating a large number ofcarriers towards deployment of the WATMnetworks. Mahmood H S and F A. Siddiqui
(2009) found the most critical factors forsuccess in e-banking include:understanding customers, organizationalflexibility, availability of resources, systemssecurity, established brand name, havingmultiple integrated channels, e-channelspecific marketing, systems integration,systematic change management, supportfrom top management, and good customerservices. They concluded that banks needto implement considerable organizationalchanges in order to web-enable themselves.
3.0 RATIONALE OF THE STUDY
The study will show how the e-bankingservices satisfy the customers. The studywill also explore that to enjoy the e-bankingservices a lot of service characteristicsshould be ensured first by the serviceprovider. Then customer will adopt thesystems properly. This research study hasdone to provide some service qualityvariables that are liable to satisfy thecustomers by rendering right services.
4.0 OBJECTIVES OF THE STUDY
The present study has been framed with thefollowing objectives
a) To know the performance of e-bankingactivities of commercial banks in Odisha.
b) To analyze customer satisfaction levelin e-banking with commercial banks inOdisha.
c) To identify the e-banking benefits fromcustomer's point of view.
d) To provide some recommendations.
5.0 METHODOLOGY
The study is mainly based on the primarydata. However, for general concept
Mr. Satya Ranjan Dhal & Dr. (Mrs.) Rashmita Sahoo
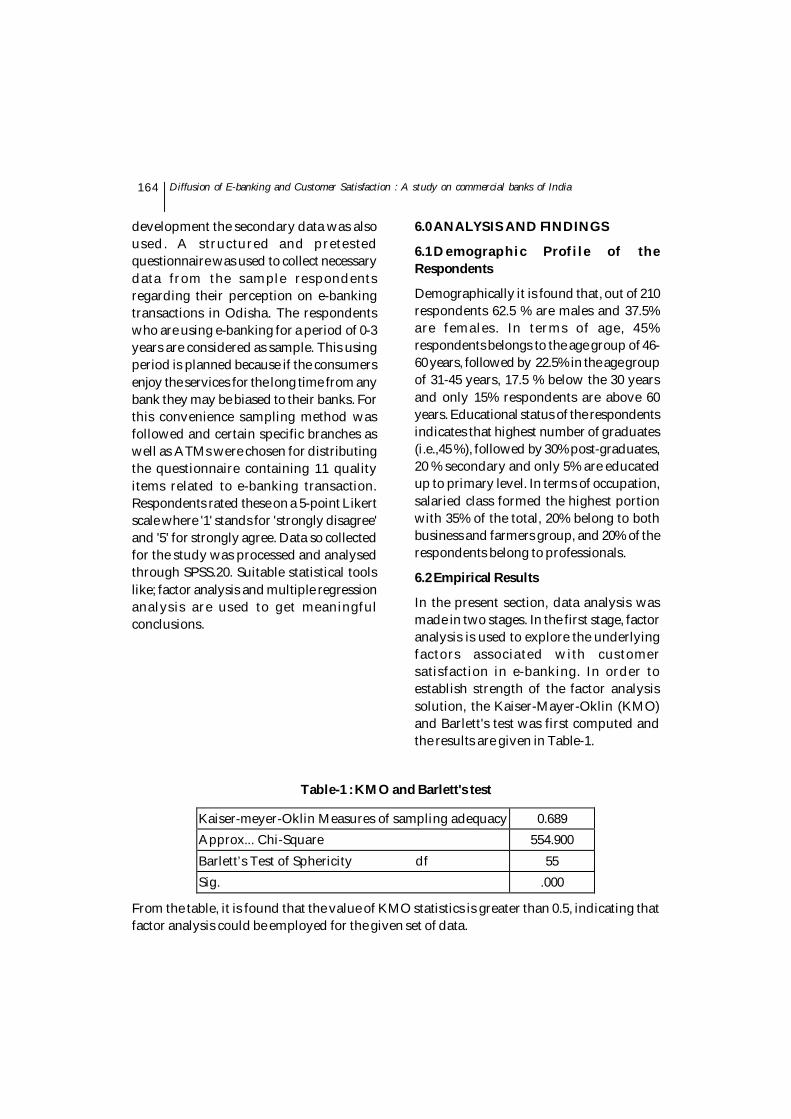
164
development the secondary data was alsoused. A structured and pretestedquestionnaire was used to collect necessarydata from the sample respondentsregarding their perception on e-bankingtransactions in Odisha. The respondentswho are using e-banking for a period of 0-3years are considered as sample. This usingperiod is planned because if the consumersenjoy the services for the long time from anybank they may be biased to their banks. Forthis convenience sampling method wasfollowed and certain specific branches aswell as ATMs were chosen for distributingthe questionnaire containing 11 qualityitems related to e-banking transaction.Respondents rated these on a 5-point Likertscale where '1' stands for 'strongly disagree'and '5' for strongly agree. Data so collectedfor the study was processed and analysedthrough SPSS.20. Suitable statistical toolslike; factor analysis and multiple regressionanalysis are used to get meaningfulconclusions.
6.0 ANALYSIS AND FINDINGS
6.1 Demographic Profile of theRespondents
Demographically it is found that, out of 210respondents 62.5 % are males and 37.5%are females. In terms of age, 45%respondents belongs to the age group of 46-60 years, followed by 22.5% in the age groupof 31-45 years, 17.5 % below the 30 yearsand only 15% respondents are above 60years. Educational status of the respondentsindicates that highest number of graduates(i.e.,45 %), followed by 30% post-graduates,20 % secondary and only 5% are educatedup to primary level. In terms of occupation,salaried class formed the highest portionwith 35% of the total, 20% belong to bothbusiness and farmers group, and 20% of therespondents belong to professionals.
6.2 Empirical Results
In the present section, data analysis wasmade in two stages. In the first stage, factoranalysis is used to explore the underlyingfactors associated with customersatisfaction in e-banking. In order toestablish strength of the factor analysissolution, the Kaiser-Mayer-Oklin (KMO)and Barlett's test was first computed andthe results are given in Table-1.
Table-1 : KMO and Barlett's test
Kaiser-meyer-Oklin Measures of sampling adequacy 0.689 Approx... Chi-Square 554.900 Barlett’s Test of Sphericity df 55 Sig. .000
From the table, it is found that the value of KMO statistics is greater than 0.5, indicating thatfactor analysis could be employed for the given set of data.
Diffusion of E-banking and Customer Satisfaction : A study on commercial banks of India
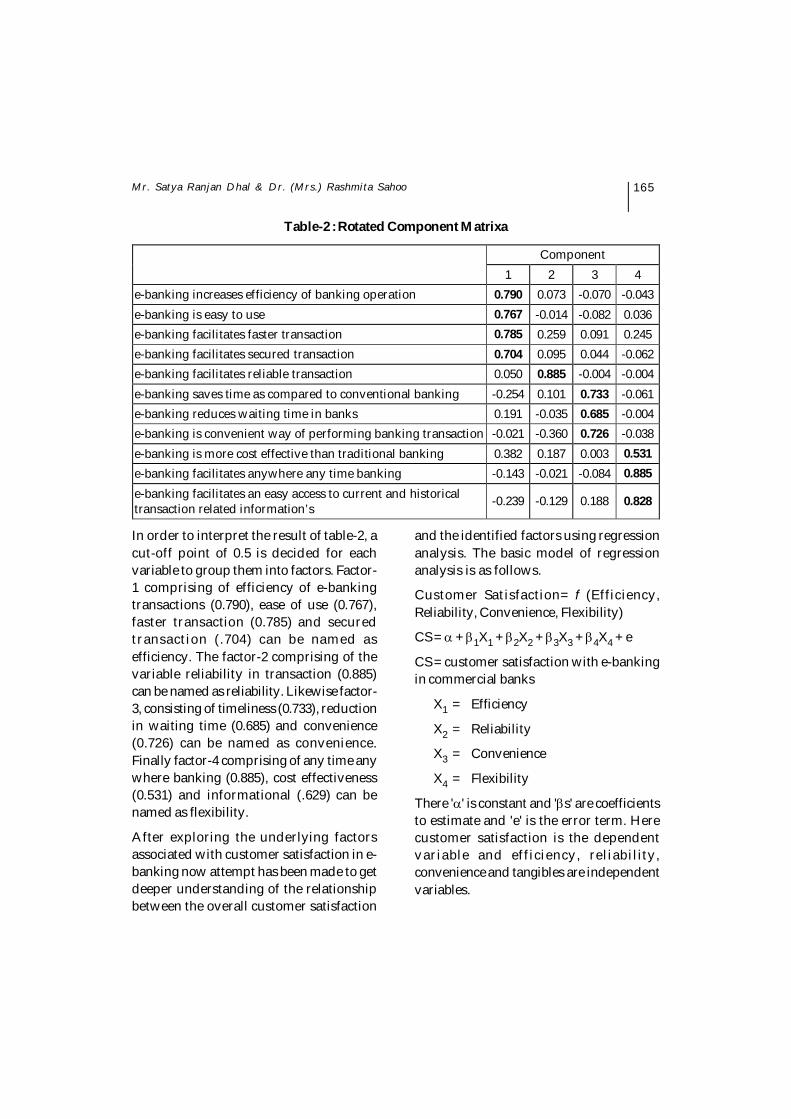
165
In order to interpret the result of table-2, acut-off point of 0.5 is decided for eachvariable to group them into factors. Factor-1 comprising of efficiency of e-bankingtransactions (0.790), ease of use (0.767),faster transaction (0.785) and securedtransaction (.704) can be named asefficiency. The factor-2 comprising of thevariable reliability in transaction (0.885)can be named as reliability. Likewise factor-3, consisting of timeliness (0.733), reductionin waiting time (0.685) and convenience(0.726) can be named as convenience.Finally factor-4 comprising of any time anywhere banking (0.885), cost effectiveness(0.531) and informational (.629) can benamed as flexibility.
After exploring the underlying factorsassociated with customer satisfaction in e-banking now attempt has been made to getdeeper understanding of the relationshipbetween the overall customer satisfaction
and the identified factors using regressionanalysis. The basic model of regressionanalysis is as follows.
Customer Satisfaction= f (Efficiency,Reliability, Convenience, Flexibility)
CS = + 1X1 + 2X2 + 3X3 + 4X4 + e
CS = customer satisfaction with e-bankingin commercial banks
X1 = Efficiency
X2 = Reliability
X3 = Convenience
X4 = Flexibility
There '' is constant and 's' are coefficientsto estimate and 'e' is the error term. Herecustomer satisfaction is the dependentvariable and efficiency, reliability,convenience and tangibles are independentvariables.
Table-2 : Rotated Component Matrixa
Component 1 2 3 4
e-banking increases efficiency of banking operation 0.790 0.073 -0.070 -0.043 e-banking is easy to use 0.767 -0.014 -0.082 0.036 e-banking facilitates faster transaction 0.785 0.259 0.091 0.245 e-banking facilitates secured transaction 0.704 0.095 0.044 -0.062 e-banking facilitates reliable transaction 0.050 0.885 -0.004 -0.004 e-banking saves time as compared to conventional banking -0.254 0.101 0.733 -0.061 e-banking reduces waiting time in banks 0.191 -0.035 0.685 -0.004 e-banking is convenient way of performing banking transaction -0.021 -0.360 0.726 -0.038 e-banking is more cost effective than traditional banking 0.382 0.187 0.003 0.531 e-banking facilitates anywhere any time banking -0.143 -0.021 -0.084 0.885 e-banking facilitates an easy access to current and historical transaction related information’s -0.239 -0.129 0.188 0.828
Mr. Satya Ranjan Dhal & Dr. (Mrs.) Rashmita Sahoo
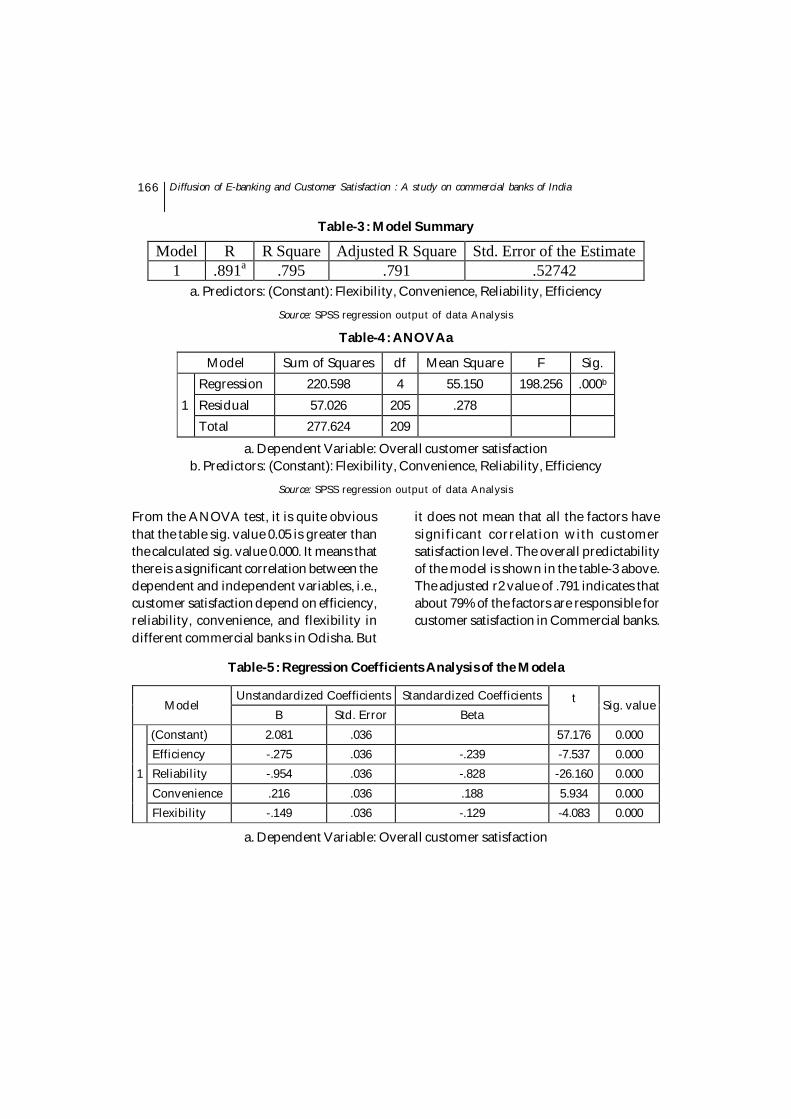
166
From the ANOVA test, it is quite obviousthat the table sig. value 0.05 is greater thanthe calculated sig. value 0.000. It means thatthere is a significant correlation between thedependent and independent variables, i.e.,customer satisfaction depend on efficiency,reliability, convenience, and flexibility indifferent commercial banks in Odisha. But
it does not mean that all the factors havesignificant correlation with customersatisfaction level. The overall predictabilityof the model is shown in the table-3 above.The adjusted r2 value of .791 indicates thatabout 79% of the factors are responsible forcustomer satisfaction in Commercial banks.
Table-3 : Model Summary
Model R R Square Adjusted R Square Std. Error of the Estimate 1 .891a .795 .791 .52742
a. Predictors: (Constant): Flexibility, Convenience, Reliability, Efficiency
Source: SPSS regression output of data Analysis
Table-4 : ANOVAa
Model Sum of Squares df Mean Square F Sig.
1 Regression 220.598 4 55.150 198.256 .000b Residual 57.026 205 .278 Total 277.624 209
a. Dependent Variable: Overall customer satisfactionb. Predictors: (Constant): Flexibility, Convenience, Reliability, Efficiency
Source: SPSS regression output of data Analysis
Table-5 : Regression Coefficients Analysis of the Modela
Model Unstandardized Coefficients Standardized Coefficients t
Sig. value
B Std. Error Beta
1
(Constant) 2.081 .036 57.176 0.000 Efficiency -.275 .036 -.239 -7.537 0.000 Reliability -.954 .036 -.828 -26.160 0.000 Convenience .216 .036 .188 5.934 0.000 Flexibility -.149 .036 -.129 -4.083 0.000
a. Dependent Variable: Overall customer satisfaction
Diffusion of E-banking and Customer Satisfaction : A study on commercial banks of India

167
From the above analysis we can develop thefollowing regression model
CS =2.081 - 0.275X1 - 0.954X2 + 0.216X3 -0.149X4
SE = (0.036) (0.036) (0.036) (0.036) (0.036)
Result of coefficient analysis presented inTable-5 shows the relationship betweendependent and independent variables.According to Sig. value, in commercialbanks all the four factors have significantconnection with customer satisfaction level,as table Sig. value of 0.05 is greater than thecalculated Sig. value of 0.000 each. Againthe above regression equation indicates thatthe efficiency, reliability and flexibility arenegatively related with customersatisfaction in commercial banks. Thus nowthe findings can be interpreted as under:
X3(Convenience) = 0.216, i.e., 100% changein convenience aspects will leads to 21.6%change in customer satisfaction level.
7.0 CONCLUSION AND MANAGERIALIMPLICATIONS
From the above analysis, it can be concludedthat there is a relation between customersatisfaction in e-banking and variables; likeefficiency, reliability, convenience andflexibility. Therefore, banker and e-bankingservice designers should think over thesedimensions and make possible changes inthe e-banking services according to thecustomers' expectations and need of thetime. It will be helps to enhance servicequality of e-banking and increase the levelof customers' satisfaction. The study triedto point out the gap which exists in theservice quality; however, it can improvewith a slight change in the orientation ofthe bank's policy.
Since, customers are more qualityconscious and price sensitive, theactions of the service provider will leadto increased trust and loyalty in the e-banking of the bank. Thus, customerservice should be given utmostimportance along with commitment tothe customers, since customers areprovided will numerous options fromthe competitors.
It is also noticed that loyal customers canadd more customers by positive word ofmouth and references about the efficientservice of the company.
Lastly, by providing effective service tothe customers, through quality service,commitment and effectivecommunication, service providers canbetter understand the needs of thecustomers and serve these needs moreremarkably as compared to thecompetitors and thus, eliminatinghigher switching cost.
8.0 LIMITATIONS OF THE STUDY
The study was conducted amidst certainlimitations, which can be seen as: Firstly,the impact of impact of socio-demographicfactors such as gender, educational level,income and age should be taken intoconsideration so as to look into servicequality and customer loyalty relationship,which can help in effectively contributingtowards managerial implications.Secondly, due to the limitation of financialresources and time available, survey ofcustomers is of limited scale and scope,such that it might not be a completerepresentation of the population. Thirdly,the study only covers Odisha State, suchthat the results may not apply directly to all
Mr. Satya Ranjan Dhal & Dr. (Mrs.) Rashmita Sahoo

168
other regions. Lastly, a small sample sizehas a greater probability that theobservation just happened to be particularlygood or particularly bad. Therefore it isharder to find significant relationships fromthe data, as statistical tests normally requirea larger sample size to justify that the effectdid not just happened by chance alone.
CONCLUSION
Hopeful is the feeling engendered by the MEresponses to the question concerningfactors encouraging supply chainimplementation. It was expected that mostof the micro entities that had accomplished
REFERENCESDash, A. Branch Automation as a Driver of
Customer Satisfaction-A study WithReference to Public Sector Banks.International Journal on GlobalBusiness Management and Research, 64.
Sathye, M., 1999. Adoption of internet bankingby Australian consumers: An empiricalinvestigation. Int. J. Bank Market. 17:324-334.
Dash, A. (2013). Technological Revolution andIts Implication on Customer ValuePerception: A Study on Indian BankingSector. International Journal ofInnovative Research and Development,2(12).
Dash, A. (2013). Diffusion of Mobile Bankingand Its Adoption: An Empirical Studyin India. Siddhant-A Journal of DecisionMaking, 13(4), 261-266.
Dash, A. (2013). Diffusion of Mobile Bankingand Its Adoption: An Empirical Studyin India. Siddhant-A Journal of DecisionMaking, 13(4), 261-266.
Venkatesan, R. and V. Kumar, 2004. A customerlifetime value framework for customerselection and resource allocationstrategy. J. Market., 68: 106-125.
Shamdasani, P., A. Mukherjee and N. Malhotra,2008. Antecedents and consequences ofservice quality in consumer evaluationof self-service internet technologies.Serv. Inds. J., 28: 117-138.
Serkan, A., A. Safak and A. Eda, 2004. Adoptionof internet banking amongsophisticated consumer segments in anadvanced developing country. Int. J.Bank Market. 22: 212-232.
Haque, 2009, issues of e-banking transaction:An empirical investigation on Malsyancustomers perception. Int. J. of appliedsciences 9(10):1870-1879
Dash, A. (2012). Online shopping and customersatisfaction: An empiricalinvestigation. International Journal ofResearch in Management, Economicsand Commerce, 2(11), 42-49.
Katariina, M., 2006. Clustering the consumerson the basis of their perceptions of theinternet banking services. Intn. Rech.,16: 304-322.
Agarwal, R, Rastogi, S & Mehrotra,A.,"Customers 'perspectives regardinge-banking in an emerging economy,"Journal of Retailing and ConsumerServices, vol. 16, pp. 340-351, 2009.
Aladwani, A., "Online Banking: A Field Studyof Drivers, Development Challenges,and Expectations," International Journalof Information Management, vol. 21,pp. 213-225, 2001.
Geetika, Nandan, T & Upadhyay,AK., "InternetBanking in India: Issues andProspects," The Icfai Journal of BankManagement, vol. 7, no. 2, pp. 47-61,2008.
Diffusion of E-banking and Customer Satisfaction : A study on commercial banks of India

CRM IN BANKING SECTOR-A RESERCHER'SPROSPECTIVE ON BIBLIOGRAPHIC SURVEY
*Assistant Professor, SAI International College of Commerce, Bhubaneswar**Head P.G.Department of Commerce, Utkal University
Mrs. Sweta Leena Hota*Dr. Maheshwar Sahu**
INTRODUCTION
The concept of banking can be traced backto authentic history and as early as 2000B.C. Babylonians who are said to be thedevelopers of banking system. The mostancient bank is supposed to be The Bank ofVenice, established in the year 1157. InIndia, the Vedic period gives traces ofbanking system. But in those days bankingmeant only lending money whereas today'sbanking is far more complicated andmodernized. The oldest bank in India is theState Bank of India which originated asBank of Calcutta in 1806. Banking industrytoday is a major sector for the existencedevelopment of any economy of the world.
Liberalization of the Indian economy hasbrought with itself tech savvy banks thathave left no stones unturned to acquire andretain their customers. The opening of the
economy saw a surge of private sector banksjoining the fray and offering a plethora ofproducts and services. But today'sintelligent customers are challenging thebanking industry to redefine the bankingsector. The just banking concept haschanged to need based banking conceptwith Customer Relationship Managementbecoming the centre of success for everybusiness, particularly service sector.Bateman and Snell have rightly pointed outthat "Customer Relationship Managementis a business process which results inoptimized profitability and revenuegeneration, while achieving customersatisfaction." CRM today has completelychanged the definition of marketing. Themodern marketing concept has becomefocussed on Relationship Building ratherthan just acquiring.
ABSTRACTIn the present competitive scenario the core of banking has changed from only banking to need basedbanking. Customer satisfaction has become the buzz work for success of any organisation. CRM is abusiness strategy that focuses on customer retention rather than customer acquisition. CRM emphasiseson creating, satisfying and retaining customers through need based services. CRM has become aninevitable tool of modern day marketing and can be adopted uniformly in the banking industry. Thispaper is a literature review on the meaning of CRM, the philosophy of CRM and how CRM has beenaccepted by the banking sector. Building a lifelong relationship with customers is the key to success forany business today.
Key Words : Customer Relationship Management, Customer Satisfaction, Banking
The Utkal Business ReviewDecember, 2015, Vol - XXIX, pp.-169-177

170
Rangarajan(2010) has said that CRM hasbecome a major tool for corporate strategyin case of many organisation. He hasopined that a greater focus on CRM is theonly way banking sector and other sectorscan protect their market share and enhancegrowth.
Strauss et al. (2003) has opined that CRM isa complete process of acquiring, retainingand enhancing customer base for anyorganisation.
Customer Relationship Management is oneof the strategies to manage customers as itfocuses on understanding customers asindividuals instead of as part of a group(Lamber 2010).
OBJECTIVES
The specific objective of my research paperis as follows;
To review the literature on the conceptof CRM
To review the literature on CRM inBanking sector
RESEARCH METHODOLOGY
To meet the objectives of the present studyonly secondary data has been collected.Secondary data has been collected throughdifferent journals, magazines, websites,bank records, different publications, etc.
REVIEW OF LITERATURE:
CONCEPT OF CRM
CRM appeared in literature after theevolution of relationship marketingphilosophy. Berry (1983) definedrelationship as attracting, maintaining andenhancing the customers' relationships in
multi service industry. After a few decadesCRM replaced relationship marketing.
According to Brown (2000) CRM is theprocess of acquiring new customers,retaining the existing customers and at thesame time understanding, anticipating andmanaging the needs of organisation'scurrent and potential customers.
Parvatiyar and Sheth (2001) observed thatCRM is a comprehensive strategy andprocess of acquiring,retaining andpartnering with selective customers to createsuperior value for the company with thecustomers.
Swift (2001) has observed that CRM is aprocess designed to gather data ofcustomers, to grasp features of customers,and to apply those qualities in specificmarketing activities
Parvatiyar et al (2001) observed that CRMis a compressive strategy and process ofacquiring, retaining and partnering withselective customers to create superior valuefor the company with the customers
Bose(2002) indicates that CRM involvesacquisition, analysis and use of knowledgeabout customers in order to sell more goodsor services and to do it more efficiently
Panda(2003) says that CRM in financialservice industry is a cyclical process whichstarts with definition of customer. CRM isfundamental to building a customer-centricorganization. CRM is a key element thatallows a bank to develop its customer baseand sales capacity.
In Peter F. Drucker's words, the purpose ofbusiness is to create and keep a customer.Every businessman understands the truth
CRM In Banking Sector-A Resercher's Prospective on Bibliographic Survey

171
of these words. Today, when businesses arescrambling to get customers, the importanceof Customer Relationship Management(CRM) must not be ignored. That's whyanalysts, vendors, and solution providersare positive about the growth of CRM in thecountry.
Pisharodi et al (2003) in a study of successof CRM found that a process-orientedstrategic approach to connect theoperational, informational and theorganizational components of CRM arecritical for the success of CRM application.
Bhaskar P.V. (2004) opined that once goodservice is extended to a customer, a loyalcustomer will work as an Ambassador tothe bank and facilitate growth of Business.The level of customer service andsatisfaction is determined by branchlocation and design, variety of services, ratesand charges, systems and procedures,delegation and decentralization,mechanization and computerization,competitive efficiency, complaint redressaland very importantly staff skills, attitudesand responses.
A.G.Shankar(2004) says managing thecustomer relationship is the future of anybusiness or everybody's business. Customerfocusing is not to be' viewed as just abusiness strategy but should become acorporate mission.
K.S.Swarup(2004) For delivering qualityservice, it is imperative to have customerorientation as a culture in the bank. Thecustomer orientation builds long termrelationships resulting in customersatisfaction and cash flows to the bank.
According to Kotler P(2005), the
liberalization, privatization andglobalisation have ushered the customerrelationship management in banks. Theprocess of globalisation and our movetowards global standards have changed theperception of customer service and bankingendeavour to serve the customer better,resulted in innovative banking services andproducts. more and more interaction withcustomers to build customer relationshipbanking. But to deliver an improved andin-depth understanding of customer'sneeds, fully integrated customermanagement system is required along withcomplete transparency. In the emergingmarket scenario, for survival and growth, itis critical for a bank to align its vision,mission, goals and objectives withcustomer's satisfaction. The marketingtechniques of banks affect the performanceof banks.
CRM: THE PHILOSOPHY
Marketing practitioners and scholars havestrongly recommended striving for closerelationships with customers (Day, 2000;Lemon et al,2002; Sheth and Parvatiyar,1995). Over the years many organizationshave been compelled to accept thisconclusion. Most notable among these arethe beliefs that existing customers are moreprofitable because the acquiring andattracting of new customers is expensive,and that it is less costly to up-sell or cross-sell products or services to currentcustomers (Berry, 1995; Peppard, 2000;Sheth and Paravatiyar, 1995). One of themost important studies conducted in thisfield is by Reichheld and Sasser (1990),which showed the large impact onprofitability of smallincreases in customer
Mrs. Sweta Leena Hota & Dr. Maheshwar Sahu

172
retention rates, which made the marketingcommunity more conscious of the need tomanage customer relationships in the longterm as well as prior to the first sale. Inaddition, more studies have shown that thecost of retaining current customers is lowerthan the cost of acquiring new ones(Blattberg and Deighton 1996, Filiatraultand Lapierre 1997) and that economicbenefits of high loyalty are important, andin many industries it is this whichdetermines the differences betweencompanies (Reichheld 1996).
The objective of customer relationshipmanagement is to unite and joininformation technology and businessprocesses in a fashion that enables the firmto acquire new customers, retain existingcustomers, and maximize the lifetime valueof its customers (Peppard, 2000). Mostimportantly, CRM allows firms todifferentiate customer treatments based onspecific customer needs and preferences.Additionally, financial metrics that arecentred on customers allow firms tosegregate those customers that the firmshould be keeping from those it should bewilling to lose (Dyche, 2001), enablingmicro-management of profitability.
The huge number of CRM initiatives carriedout reflects both the complexity andelusiveness of the CRM concept. While thenumber of CRM initiatives is growing fast,scholarly published material on CRMprinciples is rather limited. Panda (2003)argues 19 that Berry (1983) formallyintroduced the term customer relationshipmanagement to literature. Several ideas ofrelationship marketing had, however,emerged much earlier, such as the one
provided by John Arndt (1979), who notedthe tendency of firms engaged in business-to-business marketing to develop long-lasting relationships with their importantcustomers and their key suppliers ratherthan focus on discrete exchange and namedthem "domesticated markets".
In recent years, customer relationshipmanagement has been expanded to includean integrated perspective on marketing,sales, customer service, channelmanagement, logistics and technology forengaging in customer satisfaction.Practitioners are calling it customerrelationship management (CRM) and areinterested in all aspects of interactions withcustomers to maintain a long-termprofitable relationship with them.
After reviewing the literature, some of thedefinitions used to define CRM are asfollows:
Bob Thompson (2001, crmguru.com)defined CRM as follows: "Customerrelationship management (CRM) is abusiness strategy to select and manage themost valuable customer relationships. CRMrequires a customer-centric businessphilosophy and culture to support effectivemarketing, sales and service processes.CRM applications can enable effectivecustomer relationship management,provided that an enterprise has the rightleadership, strategy and culture."
Chen et al. (2003, p.682 ) wrote that: "CRMis a cross-functional, customer-driven,technology-integrated business processmanagement strategy that maximizesrelationships and encompasses the entireorganization"
CRM In Banking Sector-A Resercher's Prospective on Bibliographic Survey

173
"CRM is a strategy to identify and attractprofitable customers, tying them to thecompany or product by efficient relationshipmarketing to guarantee profitable growth.CRM offers a great platform for theacquisition of new customers in addition togaining customer satisfaction and loyalty.Additionally, existing customerrelationships can be used to drive sales viaup or cross-selling. The most "valuable"customers especially need to be identified,attracted and retained" (Kracklauer et al.,2001, p. 516).
CRM IN BANKING INDUSTRY
Philip Kotler (2001) looking at the shape ofmarketing in the new millennium , in hisarticle titled " Where do we go from here" ,opined that businesses are doing a betterjob of retaining customers thorough findingimaginative ways to exceed customerexpectations. As a result competitors find itincreasingly difficult to acquire newcustomers and most companies arespending time finding out how to sell moreproducts and services to their existingcustomers.
Sajal Kabiraj et al (2004) concluded in theirstudy on "Customer RelationshipManagement Practices in Retail Banking:An Indian Experience" that, CRM systemsdevelopment and implementation are a keypriority for the most modem Indian retailbanks. Just over two thirds of the Indianretail banks have adopted a full CRMpackage such as SIEBEL, but the consensusis to develop as much as possible in house.In fact, the remaining one third buy softwarefor specific functions commonly related todata mining and automated sales.
S. Syamali, (2004) in her article titled"Continue, compete and conquer throughtechnology" concluded that , " As the degreeof uncertainty is more in banking sector theyhave to depend more on building customerrelationship which is a permanent assetbringing in regular income rather than merehardware which have obsolescence as acritical factor. Technology shall beprudently used more as a means to achievethe end result.
Dr. Sulthan Singh, (2004) in his article "Anappraisal of Customer Service of publicsector banks", opined that, "In a serviceindustry like banking, the quality ofcustomer service holds great significance.Unlike other industries engaged in theproduction of tangible goods, banks areunique in the sense that they are producingand delivering the service instantaneouslyat the service delivery points i.e., atbranches. This makes the customer supersensitive towards of quality of services".
In a study conducted by Zillur Rahman(2005) titled " Customer ExperienceManagement - A Case Study of an IndianBank" conveyed that loyal customers areconsidered to be the key to survival andsuccess in many service businesses, inparticular in the hospitality , insurance andfinancial sectors. The assumption is thatwith customer satisfaction; Loyalty,Retention and Profitability willautomatically follow. At the end the studyconcluded that, an average, a majority ofcustomers are satisfied with the presentfunctioning of the bank, but would definitelybe delighted if the bank changed its interfacewith the customers to become cognitive(intelligent), emotional, physically pleasingand well connected.
Mrs. Sweta Leena Hota & Dr. Maheshwar Sahu

174
A major finding of a study conducted ontwo Swedish Banks by Javed ToufighiZavareh(2007) titled "The Role of AnalyticalCRM in Maximizing Customer Profitabilityin Private Banking" suggests that CRMhelped both banks to facilitate profitablerelationships and establishing long-termrelationships. Therefore, CRM deploymentis positively related to the creation aridcontinuous maintenance of profitable andlong-term relationships with the customersof the banks.
Madhu Jasola and Shivani Kapoor (2008)in their study titled "CRM: A Competitivetool for Indian Banking Sector" observedthat, CRM is not a product or service, it isan overall business strategy that enablescompanies to effectively managerelationships with their customers. Theyalso observed that customers in the CRMbank rate its services more favorably thanthose in the non-CRM. The outcome of thestudy also reveals that there is a directrelationship between perception andsatisfaction, commitment and loyalty whichunderlines the significance of CRM inservice industry.
Patwardhan et al (2009) evaluate thecurrent Customer RelationshipManagement (CRM) process and discoverthe factors that influence CRM in IndianBanking sector. The competition andexpectation of excellence services haveforced Indian banks to implement CRMvigorously in order to increase return oninvestment (ROI). Using respondents fromboth private and public sector banks, theresults indicate four major factors-company, staff, technology, and customer-contributing to the CRM implementation inbanking sector.
RESEARCH GAP:
There is limited research on CRM for Indianretail banking sector. The researcher aimsto examine the implications of CRM or theeffectiveness of CRM in promoting theexisting as well as innovative bank productsamongst the customers of the banks withparticular reference to selected banks inOdisha. A close review of the availableliterature on different aspects of bankmarketing has brought to light the dearth ofresearch on application and adoptions ofCRM in commercial bank in India and withparticular references to banks in Odisha.This study aims at examining in detail howeffectively the practices have been deployedin selected expanding banks. It explores theassociation of CRM best practices withservice effectiveness and profitability ofselected commercial banks. It aims atexamining how CRM as a tool of marketingis effective in satisfying the customers withregards to a wide range of services in thebank and the impact of CRM on profitabilityof banks.
CONCLUSION
Marketing has played a crucial role inbuilding a customer centric organization.The traditional marketing concept whichworked on the philosophy of selling orattaining new customers without payingattention to customer satisfaction has beenreplaced with the modern concept ofmarketing which stresses on customerloyalty through customer satisfaction.Customer satisfaction is presumed as ameasure of customer loyalty and theretention of the existing customer base.Kotler (2002) emphasized that firms shouldformulate their own set of approaches to
CRM In Banking Sector-A Resercher's Prospective on Bibliographic Survey
175
ensure that their products and services aremore superior to their competitors. ThroughCRM, banks can create a spirited advantageby synergizing their efforts to effectivedelivery of customer satisfaction whilegetting the most out of the profits. The studyaims at analyzing CRM as a tool of modernday bank marketing tool, itsimplementation, adoption, its functioning,the perception of bank employees towardsCRM, customers' perception andeffectiveness of CRM as a tool in satisfyingand retaining the customers and the impactof CRM adoption on the profitability ofselected banks.
REFERENCESAlmossawi, M. (2001). Bank selection criteria
employed by college students inBahrain: An empirical analysis.International Journal of BankMarketing, 19 (3), 115-125.
Achumba, I. C. (2006). The Dynamics ofConsumer Behaviour, (Newed.). Lagos:Mac - Williams.
Bansal, Ipshita and Sharma, Rinku. (2008).Indian Banking Services: Achievements and challenges. The Icfai UniversityJournal of services marketing,Hyderabad. VI (2),32-43
Brown, S. A. (2000). Customer RelationshipManagement: A Strategic Imperative inthe World of E-Business. Canada: JohnWiley & Sons.
Berger PD, Bolton RN, Bowman D, Briggs E,Kumar V, Parasuraman A, Creed T.
(2002). Marketing Actions and the Value ofCustomer Assets. Journal of Services
Research, 5(1), 39-54.Blattberg R C, Getz G, Thomas J. S. (2001).
Customer Equity: Building andManaging Relationships as Valuable
Assets. Boston: Harvard BusinessSchool Press.
Berry L.L (1983). Relationship marketingofservices: Growing Interest, EmergingPerspectives. Journal of AcademyofMarketing Science, 23 (4), 236-245.
Berry, L. L. (1983). Relationship Marketing. InBerry L., Shostack L.G. and Upah G. D.(Eds.). Emerging Perspectives onService Marketing. Chicago: AmericanMarketing Association, 28-30.
Buttle, F. (2002). The S. C. O.P. E. of CustomerRelationship Management. Available:http://www.crmforum.comllibrary/aca/aca-07.htmt
Chaitanya, K. V. (2005). Metamorphosis ofMarketing Financial Services in India.Journal of Services Research, 5 (April-September), 6-15.
Chary T. Satya Narayana & Ramesh, R. (2012).Customer Relationship Management inBanking Sector- A Comparative Study,KKIMRC IJRHRM, 1 (2), 20-29.
Dutta, K. & Dutta, A. (2009). CustomerExpectations and Perceptions across theIndian Banking Industry and theResultant Financial Implications.Journal of Services Research, 9, 31-49.
Dwyer, FR, Schurr PH, Oh S. (1987). DevelopingBuyer-Seller Relations. J. Mark., 51(2),11-28.
Durkin, M. (2004). In Search of the Internet-Banking Customer. The InternationalJournal of Bank Marketing, 22 (7), 484-503.
Dyche, J. (2001). The CRM Handbook: ABusiness Guide to CustomerRelationship Management, Reading,MA: Addison-Wesley.
Eisingerich, A. B. and Bell, S. J. (2006).Relationship Marketing in the FinancialServices Industry: The Importance ofCustomer Education, Participation and
Mrs. Sweta Leena Hota & Dr. Maheshwar Sahu

176
Problem Management for CustomerLoyalty. Journal ofFinancial ServicesMarketing, 10 (4), 86-97.
Gan, C., Cohen, D., Clemes, M. and Chong, E.(2006). A Survey of CustomerRetentionin the New Zealand Banking Industry:Banksand Bank Systems.Journal ofBusiness Research, 1 (4), 83-9
Gilly, M. C., Stevenson, W. B. and Yale, L. J.(2005). Dynamics of Complaint
Management in the Service Organisation.Journal of Consumer Affairs, 25 (2), 295-299.
Groonroos, C. (1990). Relationship Approachto Marketing in Service Contexts: TheMarketing and OrganisationalBehaviour Interface. Journal ofBusinessResearch, 20 (1), 3-11.
Gummesson, E. (1987). The New Marketing:Developing Long-Term InteractiveRelationships. Long Range Planning, 20(4), 10-20.
Heskett JL, Jones TO, Loveman G, Sasser WE,Schlesinger L.A. (1994). Putting theService-Profit Chain to Work. HarvardBus. Rev., 72(2), 164-170.
Hussain, I., Hussain, M., Hussain, S., & Sajid,M. A. (2009). Customer relationshipmanagement: Strategies and practicesin selected banks of Pakistan.International Review of BusinessResearch Papers, 5(6), 117-132.
Ingram, T. N. (1996). Relationship Selling:Moving from Rhetoric to Reality.Journal of Business, 11 (Spring), 5-10.
Kumar M. Ashok and Rajesh R. (2009). WhetherToday's Customers are Satisfied? - Astudy with Banks. Indian Journal ofMarketing, New Delhi, XXXIX (9), 45-53.
Khandwalla, P. N. (1995). Management Style.New Delhi: Mc-Graw Hill.
Lau K, Wong S, Ma M and Liu C. (2003). Nextproduct to offer for Bank Marketers.Journal of Database Marketing, 10(4),353-368.
Lu, C.S. & Shang, K.C. (2007). An Evaluation ofCustomer Relationship Management inFreight Forwarder Services.Proceedings of the 13th Asia PacificManagement Conference, Melbourne,A u s t r a l i a . A v a i l a b l e a t : h t t p : / /www.proquest.com
Lambert, D., M. (2010). Customer relationshipmanagement as a business process. TheJournal of Business & IndustrialMarketing, 25(1), 4.
Mylonakis, John. (2009). Bank satisfactionfactors and loyalty: a survey of theGreek bank customers, InnovativeMarketing, 5(1), 16-25.
Mudie P, Cottam A. (1993). The Managementand Marketing of Services. Oxford:Butterworth-Heinemann.
Ndubisi, N. O., Wah, C. K., & Ndubisi, G. C.(2007). Supplier-customer relationshipmanagement and customer loyalty: Thebanking industry perspective. Journalof Enterprise Information Management,20 (2), 222-236.
O'Marlley, L. and Tynan, C. (2000). Relationshipmarketing in consumer markets,Rhetoric or reality? European Journalof Marketing, 34 (7), 797-815
Panda, T.K. (2003). Creating Customer LifetimeValue through effective CRM inFinancial Services Industry", Journal ofServices Research, 2 (2), 157-171.
Page, R., Jagger, N., Tamkin P. and Henwood,N. (2006). Key Performance Indicatorsfor Maintenance of Health- CareFacilities. Journal of ManagementScience, 21, 5-12.
Parvatiyar, A., & Sheth, J. N. (2001). Customerrelationship management: Emerging
CRM In Banking Sector-A Resercher's Prospective on Bibliographic Survey
177
practice, process and discipline. Journalof Economic and Social Research, 3 (2),1-34.
Parasuraman, A., Zeithaml. V.A. and Berry, L.L.(1985). A Conceptual Model of ServiceQuality and its Implications for FutureResearch. Journal of Marketing,Volume 49, Fall, 41-50.
Peppers, D. & Rogers, M. (2004). ManagingCustomer Relationships: A StrategicFramework. Canada: John Wiley &Sons.
Puccinelli, B. (1999) Bank delivery, servicechannels require more personalattention. Bank Systems & Technology,36, 48.
Ray, B. (2007). An analytical approach tounderstand customers from theperspective of profit making.Marketing Mastermind. The IcfaiUniversity Press, 52-55.
Roger Hallowell (1996). The relationships ofcustomer satisfaction, customer loyalty,and profitability: an empirical study.International Journal of ServiceIndustry Management, 7 (4), 27 - 42.
Rootman, C., Tait, M., & Bosch, J. (2008).Variables influencing thecustomerrelationship management ofbanks. Journal ofFinancial ServicesMarketing, 13(1), 52-62.
Reinartz, W. J. and Kumar, V. (2003). TheImpact of Customer Relationship
Characteristics on Profitable LifetimeDuration. Journal of Marketing, 67 (1),77-99.
Rangarajan. (2010). Effective Role of CustomerRelationship Management in BankingSector, Global ResearchReview, NewDelhi.
Rust RT, Zahorik AJ, Keiningham T.L. (1995).Return on Quality (ROQ): MakingService Quality FinanciallyAccountable. Journal of Marketing,59(2), 58- 70.
Shibu. N.S. (2011). Customer RelationshipManagement and Banking Industry,Journal of Social Sciences, 36(17), 72-79
Sachdev S. B and Verma H.V. (2004). Relativeimportance of service qualitydimensions: A multi-sectoral study.Journal of Services Research, 4(1), 59-81.
Strauss, J., El-Ansary, A and Frost, R (2003),E-Marketing, Prentice Hall Editions, 3rdedition, NJ
Mrs. Sweta Leena Hota & Dr. Maheshwar Sahu

FINANCIAL INCLUSION IN INDIA THROUGHMICRO FINANCE: A COMPARATIVE STUDY
*Assistant Professor- II, School of Commerce and Finance, Amity University, Kolkata, West [email protected], Mobile - +91 7278827989
Ms. Keya Das*
INTRODUCTION
Financial inclusion is the delivery ofbanking services of an affordable cost to thevast sections of disadvantaged and lowincome groups. In India, it is a new conceptand was first featured in 2005. More than70% of our population lives in the ruralareas. Financial inclusion is a necessity fora country where a large chunk of theworld's poor resides. Initiatives for financialinclusion have come from the financialregulators, the governments and thebanking industry. While the banking sectorhas taken several steps to promote financialinclusion, legislative measures have alsobeen initiated in some countries. The ReserveBank of India (RBI) set up the KhanCommission in 2004 to look into financialinclusion and the recommendations of thecommission were incorporated into the mid-term review of the policy, 2005-06. Financialinclusion includes the "provision of
affordable financial services" to those whohave been left unattended or under-attended by formal agencies of the financialsystem. These financial services include"payments and remittance facilities,savings, loan and insurance services"(RBI,2006).
Access to finance by the poor and vulnerablegroups is a prerequisite for povertyreduction, employment, economic growthand social cohesion. Further access tofinance will empower the vulnerable groupsby giving them an opportunity to have abank account, to save and invest, to insuretheir homes or to partake of credit and thereby facilitate them to break the chain ofpoverty. Microfinance, a provision of thrift,credit and other financial services andproducts of very small amounts to the poorin rural, semi-urban or urban areas forenabling them to raise their income levelsand improve living standards, is a major
ABSTRACTFinancial inclusion is delivery of banking services of an affordable cost to the vast sections ofdisadvantaged and low income groups. In India, it is a new concept and was first featured in 2005.More than 70% of our population lives in the rural areas. Financial inclusion is a necessity for acountry where a large chunk of the world's poor resides. Indian experiment with micro finance wasdifferent in mainly two respects, as the delivery model includes Micro finance through Micro FinanceInstitutions (MFIs) and SHG-BLPLinkage programmes. The present paper aims to explore the efficacyof financial inclusion through two major channels - Self-Help Groups-Bank Linkage Programme (SHG-BLP) and Micro Finance Institutions (MFIs).
Key Words : Financial inclusion, SHG-BLP, Micro Finance Institutions.
The Utkal Business ReviewDecember, 2015, Vol - XXIX, pp.-178-190
179
tool for achieving the financial inclusion inIndian subcontinent (Bhatnagar, 2008)1.
MICRO FINANCE AND FINANCIALINCLUSION - A BACKDROP
Financial inclusion is a buzzword now andhas attracted the global attention in therecent past. In India, it is a new concept.More than 70% of our population lives inthe rural areas. Financial inclusion is anecessity for a country where a large chunkof the world's poor resides. The financialinclusion emphasizes on conversion ofunbanked area into banked one. Having abank account does not mean financialinclusion. Financial inclusion is the processof ensuring access to appropriate financialproducts and services needed by all sectionof society in general and vulnerable groupssuch as weaker sections and low incomegroups in particular, at an affordable costand in a fair and transparent manner byregulated mainstream institutional players(Panigrahi, Sangram, 2010)2. Financialinclusion is a critical for achieving inclusivegrowth in the country. It can help inreducing the growth of informal sources ofcredit (such as money lenders), which areoften found to be exploitative. Thus, an all-inclusive financial system enhancesefficiency and welfare by providing avenuesfor secure and safe saving practices and byfacilitating a whole range of efficientfinancial services (PallaviChavan andBhaskarBirajdar, 2009)3.
The Indian experiment with micro financewas different in mainly two respects. First,India involved its public banks network toprovide micro finance. The micro financeexperiment in India has been described byNABARD as relationshipbanking ratherthan parallelbanking elsewhere in theworld. In this experiment, there exists a linkbetween Self Help Groups (SHGs), NGOsand Banks. Secondly, thriftfirst and notcredit first was considered to be the basisfor micro finance in India. SHGs in Indiawere encouraged towards saving within thegroup and managing their own financesand giving loans internally and then todeposit their savings with a bank thusproviding them access to the bankingnetwork and finally, negotiating with thebank for credit (Prem Mohan, 2012)4.
Micro finance has been looked upon as animportant means of financial inclusion inIndia (RBI, 2006). Indian concept of microfinance encourages access of SHGs to banksboth as means of savings and providers ofloan services. However, going a step further,it can be viewed that micro finance has toact proactively not just as a means offinancial inclusion and also has to worktowards reducing dependence of poorborrowers on various informal sources ofcredit that are often notorious for theonerous terms at which they offer credit. Aneffective financial inclusion is possible onlywith the accomplishment of the second
1Amitabh Bhatnagar, (2008), Rural Micro Finance and Micro Enterprise: Informal Revolution, 1st Edition(2008), Concept Publishing Company, New Delhi, pp - 87 -882Panigrahi, Sangram, (2010), SHG-BLP - Focussing on the Inclusion of Financially Excluded, Indian Journal ofFinance (October 2010), pp - 49 - 503PallaviChavan and BhaskarBirajdar, (2009), Micro Finance and Financial Inclusion of Women: An Evaluation,Reserve Bank of India Occasional Papers (Vol. 30 No. 2 Monsoon 2009), pp - 3 - 44Prem Mohan, (2012), Women Empowerment through Micro Finance, 1st Edition (2012), AXIS Books Pvt.Ltd., New Delhi, pp - 26 - 28
Ms. Keya Das

180
(Dutta, 2011)5.
Micro finance through Self Help Group(SHG) has been recognized internationallyas the modern tool to combat poverty andfor rural development. The concept of SHGin India was introduced in 1985 andconsequently a pilot scheme was started onSelf-Help Bank Linkage Programme (SHG-BLP) by NABARD in 1992. SHGs are small,economical, homogeneous, affinity groupsof rural poor who are voluntarily ready tocontribute to a common fund to be lent totheir members as per the group decision(Shabna, 2014)6.
Micro finance through Micro FinanceInstitutions (MFIs) have also grown fromlast 15 years. The number of Institutionsproviding microfinance services has goneup from a few to several hundreds. MFIs ingeneral comply with the regulations of theRBI, take care of client protection issues, andadhere to the Industry Code of Conduct.These factors go a long way in infusingconfidence among all the stakeholders.Dimensions of Financial InclusionIndicators can measure at least threedimensions: access, usage, and quality(Mahendra, 2011)7.
ShailajaGajjala(2005)8 examined the
differences between micro finance andmicro credit. The findings of the studyrevealed that the micro finance gives banklink at the community level from whichfinancial and non-financial benefits accrueto the bank, the borrower and thecommunity.
T.Anitha Prasad (2005)9 found that therequirements of rural poor households arevery small and often unpredictable. Thesepeople are bankable. Almost all poorhouseholds need to save and have inherentcapacity to save if they are properlymotivated.
NABARD found that SHGs can be a tool forproviding loan to the un-bankable sectionof the society. It launched a programme tolink SHG with the banks in 1992. This wasthe first informal thrift and credit groups ofthe poor were recognised as bankableclients (Anitha Prasad, 2005)10. The strategybehind the programme was to initially linkthe groups with the banks through savingsand later through loan products andultimately make them bankable (Morduch,1999)11.
Dr. JyotishBasu (2006)12 said that theemergence of women entrepreneurs andtheir contribution to the national economy
5Dutta, Pinky, (2011), The Growth and impact of NABARD'sSHG - BLP in India, Indian Journal of Finance(December 2011), pp - 386ShabnaMolTP, (2014), Financial Inclusion: Concepts and Overview in Indian Context, Abhinav InternationalMonthly Refereed Journal of Research in Management and Technology (Vol. 3 Issue 6, June 2014), pp - 28 - 297Mahendra, M.V.S. , (2011), Empowerment of Women through Micro Finance - A Case Study of Ranga ReddyDistrict , Andra Pradesh , Indian Journal of Finance (October 2011), pp - 408ShailajaGajjala (2005): "Microfinance: A Case Study: Osmania Journal of Management, Vol 4, Nov. 2005.9Anitha Prasad T (2005) "Emerging Trends in Microfinance: A Case Study of SwayamKrishiSangam" OsmaniaJournal of Management, Vol 4, Nov 2004.10Anitha Prasad T (2005) "Emerging Trends in Microfinance: A Case Study of SwayamKrishiSangam" OsmaniaJournal of Management, Vol 4, Nov 2004.11Morduch, J. 1999. "The Microfinance Promise". Journal of Economic Literature 37 (4), 1569 - 1614.12Basu, Jyotish Prakash (2006), "Microfinance and women empowerment, An empirical study with specialreference to West Bengal".
Financial inclusion in India through Micro Finance: A Comparative Study

181
is quite visible in India. The number ofwomen entrepreneurs has grown over aperiod of time, especially in the 1990s.Microfinance programs have significantpotential for contributing to women'seconomic, social and politicalempowerment.
PrabuGhate (2006) said that, role offinancial institutions in a developingcountry is crucial in promoting financialinclusion. The efforts of the government topromote financial inclusion and deepeningcan be further improved by the pro-activeness on the part of capital marketplayers including financial institutions13.
Josiah Aduda and Elizabbath Kalunda(2012)14 studied that enhanced measures offinancial inclusion which include bothaccess and usage should be applied, sinceaccess and usage are not the same butsupplementary. Informal financial servicesshould also be included as they play a bigrole in developing countries.
OBJECTIVES OF THE STUDY
1. To explore the efficacy of financialinclusion through two major channels -Self-Help Groups-Bank LinkageProgramme (SHG-BLP) and MicroFinance Institutions (MFIs)
2. To examine the cumulative financialprogress of SHG-BLP and MFIs.
METHODOLOGY
Research methodology was majorly of twotypes - descriptive and analytical.Descriptive research includes surveys and
fact finding enquiries of different kinds. Themajor purpose of descriptive research isdescription of the state of affairs as it existsat present.In analytical research, on the otherhand, the researcher had used facts orinformation already available throughsecondary sources, and analyse these tomake a critical evaluation of the facts.
The research methodology followed in thispaper was of analytical type. The studiestaken up in this paper was based onsecondary data derived from variouspublished sources. The data has beencollected from the National MicrofinanceConclave Reports 2014 published byNABARD and also from the BharatMicrofinance Report 2014 of the Sa-Dhan -The Association of CommunityDevelopment Finance Institutions. Thecollected data is compiled and projected intocharts and a trend analysis is conductedfor the purpose of the study.
FINANCIAL INCLUSION THROUGHSELF-HELP GROUP BANK LINKAGEPROGRAMME (SHG-BLP) AND MICROFINANCE INSTITUTIONS (MFIs) - ACOMPARATIVE ANALYSIS
(A) Financial Inclusion through Self-HelpGroup Bank Linkage Programme (SHG-BLP)
In mid-eighties, MYRADA started workingwith groups of resource poor in rural areasand termed them as Credit ManagementGroups. These groups were taught theimportance of cultivating weekly savingsand extending loan facility to groupmembers out of the corpus socreated. In
13Ghate, Prabu. 2006. "Microfinance in India: The state of the sector." Care India, SDC, Ford Foundation.14Aduda, Josiah and Kalunda, Elizabbath, (2012) "Financial Inclusion and Financial Sector Stability WithReference To Kenya: A Review of Literature" Vol 2,no 6, 2012
Ms. Keya Das

182
1987, these groups were renamed as "SelfHelp Groups". MYRADA providedfund tosuch groups matching their corpus underthe Action Research programme sanctionedby NABARD. Capacity building trainingwas also provided to the groups and thesuccess of Action Research encouragedNABARD to launch a pilot in 1992.Thepilot was successful and 4,750 SHGs werecredit linked with different banks by the endof the three years phase with bank loan ofRs.6.06 crore covering 28 commercial banks,60 RRBs and 7 Cooperative banks.
The SHG-BLP evolved as a supplementarycredit strategy for banks for reaching thepoor, built mutual trust and confidencebetween banks and rural poor andencouraged banking activities among poor.The Working Group constituted by RBIviewed the linking of SHGs with banks as acost effective, transparent and flexibleapproach to improve the accessibility ofcredit from the formal banking system.
NABARD had suggested three models forSHG-BLP and supported all the threemodels depending on the demand andsupply environment in a particular region.These models were:-
SHGs promoted by banks and linked bythemselves,
SHGs promoted by NGOs and otherSHG promoting agencies and linked bythe banks directly, and
SHGs promoted by NGOs and otherSHG promoting agencies and financedby them through bulk lending providedby the banks to them.
In this case study of SHG-BLP we have:-i) Projected a pie chart on the regional
coverage of SHGs linked with banks in2013-14 and a bar graph on thepercentage of Women SHGs amongst it.
ii) Conducted a trend analysis on the creditgiven to SHGs by banks from 2009 - 10to 2013 - 14.
TABLE 1 - No. of SHGsSavings linked with banks
Region No. of SHGs Savings Linked with Banks (in Lakhs)
2009-10 2010-11 2011-12 2012-13 2013-14 Northern 3.52 3.73 4.09 3.73 3.65 North Eastern 2.92 3.25 3.67 3.24 3.16 Eastern 23.74 15.27 16.26 14.71 14.69 Central 7.66 7.86 8.13 7.02 6.86 Western 9.46 9.61 10.62 9.06 8.97 Southern 32.23 34.89 36.83 35.41 36.96 Total 69.53 74.61 79.60 73.17 74.29
Source : National Microfinance Conclave Report 2014 - published by NABARD
With the various agencies activelypromoting women SHGs and getting themlinked with Banks, women SHG movementhas become the flag-bearer of the women
empowerment in India. In the aboveprojected bar graph we can see that WomenSHGs show steady increase every year from2011-12 (79.1%) till 2013-14 (84.15%).
Financial inclusion in India through Micro Finance: A Comparative Study
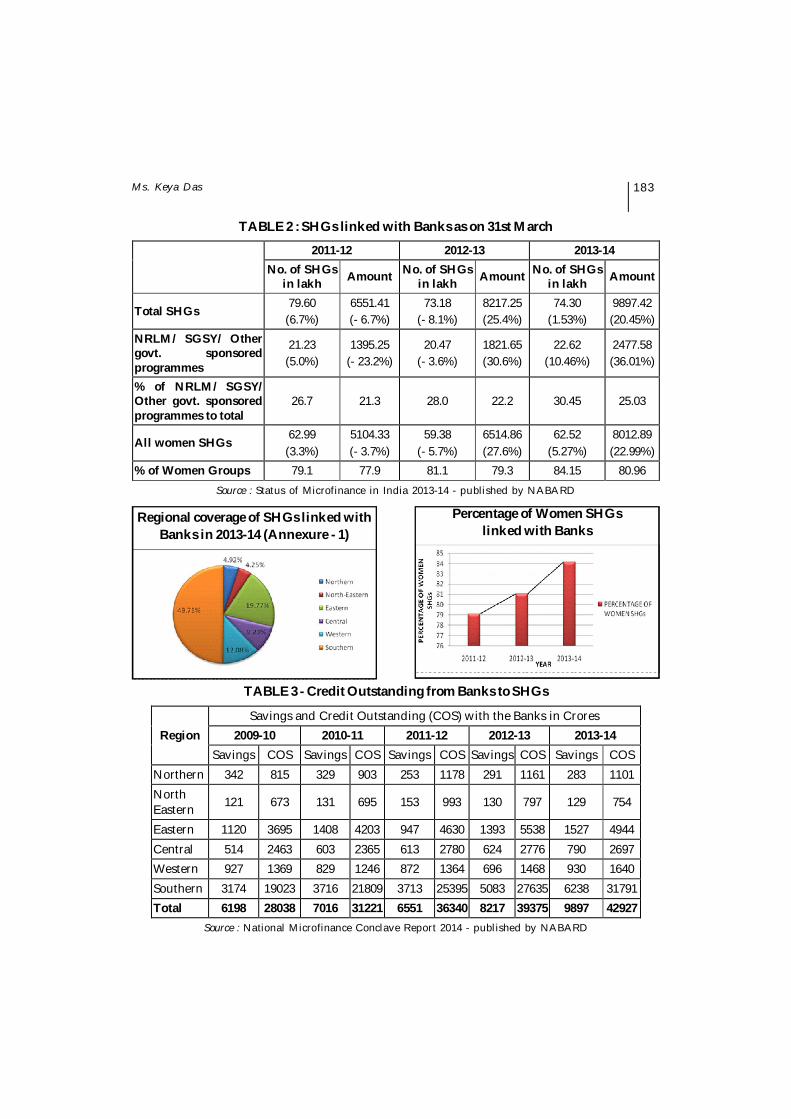
183
TABLE 2 : SHGs linked with Banks as on 31st March
2011-12 2012-13 2013-14
No. of SHGs in lakh Amount No. of SHGs
in lakh Amount No. of SHGs in lakh Amount
Total SHGs 79.60
(6.7%) 6551.41 (- 6.7%)
73.18 (- 8.1%)
8217.25 (25.4%)
74.30 (1.53%)
9897.42 (20.45%)
NRLM/ SGSY/ Other govt. sponsored programmes
21.23 (5.0%)
1395.25 (- 23.2%)
20.47 (- 3.6%)
1821.65 (30.6%)
22.62 (10.46%)
2477.58 (36.01%)
% of NRLM/ SGSY/ Other govt. sponsored programmes to total
26.7 21.3 28.0 22.2 30.45 25.03
All women SHGs 62.99
(3.3%) 5104.33 (- 3.7%)
59.38 (- 5.7%)
6514.86 (27.6%)
62.52 (5.27%)
8012.89 (22.99%)
% of Women Groups 79.1 77.9 81.1 79.3 84.15 80.96 Source : Status of Microfinance in India 2013-14 - published by NABARD
TABLE 3 - Credit Outstanding from Banks to SHGs
Region Savings and Credit Outstanding (COS) with the Banks in Crores
2009-10 2010-11 2011-12 2012-13 2013-14 Savings COS Savings COS Savings COS Savings COS Savings COS
Northern 342 815 329 903 253 1178 291 1161 283 1101 North Eastern 121 673 131 695 153 993 130 797 129 754
Eastern 1120 3695 1408 4203 947 4630 1393 5538 1527 4944 Central 514 2463 603 2365 613 2780 624 2776 790 2697 Western 927 1369 829 1246 872 1364 696 1468 930 1640 Southern 3174 19023 3716 21809 3713 25395 5083 27635 6238 31791 Total 6198 28038 7016 31221 6551 36340 8217 39375 9897 42927 Source : National Microfinance Conclave Report 2014 - published by NABARD
Regional coverage of SHGs linked withBanks in 2013-14 (Annexure - 1)
Percentage of Women SHGslinked with Banks
Ms. Keya Das

184
We can see that the above trend is followinga straight line trend. Hence a Straight linetrend analysis has been conducted toproject the financial year 2014-15'sprogress.
Projected Trend of Credit outstandingfrom banks to SHGs
The straight line trend is given by, Y= a + bt,where Yis the year in which trend has to beprojected AND a, b are constants whichare to be derived from the Normal Equations(Annexure - 2). Projected trend for credit thatwill be outstanding from banks to SHGs inthe year 2014-15 is Rs. 46,959 Crore.
(B) Financial Inclusion through MicroFinance Institutions (MFIs)
MFIs aim to promote economic activityamong low-income earners, for whomaccess to official banking services is
impossible or nearly so. The first well-known MFI,SEWA Bank was incorporatedas an Urban Cooperative Bank in 1974 andpaved the way for microfinance in India byshowing that the poor were bankable. RBIhas come out with a range of guidelines toimprove the functioning of MFIs. Thereported 155 MFIs with a branch networkof 11,687 have reached out to an all-timehigh of 33 million clients with anoutstanding loan portfolio of 33,517 crore.Funding for MFIs has largely been from oneof these two sources - borrowings (84%) andsecuritisation/ portfolio sale (11%) - thoughother forms do exist to some extent likesubordinated debt, bonds, non-convertibledebentures, external commercial anddeposits from borrowers/ members. Banksare major lenders to MFIs followed by bulklenders and other financial institutions.
In this study of MFI we have:- Projected a pie chart on the regional
coverage of MFIs in 2013-14 and a bargraph on the percentage of Womenclients amongst it.
Conducted a trend analysis on the creditgiven to SHGs by banks from 2009 - 10to 2013 - 14.
Top ten MFIswith number of Branchesaccording to Bharat Microfinance Report 2014 Regional break up of client outreach in
2013-14
Financial inclusion in India through Micro Finance: A Comparative Study

185
MFIs have always been focused on servingwomen. It is observed that womenborrowers have been consistentlyincreasing for last three years. It hasincreased from 95 % in 2012 to 97 % in 2014.
We can see that the above trend is followinga parabolic trend. Hence a Parabolic trendanalysis has been conducted to project thefinancial year 2014-15's progress.
Client Outreach and category wise breakup
Source : Bharat Microfinance Report 2014 published by Sa-Dhan
TABLE 4 - Percentage to Total Borrowers
Year Women Borrowers SC/ST Borrowers Minority Borrowers 2011 94% NA NA 2012 95% 20% 23% 2013 96% 21% 23% 2014 97% 19% 14%
Source : Bharat Microfinance Report 2014 published by Sa-Dhan
Percentage of Women Clients of MFIs Projected trend of Gross Loan Portfolioof MFIs
Ms. Keya Das

186
As we know the parabolic trend is given by,Y= a + bt + ct2, where Y is the year in whichtrend has to be projected, a, b,and c areconstants which are to be derived from theNormal Equations (Annexure -3). ProjectedTrend for Gross Loan that will be disbursedin the year 2014-15 is Rs. 34338 Crore(approximately)
INTERPRETATION AND FINDINGS OFTHE ANALYSIS
We conducted a trend analysis on the SHG-BLP and the MFIs - based on their Banklinkage / Client outreach and Loandisbursement to ensure the efficacy offinancial inclusion in India. We found outthat:-
Southern region has the most coveragefor both SHG-BLP and MFIs in terms ofclient outreach. For SHGs which arelinked to banks it is 49.75% in southernregion and for MFIs the client outreachis 42% in the southern region. In boththe cases, southern region is followedby the eastern region, that is, 19.77% and
25 % for SHG-BLP and MFIsrespectively.
In SHG-BLP and MFIs most of theclientele portfolio is represented by thewomen SHGs(which is 84.15% in 2013-14) as well as individual women (whichis 97% in 2013-14) respectively. Thisindicates that many financiallyexcluded women are included throughthese channels of micro finance hencebuilding women empowerment in India.Analysis of data has been done for threeyears as five years data were notavailable.
Loan disbursement of SHG - BLP followsa straight line trend and will increase toRs. 46,959 Crore in 2014-15 from Rs.42,927 Crore in 2013-14.
Gross Loan Portfolio of MFIs also followa parabolic trend and will increase toRs.34,338 Crore in 2014-15 fromRs.29,442 Crore in 2013-14.
If we compare the results of SHG-BLPand MFIs, it can be seen that though
Gross Loan Portfolio and category wise breakup
Source : Bharat Microfinance Report 2014 published by Sa-Dhan
Financial inclusion in India through Micro Finance: A Comparative Study
187
MFIs have lesser geographical coveragethan SHG-BLP still it has a higher clientoutreach, especially women clients. Onthe other hand loan disbursed by SHG-BLP is more than that of MFIs. This isbecause the MFI model is comparativelycostlier in terms of delivery of financialservices. This is explained by the fact thatwhile the cost of supervision of credit ishigh, the loan volumes and the loansizes are low. It is also seen that MFIspass on higher cost of borrowings totheir clients who are not interest sensitivefor small loans but may not be so as loansize increases. It is, therefore, necessaryfor MFIs to develop strategies forincreasing the range and volume of theirfinancial services.
ROAD MAP FOR FUTURE
The current policy objective of inclusivegrowth with financial stability cannot beachieved without ensuring universalfinancial inclusion. Our experiencesuggests that the banks alone will not beable to achieve this unless an entire supportsystem partners them in this mission. Onlythe support of policymakers, regulators,governments, IT solution providers, mediaand the public at large can bring about adecisive metamorphosis in our journeytowards universal financial inclusion.Financial Inclusion of the unbanked massesis expected to unleash the hugely untappedpotential of the sections of the society thatconstitute the bottom of the pyramid. Toensure that the banks give adequateattention to financial inclusion, they mustview this as a viable business propositionrather than as a corporate socialresponsibility or a regulatory obligation. For
the business to remain viable it would beimportant to focus on increasing usage ofexisting banking infrastructure whichwould happen only if the banks can offeran entire bouquet of products and servicesto the holders of the large number of basicbank accounts opened during the last threeyears as also to the new customers that thebanks acquire.
During the study it is found that thesouthern region in India have a higherfinancial coverage than the rest of thecountry because there is more focussed andorganised sectors for financial inclusion.More focus on resource poor states havinglower financial inclusion like Assam, Bihar,Chhattisgarh, Jharkhand, Odisha, MadhyaPradesh, Maharashtra, Rajasthan, UttarPradesh have to be done.
Moreover the tremendous impact on thesocial status of the poor rural womenbecoming bread earners of their householdsthrough the instrument of SHGs can be usedas a useful tool in including a large sectionof the excluded rural people.
The goal of universal coverage of poorhouseholds for creating livelihood throughthe mechanism of SHG-BLP requires severalinnovations. Some of these may be attainedthrough leveraging technology and someothers would like innovations in designingthe products. Accordingly, Road map forfurther development of SHG-BLP mayinclude:-
Requisite skill for undertakinglivelihoods to be imparted to the maturedSHG members through convergencewith Skill development programmes ofGovernment of India.
Ms. Keya Das

188
Digitisation of microfinance sector,including that of SHG-BLP is veryessential.
Alternative delivery channels andsupport mechanisms are to beencouraged to provide
TheSHGmembers' timely bankingservices at a reasonable cost.
NABARD, in association with theDepartment of Financial Services, Ministryof Finance, Govt. of India formulated ascheme for promotion and financing ofWomen Self Help Groups to be implementedin 24 selected backward districts ( laterextended to 150 districts) of the country. Thenew scheme provides for selection of ananchor NGO in each of the district selected,not only for promoting and enabling creditlinkage of these groups with banks but alsoserving as a business facilitator forextending outreach of the banks, regularmonitoring of the SHGs promoted and alsobeing responsible for repayment of loans bySHGs to banks. This approach is expectedto facilitate sustained financial inclusion byextending banking services to womenmembers of SHGs, promote sustainablelivelihood opportunities to the members andfacilitate effective implementation of othersocial development programmes for womenthrough SHGs.
MFIs can play a vital role in bridging thegap in demand and supply of financialservices.
But due to higher supervision chargescost of borrowing increases. MFIs mustbring out strategies to lower this cost.
MFIs around the world see m-bankingas an opportunity to reach new customersegments and grow faster. Mobilephones can expand the reach of MFIsthat struggle with the high costsassociated with servicing extremely hardto reach rural customers. MFIs caneffectively use m-banking services tofacilitate both loan repayment anddeposits. It can make the transactionprocess more efficient for both the MFIsand the customer.
Efforts towards training and capacitybuilding of MFIs and their humanresources have to be upscaled from thepresent levels.
Financial inclusion as a policy measureshould be followed up by building upsuitable database, which could serve as aguide to assess the impact of credit policiesfrom time to time and reorient schemes offinancial assistance to the targeted groups.
WEB REFERENCEShttp://www.rbi.org.in/scriptshttp://www.sa-dhan.net/Resources/Finalehttps://www.nabard.org/Englishh t t p : / / e n . w i k i p e d i a . o r g / w i k i /Financial_inclusion
Financial inclusion in India through Micro Finance: A Comparative Study

189
ANNEXUREAnnexure - 1:- Percentage of SHGs linked with Banks
REGION No. of SHGs linked with Banks (In lakhs)
Percentage of no. of SHGs linked with Banks (%)
Northern 3.65 4.92 North Eastern 3.16 4.25 Eastern 14.69 19.77 Central 6.86 9.23 Western 8.97 12.08 Southern 36.96 49.75
Annexure - 2:- Credit Outstanding from banks to SHGs
Normal Equations:-
(i) y =na+ bt (where n is the total no. of years)
(ii) yt = at + bt2
YEAR No. of SHGs Savings Linked with Banks (y) (Rs in Crore)
t ( Year – 2012 ) t2 yt
2009-10 28038 -2 4 -56076 2010-11 31221 -1 1 -31221 2011-12 36340 0 0 0 2012-13 39375 1 1 39375 2013-14 42927 2 4 85854 TOTAL 1,77,901 0 10 37932
Solving the normal equations we get,(i) a = 35580 (approx.) and(ii) b = 3793 (approx.)
Projected Trend for the year 2014-15
Y2014-15 = a + bt[t = 2015 - 2012 = 3]
= Rs. 46,959 Crore credit will be outstanding from banks to SHGs
Annexure - 3:- Gross Loan Disbursed by Microfinance Institutions:-
Normal Equations:-
(i) y =na + bt + c t2 (where n is the total no. of years)
(ii) yt = at + bt2 + ct3
(iii) yt2 = at2 + bt3 + ct4
Ms. Keya Das

190
Solving the normal equations we get,
(i) 5a + 10c = 112593 ........................... (1)(ii) b = 2297.8 ........................... (2)(iii) 10a + 34c =235038 ........................... (3)
Solving (1) and (3) simultaneously we get, a = 21111.18, b= 2297.8 and c = 703.71
Projected Trend for the year 2014-15Y2014-15 = a + bt + ct2 [t = 2015 - 2012 = 3] = Rs. 34338 Crore(approx.) Gross Loan will be disbursed.
YEAR No. of SHGs Savings Linked
with Banks ( y) (In Lakhs) T
(Year – 2012 ) t2 t3 t4 yt yt2
2009-10 18344 -2 4 -8 16 -36688 73376 2010-11 21556 -1 1 -1 1 -21556 21556 2011-12 20913 0 0 0 0 0 0 2012-13 22338 1 1 -1 1 22338 22338 2013-14 29442 2 4 -8 16 58884 117768 TOTAL 112593 0 10 0 34 22978 235038
Financial inclusion in India through Micro Finance: A Comparative Study

PERCEPTION AND AWARENESS LEVEL OFFARMERS ON CROP INSURANCE IN ODISHA:A CASE STUDY OF SELECTED VILLAGES OFCHAMPUA BLOCK IN KEONJHAR DISTRICT
*Lecturer, School of Commerce, Ravenshaw University, Cuttack, [email protected]
Yayati Nayak*
INTRODUCTION
India is an agrarian economy with one thirdpopulation depending on the agriculturesector directly or indirectly It has 116million farm holdings covering an area of163 million hectares of which small andmarginal farmers (with holdings of 2hectares or less) make up 80 percent of theproducer population. Farming is an
inherently risky business and farmers facedifferent types of risks. Near about 60 percent of the total sown area of the country israin-fed and 65 percent of Indian farmersdepend on rain-fed irrigation. The growthof crops and realization of output aredetermined by the quantum of rainfall andits distribution during the rainy season.Rainfall pattern also affects the irrigatedcrops. Nearly two third of the cropped
ABSTRACTMillions of rural poor depend on agriculture to earn their livelihoods. It is the agriculture which isconsidered as the backbone of our Indian economy. Indian agriculture depends on monsoon and proneto a variety of risks. Crop insurance plays a vital role to save farmers against the risks associated withagriculture. Both the state government and central government have implemented different crop insuranceschemes for the benefits of farmers. The aim of this study is to assess the awareness level of farmers andtheir willingness to pay for crop insurance. Five villages of Champua Block in Keonjhar District wereselected for this study. All of these villages were equally sound in cultivating both Kharif and Rabicrops. Farmers were randomly selected from each of the villages under study through the use of randomsampling method. A total number of 110 farmers were selected for personal interviews with the help ofa structured questionnaire. Chai square test was used to study the association between the level ofawareness of farmers about crop insurance and their educational background. It was found that therewas no association between the educational background of farmers and the level of awareness about cropinsurance. Evidence from the study indicates that majority of farmers are not aware about crop insurance.The study revealed that government should give more premium subsidy to encourage large number offarmers to participate in the crop insurance. The study further recommends for the periodic awarenesscampaign and education of farmers to improve their knowledge on crop insurance. The study concludeswith the suggestion that there is a strong need to review and refine the existing crop insurance schemesto ensure better penetration of crop insurance in Odisha.
Key Words : Agriculture, Crop Insurance, Farmer, Perception, Awareness level
The Utkal Business ReviewDecember, 2015, Vol - XXIX, pp.-191-203

192
acreage in India is vulnerable to drought indifferent degrees. This leads to operatingrisk in cultivation of different crops. On anaverage 12 million hectares of crop area isaffected annually by these calamitiesseverely impacting the yields and totalagricultural production.
Agricultural production and farm incomesin India are frequently affected by naturaldisasters such as droughts, floods, cyclones,storms, landslides and earthquakes.Susceptibility of agriculture to thesedisasters is compounded by the outbreak ofepidemics and man-made disasters such asfire, sale of spurious seeds, fertilizers andpesticides, price crashes, etc. All these eventsseverely affect farmers through loss inproduction and farm income, and arebeyond the control of farmers. With growingcommercialization of agriculture, themagnitude of loss due to unfavourableeventualities is increasing. In recent times,mechanisms like contract farming andfutures trading have been established whichare expected to provide some insuranceagainst price fluctuations directly orindirectly. But, crop insurance is consideredas an important mechanism to address therisks effectively.
India is one of the largest exporters ofvarious food grains, crops and farmproducts. The farmers of India play a veryvital role in the development of economybut they are still living in the curse ofpoverty and deprivation. Agricultureproduction and farm incomes in India arefrequently affected by weather and climaticconditions like droughts, floods, cyclone,frost, storms, landslides, etc. Outbreak ofepidemics, fire, and market fluctuations arethe other factors which seriously affect
production and farm income. All theseevents are beyond the control of the farmers.With the growing commercialization ofagriculture, the magnitude of shock due tounfavourable eventualities is increasingand the need to protect farmers againstproduction and income losses is becomingstronger. Agricultural insurance isconsidered an important mechanism toeffectively address the risk to output andincome resulting from various natural andmanmade events. Agriculture Insuranceplays an important role in sharing the risksof people in an affordable form. It helps thefarmers to quickly recover from damagesand losses. Crop insurance has assumedimportance with large scale of damagecaused due to pest attacks, crop diseasesand vagaries of weather. The objective is toprovide insurance coverage and financialsupport to the farmers in the event of failureof any of the notified crop as a result ofnatural calamities, pests & diseases. The listof crops being covered for insurance differsfrom state to state. These crops are insuredat the block/gram panchayat levels. Cropinsurance schemes are of immense help tofarmers, providing them with financialsecurity. Low productivity, less income andhigh loans taken for agriculture are forcingthe farmers of India to commit suicide. Theyare living in a very stressful life even aftergiving others a comfortable life by fulfillingtheir most wanted need in the form of farmproducts.
RELIVANCE OF THE STUDY
Agriculture in India is varied, diversifiedand prone to a variety of risks. Most of thefarmers are small and marginal ones. Inmost areas, agriculture is rain fed, leadingto a greater degree of yield variability and
Perception and Awareness Level of Farmers on Crop Insurance in Odisha: A Case Study of ...

193
risk. Agriculture is considered to be the backbone of the Indian economy. Nearly two-thirds of its population depends directly onagriculture. Agriculture provides directemployment to 70 percent of working peoplein the country. Agricultural development isa precondition of our national prosperity. Itis the main source of earning livelihood ofthe people. Government has launchedseveral schemes like National AgriculturalScheme and Weather Index Based cropinsurance schemes for protecting thefarmers against risks in agriculture. Due tothe risk of loss in agriculture the farmersare making suicide attempts, selling theirproperties or the properties are seized bythe Bank and financial institutions for theloan availed by the farmers. This is due tolack of awareness about the riskmanagement techniques among the farmers.So, it is very important to study aboutvarious aspects of agriculture and cropinsurance.
REVIEW OF LITERATURE
Many research works have been done indifferent areas of crop insurance in Indiaand especially about the perception offarmers on it. A good number of literaturesare available on the various aspects of cropinsurance in India. A few of these reviewsare as follows.
S.S. Raju and Ramesh Chand (2008) intheir research article, "A Study on thePerformance of National AgriculturalInsurance Scheme and Suggestions to makeit more Effective", they have examined thefeatures and performance of NationalAgricultural Insurance Scheme (NAIS)operating in the country and has suggestedsome modifications to make it more effective.
NAIS coverage in terms of crop area, numberof farmers and value of agricultural outputis very small. If crop insurance programmeis to be made an important tool inagricultural risk management, the presentlevel of coverage will have to be improved,at least by 3-4 fold. Such an expansion canoccur only with improvements in andbroad-basing of the insurance scheme.Every suggested improvement has financialimplications and affect the concernedinsurance practices. It requires renewedefforts by the government in terms ofdesigning appropriate mechanisms andproviding financial support to agriculturalinsurance. Providing of similar support tothe private sector insurers would help inincreasing the insurance coverage andimproving the viability of insuranceschemes over time. The study has alsosuggested that different general insurancecompanies in the country may be assignedsome reasonable targets to coveragricultural insurance, and to begin with,it could be equal to the share of agriculturein the national income.
D. Suresh Kumar, B.C. Barah, C.R.Ranganathan, R. Venkatram, S.Gurunathan and S. Thirumoorthy (2011)in their research work, "An Analysis ofFarmers' Perception and Awarenesstowards Crop Insurance as a Tool for RiskManagement in Tamil Nadu", they havereported the results of a survey of 600farmers conducted to assess their perceptionabout various facets of crop insuranceschemes. The Probit and Tobit models havebeen employed to analyse the factorsaffecting awareness among the farmers.Crop diversification index has also beenused to examine the farmers' adjustment
Yayati Nayak

194
mechanism against risks. The survey hasrevealed that most farmers (65%) are awareof risk mitigation measures of thegovernment. But, only half of the farmershave been found aware about the cropinsurance schemes/products. This impliesthat there is need to disseminate informationabout insurance schemes across the targetgroups. Further, it has been shown thatfactors such as gross cropped area, incomefrom other than agricultural sources,presence of risk in farming, number ofworkers in the farm family, satisfaction withthe premium rate and affordability of theinsurance premium amount significantlyand positively influence the adoption ofinsurance and premium paid by thefarmers. The study has clearly brought outthe urgency of developing more innovativeproducts, having minimum humaninterventions.
S.B. Goudappa, B. S. Reddy and S.M.Chandrashekhar (2012) in their researchwork, "Farmers Perception and Awarenessabout Crop Insurance in Karnataka", theyhave made a study on the farmers perceptionand awareness of crop insurance wasconducted in North Eastern parts ofKarnataka because region receives very lessrainfall compared to other part of Karnatakaand people of this region always sufferingfrom drought, they continue to suffer. Thestudy revealed that average size of familyamong borrowers and non borrowers wasseven. Most of them (44%) are illiterate and25% were education up to primary level.Level of education, family size andexperience in farming did not show anysignificant difference between among thedistrict selected for study. However, farmsize and crop income, which generally
corresponds to farm size, were significantlyhigher in Gulbarga district compared toKoppal and Raichur districts. ThoughNAIS crop insurance scheme is operatingsince 2002-03 in the study area majority ofrespondent (>80%) are not aware that whois implementing agency and who pay'scompensation. Almost all respondents arein the wrong perception that banks will paycompensation and are the implementingagency. More than three fourth of theinsurance beneficiaries mentioned thatbank compulsion was the motivation foropting insurance. Financial security, goodexperience from others was the region foropting crop insurance. Further more than80% of respondents are not aware of extentof coverage premium paid, last date,procedure for insuring crops and methodof loss determination and compensationworked out by agriculture insurancecompany. Respondent farmers weresuggested for improving existing schemeand they want quick settlement of claimswhich is usually taking more than one year.Around three fourth of the beneficiariessuggested to consider adverse weathercondition prevailed during flowering andpod formation stage. National AgricultureInsurance Scheme (NAIS) in operationneeds to be continued with modificationand simplification of modalities ofindemnity, loss assessment, settlement ofcompensation and disbursementprocedure.
Kiyanoush Ghalav and, Karim.MH (KarimKoshteh) and Abolhassan Hashemi (2012)in their research study, "AgricultureInsurance as a Risk Management Strategyin Climate Change Scenario: A study inIslamic Republic of Iran", they made a study
Perception and Awareness Level of Farmers on Crop Insurance in Odisha: A Case Study of ...

195
to develop a realistic framework andconcrete roadmap for introducing cropinsurance as a risk management strategyfor the farmers in Iran. The study is basedon both secondary and primary data andinformation. Survey was the researchmethod, and data was collected byquestionnaire and different instruments,such as survey questionnaire, FGDs,interview schedule, inception workshopand roundtable discussions withstakeholders at different levels. The threesurvey districts were: Golestan Province (asa flashflood area, north of Iran), KhuzestanProvince (as a drought area, south of Iran)and Khuzestan Province (as a cyclone andflood-prone area, south of the country). Theresults revealed that four independentvariables explain adoption of Droughtinsurance. Consult with other farmers is themain independent variable.
J.Sundar and Lalitha Ramakrishnan (2013)in their paper, "A Study on Farmers'Awareness, Perception and Willing to Joinand Pay for Crop Insurance", they havediscussed the findings of the study in thearea of crop insurance. Firstly it measuresthe awareness level and source ofawareness, secondly examines the farmers'perception, finally identify the farmerswillingness in paying for crop insurance.The study was conducted in Kunichampetvillage, Puducherry District, India and 140convenient respondents were chosen andbeen carried out in June and July, 2012. Fromthe analysis farmers awareness level aboutcrop insurance was low. Most of the farmerswere not willing to pay for crop insurancebecause of instable income, premium rate,no or low compensation, problems withdistribution channel and lack of financial
knowledge.
Dr.B.Ravi Kumar (2013) in his researchpaper, "Crop Insurance - Tribulations andProspects of Farmers with reference toNuzvid, Krishna District" he discusses theoutcomes of the study in the area of cropinsurance. Firstly it measures the awarenesslevel and source of awareness, secondlyexamines the farmers' perception, finallyidentify the farmers willingness in payingfor crop insurance. The study wasconducted in Nuzvid, Krishna District,Andhra Pradesh and 140 convenientrespondents were chosen and been carriedout in June and July, 2013. Most of thefarmers were not willing to pay for cropinsurance because of instable income,premium rate, no or low compensation,problems with distribution channel andlack of financial knowledge.
Lopamudra Mohapatra & R K Dhaliwal(2014) in their research article, "Review ofAgricultural Insurance in Punjab State ofIndia", they look into the genesis ofagricultural insurance in Indiamacroscopically and examines variousagricultural schemes operating in the stateof Punjab microscopically. The design forthe study was descriptive research. Thefocus of the review was on the functionalagricultural insurance schemes in Punjabstate microscopically and macroscopicallyin the country. India has administered cropinsurance scheme since 1972 of which allthe variants of the scheme introduced fromtime to time had various flaws. NeverthelessIndia is not alone where public cropinsurance has not been successful. In bothdeveloped and developing countries suchinsurance schemes have incurred losseswithout offering an effective product. The
Yayati Nayak

196
major role player in the public sectorcompanies offering crop insurance isAgricultural Insurance Company (AIC). Theprivate role players are IFFCO Tokio GeneralInsurance Company Ltd, ICICI LombardInsurance Company Ltd. The majorinsurance running in the country is NAISbut was not Punjab state since the paddy -wheat crops grown in the state are less riskycrop in the wake of assured irrigation andhigh input agriculture. Weather basedinsurance products have got a good scopein the state to act as a tool of risk mitigation.The post green revolution era of PunjabState needs to address the challenge ofdiversification. The agriculture insurancecan act as a motivation for the farmers ofPunjab to go for diversification by settingthemselves free from the risks involved andthe loss in income which they shall face.Crop insurance needs to be strongly takenup at the policy level; with well defined riskto Punjab?s agriculture, well devisedproducts for these risks in current scenario.
Phillip Daniel Daninga and Zhang Qiao(2014) in their article, "Factors AffectingAttitude of Farmers towards DroughtInsurance in Tanzania", they assessedfarmers' attitude towards droughtinsurance in Bunda district. The sample ofthe conducted cross sectional surveyconsisted of 410 respondents. A five pointlikert scale was generated and included inthe questionnaires. Analysis was doneusing Factor analysis and reliability testedby Cronbanch's alpha. Factors that affectedfarmers' attitudes towards droughtinsurance were compensation fairness ofdrought insurance, convenience of servicedelivery of drought insurance, programappropriateness, and government's
protection to farmers. Farmers' attitudestoward the program were negative. Farmers'attitudes and perception should beincorporated in developing effectivedrought insurance in Tanzania.
Dr. Md. Mushfiqur Rahman, BikashChandra Ghosh and Dr. Mir Khaled IqbalChowdhury (2014) in their research work,"Problems and Prospects of Weather IndexBased Crop Insurance in DevelopingCountries: A Case for Rural Farmers inBangladesh", the authors have tried toaddress the problems and challenges inimplementing this insurance product in lowincome countries. Based on literature itaddresses some problems and issues inimplementing this product in Bangladeshconsidering context specific issues of thiscountry. The main objective of this paper isto theoretically assess weather-index basedcrop insurance as an instrument to graduatepoor farmers out of poverty trap. This studyis a completely desk based one. Data havebeen collected from literatures of differentsources such as journals, working papers,World Bank and other developmentorganizations' websites and researchpublications those are relevant to the study.Proper preparation for index measurement,premium determination, flexible productdesign, wider stakeholder involvement,public private partnership, and a 'big push'from government and donors through seedfinancing can promote weather index basedcrop insurance in Bangladesh.
Mukesh H.V (2015) in his research article,"Impact of Crop Insurance on IndianAgriculture", he has discussed mainly theissues and benefits of crop insurance inIndia. Traditional farmers are expandingtheir operation to include new and different
Perception and Awareness Level of Farmers on Crop Insurance in Odisha: A Case Study of ...

197
options in doing so they are met with newliability; issues and new risk managementneeds. Agriculture Insurance is a riskmanagement tool and as a risk transferdevice that farmers can depends on as aninstrument of indemnity in the event of cropfailure
RESEARCH GAP
A good number of studies have been donein different areas of crop insurance. Afteran intense review of related literature it wasfound that a few numbers of studies havebeen made to study the level of awarenessof farmers on crop insurance in India andespecially in the backward state of Odishawhere most of the people depend onagriculture to eke out their livings. Cropinsurance is one of the most important toolsto handle risk which needs further study tomake it more meaningful. Therefore, it is anattempt made by the researcher to fill theexisting gap by conducting this study.
OBJECTIVES OF THE STUDY
The main purpose of this paper is to studythe awareness level of farmers about cropinsurance in India. However, the specificobjectives of the study are as follows.
1. To understand the socio-economicprofile of the farmers in the study areas.
2. To study the perception and awarenesslevel of farmers about crop insurance.
HYPOTHESIS
The null hypothesis of the present study isas follows.
1. There is no significant relationshipbetween the level of awareness of farmersabout crop insurance and theireducational background.
RESEARCH METHODOLOGY
The data has been collected from the farmersof different villages of Champua Block inKeonjhar District of Odisha. The sampleconsists of marginal, small and largefarmers. On the basis of conveniencesampling method 110 farmers have beenselected for this present study. Normally 70to 75% of households in different villagesunder this study area belong to farmingcommunity. A well structured questionnairewas used to collect data from therespondents. The study was carried out inthe month of February, 2016. The presentstudy is mainly based on the primary data.The analysis of data collected has beencarried out by using percentage analysisand testing of hypothesis has been done byusing chai square test.
Yayati Nayak

198
DATA ANALYSIS AND INTERPRETATIONTable 1.1 Socio-economic Characteristics of Sample Farmers
Source: Primary Data
Socio-Economic Characteristics Classification No of farmers Percentage (%)
Age in years
Up to 22 7 6 23-30 13 12 31-40 69 63
Above 40 21 19
Marital Status Single 9 8
Married 101 92
Type of Family Joint 97 88
Nuclear 13 12
Number of Dependants
Nil 19 17 1 31 28
2-3 39 35 More than 3 21 20
Family Background
Cultivation 79 72 Daily labourer 18 16
Private Job/ Service 13 12
Educational Qualification
No formal education 57 52 Primary 33 30 Matric 11 10
Degree/Diploma 9 8
Type of House Hut 12 11
Pucca 9 8 Thatched House 89 81
Landholdings (in Acre)
Less than 1 7 6 1-2 63 57 3-4 27 25
Above 4 13 12
Annual Income (in Rs.)
Less than 10,000 23 21 10,000-20,000 67 61 20,000-30,000 12 11 Above 30,000 8 7
Savings (in Rs.)
Nil 49 45 Less than 5,000 31 28
5,000-10,000 19 17 Above 10,000 11 10
Perception and Awareness Level of Farmers on Crop Insurance in Odisha: A Case Study of ...

199
Table No.1.1 indicates that the majority(63%) of the farmers are between the agegroup of 31-40 years, most of them (92%)are married and (52%) of the farmers haveno formal education. Family background ofthe farmers are cultivation (72%) followedby daily labourer (16%). Most of the farmers(81%) have Thatched house built of mudand straw. All most all the farmers belongto small and marginal category having landholdings of 1-2 acres. The above table alsodepicts that (61%) of the farmers haveincome in between Rs.10, 000-20,000 perannum. Most of the farmers (45%) consumewhat they earn while (28%) save less thanRs.5000 per annum.
Table No.1.2 Farmers' awareness levelabout crop insurance schemes in the
study areas
Awareness level
Number of Farmers Percentage
Aware 29 26 Not Aware 50 46 Indifferent/ No opinion
31 28
Total 110 100 Source: Primary Data
Table No.1.2 shows that the awareness levelamong the farmers about crop insuranceschemes in the study areas is very low.Farmers are not aware about the cropinsurance schemes implemented by theGovernment as risk management tool. Mostof the farmers (46%) have no idea about cropinsurance, (26%) of the farmers have somebasic knowledge about crop insurancewhile (28%) have no opinion about this.
Table No.1.3 Number of Farmers optedfor Crop Insurance
Particulars Number of
Farmers Percentage
Insured 19 26
Not Insured 54 74
Total 73 100 Source: Primary Data
Table No.1.3 depicts that only (74%) of thefarmers have opted for crop insuranceschemes. Rest of the farmers (26%) have notjoined in the crop insurance schemes inspite of their awareness and knowledgeabout crop insurance.
Table No.1.4 Source of Informationabout Crop Insurance
Source Number of
Farmers Percentage
Newspaper/ Television
19 17
Friends/Relatives 23 21
Banks 59 54
Govt. Departments
9 8
Total 110 100
Source: Primary Data
Table No.1.4 depicts that (54%) of thefarmers get information about cropinsurance schemes from Banks, (17%) of thefarmers from Newspaper and otherelectronic Media, (8%) of the farmers fromthe government departments and rest (21%)of the farmers from friends and relatives.
Yayati Nayak

200
Table No.1.5 Nature of risks faced byfarmers
Risks Number of Farmers Percentage
Less Rain/Drought
59 54
Heavy Rain/Flood
17 15
Pests 34 31 Total 110 100
Source: Primary Data
Table No.1.5 depicts that (54%) of thefarmers have the opinion that less rain isthe main cause of risk, (31%) of the farmershave the opinion that pests bring risk while(15%) of the farmers believe that naturalcalamity like flood is also another case ofrisk.
Table No.1.6 Type of Crop Insured
Type of Crop Number of
Farmers Percentage
Rice/Paddy 43 59
Wheat 9 12
Potato 14 19
Groundnut 7 10
Total 73 100
Source: Primary Data
Table No.1.6 depicts that (59%) of thefarmers go for paddy insurance, (19%) ofthe farmers go for potato insurance, (12%)of the farmers go for wheat insurance andthe rest (10%) go for groundnut insurance.
Table No.1.7 Level of satisfaction offarmers on the prevailing Crop
Insurance Schemes
Satisfaction Level
Number of Farmers
Percentage
Satisfied 13 18
Highly Satisfied
7 10
Neutral 14 19
Dissatisfied 39 53
Total 73 100
Source: Primary Data
Table No.1.7 depicts that the awarenesslevel of farmers about crop insuranceschemes in the study areas is notsatisfactory at all. Farmers are not fullysatisfied with the crop insurance schemesimplemented by the Government. From thetotal farmers (53%) of them are dissatisfiedwith the prevailing crop insurance schemes,(18%) of them are satisfied, (10%) of themare highly satisfied while (19%) of themhave no any opinion about the cropinsurance schemes.
Table No.1.8 Reasons for dissatisfactionof farmers on the existing crop insurance
schemes
Reasons Number of
Farmers Percentage
High Premium 39 53
Less Subsidy 19 26
Delay in claim settlement
15 21
Total 73 100
Source: Primary Data
Perception and Awareness Level of Farmers on Crop Insurance in Odisha: A Case Study of ...
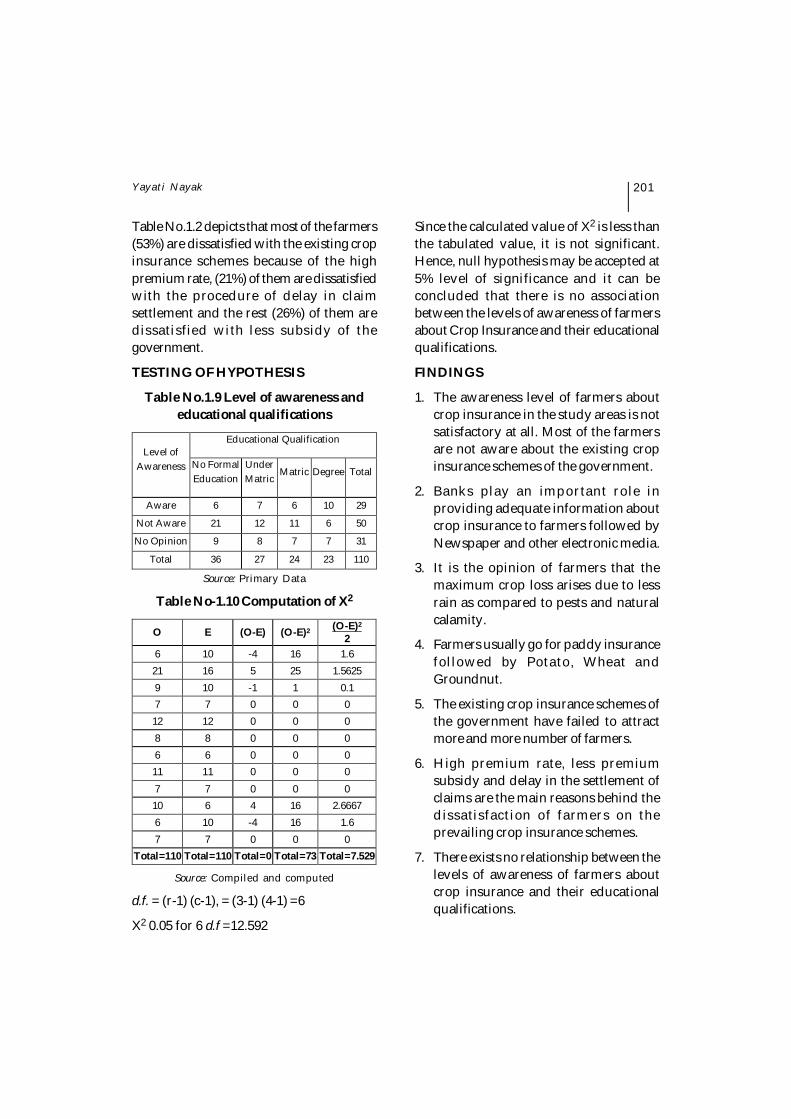
201
Table No.1.2 depicts that most of the farmers(53%) are dissatisfied with the existing cropinsurance schemes because of the highpremium rate, (21%) of them are dissatisfiedwith the procedure of delay in claimsettlement and the rest (26%) of them aredissatisfied with less subsidy of thegovernment.
TESTING OF HYPOTHESIS
Table No.1.9 Level of awareness andeducational qualifications
Level of Awareness
Educational Qualification
No Formal Education
Under Matric
Matric Degree Total
Aware 6 7 6 10 29
Not Aware 21 12 11 6 50
No Opinion 9 8 7 7 31
Total 36 27 24 23 110
Source: Primary Data
Table No-1.10 Computation of X2
O E (O-E) (O-E)2 (O-E)2
2 6 10 -4 16 1.6 21 16 5 25 1.5625 9 10 -1 1 0.1 7 7 0 0 0 12 12 0 0 0 8 8 0 0 0 6 6 0 0 0 11 11 0 0 0 7 7 0 0 0 10 6 4 16 2.6667 6 10 -4 16 1.6 7 7 0 0 0
Total=110 Total=110 Total=0 Total=73 Total=7.529 Source: Compiled and computed
d.f. = (r-1) (c-1), = (3-1) (4-1) =6
X2 0.05 for 6 d.f =12.592
Since the calculated value of X2 is less thanthe tabulated value, it is not significant.Hence, null hypothesis may be accepted at5% level of significance and it can beconcluded that there is no associationbetween the levels of awareness of farmersabout Crop Insurance and their educationalqualifications.
FINDINGS
1. The awareness level of farmers aboutcrop insurance in the study areas is notsatisfactory at all. Most of the farmersare not aware about the existing cropinsurance schemes of the government.
2. Banks play an important role inproviding adequate information aboutcrop insurance to farmers followed byNewspaper and other electronic media.
3. It is the opinion of farmers that themaximum crop loss arises due to lessrain as compared to pests and naturalcalamity.
4. Farmers usually go for paddy insurancefollowed by Potato, Wheat andGroundnut.
5. The existing crop insurance schemes ofthe government have failed to attractmore and more number of farmers.
6. High premium rate, less premiumsubsidy and delay in the settlement ofclaims are the main reasons behind thedissatisfaction of farmers on theprevailing crop insurance schemes.
7. There exists no relationship between thelevels of awareness of farmers aboutcrop insurance and their educationalqualifications.
Yayati Nayak

202
SUGGESTIONS
1. The govt. should come forward toincrease the awareness level of farmersabout crop insurance in all villages.
2. Crop insurance should be madecompulsory to all farmers availing croploans from the Commercial Banks andCooperative Banks.
3. Awareness campaign should beconducted frequently by the governmentfrom time to time in the village level toincrease the awareness level of farmersabout crop insurance.
4. The existing crop insurance schemesmust be redesigned to attract more andmore number of farmers.
5. The claim settlement procedure shouldbe faster. It should be settled within theseason.
6. The government should give moreincentives to attract more and morenumber of farmers in the fold of cropinsurance.
7. The crop insurance schemes must beflexible and cover all types of major cropsof both Kharif and Rabi seasons.
CONCLUSION
With the change of time the agriculturesector is changing very fast. Indianagriculture is prone to a variety of risks.Crop insurance is a risk management toolwhich transfers the risk of farmersassociated with agriculture. The awarenesslevel of farmers about crop insurance in thestudy area is very poor. They are not fullyaware about the existing crop insuranceschemes implemented by the government.Most of the farmers are dissatisfied with the
existing crop insurance schemes onlybecause of its high premium rate and delayin the claim settlement procedures. Thegovernment should give more importanceto review the existing crop insuranceschemes and design them in such a waythat farmers will be automatically motivatedto participate in the crop insuranceprogramme. It is a big task for thegovernment to increase the awareness levelof farmers about crop insurance. Thegovernment should give more premiumsubsidy to motivate farmers to opt for cropinsurance. Awareness campaign should beconducted by the government frequently inthe village level to enhance the educationand awareness level of farmers about cropinsurance. It is also a big challenge for thepolicy makers to design crop insuranceschemes which will be more beneficial toboth farmers as well as to the governmentat large.
REFERENCESBindiya Kunal Soni & Jigna Trivedi (2013),
"Crop Insurance: An Empirical Study onAwareness and Perceptions", GIANJYOTI E-JOURNAL, Volume 3, Issue 2(Apr-Jun 2013), ISSN 2250-348X
S.S. Raju and Ramesh Chand (2008), "A Studyon the Performance of NationalAgricultural Insurance Scheme andSuggestions to make it more Effective",Agricultural Economics ResearchReview, Vol. 21 January-June 2008, pp11-19
Patwardhan P.S. and Narwade S.S (2013), "Roleof Agriculture Insurance Scheme inMarathwada Region of Maharashtra,India", International Journal ofAgriculture Sciences, ISSN: 0975-3710 &E-ISSN: 0975-9107, Volume 5, Issue 1,2013.
Perception and Awareness Level of Farmers on Crop Insurance in Odisha: A Case Study of ...
203
R.C Bharati, N.K Azad, KM Singh, SChakraborti, Naresh Chandra and S.PSingh (2014), "Factors AffectingAdoption of Crop Insurance in Bihar"Journal of AgriSearch 1(2): 102-107ISSN : 2348-8808 (Print ), 2348-8867(Online)
Mukesh H.V (2015) in his research article,"Impact of Crop Insurance on IndianAgriculture", Global Journal forResearch Analysis, Volume-4, Issue-4,April, 2015, ISSN No.2277-8160
D. Suresh Kumar, B.C. Barah, C.R.Ranganathan, R. Venkatram, S.Gurunathan and S. Thirumoorthy (2011),"An Analysis of Farmers' Perceptionand Awareness towards Crop Insuranceas a Tool for Risk Management in TamilNadu", Agricultural EconomicsResearch Review, Vol. 24 January-June2011 pp 37-46
S.B. Goudappa, B. S. Reddy and S.M.Chandrashekhar (2012), "FarmersPerception and Awareness about CropInsurance in Karnataka", IndianResearch Journal of ExtensionEducation, Special Issue (Volume II),2012.
Dr. B.Ravi Kumar (2013) , "Crop Insurance -Tribulations and Prospects of Farmerswith reference to Nuzvid, KrishnaDistrict" , International Journal ofMarketing, Financial Services &Management Research, ISSN: 2277- 3622Vol.2, No. 9, September (2013)
Lopamudra Mohapatra & R K Dhaliwal (2014),"Review of Agricultural Insurance inPunjab State of India", InternationalJournal of Advanced Research (2014),Volume 2, Issue 5, ISSN 2320-5407, PageNo. 459-467
Kiyanoush Ghalavand, Karim.MH (KarimKoshteh) and Abolhassan Hashemi(2012), "Agriculture Insurance as a RiskManagement Strategy in ClimateChange Scenario:A study in IslamicRepublic of Iran", International Journalof Agriculture and Crop Sciences. Intl JAgri Crop Sci. Vol., 4(13), 831-838, 2012,ISSN 2227-670X ©2012 IJACS Journal
Dr.S.M.Uvaneswaran T.Mohanapriya (2014) ,"Farmers' Perception and Awarenessabout Crop Insurance in Tamilnadu - ADescriptive Analysis", IntercontinentalJournal of Marketing Research Review,Volume 2, Issue 3, ISSN: 2321-0346Online, ISSN: 2347-1670 Print
Phillip Daniel Daninga and Zhang Qiao (2014),"Factors Affecting Attitude of Farmerstowards Drought Insurance inTanzania", International Journal ofScience Commerce and HumanitiesVolume No. 2 No. 8 November, 2014.
J.Sundar and Lalitha Ramakrishnan (2013),"AStudy on Farmers' Awareness,Perception and Willing to Join and Payfor Crop Insurance",InternationalJournal of Business and ManagementInvention ISSN (Online): 2319 - 8028,ISSN (Print): 2319 - 801X www.ijbmi.orgVolume 2 Issue 1 ? January. 2013? PP.48-54
Dr. Md. Mushfiqur Rahman, Bikash ChandraGhosh and Dr. Mir Khaled IqbalChowdhury (2014), "Problems andProspects of Weather Index Based CropInsurance in Developing Countries: ACase for Rural Farmers in Bangladesh",
Yayati Nayak

MARKETING PRACTICES IN INDIAN LIFEINSURANCE INDUSTRY
A STUDY ON CONSUMER SATISFACTION
*Assistant Professor, Asian School of Business Management, Bhubaneswar, email id- [email protected]
Dr. Padmanava Mohapatra*
INTRODUCTION
Towards the last decade of 20th century itwas analysed that the growth of Indian lifeinsurance business is quite unsatisfactoryand not parallel with the growth ofpopulation and economy as compared toother parts of the developed and developingworld, although the history of this businessin India is a long past. The life insurancepenetration and density were laughable, i.e.1.39 and 6.1 respectively in the year 1999which is far behind the global standard. Inthe international life insurance market theposition of India was 20th with a mere 0.5%of the world premium. The forces ofliberlisation that swept the country in 1999had led to the setting up of the Insurance
Regulatory and Development Authority(IRDA) and opening up of the sector to theprivate competition, with a provision for26% foreign participation. At present theforeign participation is increased to 49%.As on 1st April 2000 only one state ownedcorporation, i.e. Life Insurance Corporationof India was there in Indian life insurancemarket. Soon after the establishment ofIRDA, in July 2000, the first private lifeinsurance company 'HDFC Standard LifeInsurance Company' was registered with a74% share from HDFC Limited and 26%from a foreign player Standard Life of UK.By the end of the financial year 2000-01seven private players were launched intothe Indian life insurance market with their
ABSTRACTPrivate entry brought a competitive atmosphere in the Indian life insurance market. In this backdrop,servicing of the large domestic market in India became a real challenge for the life insurance industry.Keeping this in view a lot of changes were brought out in the life insurance practices like new channelsof distribution, greater use of Information Technology (IT) as a facilitator, inclusion of riders for thecustomization of products, relaxation of the complexities like revival of lapsed policies, granting ofloans at emergency or pre-occurrence of the target needs and assignment of life policies. This researchpaper has three major objectives to deal with. The first one is to analyse the various effective marketingpractices from the customers' point of view. Secondly, to evaluate the effect of changing environment onadoption and execution of different marketing practices in Indian life insurance market with the adventof Insurance Regulatory and Development Authority (IRDA).Lastly, the study also empirically measuresthe impact of demographic profile of customers on their satisfaction level.
Key Words : Life Insurance, Indian Life Insurance industry, Marketing Practices, Insurance Regulatory& Development Authority (IRDA), Changing Paradigm and Consumer Satisfaction.
The Utkal Business ReviewDecember, 2015, Vol - XXIX, pp.-204-220

205
foreign partners. At present the industrycomprises of 24 life insurance players outof which 23 are private companies and onlyone is in public sector, i.e. the Life InsuranceCorporation of India. It is the life insurancegiant in India having about 75% marketshare as regards to the first year newpremium. The private life insurancecompanies hold rest 25% market share.
In life insurance business, India ranked 15thamong the 156 countries, dropped by fourplaces (Shetty, 2014). During 2013-14, thenew premium growth rate in India is 12.7% where, the global life insurance premiumexpanded by 0.7% only. The insurancedensity of life insurance sector had gone upfrom USD 9.1 in 2001 to USD 41 in 2013.Similarly, insurance penetration had goneup from 2.15 per cent in 2001 to 3.17 in 2012,before slipping to 3.10 per cent in 2013(Swiss Re, Sigma No. 3/2014).
With the entry of private players backed byforeign expertise the Indian life insurancemarket became more vibrant. Competitionin the market increased. Insurerscompounded their new product offeringsto the customers both in the line of unitlinked and non linked. Multi variety of UnitLinked Insurance Products (ULIPs) came tothe market to suit the varied need of differentgroup of customers. Availability ofheterogeneous innovative products madethe customers choosy. The shift in consumerpreference towards product mix is anoticeable phenomenon in the new era oflife insurance. Simultaneously, private entrybrought a competitive atmosphere in theIndian life insurance market. In thisbackdrop the future growth depends upon-how service oriented the insurers are goingto be. Servicing of the large domestic market
in India is a real challenge for the lifeinsurance industry. Keeping this in view alot of changes were brought in the lifeinsurance practices such as new channelsof distribution, greater use of InformationTechnology as a facilitator, inclusion ofriders for the customization of products,relaxation to complexities like revival oflapsed policies, granting of loans atemergency or pre- occurrence of the targetneeds and assignment of life policies. Thisresearch paper evaluates the effect ofchanging environment on differentmarketing practices prevailing in Indian lifeinsurance market and measures thesatisfaction of customers there on.
LITERATURE REVIEW
Palande et al (2007) found that the Insuranceindustry is going to witness sea changes inits marketing strategies. The existing andthe new insurers will devise differentstrategies to retain and enhance their marketshare. It would be done by various methodsby bringing in new practices, settings newservice standards and creating newbenchmarks. Singh & Lall (2011) concludedthat large number of customers are satisfiedwith the premium policies and services ofinsurance companies. It shows brighterfuture for the customers as well as insuranceindustry in India. Sharma (2012) says thatIndia have comparative advantage fordelivering better services to their customeragainst China, even-though both theeconomies still under penetrated. "Risinginternet use is increasing transparency inthe industry, providing customers withbetter access to information on productspecifications and pricing and increasedbargaining power".
Dr. Padmanava Mohapatra

206
Tiwari & Yadav (2012) opined that toachieve greater insurance penetration, ahealthier competition has to be intensifiedby both the sectors and they should comeup with new innovative products to offergreater variety or choice to the customersand also make improvement in the qualityof services and sell products throughappropriate distribution channel for a win-win situation for both the parties. Sachaereret al (2011) discusses about the significantchallenges insurance companies face today,it is important for executives to thinkseriously about transforming theircompanies' business models to betterunderstand and become more relevant totheir customers. Doing so will not onlyimprove short-term results, but promoterevenue growth, financial stability, andprosperity. Imam (2011) analyses the majorfactors playing the role in developingcustomer's perception towards lifeinsurance policies are consumer loyalty,service quality, ease of procedures,satisfaction level, company image, andcompany-client relationship.
Pati (2011) is of the opinion that India isemerging as a major player in the insurancemarkets of the world. Life insurance willgrow very rapidly over the next decades inIndia. The major drivers include soundeconomic fundamentals, a rising middle-income class, an improving regulatoryframework and rising risk awareness. Thefundamental regulatory changes in theinsurance sector in 1999 were significantfor future growth. Min Le (2008) opines thatthe financial professionals should adviseand educate households about the need forlife insurance and how to determinesufficient amount of life insurance to
purchase. Kuhlemeyer & Allen (1999)observe the overall satisfaction with lifeinsurance was higher than expected andresulted in an above average satisfactionbenchmark in almost all areas. The mainbenefit of this research is the future value ofthe benchmarks. As variables change,future researchers will be able to compareconsumer satisfaction with the benchmarksestablished herein.
Bhat (2005) observes that improvement ofefficiency of the sector necessitates thereduction of costs, increasing of penetrationin rural and suburban areas, strengtheningthe distribution network, providingtraining to all those involved in the processand designing the products to meet thedifferent segments of the population. Mishra(2006) conducted a study on evaluation ofcustomer relationship managementthrough field force and observed that LICproclaims that it is a friend in need byproviding loan to its policyholders at needand very supportive to its customers inopening and successfully operating theredressal cell. Again he evaluated that theoutstanding death claim is higher than thematurity claim which is natural. Heemphasized on prompt issue of premiumreminder notice and suggested that themanagers should take the help of agents inpreventing lapse of life policies. Pravakar(2007) suggests that it is worthwhile that aserious attempt is made at the earliest toreduce the complexities of the policy bondwith a judicial standardization whichprovides much needed solution withoutcompromising the competitive spirit of themarket. James (2008) described thatinsurance is a public good; regulations, self-regulations and standards normally require
Marketing practices in Indian Life Insurance Industry A Study on Consumer Satisfaction

207
that rates and terms are fair, reasonable andnot expensive. He made it clear that for alife insurance product to meet customerrequirement, it must make both an economicsense as well as service sense to thecustomer. Economic sense includes issuessuch as reasonable premium load, theassurance of contract certainty, and toreceiving the expected level of indemnity incase of covered loss as promised. In servicesphere it includes ease of use, includingminimum paper work; easierunderstandability; assurance on time lessand speed; minimisation of formalities andclear and honest advice; and disclosures.Kutty (2008) identifies three central pointsof qualitative market development namelyevaluation of complete market, promotionof market efficiency and emergence of morerational choice of ordering process. Againhe clarified that these concepts are abstracts,no doubt. They can be given flesh and shape,as they become signposts for policy,research and action. Nagarajarao (2009)observes in his paper based on hiddenpractices in life insurance that there arecertain practices that are followed as a partof routine although the policyholder is notgiven to know them; and further states thatthis adds to the detriment of observing goodpractices. Again he said it is a generalobservation that the most successful andpopular plan is that which promisesmaximum commission to the agent.
Pravakar G. (2011) concludes that theindustry focuses not only to enhance theinsurance penetration with productinnovation but also a better understandingof the product with zero mis-selling. Insurersshall know that enhancing the servicestandards is a way forward for an effective
inclusive growth of insurance industry inthe decade ahead. Kaur (2010), opines thatthe distribution is the key determinants ofsuccess for all insurance companiesregardless of age and ownership. Thecompanies should put more emphasis onstrengthening the distribution networks. Itcan be well said that the regulations aretransparent and all the companies shouldbe well prepared to meet the standards.Finally, whether the insurer is new or old,the extended market will compel them toface many challenges and will also providevariety of opportunities. Miremadi et al(2011) empirically examined and discussedvarious promotional strategies formarketing of life insurance, those are publicrelation, publicity and advertisements.
Baradhwaj (2008) states that repudiation ofa life insurance claim occurs on account ofnon-disclosure of facts, without theapplicant actually knowing about thequeries in the proposal form. He goes on tosuggest a few remedial steps to check thislike special training sessions for agents,strict disciplinary actions against agents,customer call back on sample basis, printingof proposal form in local language etc.Ramesh D.V.S. (2006) argues that if thepersonnel of claims settlement section arenot properly trained on the aspects ofprudent claims settlement, there is a dangerof the claimants losing faith in the systemof life insurance.
Chandrasekharan (2008) in his study basedon ethics in life insurance emphasises thatidentifying the right product is the first steptowards ethical selling. He adds that itsounds very simple, it is hard to accomplish,considering the numerous factors that go
Dr. Padmanava Mohapatra

208
into sales. Again he adds that over sellingin fact is bad for all the stakeholders as itinvariably results in lapsation. Underselling can be really tragic if the insured diesprematurely as what insurance pays is notadequate to meet the family's need.Rajgopalan (2008) explains lapsation of lifepolicies asserts that there is high level ofcompetition for personal savings from thevarious retail financial service providersand their products; and this also has animpact on the business retention levels oflife insurers. Termination of policies of earlystages results in loss and wastage of effortsof all the participants in the deal; namelythe policyholder, the agent and the insurer.Mallela, et al. (2008) pointed out that thereis a huge role to play for all the stakeholdersin arresting the lapsing trends in lifeinsurance. Gopalkrishna (2008) saidalthough a lapse of policy leads todisadvantage for both the parties, there ishope in the form of revivals. He suggestedthe underwriter may agree to revive as perthe original policy terms or on modifiedterms or even decline to revive on fresh termsand conditions. Jagendra (2009) observesthat LIC of India's lapsation ratio is around25%, while it is 40% in private sectorsduring the last three years. One of the majorcauses of for growing lapsation is forcedselling of agents to achieve their targets.Agents sell without taking the customer'sneed into the consideration. Thus after firstyear premium the lapsation comes. Heevaluated that the lapse ratio is highest interm insurance policies i.e. 28.27% bynumber and 18.95% by premium. Whole lifeplans show higher lapsation thanendowment. Lapsation in ULIPs ismeasured at 18.09% by number and 10.01%
by premium but the traditional plan shows6.59% by number and 5.63% by premium.
Murty (2007) emphasizes that in theprocess, the expectations of consumer havealso gone up; he is expecting value addedservices, in terms of excellence in productprice and service, financial security, quality,after sales service, review of terms andconditions as frequently as desired,simplification of claim procedures etc.Chaudhary & Kiran (2011) say it is evidentthat life insurance industry expandedtremendously from 2000 onwards in termsof number of offices, number of agents, newbusiness policies, premium income etc.Further, many new products (like ULIPs,pension plans etc.) and riders wereprovided by the life insurers to suit therequirements of various customers. Sud(2012) opines that the agents are expectedto know all details about the products andsolutions that they are recommending to thecustomers in relation to the equivalentoptions available in the market. Sharma(2008) identified that the demand for lifeinsurance is driven by several economicfactors like prices of insurance, governmenttax, the general economic environment,income, inflation and interest rates etc.
The literature indicates that the marketingpractices are the binding nuts between theinsurer and insured. The market would bemore stable by analyzing and eradicatingthe disappointments of the customers withthe prevailing practices within the scopeand justice of the subject. Understandingthe importance of various marketingpractices and measuring the satisfaction ofcustomers on prevailing practices no doubtbecame a vibrant study of the time. This
Marketing practices in Indian Life Insurance Industry A Study on Consumer Satisfaction

209
research paper aims to study the same andthe specific objectives of this study are asfollows-
OBJECTIVES OF THE STUDY
1. To assess the effectiveness of variousmarketing practices of life insuranceindustry.
2. To evaluate the effect of changingenvironment on marketing practices.
3. To measure empirically the impact ofdemographic profile of customers ontheir satisfaction level.
RESEARCH METHODOLOGY
Sample- The study is based upon bothprimary and secondary data. The sourcesof secondary data are basically the papersof different journals. The primary data havebeen gathered through a structuredquestionnaire. In order to meet the objectivesof this study and to fulfill the requirementsof the pre-designed hypothesis one set ofstructured questionnaire was administeredto 85 number of life insurance customers(technically called as "Insured") on randomsampling method. Response from 7
correspondents have been found to beunsound and thus rejected, remaining 78numbers are accepted and processedthrough SPSS to draw statistical inference.The respondents belong to the district ofKhurda from the state of Odisha. Out of 78respondents, 37 are the customers of LIC ofIndia, 26 are the customers of various privateinsurers and 15 are the customers of bothLIC of India and other private insurers.
Basically, this is a study of satisfaction oflife insurance customers' on prevailingmarketing practices as regards to their socio-economic profiles (demography) like, livingplace, level of income, occupation statusand educational background. The factorwise sub groupings of each profile areshown below in Table 1. Taking the lifeinsurance market situation into theconsideration the ratio of respondentsprofile as regards to their living place andincome is given more importance comparedto occupation and education. The ratio ofrural and urban respondents is 33:67 whereas the ratio of low income, middle incomeand high income respondent is 27:46:27.
Table 1 : Factor-wise Sub-grouping of Respondent's Profile
Living Place Income Occupation Education Rural Urban
Low Income Middle Income High Income
Government Employees Private Employees Professional Agricultural Landlord Businessmen & Others
Under Graduate General Graduate Post Graduate and
Technical Graduate
Tools- Statistical tools like percentage,average have been very frequently used inthis study. In particular, various parametersunder different sub-sections have beenjudged through a 'level score' which is
described in detail in their respective subsections. For testing of hypotheses the F test(ANOVA for Regression) is used. Thedemography (socio-economic profile) as anindependent factor influences the level of
Dr. Padmanava Mohapatra

210
satisfaction of the insured on the differentmarketing practices adopted by theinsurance companies. In order to prove thelinear relationship between the socio-economic profile of insured and their levelof satisfaction on different marketingpractices of insurers the ANOVA forRegression, i.e. (F test) is used and to testthe strength of association, the coefficientof determination i.e. (r2) is used. The detaildescription of methodology is shown in thesub-heading 'Testing of Hypothesis'.
EFFECTIVENESS & IMPORTANCE OFMARKETING PRACTICES
An Assessment- In order to measure theeffectiveness of different marketingpractices from the customer's point of view,ten practices were selected out of the lot andthe respondents were asked to give theirview points under the three scale categorynamely, 'Very Important', 'Important' and'Not Important'. The proportionateweightage were given to the three scalecategory 3, 2, and 1 respectively. The levelscore indicates the level of effectiveness ofeach practice separately. This study willhelp the insurers to assess the expectationsof the customers and to improvisethemselves in that regard.
Table 2 : Effectiveness of Marketing Practices
Aspects Level Score*
a. Standardisation of rebate system b. Timely issue of premium reminder notice c. Simplification of language in product brochure d. Quick disposal of surrender value e. Quick disposal of death claim f. Quarterly communication of position of ULIP g. Standardisation of ULIP charges h. Early issue of policy document i. Proper medical examination of insured j. Quick disposal of loan on policy
2.3846 2.7692 2.7564 2.7179 2.9103 2.3333 2.1154 2.5897 2.5128 2.6410
*The level score ratings are as follows-
[1] - Not important; [1.1 to 1.99] - In between;[2] - Important; [2.1 to 2.9] - In between [3]-Fully important
It is revealed from the above observationthat the insured are giving heavy weightage(very importance) to the marketing practicesand expecting the insurers should givepriority to those. Varieties of rebate
structures are allowed by the insurers forthe modes of payment of premium and onquantum of sum assured. It makes adifference in cost of life insurance products.High score of importance (2.3846) signifies
Marketing practices in Indian Life Insurance Industry A Study on Consumer Satisfaction

211
that the insured are in support ofstandardization of rebate structure.
Life insurance is a technical financial tool.By purchasing the product it becomes a legallong term contract between insured andinsurer subject to certain terms andconditions. Hence insured are in highsupport to the simplification of language inproduct brochure. This is consistent to thestudy of Jain (2007) and V. Ramakrishna(2007).
Similarly ULIPs offered by differentinsurers have varying charge structures. Itis the discretionary power of insurers to fixup the charges on ULIP offered by them.Sometimes it is hefty and hectic to bear.Various news agencies have reported thehesitations of Indian customers and desiredthe charges should be scanned and capedby the regulating authority. Insured have astrong support to the standardization ofULIP charges. The level score of 2.1154indicates a full support to the fact. It may benoted here, of course in late IRDA releaseda circular on 22nd July, 2009 with a title,"Unit Linked Products- Cap on Charges"w.e.f. 1st October, 2009 to standardise thelimit on charges for all insurers and linkedproducts. Again, quarterly communicationof position of ULIP is accepted by theinsured as an important aspect.
Quick disposal of death claim has provedto be more effective in alluring the customerssince the level score of 2.9103 is quite closeto 3. This is because delay in death claim isharassment to the dependants, no life
insurance buyer will support a delay. Againneed of life insurance is felt when the deathclaim is received, thus it is an advertisementfor others to feel and purchase. The insurersshould do the needful.
Quick issue of surrender value and loan isno doubt against to the basic concept of lifeinsurance as it is demanded by majority ofinsured as a very important service. Highsupport is recorded with the timely issue ofpremium reminder notice and early issueof policy document Proper medicalexamination of insured got a high emotionalsupport (Level score 2.5128) but the realityis a question mark.
EFFECT OF CHANGINGENVIRONMENT
An Evaluation- Private players wereentered soon after the establishment ofInsurance Regulatory and DevelopmentAuthority. The insurance industry in Indiahas witnessed a number of changes as aresult of opening up to the private sector.The basic objective of the liberalisation wasto encourage competition and to improveservicing conditions and standards withinthe industry. To measure the promptnessin services offered before and after to theliberalization of the market, the respondentswere asked to give their view points undera three point scale namely, "Very Prompt","Prompt" and "Delay". The level score iscalculated by giving proportionateweightage of 3, 2, and 1, to the above statedcomparative scales respectively (Table 3).
Dr. Padmanava Mohapatra

212
Greater use of Information Technology as afacilitator brought tremendous change in themarketing practices. Transfer of policy fromone branch to other, change of address forbetter servicing and prompt issue of policydocument became speeder; Level score ofpromptness is whopping in these cases(delay to either prompt or approaching tovery prompt). Speedy recovery of servicesin revival of lapsed policy, settlement ofdeath claim, disposal of surrender value andmeeting of enquiry and grievances are theresult of competitiveness after opening upof the sector (Present level score is in between1.5 to 1.6). Sanction of loan is still reportedas poor as the private insurers have not yetadopted this facility in full force. The overallpromptness (2.6123) is quite satisfactoryand a "Paradigm Shift" is visible in overall
promptness after opening up to the privatesector, still the readiness in the industry isat the foot level, a long way is to proceed.
CUSTOMER SATISFACTION ONDIFFERENT MARKETING PRACTICES
A Critical Measure- The customers are tomove within the boundary of practicesoffered by the life insurers subject to certainset of principles. How far the insured aresatisfied with those practices? In order tomeasure the satisfaction level of thecustomers to those practices a three pointscale examination is followed with thescales like "Fully Satisfactory","Satisfactory" and "Not Satisfactory". Thelevel score is calculated by givingproportionate weightage of 3, 2, and 1,respectively.
Table 3 : Effect of Changing Environment on Different Marketing Practices
Aspects Level Score*
Before IRDA After IRDA a. Prompt Issue of policy document b. Timely issue of premium reminder notice c. Transfer of policy from one branch to other d. Sanction of loan and its disposal e. Quick disposal of surrender value f. Revival of lapsed policy g. Issue of duplicate policy bond h. Settlement of death claim i. Meeting of enquiry and grievances j. Change of address in policy document
1.1200 1.4000 1.2000 1.4000 1.4000 1.3000 1.4000 1.0000 1.4000 1.6000
1.9103 1.8000 1.8000 1.6667 1.5513 1.5513 1.8000 1.4872 1.5769 1.8500
Overall Promptness 1.1820 2.6123
Source- Primary Data, (IRDA denotes Insurance Regulatory and Development Authority)
*The level score ratings are as follows-
[1]- Delay, [1.1 to 1.99]- Approaching towards promptness; [2]- Prompt; [2.1 to 2.9]-Approaching towards fully promptness and [3]-Fully prompt
Marketing practices in Indian Life Insurance Industry A Study on Consumer Satisfaction

213
Table 4 : Satisfaction on Life Insurance Practices (Living Place- wise)
Aspects Level Score*
Rural Urban a. Bonus rates on different policies b. Procedure of meeting death claim c. Facility of revival on lapsed policy d. Disposal of surrender value e. Sanction of loan and disposal f. Different charges on ULIP g. Effectiveness of distribution channel h. Issue of policy document i. Customer care and enquiry
1.6154 1.5769 1.6154 1.4231 1.8462 1.1923 1.4231 1.7692 1.6154
1.5192 1.4423 1.5192 1.6154 1.5769 1.2500 1.2692 1.9956 1.5577
Overall Satisfaction 1.5346 1.5192 Table 5 : Satisfaction on Life Insurance Practices (Income-wise)
Aspects Level Score*
Low Income Middle Income High Income a. Bonus rates on different policies b. Procedure of meeting death claim c. Facility of revival on lapsed policy d. Disposal of surrender value e. Sanction of loan and disposal f. Different charges on ULIP g. Effectiveness of distribution channel h. Issue of policy document i. Customer care and enquiry
1.4762 1.5714 1.5714 1.5238 1.6667 1.2857 1.2381 1.8095 1.6190
1.6389 1.5556 1.5278 1.4167 1.7222 1.1111 1.2222 2.0000 1.6389
1.4762 1.2857 1.5714 1.8089 1.5714 1.3810 1.5714 1.8571 1.4268
Overall Satisfaction 1.5048 1.5195 1.5521 Table 6 : Satisfaction on Life Insurance Practices (Occupation-wise)
Aspects Level Score*
Government Employees
Private Employees Professionals Agricultural
Landlords Businessmen
& Others a. Bonus rates on different policies b. Procedure of meeting death claim c. Facility of revival on lapsed policy d. Disposal of surrender value e. Sanction of loan and disposal f. Different charges on ULIP g. Effectiveness of distribution channel h. Issue of policy document i. Customer care and enquiry
1.4524 1.6905 1.5714 1.5952 1.6429 1.2619 1.2143 1.9048 1.6429
1.6364 1.0909 1.8182 1.9091 1.9091 1.3636 1.5455 2.0909 1.8182
1.6000 1.2000 1.6000 1.8000 1.8000 1.2000 1.8000 2.0000 1.2000
1.0000 1.5000 2.0000 2.0000 2.0000 2.0000 2.0000 2.0000 1.5000
1.3889 1.3333 1.2778 1.1111 1.5000 1.0000 1.2222 1.7778 1.3889
Overall Satisfaction 1.5595 1.6636 1.5800 1.7000 1.3222
Dr. Padmanava Mohapatra

214
Table 7 : Satisfaction on Life Insurance Practices (Education-wise)
Aspects Level Score*
Below Graduates Graduates Post Graduates and Technical a. Bonus rates on different policies b. Procedure of meeting death claim c. Facility of revival on lapsed policy d. Disposal of surrender value e. Sanction of loan and disposal f. Different charges on ULIP g. Effectiveness of distribution channel h. Issue of policy document i. Customer care and enquiry
1.6000 1.4000 1.4000 1.2000 1.6530 1.2000 1.2000 1.7000 1.7000
1.5600 1.4000 1.6000 1.6000 1.8000 1.2400 1.3600 2.0400 1.7200
1.5349 1.5581 1.5581 1.6047 1.6047 1.2326 1.3256 1.8837 1.4651
Overall Satisfaction 1.4200 1.5760 1.5186 *The level score ratings used in tables 4, 5, 6, and 7 are as follows-
[1]- Not satisfactory, [1.1 to 1.99]- Approaching towards satisfactory [2]-Satisfactory [ 2.1 to 2.9]-Approaching towards fully satisfactory and [3]-Fully satisfactory.
Reliability Test- A reliability test wascarried out using SPSS software and thereliability of the items was measured. Theresult is as follows-
No. of Cases= 78, No. of items= 10 andAlpha= 0.7270
As the reliability value (Alpha) is more than0.6, the questionnaire is highly reliableMinimum criteria for alpha value is > 0.60(Nunnally, 1978).
Inferences- Neither the rural nor the urbancustomers are satisfied with the prevailingmarketing practices associated with the lifeinsurance business. The overall satisfactionlevels of both rural and urban insured are1.5346 and 1.5192 respectively. Smell ofdissatisfaction is coming in every respectexcept the issue of policy document, whichis a law binding process and where insuredhas no specific economic benefit. Chargeson ULIP are highly regretted, both urbanand rural customers have shown a poorsatisfaction on that. Effectiveness of
distribution channel is rejected in both ruraland urban; the level scores are verynegligible, i.e. 1.4231 and 1.2692,respectively (Table-4).
It is observed from the table- 5 that,irrespective of their income background theinsured are not happy with the marketingpractices adopted by the insurers, all the threegroups are below to the satisfaction level, thescores are within 1.5 to 1.55. The rebate rateon premium which is pertinent to the incomelevel is highly regretted by all the groups.Probably, it is an agency failure. Middleincome group customers, who are alwaysunder the pressure of inflation, raised astrong dissatisfaction towards the chargeson linked product (1.1111). Low incomegroup is also behaved similarly (1.2857).
It is revealed from table- 6 that the overallsatisfaction and individual level score (1.32to 1.70) of the customers under theiroccupation profile is much behind to thesatisfaction level. In some parameters like-
Marketing practices in Indian Life Insurance Industry A Study on Consumer Satisfaction

215
bonus rate, revival of lapsed policies,disposal of surrender value, sanction of loanand customer care; the level score is poorbecause of a 50/50 support and hesitation.More anxiety towards profit, made thebusinessmen and self employed distinctfrom their counterparts who are satisfiedwith the tax privilege of life policy. However,the satisfaction level is visible (high scoring)with all groups about the issue of policydocument by the insurers.
It is observed from the table- 7 that the overallsatisfaction of all insured under variouseducational profile seems to be poor; thelevel ranges from 1.42 to 1.58. All individualparameters with a single stipulation (point-i) indicate unsatisfactory result (veryminimum score). Majority of insured haveshown their satisfaction in the issue ofpolicy document by the insurer where thebenefit is psychological in nature. Customercare in the opinion of high qualified insuredis extremely bad (1.46) as compared tograduates (1.72), the matter should be notedsincerely by the insurers.
TESTING OF HYPOTHESIS
The demography (socio-economic profile)as an independent factor influences the levelof satisfaction of the insured on themarketing practices adopted by theinsurance companies. Is it true? Is there anylinear relationship between the socio-economic profile of insured and their levelof satisfaction on marketing practices ofinsurers? If linear then, is there a strongassociation between these two variables? Totest the linearity the ANOVA for Regression,i.e. (F test) and to test the strength ofassociation, the coefficient of determinationi.e. (r2) are used.
The F test (ANOVA for Regression) is usedto examine the linearity. SPSS is a friendlypackage and indicates the level ofsignificance for F value readily. There is noneed to refer the critical values at 95%confidence level with the given degree offreedom. If the significance level for F is lessthan 0.05 then at 95% level of confidence atgiven degree of freedom the relationshipbetween the two variables is linear.
The correlation coefficient is the correlationbetween the observed and predicted valuesof the dependant variable. The value of rranges from zero to one for modelsproduced by regression. The larger valuesof r indicate stronger relationship. Thecoefficient of determination, (r2), indicatesthe proportion of variation in the dependentvariable explained by the regression model.The value of (r2) ranges from 0 to 1.
The following hypothesis is formed.
Hypothesis- The demography of the insuredwould influence their level of satisfactionon the marketing practices adopted by thelife insurance companies.
Null Hypothesis- The demography of theinsured would not influence their level ofsatisfaction on the marketing practicesadopted by the life insurance companies.
The above hypothesis can be fragmentedinto four sub hypotheses like-
Sub-hypothesis- I
H1: The living place of the insured wouldinfluence their level of satisfaction on themarketing practices adopted by the lifeinsurance companies.
H0: The living place of the insured wouldnot influence their level of satisfaction on
Dr. Padmanava Mohapatra

216
the marketing practices adopted by the lifeinsurance companies.
Sub-hypothesis- II
H1: The level of income of the insured wouldinfluence their level of satisfaction on themarketing practices adopted by the lifeinsurance companies.
H0: The level of income of the insured wouldnot influence their level of satisfaction onthe marketing practices adopted by the lifeinsurance companies.
Sub-hypothesis- III
H1: The occupational status of the insuredwould influence their level of satisfactionon the marketing practices adopted by thelife insurance companies.
H0: The occupation status of the insuredwould not influence their level ofsatisfaction on the marketing practicesadopted by the life insurance companies.
Sub-hypothesis- IV
H1: The educational background of theinsured would influence their level ofsatisfaction on the marketing practicesadopted by the life insurance companies.
H0: The educational background of theinsured would influence their level ofsatisfaction on the marketing practicesadopted by the life insurance companies.
Note- The mean score total of the satisfactionof all the parameters denoted asSatisfaction- I. It is the dependent variableunder study and the demographic profileslike living place, income, education andoccupational status are the constants /predictors.
Regression Analysis (Living Place-wise)
Table 8 : Regression Analysis ModelSummary
Model R R-squared Adjusted R-squared
Std. Error of the Estimate
1 0.022 0.001 -0.013 3.28466 Predictors: (Constant), PLACEDependent Variable: SATISFACTION-I
Table 9 : ANOVA Table for Regression
Model Sum of Squares df Mean-
square F Sig.
1 Regression 0.410 1 0.410 0.038 0.846
Residual/Error 819.962 76 10.789
Total 820.372 77
Inference- The significance level 0.846 forF value is greater than 0.05. Hence there isno linear relationship between the twovariables living place and satisfaction onpractices. Again the value of r2 (0.001)explains, only 00% of the dependantvariable (Satisfaction on marketingpractices) is explained by the independentvariable (Living Place of insured). Hence,the Sub-hypothesis- I is rejected.
Regression Analysis (Income-wise)
Table 10 : Regression Analysis ModelSummary
Model R R-squared Adjusted R-squared
Std. Error of the Estimate
1 .054 0.003 -0.010 3.28071
Predictors: (Constant), INCOMEDependent Variable: SATISFACTION-I
Marketing practices in Indian Life Insurance Industry A Study on Consumer Satisfaction

217
Table 11 : ANOVA Table for Regression(Using SPSS)
Model Sum of Squares df Mean-
squared F Sig.
1 Regression 2.381 1 2.381 0.221 0.639 Residual 817.991 76 10.763 Total 820.372 77
Inference- The significance level 0.639 forF value is greater than 0.05. Hence there isno linear relationship between the twovariables, i.e. level of income and satisfactionon practices. Again the value of r2 (0.003)explains, only 00% of the dependantvariable (Satisfaction on marketingpractices) is explained by the independentvariable (Level of income of insured). Hence,the Sub-hypothesis- II is rejected.
Regression Analysis (Occupation-wise)
Table 12 : Regression Analysis ModelSummary
Model R R-squared Adjusted R-square
Std. Error of the Estimate
1 0.274 0.075 0.063 3.15969
Predictors: (Constant), OCCUPATIONDependent Variable: SATISFACTION-I
Table 13 : ANOVA Table for Regression
Model Sum of Squares df Mean-
squared F Sig.
1 Regression 61.616 1 61.616 6.172 0.015 Residual 758.756 76 9.984 Total 820.372 77
Inference- The significance level 0.015 for Fvalue is smaller than 0.05. Hence there is alinear relationship between the twovariables, i.e. occupational status andsatisfaction on practices. Again the valueof r2 (0.075) explains; only 07.5% of thedependant variable (Satisfaction onmarketing practices) is explained by theindependent variable (occupational status
of the insured). Thus, the relationship is notstronger only 7.5% of the dependent variablecan be predicted with the independentvariable. Hence, the Sub-hypothesis- III isrejected.
Regression Analysis (Education-wise)
Table 14 : Regression Analysis ModelSummary
Model R R-squared Adjusted R-squared
Std. Error of the Estimate
1 .044 0.002 -0.011 3.28223
Predictors: (Constant), EDUCATIONDependent Variable: SATISFACTION-I
Table15 : ANOVA Table for Regression(Using SPSS)
Model Sum of Squares df Mean-
squared F Sig.
1 Regression 1.624 1 1.624 0.151 0.699 Residual 818.748 76 10.773 Total 820.372 77
Inference- The significance level 0.699 forF value is greater than 0.05. Hence there isno linear relationship between the twovariables, i.e. educational background ofinsured and satisfaction on marketingpractices. Again the value of r2 (0.003)explains, only 00% of the dependantvariable (Satisfaction on marketingpractices) is explained by the independentvariable (Educational background ofinsured). Hence, the Sub-hypothesis- IV isrejected.
Rejection of the all the four sub-hypothesesrejects the principal hypothesis. Hence, thedemography (socio-economic profile) of theinsured would not influence theirsatisfaction level on the on the marketingpractices adopted by the insurancecompanies.
Dr. Padmanava Mohapatra

218
CONCLUSION AND FINDINGS
Overall promptness is visible after openingup to the private sector. An overalldissatisfaction is found with rebate structureamong the insured. Perhaps, the benefits ofrebate are not of much help to them; this isan example of agency failure. Theineffectiveness of distribution channel ishighly regretted by all the insured. Insuredare not happy with the prevailing chargestructure of linked products and haverecommended for IRDA scanning. Aspreading hesitation for the delay in deathclaim is prevailing in the market and insurersand authority should do the needful.
The Changing Paradigm- Competition inthe insurance industry has brought out anopportunity to the players to see thecustomers as "king" in the market. Theforemost beneficiary of the liberalizationshould be the customer and it throws manychallenges to the players to meet thecustomer expectations. A "Paradigm Shift"is visible in overall promptness in renderingservices (marketing practices in operation)after opening up to the private sector due tocompetitiveness and inclusion of ITfacilities, still the readiness in the industryis at the foot level, a long way to go.
The Effect of Socio-Economic Profile- Thedemography (socio-economic profile) of theinsured would not influence theirsatisfaction level on the marketing practicesadopted by the insurance companies. Theoverall satisfaction level of customers on theprevailing marketing practices being usedby the life insurers are almost same (aroundto a level score of 1.5) irrespective of theirsocio-economic profiles. Overall, thecustomers are not completely satisfied but
the scores show that they are approachingtowards satisfaction. The future is bright.In an exception the businessmen haveshown their little lesser satisfaction onlybecause of low bonus rate attached to theproducts and the people from agriculturalsection have shown a little highersatisfaction only because they are free fromcertain practices which are managed bytheir agents. However, the difference inoverall opinion is invisible and negligible.
REFERENCESBharadwaj, C.L. (2008), "Disclosure of Facts- The
Customer Should Get Fair Deal", IRDAJournal, Vol. 6, No. 12, pp. 31-34
Bhat, Ramesh (2005), "Insurance Industry inIndia: Structure, Performance andFuture Challenges (Introduction)",Vikalpa, Vol. 30, No. 3
Bull, Trevor (2008), "Promise in The Face ofRepudiation- Insurance Claims", IRDAJournal, Vol. 6, No. 9, pp.13-15
Chandrasekharn, David (2008), "PolicyLapsation in Life Insurance-Role of TheMiddleman", IRDA Journal, Vol. 6, No.8, pp. 20-22
Gopalkrishan, G. (2008), "Conservation of LifeInsurance Business-Role ofMiddleman", IRDA Journal, Vol. 6, No.8, pp. 28-30
Imam, Ashraf (2011), "Analysing customerbehaviors in Life insurance industry",Asian Journal of Research in SocialSciences, Vol 1, Issue 1
Jain, S. K. (2007), "Towards Simpler ContractWording", IRDA Journal, Vol. 5, No. 3
James, P. (2008), "Planning for Risk Economy-Role of The Individual", IRDA Journal,Vol. 6, No. 1, pp. 10-13
Kaur, Gurupreet, (2010), "Emperical Study onDistribution Channels of Life Insurancein India,". Bimaquest, Vol. 9, No. 2
Marketing practices in Indian Life Insurance Industry A Study on Consumer Satisfaction

219
Kumar, Jagendra (2009), "Lapsation of LifeInsurance Policy", Bimaquest,Vol. 9,No. 2
Kutty, Shasidharan K. (2008), "Life InsuranceVision 2010", Bimaquest, Vol. 8, No. 2,pp. 1-10
Mallela, Rajsekhar, (2008), "Persisteny ofBusiness- The Fifth 'P'", IRDA Journal,Vol. 6, No. 8, No. 13-19
Mandal, Deepak (2010), "ULIPs See FewerPolicy Lapses, More Renewals",Financial Chronicle
Min, Le and Weagley, Robert O (2008), FactorsInfluencing Households' Demand forLife Insurance, A Thesis Presented To TheFaculty of the Graduate School at TheUniversity of Missouri- Columbia, inPartial Fulfillment of the Requirementsfor the Degree Master of Science.
Miremadi, A. Raee, R. and Ramezani A. (2011),"Exploring Innovative PromotionalStrategies in Life Insurance Companies(Case study of Iran)", IPEDR vol.10,International Conference on Socialityand Economics Development,Singapore
Mishra, Hari Govind (2006), "CustomerRelationship Management Practices inLife Insurance Practices in Life InsuranceCorporation of India", The Journal, Vol.26, Issue 2
Murty, G. (2007), "Insurance Literacy in India-A Critique", IRDA Journal, Vol. 5, No.6, pp. 21-24
Nagarjunarao, K. (2009), "InformationDisstoration- Hidden Practices atGround Level", IRDA Journal, Vol. 7,No. 11, pp. 24-26
Neelamegham, R., and V. Karthihaiselvi(2010), "Improving Managing Strategyof LIC Branch, Virudhanagar", TheJournal, Vol. 30, Issue 1
Nunnally, J. (1978), Psychometric Theory (NewYork: Tata Mc Graw-Hill)
Palande, P.S, Shah R.S. and Lunawat,M.L.(2007), Insurance in India ChangingPolicies and Emerging Opportunities,(Response Books, Sage publications ltd:New Delhi), pp 299-447(3).
Pati D.Y., Shinde, G. P. and Bhalerao K. (2011),"Journey of Insurance Sector In India:Since It's Inception", Golden ResearchThoughts, Vol.1, Issue. I, pp.1-4
Pravakar, G. (2007), "Life Insurance Contracts-Significance of Policy Conditions andPriviledges", IRDA Journal, Vol. 5, No.3, pp. 24-26
Pravakar, G. (2011), "Life Insurance in DecadeNext" Bimaquest, Vol. 11, No. 1
Rajagopalan, V. (2006), Lapsation of LifeInsurance Policie-Some CausativeFactors", IRDA Journal, Vol. 6, No. 8,pp. 8-12
Ramakrishna, V. (2007), "Plain English inInsurance- Need of the Hour", IRDAJournal Vol. 5, No. 3
Ramesh, D. (2006), "Retaining Life Policy-Distribution Ethics", IRDA Journal, Vol.4, No. 12, pp.18-19
Schaerer, M., Wanner, H. and Grinyer, C. (2011),"Transforming the Insurance Industryto Increase Customer Relevancer",Cisco White Paper, Cisco InternetBusiness Solutions Group
Sharma, Ravi K. (2012), "A Comparative Studyon Deliveries of Service on LifeInsurance Sector: India Vs. China",Research Journal of Social Science andManagement, Volume 01, Number 11
Sharma, Anuradha (2008), "Life InsuranceEvaluation- Current Perspective", IRDAJournal, Vol. 6, No. 4, pp. 22-25
Dr. Padmanava Mohapatra

220
Singh, H. and Lala, M. (2011), "An EmpiricalStudy of Life Insurance Product andServices inRural Areas", ZenithInternational Journal ofMultidisciplinary Research, Vol.1, Issue8
Shetty, Mayur (2014, June 28). India's rankingin world insurance market drops fourplaces, http://timesofindia.indiatimes.com/business/india-business/Indias-ranking-in-world-insurance-m a r k e t - d r o p s - f o u r - p l a c e s /articleshow/14464444.cms
Sud, Rajender (2012), "Trailblazers inDistribution-The Agency Channel",IRDA Journal, Vol. 10, No. 1, pp. 35-36
Swiss Re, (2014). Sigma 3/2014, IRDA AnnualReport, 2013-14
Tiwari, A. and Yadav, B. (2012), AnalyticalStudy on Indian Life Insurance Industryin Post Liberalization, InternationalJournal of Social Science Tomorrow Vol.1 No. 2
Marketing practices in Indian Life Insurance Industry A Study on Consumer Satisfaction

A COMPARATIVE STUDY OF SALESFORECASTING METHODS :
A CASE OF FINOLEX INDUSTRIES LTD.
*Asst. Professor, Marketing Trident Academy of Creative Technology, Email- [email protected]**H.O.D, P.G. Deptt. Of Commerce(DRS-II), Utkal University
Ms. Nilima Das*Dr. Maheswar Sahu**
INTRODUCTION
Sales Forecasting acts as the founding pillarfor the planning phase of any organization.Generally it seems quite simple but topredict accurately is always a huge task forthe managers as todays' consumers' havebecome more volatile and the supply chainhas become more dynamic. Recent studieshave also identified that effective andaccurate forecasting of sales hascontributed towards improvement insupply chain performance. Variousforecasting techniques are being adopted bythe researchers and practitioners to make iterror free and also new methods are alsoevolving up now-days like neural networkto forecast using non-linear data. It is alsovery well known that a single techniquecannot be useful in every situation, that'swhy different methods are being trialed toknow which method suits most in aparticular situation.
Objectives
To understand the various methods ofsales forecasting mostly for linear data.
To make a comparative analysis of thesemethods and to identify the best methodin this context.
Sales Forecasting Methods
Trend Analysis Method
Main idea of the method: a forecast iscalculated by inserting a time value into theregression equation. The regressionequation is determined from the time-serieasdata using the "least squares method" .
Trend analysis uses a technique called leastsquares to fit a trend line to a set of timeseries data and then project the line into thefuture for a forecast. Trend analysis is aspecial case of regression analysis wherethe dependent variable is the variable to beforecasted and the independent variable is
ABSTRACTThis paper compared the forecasting performance of several commonly used univariate forecastingtechniques for sales forecasting. For the experiment purpose Sales figure of Finolex industries weretaken. Comparison results showed that (1) Trend analysis and Moving Average methods are the bettertools compared to exponential smoothing technique. (2) RMSE and MAPE are the two tools taken formeasuring performance and it is found that RMSE is minimum in case of 3-period Moving Averagemethod and MAPE is minimum in case of trend analysis.
The Utkal Business ReviewDecember, 2015, Vol - XXIX, pp.-221-229

222
time. While moving average model limitsthe forecast to one period in the future, trendanalysis is a technique for making forecastsfurther than one period into the future.
The general equation for a trend line
F = a+bt
Where:F - forecast,t - time value,a - y intercept,b - slope of the line.
Moving Average Method
One of the easiest, most common time seriesforecasting techniques is that of the movingaverage. Moving average methods come inhandy if all you have is several consecutiveperiods of the variable (e.g., sales, newsavings accounts opened, workshopattendees, etc.) you're forecasting, and noother data to predict what the next period'svalue will be. Often, using the past fewmonths of sales to predict the comingmonth's sales is preferable to unaidedestimates. However, moving averagemethods can have serious forecasting errorsif applied carelessly. Essentially, movingaverages try to estimate the next period'svalue by averaging the value of the lastcouple of periods immediately prior. Thenumber of periods you use in your movingaverage forecasts are arbitrary; you may useonly two-periods, or three or four or sixperiods - whatever you desire - to generateyour forecasts. A moving average of orderk, MA(k) is the value of k consecutiveobservations.
K is the number of terms in the movingaverage.
The moving average model does not handletrend or seasonality very well although itcan do better than the total mean.
Exponential Smoothing
This method provides an exponentiallyweighted moving average of all previouslyobserved values. Appropriate for data withno predictable upward or downward trend.The aim is to estimate the current level anduse it as a forecast of future value. Generally,the exponential smoothing equation is
ttt FyF )1(1
Ft+1 = forecast for the next period. = smoothing constant. yt = observed value of series in period t. Ft = old forecast for period t.
The forecast Ft+1 is based on weighting themost recent observation yt with a weight andweighting the most recent forecast Ft with aweight of 1-. Exponential smoothingforecast is the old forecast plus anadjustment for the error that occurred in thelast forecast. The value of smoothingconstant must be between 0 and 1. cannotbe equal to 0 or 1. If stable predictions withsmoothed random variation is desired thena small value of is desire. If a rapidresponse to a real change in the pattern ofobservations is desired, a large value of isappropriate.
Research Methodology
This paper tries to analyze the performanceof various forecasting techniques takingFinolex Industries as the case study.Basically a descriptive design has beenadopted in this research. To make the studymore accurate sales data have been collected
A Comparative Study of Sales Forecasting Methods : A Case of Finolex Industries Ltd.

223
for a period of 9 years and then those dataare arranged on a quarterly basis. So salesdata are collected for 34 quarters spreadingover a horizon of 2006-2015. For betteranalysis net sales are taken into accountwhere inter-branch sales are excluded.
This study aims at analyzing theperformance of three sales forecastingtechniques i.e., (a) Trend Analysis, (b)Moving Average method and (c)Exponential Smoothing. To measure theperformance of individual method RMSEand MAPE has been adopted asperformance measurement tool.
Year Quarter Time Period ACTUAL SALES
(Rs. In Lakhs)
2007 I 1 32837.40
II 2 36642.76
III 3 47921.53
IV 4 50440.68
2008 I 5 48454.75
II 6 32763.14
III 7 46288.08
IV 8 42373.59
2009 I 9 35949.54
II 10 29308.55
III 11 45409.17
IV 12 48582.08
2010 I 13 53088.56
II 14 38053.66
III 15 58525.31
IV 16 69497.55
2011 I 17 47476.88
II 18 51985.39
III 19 62797.09
IV 20 59300.86
2012 I 21 51985.39
II 22 38447.82
III 23 61444.74
IV 24 62959.02
2013 I 25 56349.34
II 26 38991.05
III 27 65988.59
IV 28 83974.11
2014 I 29 66271.97
II 30 38585.89
III 31 64293.32
IV 32 78463.75
2015 I 33 63338.34
II 34 46674.00
Data Analysis
Data Set
Ms. Nilima Das & Dr. Maheswar Sahu
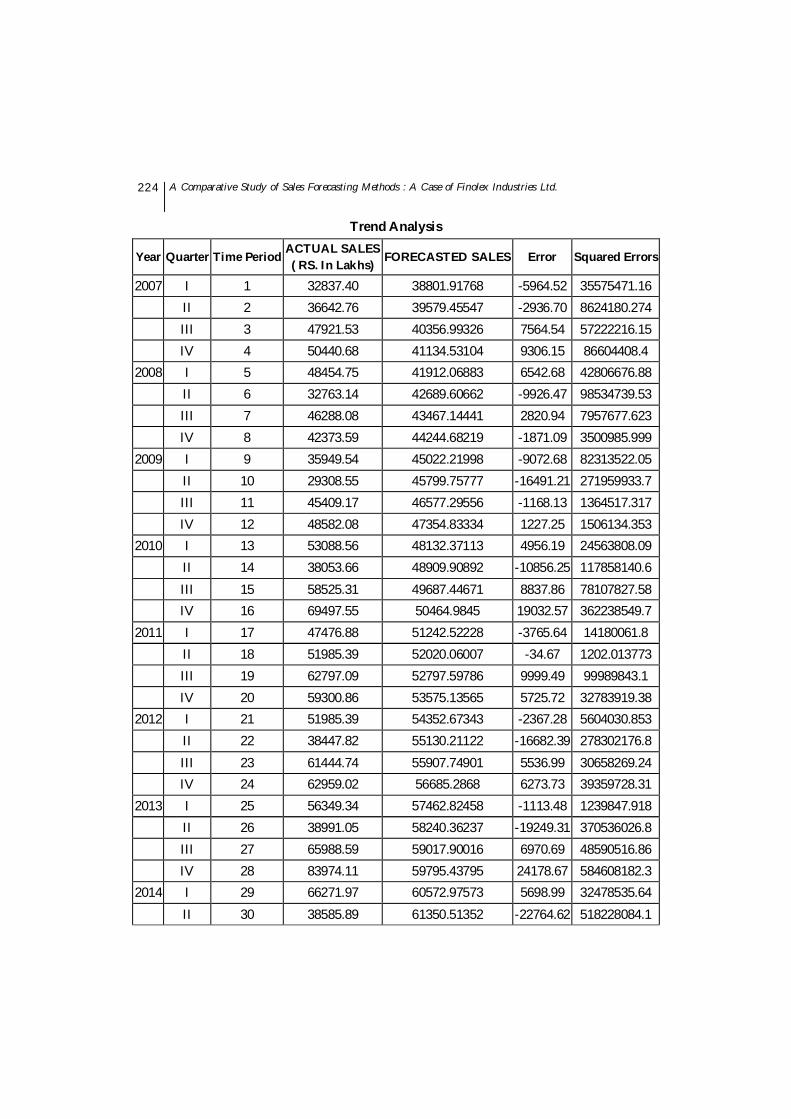
224
Trend Analysis
Year Quarter Time Period ACTUAL SALES ( RS. In Lakhs)
FORECASTED SALES Error Squared Errors
2007 I 1 32837.40 38801.91768 -5964.52 35575471.16
II 2 36642.76 39579.45547 -2936.70 8624180.274
III 3 47921.53 40356.99326 7564.54 57222216.15
IV 4 50440.68 41134.53104 9306.15 86604408.4
2008 I 5 48454.75 41912.06883 6542.68 42806676.88
II 6 32763.14 42689.60662 -9926.47 98534739.53
III 7 46288.08 43467.14441 2820.94 7957677.623
IV 8 42373.59 44244.68219 -1871.09 3500985.999
2009 I 9 35949.54 45022.21998 -9072.68 82313522.05
II 10 29308.55 45799.75777 -16491.21 271959933.7
III 11 45409.17 46577.29556 -1168.13 1364517.317
IV 12 48582.08 47354.83334 1227.25 1506134.353
2010 I 13 53088.56 48132.37113 4956.19 24563808.09
II 14 38053.66 48909.90892 -10856.25 117858140.6
III 15 58525.31 49687.44671 8837.86 78107827.58
IV 16 69497.55 50464.9845 19032.57 362238549.7
2011 I 17 47476.88 51242.52228 -3765.64 14180061.8
II 18 51985.39 52020.06007 -34.67 1202.013773
III 19 62797.09 52797.59786 9999.49 99989843.1
IV 20 59300.86 53575.13565 5725.72 32783919.38
2012 I 21 51985.39 54352.67343 -2367.28 5604030.853
II 22 38447.82 55130.21122 -16682.39 278302176.8
III 23 61444.74 55907.74901 5536.99 30658269.24
IV 24 62959.02 56685.2868 6273.73 39359728.31
2013 I 25 56349.34 57462.82458 -1113.48 1239847.918
II 26 38991.05 58240.36237 -19249.31 370536026.8
III 27 65988.59 59017.90016 6970.69 48590516.86
IV 28 83974.11 59795.43795 24178.67 584608182.3
2014 I 29 66271.97 60572.97573 5698.99 32478535.64
II 30 38585.89 61350.51352 -22764.62 518228084.1
A Comparative Study of Sales Forecasting Methods : A Case of Finolex Industries Ltd.

225
III 31 64293.32 62128.05131 2165.27 4688388.503
IV 32 78463.75 62905.5891 15558.16 242056370.7
2015 I 33 63338.34 63683.12688 -344.79 118877.9958
II 34 46674.00 64460.66467 -17786.66 316365440.2
SSE 3900528292
MSE 114721420.3
RMSE 10710.80858
Year Quarter Time Period NET SALES
( RS. In Lakhs) Forecasted Sales Error Squared Error
2007 I 1 32837.4 #N/A
II 2 36642.76 32837.4 3805.36 14480764.73
III 3 47921.53 35577.05141 12344.48 152386151.7
IV 4 50440.68 45122.58161 5318.098 28282170.51
2008 I 5 48454.75 48958.45259 -503.703 253716.3006
II 6 32763.14 48101.29694 -15338.2 235259058.4
III 7 46288.08 35384.52975 10903.55 118887408
IV 8 42373.59 43779.10332 -1405.51 1975467.701
2009 I 9 35949.54 42248.54855 -6299.01 39677508.68
Exponential Smoothing
Ms. Nilima Das & Dr. Maheswar Sahu

226
II 10 29308.55 36817.39674 -7508.85 56382779.32
III 11 45409.17 30468.75984 14940.41 223215855.8
IV 12 48582.08 42138.42554 6443.654 41520682.78
2010 I 13 53088.56 46902.42576 6186.134 38268256.83
II 14 38053.66 51416.21359 -13362.6 178557838.4
III 15 58525.31 40249.17619 18276.13 334017067
IV 16 69497.55 54496.68669 15000.86 225025900.1
2011 I 17 47476.88 65991.80488 -18514.9 342802443.5
II 18 51985.39 50567.6509 1417.739 2009984.156
III 19 62797.09 51232.71987 11564.37 133734656.4
IV 20 59300.86 60008.92374 -708.064 501354.2624
2012 I 21 51985.39 58885.76259 -6900.37 47615141.94
II 22 38447.82 52819.17407 -14371.4 206535817.8
III 23 61444.74 40832.08085 20612.66 424881717.2
IV 24 62959.02 56943.40394 6015.616 36187636.55
2013 I 25 56349.34 61227.62584 -4878.29 23797672.72
II 26 38991.05 56756.98096 -17765.9 315628303
III 27 65988.59 42017.69471 23970.9 574603820.9
IV 28 83974.11 60804.60763 23169.5 536825840.1
2014 I 29 66271.97 78776.11771 -12504.1 156353710.1
II 30 38585.89 68041.98383 -29456.1 867661463.5
III 31 64293.32 43845.87493 20447.45 418098010
IV 32 78463.75 59797.06742 18666.68 348445038.5
2015 I 33 63338.34 74175.66875 -10837.3 117447694.4
II 34 46674 64817.66896 -18143.7 329192723.4
SSE 6570513655
MSE 199106474.4
RMSE 14110.50936
alpha 0.190722877
A Comparative Study of Sales Forecasting Methods : A Case of Finolex Industries Ltd.

227
Year Quarter Time Period NET SALES (RS. In Lakhs)
Forecasted Sales Error Squared Error
2007 I 1 32837.4 #N/A II 2 36642.76 #N/A III 3 47921.53 39133.89667 8787.633333 77222499.6 IV 4 50440.68 45001.65667 5439.023333 29582974.82 2008 I 5 48454.75 48938.98667 -484.2366667 234485.1493 II 6 32763.14 43886.19 -11123.05 123722241.3 III 7 46288.08 42501.99 3786.09 14334477.49 IV 8 42373.59 40474.93667 1898.653333 3604884.48 2009 I 9 35949.54 41537.07 -5587.53 31220491.5 II 10 29308.55 35877.22667 -6568.676667 43147513.15 III 11 45409.17 36889.08667 8520.083333 72591820.01 IV 12 48582.08 41099.93333 7482.146667 55982518.74 2010 I 13 53088.56 49026.60333 4061.956667 16499491.96 II 14 38053.66 46574.76667 -8521.106667 72609258.82 III 15 58525.31 49889.17667 8636.133333 74582798.95 IV 16 69497.55 55358.84 14138.71 199903120.5
Moving Average
Ms. Nilima Das & Dr. Maheswar Sahu

228
2011 I 17 47476.88 58499.91333 -11023.03333 121507263.9 II 18 51985.39 56319.94 -4334.55 18788323.7 III 19 62797.09 54086.45333 8710.636667 75875191.14 IV 20 59300.86 58027.78 1273.08 1620732.686 2012 I 21 51985.39 58027.78 -6042.39 36510476.91 II 22 38447.82 49911.35667 -11463.53667 131412672.9 III 23 61444.74 50625.98333 10818.75667 117045495.8 IV 24 62959.02 54283.86 8675.16 75258401.03 2013 I 25 56349.34 60251.03333 -3901.693333 15223210.87 II 26 38991.05 52766.47 -13775.42 189762196.2 III 27 65988.59 53776.32667 12212.26333 149139375.7 IV 28 83974.11 62984.58333 20989.52667 440560229.7 2014 I 29 66271.97 72078.22333 -5806.253333 33712577.77 II 30 38585.89 62943.99 -24358.1 593317035.6 III 31 64293.32 56383.72667 7909.593333 62561666.7 IV 32 78463.75 60447.65333 18016.09667 324579739.1 2015 I 33 63338.34 68698.47 -5360.13 28730993.62 II 34 46674 62825.36333 -16151.36333 260866537.5 SSE 3491710697 MSE 109115959.3 RMSE 10445.85848
A Comparative Study of Sales Forecasting Methods : A Case of Finolex Industries Ltd.

229
Performance Measurement
To measure the performance of the methodsadopted in this paper we have taken RMSE(Root Mean-Squared Error) and MAPE(Mean Absolute Percentage Error) asperformance measuring tools. The resultsare cited in the below table.
Trend
Analysis Exponential Smoothing
Moving Average
RMSE 10710.80858 14110.50936 10445.85848
MAPE 17.7153401 23.9488921 17.82395
From the above table it is found that MovingAverage is the best method for theforecasting of sales if RMSE is themeasuring tool and if we will take MAPEas the measuring tool then Trend Analysisis the best method to be adopted.
CONCLUSION
This research aimed at the comparison ofperformance several commonly usedforecasting techniques for sales forecasting.Mostly the data are linear in nature and thepaper tries to identify the best suitablemethod for forecasting of sales of FinolexIndustries. This paper can be used as a basisfor forecasters, researchers and help themin selecting an appropriate model forforecasting.
There is a lot of scope for further research inthis area. As non-linearity is observed inthe data series, so methods like neuralnetwork can be a suitable choice forforecasting. Also other traditional methodsperformance can be compared by takingmore number of data points.
REFERENCESJ. B. Boulden, "Fitting the sales forecast to your
firm," Business Horizons, vol. 1, pp. 65-72, 1958.
E. Bayraktar, S. Koh, A. Gunasekaran, K. Sari,and E. Tatoglu, "The role of forecastingon bullwhip effect for E-SCMapplications," International Journal ofProduction Economics, vol. 113, pp. 193-204, 2008.
X. Zhao, J. Xie, and J. Leung, "The impact offorecasting model selection on the valueof information sharing in a supplychain," European Journal of OperationalResearch, vol. 142, pp. 321-344, 2002.
C. A. Witt and S. F. Witt, "ForecastingInternational Tourist Flows," Annals ofTourism Research, vol. 21, pp. 612-628,1994.
J. De Gooijer and R. Hyndman, "25 years oftime series forecasting," InternationalJournal of Forecasting, vol. 22, pp. 443-473, 2006.
R. Hyndman and A. Koehler, "Another look atmeasures of forecast accuracy,"International Journal of Forecasting,vol. 22, pp. 679-688, 2006.
WEBSITES[1] http://www.finolexwater.com/investors/
financials (Accessed on 3/1/2016)[2] http://www.ocl.ac/docs/HNC/Business/
Unit%206-%20trend_analysis.ppt(Accessedon 2/1/2016)
[3] h t t p : / / w w w . f a c u l t y . w i u . e d u / F -Dehkordi/DS-533/.../Moving-average-methods.ppt (Accessed on 10/1/2016)
Ms. Nilima Das & Dr. Maheswar Sahu

BUILDING AN INTERNAL MARKETING ONEMPLOYEE JOB SATISFACTION:
AN INVESTIGATION OF EMPLOYEES OFMANAGEMENT COLLEGES OF UNIVERSITIES,
BHUBANSWAR (ODISHA)
*Research scholar, Utkal University, Bhubaneswar, Odhisa**H.O.D. Utkal University, Bhubaneswar, Odhisa
Ms Prangya Paramita*Dr. (Prof) Maheswar Sahu**
INTRODUCTION
Internal marketing has defined as activities,actions and managerial directions anorganization implements in an attempt toencourage and generate employee otherstakeholder support for programmes andprocess needed to achieve organizationalgoals and objectives [Schlta, E.2004]. Themantra is satisfied employees can satisfiedcustomers'. Satisfied customers are moreloyal customers. And loyal customers are
more valuable customers in both the shortand long terms.
The internal marketing has been widelyused by academics in portraying anemphasis on viewing employees aspartners to an organization's efforts atachieving organizational success ratherthan as a cost [Doukakis, I. 2002]. Thisinternal market can be regarded as asegment that needs to be informed, educated,developed and motivated in order toachieve the organizational goals.
ABSTRACTInternal marketing is considered as a key ingredient to retain the employee and increase the productivity.This is also applicable at the university level. The objective of the study is to examine internal marketingrelationships and their influence on faculty attitudes and behaviors in universities. Here in this articlehighlights age as the benchmark for the faculty's behavior toward students. This paper is based onempirical work which establishes the relationship between internal marketing and employee satisfactionin universities in Odisha. It is mainly derived from literature that provides backbone for study. Aquestionnaire was designed to collect the data from different universities. The findings of researchshowed that training and development, promotion, superior and colleague relationship and recognitionand compensation have positive impact on employee satisfaction. The sample sizes of the customers are30 employees within the universities. The sample can be collected from Bhubanswar. The primary dataare analyzed by using the Chi-square analysis and percentage method. The finding of the researchwould help to faculties as well as student to enhancement their carriers.
Key Words : Internal marketing, employee satisfaction, Universities.
The Utkal Business ReviewDecember, 2015, Vol - XXIX, pp.-230-238

231
The rapid advancement, globalization andthe market oriented firms has made reformon universities activities. In developedcountries the universities are alreadyadopted principles of marketing. They havegiven emphasis both on internal andexternal services. It is important thatuniversities of the developing countriesrealize the value of behaving as marketoriented firms and focuses their synergieson achieving the same so as to be at par.
Dasgupta, Devashish (2011) explained thatinternal marketing aims at buildingemployee moral as well as setting qualitystandards to ensure that each and everyemployee plays a pivotal role. The successof internal marketing depends on creatingan atmosphere where in employees desireto deliver good services to the customers.Internal marketing encompassed allstakeholders like the organization, thesuppliers, the creditors, the financers, thechannel partners and all others involved inthe working of the organization. Thenumber of other factors which hasinfluence on the customer satisfaction likethe customer relations, quality control andemployee morale and other tangible benefitsare incentives during peak season andintangible moral such as support fromsupervisors, regular training and anenvironment.
Lamb and et al. (2012) services areperformances, so the quality of a firm'semployees is an important part of buildinglong term relationships with customers.Service first practice the internal marketingwhich means treating employees ascustomers and developing systems andbenefits that satisfy their needs.
The degree of interaction among thestudents and faculties are very high ineducational institutions as compare to otherservice industries. So satisfaction of thequality employees in universities isimportant element for investigation.Shabbir, J. and Salaria, R. (2014) prolongthat the higher education institutions arehighly interactive sectors where the degreeof interaction of employee and customer ishigh as compare to other service providingorganizations. Therefore, satisfaction andmotivation of the quality employee in highereducation is vital element for investigation.Communication and empowerment are alsoimportant because faculty in universitiesentered and phased of their careers wherethey have surpassed basic job needs andare motivated by other factors other thanfinancial motivations.
In higher education there are twodimension of interaction with their studentslike direct interaction with the faculties withthe students; another interaction includesinstitutions' management indirectinteraction with the students. In highereducation both the dimensions are longterm strategies orientations; therefore thecontribution of internal marketing withinthis level is vital.
In higher education sector to retain andsatisfied the external customer depends oncore internal customer like lecturer andprofessors. In higher education industrieswhen teachers are not motivated andsatisfied then quality of their services suffersand creates dissatisfaction among students(Zeithaml et.al.,1990). Therefore to improveuniversities working environment is requireimproving research and development toincrease teaching performance.
Ms Prangya Paramita & Dr. (Prof) Maheswar Sahu

232
When employee involved in decisionmaking they become a part of overallorganization and align their own objectiveswith organizational objectives.
This article is constructed in the followingways. First it provides theoreticalbackground to the main effects of internalmarketing initiatives on performance.Second it discussed about hypotheses forthe study. Next it gives the outline theempirical study used to test the hypotheses.Finally discuss the implications of ourfindings and some avenues for additionalresearch.
Objective of the study
1. To study the age of the employee andstudent satisfaction in universities
2. To find out the relationship between theage as variable on the satisfaction of theemployee with the internal marketingactors
3. To find out relationship between internalmarketing factors and employee jobsatisfaction.
Hypothesis
H1- Training and development has aninfluence on employee job satisfaction.
H2- Promotion has an influence onemployee job satisfaction.
H3- Superior and colleague support has aninfluence on employee job satisfaction
H4- Recognition and compensation hasinfluence on employee job satisfaction.
Research methodology
The methodology used for the collectingdata, selection of sample and analysis of
data is as followed;
Data collecting techniques : the presentstudy is based on two sourced of datacollection- primary and secondarysources
The secondary sources of data collectioninclude the review of literature andprevious studies it was collected fromlibrary. Apart from that the researcherhas collected articles and researchpapers from various journals,magazines and the e-journal.
The primary sources include the surveymethod employed for the collection ofthe primary data from the selectedsample respondents. The stratifiedrandom and convince sampling for datacollection is used.
Sample design
In the present study primary data have beenused to fulfill the objectives of the study.There is a set of structured questionnaireshave been used of collecting data. Thequestionnaires are distributed to theemployee directly and the filled inquestionnaires are collected. The samplesizes of the customers are 30 employeeswithin the universities. The sample can becollected from Bhubanswar. The data arecollected from Utkal University andBijupatnaik University of technology.
Questionnaire
The source for survey based in research is astructured closed ended questionnaire.
Tools of data analysis
The primary data are analyzed by using theChi-square analysis and percentagemethod.
Building an internal marketing on employee job satisfaction: An investigation of employees of...

233
Table -1
Table showing opinion of respondentstowards the age
Age Respondents Percentage 20-30 6 20 31-40 18 60 41-50 2 06.7
50 and above 4 13.3 Total 30 100
Interpretation
The above table indicated that:
20% of the respondents belong to the agegroup of 20-30
60% of the respondents belong to the agegroup of 31-40
6.7 % of the respondents belong to theage group of 41-50
13.3 % of the respondents belong to theage group of 50 and above.
Table-2
Table showing opinion of respondentstowards marital status
Marital Status Respondents Percentage Married 10 33.3 Single 20 66.67
Interpretation
From above table indicate followinginterpretation
33.3% of the respondents' married and66.67% unmarried.
Table-3
Table showing opinion of respondentstowards gender
Gender Respondents Percentage Female 14 46.7 Male 16 53.3
Interpretation
The above table indicated that 46.7% of therespondents are female and 53.3% of therespondents are male.
Table- 4
Table showing opinion of respondentstoward experience:
Experience Respondent Percentage < 1 0 0 1-5 10 33.3
6-10 12 40 11-15 2 6.6 16-20 2 6.7 21-25 2 6.7 25 < 2 6.7
Total 30 100
Interpretation
The above table indicates that
33.3 % faculties have 1 to 5 years ofexperience
40% respondents have 6 to 10 years ofexperience
6.7 % respondents have 16 to 25 years ofexperience
6.6% respondents have 11 to 15 years ofexperience.
Ms Prangya Paramita & Dr. (Prof) Maheswar Sahu

234
Table-5
Table showing of respondents towardsmonthly salary
Monthly salary Respondent Percentage <1 10 33.3 1-5 10 33.3 6-10 2 6.6
11-15 2 6.6 16-20 2 6.6 21-25 2 6.6 25< 2 6.6
Total 30 100
Interpretation
The above table reveals that :-
66.6% of the respondents feel that thegroup of less than 5 years
6.7% of the respondents belongs to thegroup of 6-19 years experience
26.7% of the respondents belongs to thegroup above 10 years experience.
Chi-square test
The Chi-square test is used to make compareobserved data with data would expect toobtain with specific hypothesis. It is usedbecause to measures how well the observeddistribution of data fits with the distributionthat is expected if the variables areindependent. In this study age is consideredas independent variable where as trainingand development, promotion, physicalfacilities, support from superior andcolleagues and monthly salary aredependent variable. The detail of the Chi-square study which has given below:
a) Chi-square test is conducted to extendthe relationship between training anddevelopment on job satisfaction
H0- There is no significant relation betweentraining and development atuniversities employees and age ofemployees.
H1- There is significant relation betweentraining and development atuniversities employees and age ofemployees.
Table -6
O E O-E (O-E)2 (O-E)2/E 6 6 O 0 0 18 13 5 10 0.76 2 3 -1 1 0.33 2 5 -3 6 1.5 2 3 -1 1 0.33 6 6 0 0 0 8 13 -5 10 0.76 4 3 1 1 0.33 8 5 3 6 1.5 4 3 1 1 0.33
TOTAL 5.84 Chi-square 5% for 4 d.f. = 9.48
Tabulated value of Chi-square for 4 degreeof freedom at 5 % level of significance is 9.48.Since calculated value of X2= 5.84. Herealternative hypothesis is rejected at 5 % levelof significance and Ho is accepted .So thereis no significant relation between trainingand development at universities employeesand age of employees.
b) Chi-square test is conducted to extendthe relationship between age of
Building an internal marketing on employee job satisfaction: An investigation of employees of...

235
employee and promotion policies ofuniversity
H0- there is no significant relationshipbetween the age of the employee ofuniversities and promotional policy
H1- there is significant relationshipbetween the age of the employee ofuniversities and promotional policy
Table- 7
O E O-E (O-E)2 (O-E)2/E 6 7 -1 1 0.14 18 13 5 25 1.92 2 3 -1 1 0.33 2 6 -4 16 2.66 2 1 1 1 1.00 8 7 1 1 0.14 8 13 -5 25 1.92 4 3 1 1 1.00 10 6 4 16 2.66 0 1 -1 1 1.00
Total 12.77 Chi-square 5% for 4 d.f. = 9.48
Since calculated value of Chi-square = 12.77is greater than the tabulated value , viz. 9.48,it is significant and null hypothesis isrejected at 5 %level of significance. Hence itis conclude that there is significancerelationship between age and promotion.
c) Chi-square test is conducted to extendthe relationship between age ofemployees and physical facilities ofuniversity
H0= There is no significant relationshipbetween the physical facilities at theuniversities and age of the employees.
H1= There is significant relationshipbetween the physical facilities at theuniversities and age of the employees.
Table-8
O E O-E (O-E)2 (O-E)2/ E 6 5 1 1 0.2 18 10 8 64 6.4 2 4 -2 4 0 2 5 -3 9 1.8 2 6 -4 16 2.6 4 5 -1 1 0.2 2 10 -8 16 1.6 6 4 2 4 0 8 5 3 9 1.8 10 6 4 16 2.6
TOTAL 17.2 Chi-square 5% for 4 d.f. = 9.48
Since calculated value of Chi-square = 17.2is greater than tabulated value = 9.48, it issignificance and null hypothesis is rejectedat 5% level of significance. Hence it isconclude that there is relationship betweenphysical facilities at the universities and ageof the employee.
d) Chi-square test is conducted to extendthe relationship between age ofemployees and support from superiorsand colleagues.
H0= there is no significant relationshipbetween the age of employees andsupport from superiors and colleagueon job satisfaction
H1= there is significant relationshipbetween the age of employees andsupport from superiors and colleagueon job satisfaction
Ms Prangya Paramita & Dr. (Prof) Maheswar Sahu

236
Table-9
O E O-E (O-E)2 (O-E)2/E 6 2.72 3.28 10.7 3.93 18 7.15 10.5 110.25 15.41 2 1.12 0.88 0.77 0.68 2 7.5 -5.5 30.25 4.03 2 11.59 -9.59 91.96 7.93 2 2.63 -0.63 0.39 0.14 0 6.92 -6.92 47.88 6.91 1 0.98 0.02 00 0 12 7.25 4.75 22.56 3.11 14 11.2 2.8 7.84 0.7 0 2.63 -2.63 6.91 2.62 3 6.92 -3.92 15.36 2.21 0 0.98 -0.98 0.96 0.97 8 7.25 0.75 0.56 0.07 18 11.2 6.8 46.24 4.12
TOTAL 52.83 Chi-square 5% for 6 d.f. = 12.59
Since calculated value of Chi-square = 52.83is greater than tabulated value which is12.59, it is significant that the nullhypothesis is rejected at 5% level ofsignificance. So it is conclude that there issignificant relationship between the age ofemployees and support from superiors andcolleague on job satisfaction
e) Chi-square test is conducted to find outthe relationship between employeemonthly salaries with compensationbenefit on job satisfaction.
H0= there is no significant relationshipbetween employee monthly salary withcompensation benefit on jobsatisfaction.
H1= there is significant relationshipbetween employee monthly salary with
compensation benefit on jobsatisfaction
Table - 10
O E O-E (O-E)2/E 10 9 1 1 10 5 5 25 6 6 0 0 2 8 -6 36 2 2 0 0 8 9 -1 1 0 5 -5 25 6 6 0 0 14 8 6 36 2 2 0 0
TOTAL 124
Chi-square 5% for 4 d.f .= 9.8
Since calculated value of Chi-square = 124is greater than tabulated value which is 9.8,it is significant that the null hypothesis isrejected at 5% level of significance. So it isconclude that there is significantrelationship between the age of employeesand support from superiors and colleagueon job satisfaction
CHI-SQUARE ANALYSIS
The analysis of the survey revealed thatthere is no relationship between trainingand development at universities and ageof the employees
The analysis of the survey revealed thatthere is significant relationship betweenage of the employee and promotion.
The analysis of the survey revealed thatthere is significant relationship betweenthe age of the employee and physicalfacilities.
Building an internal marketing on employee job satisfaction: An investigation of employees of...
237
The survey prolong that there issignificant relationship between the ageof the employee and support fromsuperior and colleague.
Finally the survey explained that thereis significant relationship between theemployee monthly salaries withcompensation benefit on job satisfaction.
CONCLUSION
The growth of strong internal relationshipconnects with organizations is an importantrole for successful faculties -collegerelations. By adopting relational approachto internal marketing is a meaningful wayin which organization as well as employeescan grow. In particularly to increasestudents strength and standard can possiblethrough faculties satisfaction. In this studythe age of the faculties is considered as aparameter to know about their satisfaction.It is found that training and developmentof universities the employees should givenemphasis because most of the employees aredissatisfied for this provision. The otherassociated strength of internal relations ispromotion, physical facilities while superiorand colleague relationship becomes a moreimportant determinant of faculty jobbehavior.
BIBLIOGRAPHYK.P.M.,Byju(2013), Internal marketing :
Employee does ,matter, Global journalof management and business studies,vol.- 3(5), pp.- 519-524.
Shabbir, J. & Salaria R.A.(2014) Impact ofinternal marketing on employee jobsatisfaction; An investigation of HigherEducation institutes of Pakistan,Journal of marketing management,Vol.- 2(2), pp.- 239-253.
Zamar, K., Javaid N.,Arshad A. & Bibi,S.(2012)Impact of Internal marketing on marketorientation and Business performance ,Vol. 3(12), pp.- 76-87.
Qayum, M.N. & Sahaf, M.A., (2013) Internalmarketing: A Pre-requisite foremployee satisfaction in Universities,International Journal of business andmanagement invention, Vol. - 2(5), pp.- 50-55.
Change, C.P.& Chang, Wei Chen (2008)Internal marketing practices andemployees' turnover intentions inTourism and leisure Hotels, Vol. -4(2),pp.- 161-172.
Sivesan. S., (2012) Service quality and customersatisfaction; A case study - Bankingsectors in Jaffna district, Sri Lanka,International journal of Marketing ,Financial services and managementresearch , Vol.- 1(10), pp.- 1-9.
Poor, E.R., Akhlaq, EM and Akhavan, M.R.(2013), Evaluate the effect of internalmarketing on employees' behavior(Case study: Guilan Private insurancecompanies), vol. 16(1),pp. -134-146.
Gilaninia, S., Shafiei B. & Shadab R.(2013) Theeffect of internal marketing onemployees' customer orientation insocial security organization of Gilan,International Journal of innovativeresearch in science, engineering andtechnology, vol.- 2(10), pp., 5848-5854.
Ahmad, N., Iqbal N. & Sheeraz, M.(2012) Theeffect of internal marketing onemployee retention in Pakistani Banks,Internation Journal of Academicresearch in Business and social science,Vol.- 2(8), pp.- 270-280.
Elsamen, A.A., & Alshurideh(2012)The impactof internal marketing on Internalservice quality: A Case study in aJordanian Pharmaceutical company,International Journal of Business and
Ms Prangya Paramita & Dr. (Prof) Maheswar Sahu
238
Management, vol.- 7(9), pp.-84-95.Bell, S.J., Menguc. B., Stefani S.L., When
customer disappoint: A model ofrelational internal marketing andcustomer complaints, Journal of theAcademy of marketing science, vol.-32(2), pp.-112-126.
Shabbir, J. and Salaria, R.A. (2014) "Impact oninternal marketing on employee jobsatisfactions: An Investigation of highereducation Institutions of Pakistan",Journal of Marketing Management,Vol.2,No-2, pp 239-53.
BOOKSDas gupta, Devashish(2011), Tourism
Marketing, published by DorlingKindersley (Indian) pvt. Ltd., pp-75.
Shankar, Ravi (2008), Service Marketing theIndian Perspective , published by ExcelBooks, New Delhi, pp- 73-76.
Lamb, C. W, Hair, J.F., Sharma, D. McDaniel C.(2012) MKTG a south- Asianperspective, published Cengageleaning, Delhi, pp-313
Zeithaml V. A., Bitner Mary Jo and GremlerDwayne (2008), Service Marketing , 4thedition, The Mcgraw Hill companies,New delhi.
Das gupta, Devashish(2011), TourismMarketing, published by DorlingKindersley (Indian) pvt. Ltd., pp-75.
Lamb, C. W, Hair, J.F., Sharma, D. McDanielC.(2012) MKTG a south- Asianperspective, published Cengageleaning, Delhi,pp-313.
WEB SITEwww.arpaperss.com/volumes/voLL6Issuel/
IJRRAS_16_1_15.pdfwww.indianresearchjournals.com
Building an internal marketing on employee job satisfaction: An investigation of employees of...

VILLAGE COMMUNICATION THROUGH USOFUNDING : A STUDY OF VPT BY BSNL IN
SUBARNAPUR DISTRICT, ODISHA
*Ph.D Scholar, Department of Commerce, Utkal University, Odisha
Mr. Pramod Kumar Pandia*
INTRODUCTION
The Telecommunication sector has aglorious history of more than 150 yearsstarting form invention of point to pointtelephony in 1853 to today' 4G cellularsystem. To serve the nation in its vastnessand diversity, modern telecommunicationfacilities to all the remote corners of thiscountry will be facilitated with special focuson underserved areas in North-Easternregion and backward states. Just asconstruction of National Highways broughtthe nation together, provision of high speedDigital Highway to connect the nation anddeliver Government services to every citizen
is the vision of the Department of Telecom.But at the same time the Government isconsistently focusing on Rural Telephonyto provide communication to the remotevillages through the different TelecomService Providers. In this direction BSNL(Bharat Sanchar Nigam Limited) has beenthe leader to provide village telephonesthrough different technology. BSNL, fullyowned by Government of India, formed inOctober 2000, provides telecom servicesacross the length and breadth of the countryexcluding Delhi and Mumbai. BSNL isproviding all types of telecom servicesnamely telephone services on landline,WLL and GSM mobile, Broadband, Internet,
ABSTRACTTelecommunication sector has a glorious history of more than 150 years starting form invention ofpoint to point telephony in 1853 to today' 4G cellular system. During the revolutionary changes it hasundergone, Indian Telecom sector has also accomplished the job of social responsibility by way ofproviding village communications through USO funding. Public payphones, such as traditionalpayphone booths, have been in use since the late 19th century. However, with growing telephoneownership, particularly of mobile telephones, demand for public payphones has experienced a declinein recent years, in both developed and developing countries. Despite this, provision of public payphonescontinues to be a part of universal service obligations in some South Asian countries. The present studyfocuses on the successful implementation of USO Funding in remote areas and underdeveloped districtlike Subarnapur in the state of Odisha. The study emphasizes the role of BSNL in accomplishing thesocial responsibility of providing VPTs in the District of Subrnapur. The findings shows that theperformance of VPTs are affected by differenent important factors like, malfunctioning, improperlocation of VPTs, attitude of the VPT agents etc. This work can through a light on the steps to be takenby the department to improve the performance of VPTs.
Key Words : USO Funding, VPTS, BSNL, Department of Telecom
The Utkal Business ReviewDecember, 2015, Vol - XXIX, pp.-239-249

240
leased circuits and long distance telecomservice. BSNL had a turnover of Rs 14125crore and incurred a loss of Rs 3786 croreduring the year 2014-15 (upto 30.09.2014).Rural telephony is one of its focus areas.BSNL also pays special emphasis ondevelopment of telecommunicationfacilities in North-Eastern region and intribal areas.
This task is accomplished by BSNL throughUSO (Universal Service Ubligation)Funding. The USO Fund was establishedin 2002 with the fundamental objective ofproviding access to 'Basic' telegraphservices to people in the rural and remoteareas at affordable and reasonable prices.Subsequently the scope was widened toprovide subsidy support for enablingaccess to all types of telegraph servicesincluding mobile services, broadbandconnectivity and creation of infrastructurelike OFC in rural and remote areas. As perthe Rules, the following services shall besupported by the Fund :
Stream-I: Public Telecom and InformationServices
The aim of the scheme is to providetelecommunication facility to publicthrough different technology.
Stream-II: Household telephones in ruraland remote areas
The scheme emphasizes on telecom facilityto every household in rural and inaccessibleremote areas.
Stream-III: Creation of infrastructure forMobile Services in rural and remote areas
The fund also takes care of creation ofinfrastructure like towers and BTSs to
provide mobile service to rural people andpeople residing in remote areas.
Stream-IV: Broadband connectivity tovillages in a phased manner
Stream-V: General infrastructure in ruraland remote areas for development of
Telecommunication facilities
Stream-VI: New technologicaldevelopments in the telecom sector in ruraland remote areas.
PRESENT STATUS
The number of telephones increased from933.02 million in the beginning of thefinancial year to 971.01 million at the endof December 2014.
Present Status of the TelecommunicationSector (as on December 31, 2014)
Indian telecom network is the secondlargest in the world after China.
The country has 971.01 milliontelephone connections, including 944.01million wireless telephone connections.
Overall tele-density in the country is77.59%.
Urban tele-density is 147.75%, whereasrural tele-density is 46.14%.
The share of wireless telephones in totaltelephones is 97.22%.
The share of private sector in totaltelephones is 89.15%.
Number of Broadband connections is85.74 million.
1.1 Objective of the Study
1. To study the village telephone service
Village Communication through USO Funding : A study of VPT by ...

241
provided by BSNL in the District ofSubarnapur in the state of Odisha
2. To evaluate the performance of villagetelephones provided through differenttechnology.
1.2 Importance of the Study: Coupled withother contextual factors, such asconsiderably higher poverty levels andlower standards of living compared withdeveloped countries, suchsocioeconomic differences imply thatpublic telephony may still, although toperhaps a lesser extent, play animportant role in connecting people-particularly among low-income earnersor the bottom of the pyramid (BoP)(Galperin & Mariscal, 2007; Zainudeen,Samarajiva & Abeysuriya, 2005).
i. Among telecom operators BSNL ishaving largest network and the onlyState owned Telecom service provider.Hence it is important to study the roleplayed by BSNL in providing ruralcommunication.
ii. Besides profit earning, every industryshould focuss on corporate socialresponsibility. As a telecom serviceprovider it is the duty of BSNL to giveemphasis on social reponsiblity,ofwhich providing village communicationis one of them.
iii. Subarnapur District in the state ofOdisha is not developed with regard tobasic infrastructure like communication.Hence to study the provision of villagePTs in the district of Subarnapur willdefinitely help Government to review itspolicy of providing VPTs.
1.3 Assumption of the Study: The followingassumptions are taken to carry out thestudy;
i. BSNL is only Telecom service providerproviding VPTs in the District ofSubarnapur.
ii. The villages covered in the study relymostly on VPTs for communications.
iii. They only use the voice communicationthrough the VPTs.
1.4 Evolution of VPTs: Public payphones,such as telephone booths, have been inuse since the late 19th century . Suchphones have long served as a usefulmode of communication, especially intimes of emergency, travel, or the absenceof household telephony. The ITU'sdefinition of public telephones includescoin and card-operated phones, as wellas public payphones in call offices andprivate places, as well as mobile publictelephones. All public telephones,regardless of capacity, are counted. (ITU-2010). Public telephone system emergedin the following order.
i. PCO: Generally provided to Post offices/Branch post offices through Over headwire or cable were gradually extendedto Gram Panchayat offices. Subsequentlyprovided to private agents with somecommissions. The PCOs on the basis oftheir media were divided as follows;
a. Long distance Over Head PTs(LDPT):They are provided through overheadwire made of cupper or Aluminum andwere working up to a distance of 40 KMsfrom the Exchange. These were workingtill 1990 when the MARR(Multi AccessRadio) were used to replace them.
Mr. Pramod Kumar Pandia
242
b. Local PCO: These are provided withinfive KMs from the Exchange through theCable and Drop wire or using overheadwires.
c. MARR PTs: This type of PublicTelephones were provided throughwireless media when it became difficultto maintain LDPTs. Initially a MARRsytem cater for 15 PTs through 02 Nos ofChannel. Subsequently they werereplaced by system catering 30 PTsthrough 04 channels.
ii. Village PTs: Government of Indiadecided in 2002 to provide PublicTelephones to all the villages as per 2001census data through USO funding andthere by the following type of PTs wereused besides the local PTs.
a. WLL: This is called wireless in localloof(WLL). This is a part of CDMA(CodeDivision Multile Access) system. Thistype of VPT is provided through awireless media.
b. DSPT: This is known as Digital SatellitePublic Telephone. This type of VPTs areprovided in remote, inaccessible areasand hilly areas. The telecom signal issent through satellites.
c. GSM: This is very recent in the VPThistory. It is provided through mobiletechnology. Though it is presently verypopular, but people are not muchbenefited due to the attitude of the VPTagent.
1.5 Current Challenges
While universal service policies are well-grounded in the government's goodwill toprovide equal access for all, installing and
maintaining public payphones,particularly STD payphone booths, remainscostly. Such modes of public telephonyincur high sunk costs in installation, as wellas in operation and maintenance, such ascollecting coins, fixing broken equipment,and upgrading phones on a regular basis.In Chile, where cost-efficient payphonesubsidy programs were successfullyimplemented, the average subsidy cost perpayphone was US$3,600 per payphone, orUS$10 per inhabitant served (Wellenius,2002). The cost is likely to be higher incountries where rural populations arehigher, or where subsidy programs areinefficiently managed. Despite high costs,however, some argue that the service can beprofitable when alternative means of accessare not available. For instance, Torero (2003)analyzed the willingness to pay for publictelephony among rural population groupsin Bangladesh and Peru, finding thatrespondents were willing to pay higher feesthan they were currently charged; thissuggests that a public payphone businesscan be profitable, even without the help ofsubsidy schemes. However, this study didnot take full account of growing competitionfrom mobile phones. With the rapid increasein mobile phone ownership levels, even inrural areas, a decline in demand for publicpayphones has forced many to downsizeoperations or close down altogether (Sey,2008; Stern, 2003). In India, new reportspublished as early as 2003 highlight India'sshrinking PCO industry, a result of mobileprice wars that pushed tariffs down to levelseven lower than those offered by PCOs(Kurup, 2008; Patnaik, 2003).
Village Communication through USO Funding : A study of VPT by ...

243
2.0 STUDY METHODOLOGY
The universe of the respondents have beendecided on the basis of villages visited bythe scholar randomly in different blocks ofSubarnapur District in the month ofJanuary'15. The study conceptualizes tofind out the performance of villagetelephones in Subarnapur District providedby BSNL through different technology. AStructured Questionnaire was framed andadministered in the format of Likert scale.It was used for data collection. The collecteddata have been duly edited, presentedthrough tables and graphs. On the basis offrequency observation the findings havebeen interpreted.
3.0 Data of Subarnapur District
Subarnapur is a newly formed RevenueDistrict formed in the year 1993 comprisingof two subdivisions and six nos of Tehsils.The district has a glorious history and isfamous for its Handlooms and Temples.Though very small in size its litracypercentage is 74% and main cultivation isRice and cereals. Hence communicationplays a very important role in marketing theproduce by the farmers. The administrativeset up of the district is depicted in thefollowing table.
Administrative setup of the District No. of Sub-Divisions : 2 No. of Tehsils : 6 No. of Municipalities/Corporation : 1 No. of N.A.Cs : 2 No. of Blocks : 6 No. of Police Stations : 9 No. of Gram Panchayats : 96 No. of Inhabited Villages : 829 No. of Uninhabited Villages : 130 No. of villages : 959
Source: http://www.ordistricts.nic.in/district_profile/dist_glance.php
3.1 Provision of Village PTs in Subarnapur Telecom District
The Nos of Village PTs provided in the district by BSNL through different technology isprovided in the following Table;
Technology Total Years
1985-1990 1990-1995 1995-2000 2000-2005 2005-2010 2010-2015 DSPT 22 0 0 0 0 22 0 GSM 34 0 0 0 0 32 2
LL 142 4 18 53 63 1 3 WLL 604 0 25 7 524 44 4 Total 802 4 43 60 587 99 9
Source: www.odisha.bsnl.co.in/balangir
Mr. Pramod Kumar Pandia

244
Provision of Village PTs in Subarnapur
0
100
200
300
400
500
600
700
800
900
1985-1990 1990-1995 1995-2000 2000-2005 2005-2010 2010-2015
Total Years
Source: USO Balangir Telecom District
DSPT
GSM
LL
WLL
Total
4.0 Data Analysis and Findings
4.1The distribution of VPTs visited according to geographic locations are given as follows.
Sl. No. Name of The Block No of VPT visited Working Status % of working VPTs 1 Sonepur 37 27 73 2 Tarva 25 15 60 3 Dunguripali 27 20 74 4 Binika 21 16 76 5 Birmaharajpur 24 11 46 6 Ullunda 16 7 44
Total 150 96 64
Village Communication through USO Funding : A study of VPT by ...

245
The distribution of VPTs visited and their working status are given below.
Technology Total Visit Working Status
Working Status Not working DSPT 9 3 6 GSM 24 18 6
LL 51 27 24
WLL 96 78 18
Total 150 96 54
Table Showing Distribution of Sample VPT Total Visi t
0%5%
13%
28%
54%
DSPT
GSM
LL
WLL
Graph of % of technology wise VPT Sample
Mr. Pramod Kumar Pandia
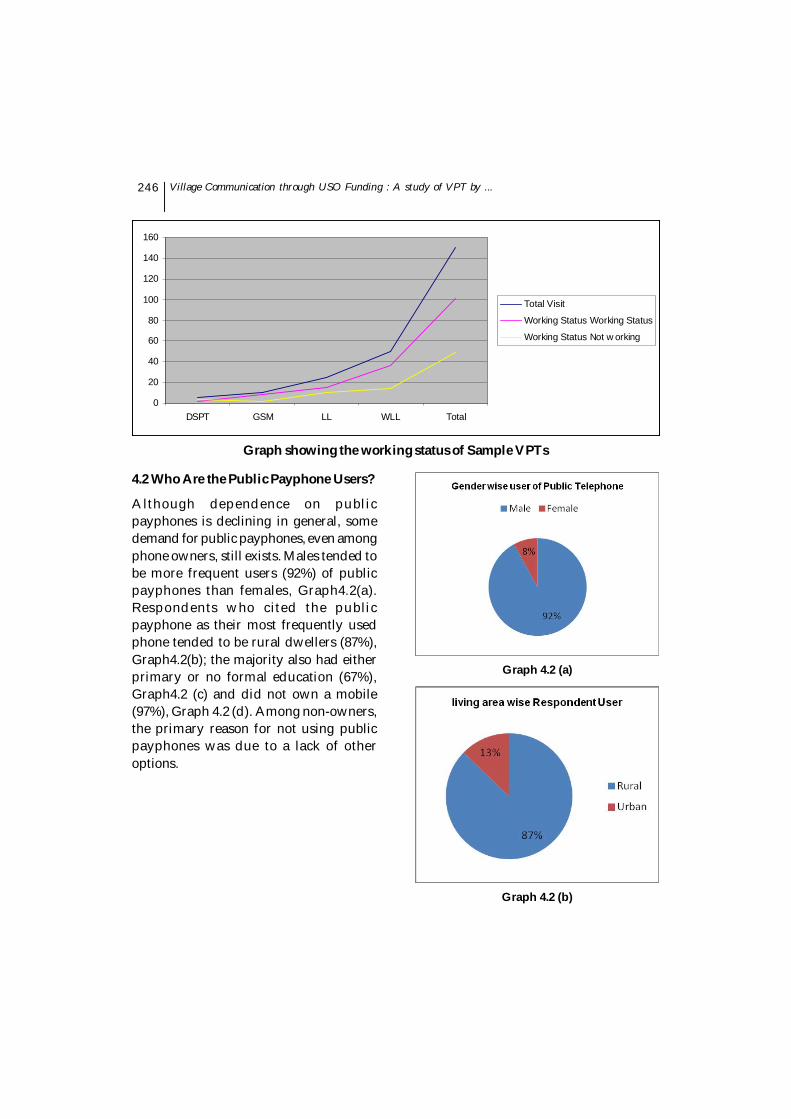
246
4.2 Who Are the Public Payphone Users?
Although dependence on publicpayphones is declining in general, somedemand for public payphones, even amongphone owners, still exists. Males tended tobe more frequent users (92%) of publicpayphones than females, Graph4.2(a).Respondents who cited the publicpayphone as their most frequently usedphone tended to be rural dwellers (87%),Graph4.2(b); the majority also had eitherprimary or no formal education (67%),Graph4.2 (c) and did not own a mobile(97%), Graph 4.2 (d). Among non-owners,the primary reason for not using publicpayphones was due to a lack of otheroptions.
0
20
40
60
80
100
120
140
160
DSPT GSM LL WLL Total
Total Visit
Working Status Working Status
Working Status Not w orking
Graph showing the working status of Sample VPTs
Graph 4.2 (a)
Graph 4.2 (b)
Village Communication through USO Funding : A study of VPT by ...
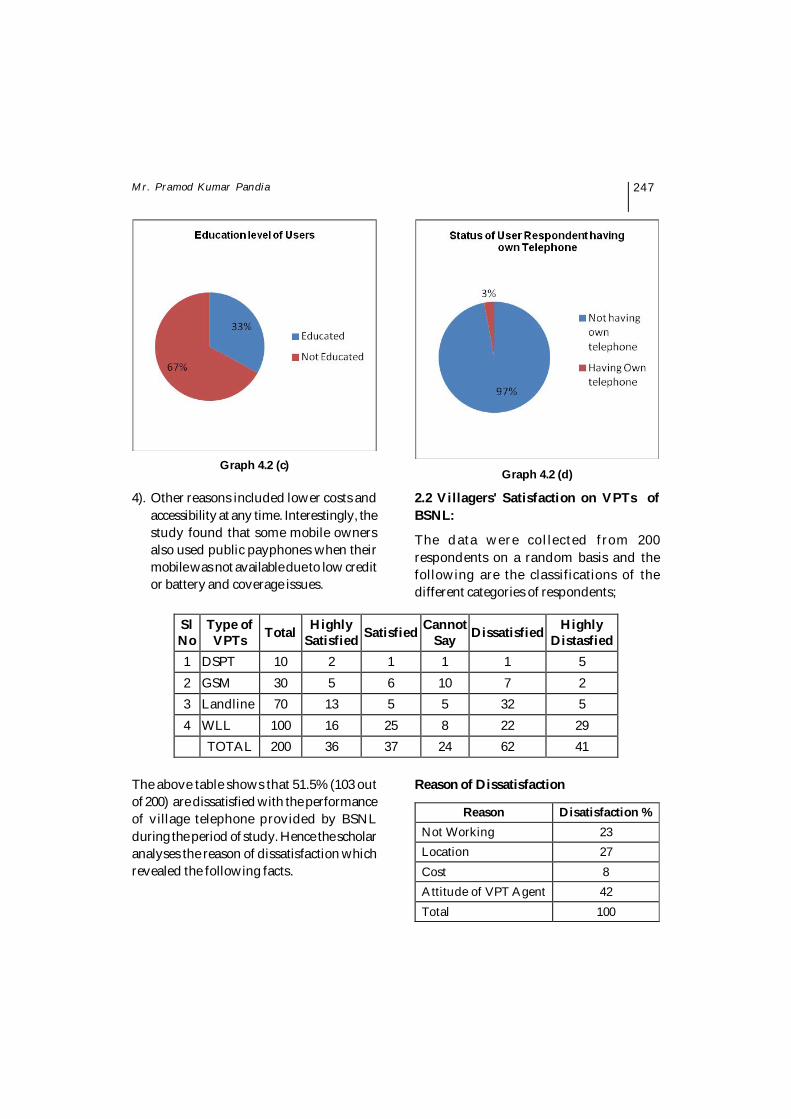
247
Graph 4.2 (c)Graph 4.2 (d)
Sl No
Type of VPTs Total Highly
Satisfied Satisfied Cannot Say Dissatisfied Highly
Distasfied 1 DSPT 10 2 1 1 1 5 2 GSM 30 5 6 10 7 2 3 Landline 70 13 5 5 32 5 4 WLL 100 16 25 8 22 29 TOTAL 200 36 37 24 62 41
4). Other reasons included lower costs andaccessibility at any time. Interestingly, thestudy found that some mobile ownersalso used public payphones when theirmobile was not available due to low creditor battery and coverage issues.
2.2 Villagers' Satisfaction on VPTs ofBSNL:
The data were collected from 200respondents on a random basis and thefollowing are the classifications of thedifferent categories of respondents;
The above table shows that 51.5% (103 outof 200) are dissatisfied with the performanceof village telephone provided by BSNLduring the period of study. Hence the scholaranalyses the reason of dissatisfaction whichrevealed the following facts.
Reason of Dissatisfaction
Reason Disatisfaction % Not Working 23 Location 27 Cost 8 Attitude of VPT Agent 42 Total 100
Mr. Pramod Kumar Pandia

248
The above data reveals that 42% peoplesare not satisfied with the performance ofVPTs due the attitude of VPT agents, 27%are not satisfied due to the to wrong locationof the VPTs i.e people cannot access to theVPTs, 23% are not satisfied because of themalfunctioning of the VPTs and though verysmall 8% of the users are not satisfied dueto the cost factor.
FINDINGS AND CONCLUSION
The present study comes out with amazingand most interesting results which can besummarized as follows;
Universal service obligation wasimplemented with the idea of providingcommunication to rural mass for whichGovt of India is funding the telcos to meetthe cost incurred by people making calls intheir emergency. BSNL being the stateowned company has been given the scopeof providing village communication in the
state of Odisha side by side getting anopportunity to accomplish its socialresponsibility. But the study reveals that thepurpose is not at all achieved due to poormaintenance, wrong selection of VPTagents, improper location of the VPTs andindifferent attitude of the VPT agent.
Hence BSNL should look into the abovefactors seriously and take necessary stepsto improve performance of VPTs
REFERENCESAnnual Report 2014-15 (Department of
Telecommunication)Galperin, H., & Mariscal, J. (2007).Mobile
telephony and poverty in Latin Americaand the Caribbean. DIRSI WorkingPaper. Retrievedfromhttp://www.eng.uwi .tt/depts/elec/ic/dirs i/REGIONAL_FINAL_english.pdf
International Telecommunication Union (ITU)Report, 2010
Disatisfaction %
23%
27%
8%
42% Not Working
Location
Cost
Attitude of VPT Agent
Village Communication through USO Funding : A study of VPT by ...

249
Kurup, R. S. (2008, February 11). Mobile pricewar may spell doom for PCOs. TheBusiness Standard. Retrieved fromhttp://www.business-standard .com/india/news/mobile-price-war-may-spell- doom-for-pcos/313252
Patnaik, I. (2003, July 16). Creative destruction.The Business Standard. Retrieved fromhttp://www .business-standard.com/india/news/creative-destruction/13674
Sey, A. (2008). Where did all the payphonesgo? Intermediaries, innovation andinsecurity in the mobile phone industry.Paper presented at the InternationalCommunication Association Pre-Conference on Mobile Communication,"The Global and GlobalizingDimensions of Mobile Communication:Developing or Developed?" Montreal,Canada
Stern, A. (2003). Demise of the payphoneindustry: Assessing the welfareimplications. (Senior Economic Thesis,Haverford College, 2003). Retrievedfrom http://triceratops. brynmawr.edu/ dspace/bitstream/10066/593/1/2003SternA.pdf
Torero, M. (2003). Willingness to pay for therural telephone service in Bangladeshand Peru. Information Economics andPolicy, 15(3), 327-361.Retrieved fromhttp://l inkinghub.elsevier .com/retrieve/pii/S0167624503000027
Wellenius, B. (2002). Closing the gap in accessto rural communication: Chile 1995-2002.Info,4(3), 29-41. doi: 10.1108/14636690210439998
Zainudeen, A., Samarajiva, R., & Abeysuriya,A.(2006).Telecom use on a shoestring:Strategic use of telecom services by thefinancially constrained in SouthAsia.WDR Dialogue Theme 3rd CycleDiscussion Paper, WDR0604, Version2.0. Available at SSRN:http://ssrn.com/abstract1554747
WEBSITES :1. www. bsnl.co.in2. www.orissa.bsnl.co.in3. www. dot.gov.india.in4. www. trai.gov.india.in5. www. ssrn.com6. www. google.co.in7. h tt p : //w w w. o rd i s tr i ct s . n i c . in /
district_profile/dist_glance.php
Mr. Pramod Kumar Pandia

MERGERS AND ACQUISITIONS IN INDIANBANKS AND ITS IMPACT ON PROFITABILITY: A
CASE STUDY OF ORIENTAL BANK OFCOMMERCE AND INDIAN OVERSEAS BANK
*Research Scholar , P.G. Department of Commerce, Utkal University, Bhubaneswar, Mobile- +91 9090871127,Email: [email protected]
Ganesh Prasad Panda*
INTRODUCTION
Banking is the backbone of any economy.In today's marketplace, banking industrieshave greatly expanded the scope andcomplexity of their activities and facing anever changing and dynamic regulatoryenvironment. It has been realized globallythat M&A is only way for gainingcompetitive advantage domestically andinternationally. The banks in India arelooking for strategic acquisitions withinIndia and abroad. Today, the bankingindustry is regarded among the rapidlygrowing industries in India. In the last twodecades, there has been a paradigm shift inbanking industries. A relatively newdimension in the Indian banking industry
is accelerated through M&A. In order toattain the economies of scale and also tocombat the cut throat competition,Consolidation has been a significantstrategic tool and has become a worldwidephenomenon. M&As have become abuzzword in the Indian banking sectorwhere generally the weaker banks are beingacquired by the healthier banks in order toconfess the global competition.
REVIEW OF LITERATURE
1. Goyal K.A. & Joshi Vijay (2011) in theirpaper entitled "Mergers in BankingIndustry of India: Some EmergingIssues" gave an overview on Indianbanking industry and highlighted thechanges occurred in the banking sector
ABSTRACTThe financial services industry particularly the banking industry plays a very pivotal role in theeconomic arena of any country. Indian banking industry has undergone a significant transformationdue to the impact of globalisation and deregulation. An important aspect of this process has beenconsolidation of commercial banks. This consolidation or merger and acquisition takes place when twoformerly independent banks become a single controlled entity. The motives may be to sustain in thecompetitive world, to increase profit or to strengthen the acquiring bank. This study analyses two banksi.e. Oriental Bank of Commerce with Global Trust Bank and Indian Overseas Bank with Bharat OverseasBank by focusing about the profitability of these two banks before and after the merger on the basis ofvarious ratios. Independent T-test has been used for testing the statistical significance.
Key Words : Banking, Globalisation, consolidation, profitability, T-test
The Utkal Business ReviewDecember, 2015, Vol - XXIX, pp.-250-259

251
after post liberalization.
2. Aharon David Y et al., (2010) analyzedthe stock market bubble effect on Mergerand Acquisitions and followed by thereduction of pre bubble and subsequent,the bursting of bubble seems to have ledto further consciousness by the investors.
3. Kemal Mohammad Usman (2011) findsthe post merger profitability of the RoyalBank of Scotland and from theaccounting ratio analysis it is provedthat RBS merger proves to be a failure inBanking Industry.
4. R Srivassan et al, (2009) gave the viewson financial implications and problemsoccurring in M&A highlighted the casefor consolidation and discussed thesynergy based merger whichemphasised that merger is for makinglarge size of firm but no guarantee tomaximise profitability on a sustainedbusiness and there is always a risk ofimproving performance after merger.
RESEARCH GAP:
It seems from the above review that variousstudies have been made on Merger andAcquisitions in the Indian BankingIndustry, but these studies provide mixedresult and not adequately explore the othervaried dimensions of M&As. The presentstudy would go to investigate the details ofM&As with greater focus on acquiring bankin the Indian Banking sector. This study willalso discuss the Pre merger and Post mergerperformance of acquiring banks.
OBJECTIVES OF THE STUDY :
1. To study the trends of Merger andacquisitions in Indian banking sector.
2. To study the profitability of acquiringbanks by comparing its pre and post M& A performance.
SCOPE OF THE STUDY :
The current study is confined to only 2banks which are merger of Global trust bankwith Oriential bank of commerce andanother one is merger of Bharat Overseasbank with Indian overseas bank. Thefinancial performance of these two bankshas been evaluated taking in toconsideration 3 years pre and post merger.
HYPOTHESIS :
1. H0 (Null Hypothesis) = There is nosignificance difference between the Premerger and Post merger Profitability.
2. H1 (Alternative Hypothesis) = There issignificance difference between the Premerger and Post merger Profitability.
RESEARCH METHODOLOGY:
DATA COLLECTION:
For the purpose of analyzing theprofitability of acquiring banks after Mergerand Acquisitions various financial andaccounting ratios are undertaken. Data ofoperating performance ratios for up to 3years prior and 3 years after the Merger andAcquisitions were collected from thefinancial statement of company's extractedfrom the website of money control.
METHODOLOGY:
With the help of Independent sample t-testthe pre merger spanning for 3 years andpost merger 3 years financial ratios havebeen compared. The t- distribution is asfollows:-
Ganesh Prasad Panda

252
The t- distribution formula is as follows:-
Where and
Where is the mean of pre merger ratios ofacquiring bank is the mean of postmerger ratios acquiring bank, n1 and n2 arethe number of observations of 1st and 2ndseries respectively. S is the combinedstandard deviation.
S=
RATIOS
Gross Profit Margin Ratio:Gross Profit / Sales X 100
Net Profit Margin Ratio:Net Profit / Sales X 100
Operating Profit Margin Ratio:Operating Profit / Sales X 100
Return on Capital Employed:Net Profit / Total Assets X 100
Return on Equity:Net Profit / Equity Capital X 100
THE INDIAN BANKING INDUSTRY:AN OVERVIEW
Commercial banks in India play a verycatalytic role in its economic development.It is a strong mechanism upon which oureconomy rests. Coming to its structure Indiabanking system has a wide mix- comprisingof public sector banks, private sector banks,foreign Banks, Exchange Banks, Post-OfficeSaving banks etc. At the top of the Indianbanking system is the central bank of Indiaknown as Reserve Bank of India .the Reservebank of India is responsible for the Indianbanking system since 1935. Table no.1provides a brief detail of the structure ofIndian commercial banks as on March 2016.
Table 1: Share in banking space
TYPE OF BANKS NO. OF BANKS
PUBLIC SECTOR BANKS 27
PVT. SECTOR BANKS 20
FOREIGN BANKS 41
REGIONAL RURAL BANKS 56
TOTAL 144
(Source: RBI website)
TRENDS OF MERGER OF BANKS ININDIA:
The financial services industry, particularlythe banking industry, has undergonesignificant transformation all over the worldsince the early 1980s under the impact oftechnological advances, deregulation andglobalisation. An important aspect of thisprocess has been consolidation as a largenumber of banks have been merged,amalgamated or restructured. The Indianbanking sector has not remained insulatedfrom the global forces driving M&As acrossthe countries. M&A activity in the Indianbanking sector is not something new as ittook place even before the independence.The Banking system of India started in 1770and the first Bank was the Indian Bankknown as the Bank of Hindustan. Later on,some more banks like the Bank of Bombay-
Mergers and Acquisitions in Indian Banks and its Impact on Profitability: A Case Study of ...

253
1840, the Bank of Madras-1843 and theBank of Calcutta-1840 were establishedunder the charter of British East IndiaCompany. These Banks were merged in 1921and took the form of a new bank known asthe Imperial Bank of India. For thedevelopment of banking facilities in therural areas the Imperial Bank of Indiapartially nationalized on 1 July 1955, andnamed as the State Bank of India. The Indianbanking sector can be divided into two eras,the pre liberalization era and the postliberalization era. In pre liberalization eragovernment of India nationalized 14 Bankson 19 July 1969 and later on 6 morecommercial Banks were nationalized on 15April 1980. In the year 1993 governmentmerged The New Bank of India and ThePunjab National Bank and this was the onlymerger between nationalized Banks, afterthat the numbers of nationalized Banksreduced from 20 to 19. Licenses mses wereissued to the private banks, which lead tothe growth of Indian Banking sector. Thesecond Narasimham Committee (1998) hadsuggested mergers among strong banks,both in the public and private sectors. Thefacts and figures of mergers in Indianbanking sector is as follows. During pre-nationalization period from 1961 to 1968,46 mergers have taken place, in thenationalized period from 1969 to 1992 thenumber of mergers were 13. During the postreform period i.e. starting from 1993 to 2006,21 mergers have taken place out which 13were forced mergers, 5 were voluntarymerger, 2 were convergence of financialinstitution in to bank and 1 was due otherregulatory compulsions. Very recently INGvysya bank acquired.
Reasons for Bank Merger:
1) Merger of weak banks: Practice of mergerof weak banks with strong banks wasgoing on in order to provide stability toweak banks but Narsimhan committeeopposed this practice. Mergers candiversify risk management.
2) Increase market competition: Innovationof new financial products andconsolidation of regional financialsystem are the reasons for merger.Markets developed and became morecompetitive and because of this marketshare of all individual firm reduced somergers and acquisition started.
3) Economies of scale: Capability ofgenerating economies of scale whenfirms are merged.
4) Skill & Talent: Transfer of skill takesplace between two organisation takesplace which helps them to improve andbecome more competitive.
5) Technology, New services and Products:Introduction of e- banking and somefinancial instruments / Derivatives.Removal of entry barrier opened the gatefor new banks with high technology andold banks can't compete with them sothey decide to merge.
6) Positive Synergies: When two firmsmerge their sole motive are to create apositive effect which is higher than thecombined effect of two individual firmsworking alone. Two aspects of it are costsynergy and revenue synergy.
Ganesh Prasad Panda
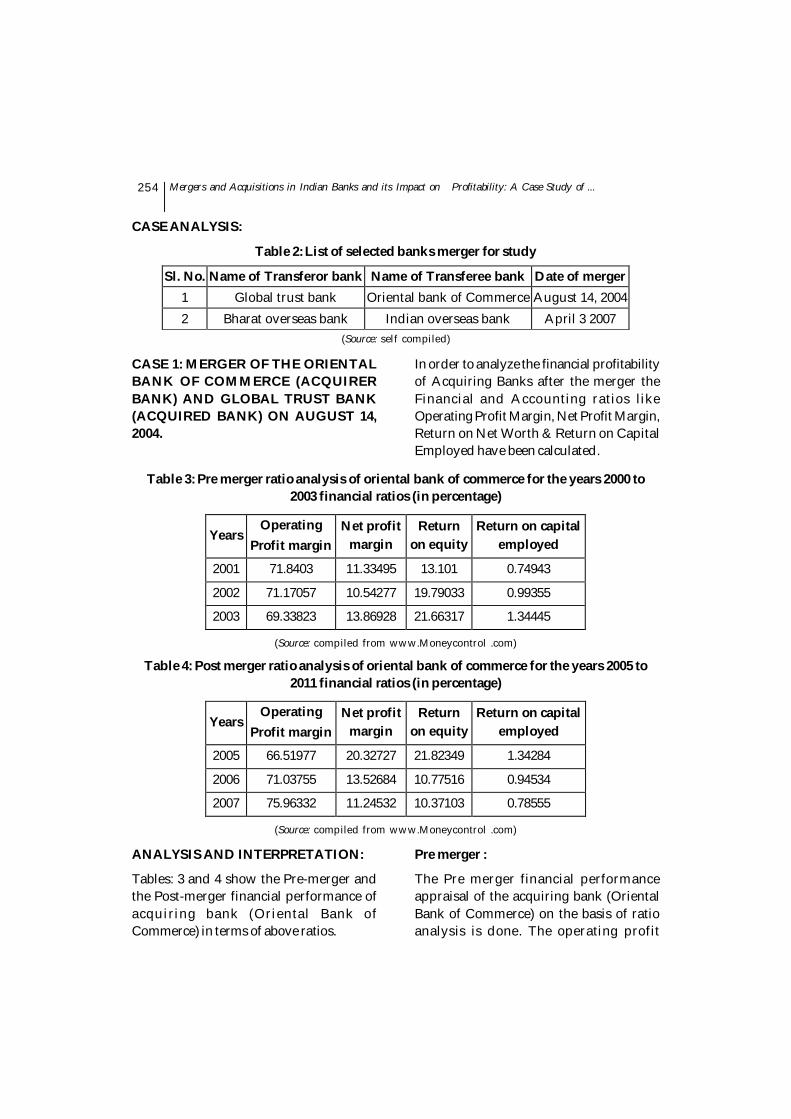
254
CASE 1: MERGER OF THE ORIENTALBANK OF COMMERCE (ACQUIRERBANK) AND GLOBAL TRUST BANK(ACQUIRED BANK) ON AUGUST 14,2004.
In order to analyze the financial profitabilityof Acquiring Banks after the merger theFinancial and Accounting ratios likeOperating Profit Margin, Net Profit Margin,Return on Net Worth & Return on CapitalEmployed have been calculated.
CASE ANALYSIS:
Table 2: List of selected banks merger for study
Sl. No. Name of Transferor bank Name of Transferee bank Date of merger 1 Global trust bank Oriental bank of Commerce August 14, 2004 2 Bharat overseas bank Indian overseas bank April 3 2007
(Source: self compiled)
Table 3: Pre merger ratio analysis of oriental bank of commerce for the years 2000 to2003 financial ratios (in percentage)
Years Operating
Profit margin Net profit
margin Return
on equity Return on capital
employed
2001 71.8403 11.33495 13.101 0.74943
2002 71.17057 10.54277 19.79033 0.99355
2003 69.33823 13.86928 21.66317 1.34445
(Source: compiled from www.Moneycontrol .com)
Table 4: Post merger ratio analysis of oriental bank of commerce for the years 2005 to2011 financial ratios (in percentage)
Years Operating
Profit margin Net profit
margin Return
on equity Return on capital
employed
2005 66.51977 20.32727 21.82349 1.34284
2006 71.03755 13.52684 10.77516 0.94534
2007 75.96332 11.24532 10.37103 0.78555
(Source: compiled from www.Moneycontrol .com)
ANALYSIS AND INTERPRETATION:
Tables: 3 and 4 show the Pre-merger andthe Post-merger financial performance ofacquiring bank (Oriental Bank ofCommerce) in terms of above ratios.
Pre merger :
The Pre merger financial performanceappraisal of the acquiring bank (OrientalBank of Commerce) on the basis of ratioanalysis is done. The operating profit
Mergers and Acquisitions in Indian Banks and its Impact on Profitability: A Case Study of ...

255
margin for the year 2001 was 71.8403percent. The net profit margin was 11.33495percent with Return on equity 13.101 &ROCE at 0.74943 percent. The operatingprofit margin decreased slightly at 71.17057percent in 2002 with net profit margin alsoshow a negative growth at 11.33495 percent.The Return on equity & ROCE signified apositive growth and reached at 19.79033and 0.99355 percent respectively. In 2003operating profit margin decreased to theextent of approx.2 percent which is69.33823. but all the other three profitabilityindicators i.e. net profit margin, return onequity and ROCE showed a very goodpositive growth and were at 13.86928,21.66317 and 1.34445 percent respectively.
Post-merger:
Post-merger performance appraisal of
acquiring bank (Oriental Bank ofCommerce) for the very next year declinedin terms of operating profit margin at66.51977 percent but the net profit marginamount at 20.32727 percent. The Return Onequity & ROCE remain unchanged at21.82349 and 1.34284 percent in the year2005. The operating profit margin hasimproved in the year 2006 with 71.03755percent however the net profit margin,Return On equity & ROCE reduced at13.52684, 10.77516 percent and 0.94534percent. The operating profit margin hasincreased in the year 2007 at 75.96332percent but the other ratios like net profitmargin & Return on equity remainunchanged except the return on capitalemployed show declined with 11.24532,10.37103 and 0.78555 percent. at 74.36245,8.71017, 9.48775 & 0.65256 percent.
Table 5: Mean and median of the pre merger and post merger ratios of acquiring bank(oriental bank of commerce)
MEAN
STANDARD DEVIATION
T VALUE
P VALUE
PRE POST PRE POST
OPERATING PROFIT MARGIN
70.7830 71.1735 1.2953 4.7232 -0.138 0.9023 (NS)
NET PROFIT MARGIN 11.9157 15.0331 1.7376 4.7246 -1.073 0.344 (NS)
RETURN ON EQUITY 18.1843 14.3232 4.5012 6.4986 0.846 0.445 (NS)
RETURN ON CAPITAL EMPLOYED
1.0291 1.0245 0.2991 0.2869 0.019 0.986 (NS)
(Source: Researcher's compilation based on tables 3 and 4, at 5% level of significance)
N.B. (NS) refers to not significant
Ganesh Prasad Panda

256
Table 5 shows T-test analysis of case I (theGlobal Trust Bank Ltd with the OrientalBank of Commerce). The analysis indicatesthat the mean of operating profit margin(70.7830 vs 71.1735) and t-value of -0.138which leads to the conclusion that there isimprovement in the Operating Profit Marginafter the Merger but not significantstatistically, the results also indicate thatthe mean of Net Profit Margin (11.9157vs15.0331) and t-value of -1.073 which showsthe performance in terms of net profit marginof oriental bank of commerce improved butnot significant statistically, it is found thatthere is increase in the mean of Return on
Equity (18.1843 vs 14.3232) and t-value0.846. It seems to have declined so it isconsidered that it is not affected by mergertherefore it is not significant statistically.The mean value of Return on CapitalEmployed (1.0291 vs 1.0245) and t-value0.019 which leads to the conclusion that theperformance of bank in terms of return oncapital employed has declined. so it is notsignificant statistically. So Here nullhypothesis (H0) is accepted.
CASE 2: MERGER OF THE INDIANOVERSEAS BANK (ACQUIRER BANK)AND BHARAT OVERSEAS BANK(ACQUIRED BANK) ON APRIL 3, 2007.
Table 6: Pre merger ratio analysis of Indian Overseas bank for the years 2004 to 2006financial ratios (in percentage).
Years Operating
Profit margin Net profit
margin Return
on equity Return on capital
employed
2004 58.7574 13.6586 94.1189 1.0836
2005 57.3971 16.4858 119.5595 1.2818
2006 58.9277 17.7778 143.7849 1.3197
(Source: compiled from www.Moneycontrol.com)
Table 7: Post merger ratio analysis of Indian Overseas bank for the years 2008 to 2010financial ratios (in percentage)
Years Operating
Profit margin Net profit
margin Return
on equity Return on capital
employed
2008 77.0069 15.0891 220.6938 1.1803
2009 73.9548 13.7510 243.3535 1.0950
2010 68.2796 6.9000 129.7650 0.5392
(Source: compiled from www.Moneycontrol .com)
Mergers and Acquisitions in Indian Banks and its Impact on Profitability: A Case Study of ...

257
ANALYSIS AND INTERPRETATION:
Tables: 6 and 7 show the Pre-merger andthe Post-merger financial performance ofacquiring bank (Indian Overseas bank ) interms of above ratios.
Pre merger: The Pre merger financialperformance appraisal of the acquiringbank (Indian Overseas bank) on the basisof ratio analysis is done. The operating profitmargin for the year 2004 was 58.7574percent. The net profit margin was 13.6586percent with Return on equity 94.1189 &ROCE at 1.0836 percent. The operating profitmargin decreased to 57.3971 percent in2005 with an increase in net profit marginto 16.4858 percent. The Return on equity &ROCE signified a positive growth andreached at 119.5595 and 1.2818 percentrespectively. In 2006 operating profitmargin again increased slightly to the extentof approx.1 percent which is 58.9277percent. Similarly all the other three
profitability indicators i.e. net profit margin,return on equity and ROCE signified apositive growth and were at 17.7778,143.7849 and 1.3197 percent respectively.
Post merger: Post-merger performanceappraisal of Indian Overseas bank for thevery next year increased in terms of operatingprofit margin at 77.0069 percent but the netprofit margin showed a negative trend of15.0891 percent. The Return On equity &ROCE also positively increased and reachedat 220.6938 and 0.5392 percent in the year2008. In 2009 the operating profit margin,net profit margin and ROCE decreased thanprevious year and stood at 73.9548, 13.7510,and 1.0950 respectively but only Return onequity increased to 243.3535. In the year 2010the operating profit margin again decreasedto 73.9548 percent. Beside that the other threeratios i.e. Net Profit Margin, Return on equityand ROCE show a negative growth anddecreased to 6.9000, 129.7650 and 0.5392respectively.
Table 8: Mean and median of the pre merger and post merger ratios of acquiring bank(Indian Overseas Bank)
MEAN STANDARD
DEVIATION
T VALUE
P VALUE PRE POST PRE POST
OPERATING PROFIT MARGIN 58.3607 73.0804 0.8389 4.4289 -5.656 0.005*
NET PROFIT MARGIN 15.9740 11.9133 2.1067 4.3929 1.444 0.222
RETURN ON EQUITY 119.1544 197.9374 24.8355 60.1163 -2.098 0.104*
RETURN ON CAPITAL EMPLOYED
1.2283 0.9382 0.1268 0.3481 1.356 0.247
(Source: Researcher's compilation based on tables 3 and 4, at 5% level of significance)
N.B. * refers to significant at 5 % significance level.
Ganesh Prasad Panda
258
Table 8 shows T-test analysis of case II(Bharat overseas bank with IndianOverseas bank). The analysis shows thatthat the mean of operating profit margin(58.3607 vs.73.0804) and t-value of -5.656which leads to the conclusion that there isimprovement in the Operating Profit Marginafter the Merger and it is significant at 5%significant level statistically, the results alsoindicate that the mean of Net Profit Margin(15.9740 Vs. 11.9133) and t-value of -1.444which shows the performance in terms ofnet profit margin of Indian Overseas Bankdeclined and so it is not significantstatistically. It is found that there is increasein the mean of Return on Equity (119.1544vs.197.9374) and t-value is -2.098. It seemsto have increased and it is considered thatit is significantly affected by mergertherefore it is significant statistically at 5 %significance level. The mean value of Returnon Capital Employed (1.2283 vs. 0.9382) andt-value 1.356 which leads to the conclusionthat the performance of bank in terms ofreturn on capital employed has declined.So it is not significant statistically. finallyexcept two ratios others are not statisticallyinsignificant So Here we can say nullhypothesis (H0) is also accepted.
MAJOR FINDINGS:
From these two cases it is found that;
In case of Oriental bank of Commerce;
i) Before merger, operating profit wasshowing a negative trend but aftermerger it was increasing but it is notstatistically significant.
ii) The net profit margin was stilldecreasing after merger of GTB.
iii) Return on Equity was increasing before
merger but after merger of GTB, it showa decreasing trend.
iv) ROCE is relatively constant and somewhat it was showing a decreasing trend.
In case of Indian Overseas Bank;
v) Operating profit in three years wasapproximately same but after merger ofBharat Overseas Bank it increased in theimmediate next year but show adeclining trend in the subsequent years.But the overall increment was positiveand significant statistically.
vi) Net profit margin was increasing beforemerger but declined after merger.
vii) Return on Equity has shown asignificant increase after merger ofBharat overseas bank.
viii) ROCE has shown approximatelyconstant year to year since it has notsignificantly changed.
ix) The profitability of both acquiring bankshas not improved after the merger,therefore Null Hypothesis is acceptedand Alternative Hypothesis is rejected.The results say that though Merger ishelpful for expansion and growth butno guarantee for improving theprofitability of acquiring banks.
SUGGESTIONS:
1) Banks should work towards a synergybased merger plan with minimisation oftechnology-related expenditure.
2) Banks should remember that merger orlarge size is just a facilitator, but noguarantee that profitability will beincreased.
Mergers and Acquisitions in Indian Banks and its Impact on Profitability: A Case Study of ...

259
3) Importance should be given onimproving risk managementcapabilities, corporate governance andstrategic business planning.
4) The Government should not go forM&As as a means of bailing out of weakbanks. The strong banks should not bemerged with weak banks, as it will haveadverse affect upon the asset quality ofthe stronger banks.
5) The strong banks should be merged withstrong banks to compete with foreignbanks and to enter in the global financialmarket.
CONCLUSION
Merger is the useful tool for growth andexpansion in Indian Banking Sector. It ishelpful for survival of weak banks bymerging into larger bank. This study showsthat impact of merger on financialperformance of Indian Banking sector. It isclear from the analysis that the onlyhypothesis set for the validation has beenaccepted. Both the acquiring banks(Oriental Bank of Commerce & IndianOverseas Bank) have not created positivedifference after the merger in terms ofprofitability. For comparing the accountingratios like, Operating Profit Margin, NetProfit Margin, Return on Net worth etc ofthe Pre and Post merger the t-test is applied.After the merger we see that the variousfinancial parameters of the bankperformance have not improved in bothcases, the profits are not visible but it maybe possible that improved performance ofmerged Bank will show in subsequentyears. The size of the bank may increase butno guarantee to increase net profitabilityafter merger.
REFERENCESAnsari,Muhammd Sadiq (2007) " An Empirical
Investigation of Cost Efficiency in theBanking Sector of Pakistan," SBPResearch Bulletin , 3(2)
Agarwal, Shyamji (2000) Mergers andAcquisitions of Commercial Banks inIndian context, IBA Bulletin, p.22
Bryson, j. (2003). Managing hrm risk in amerger. Employee relations, 25(1), 14-30.
Cascio, w. F. (2010). Done deal: now managepost-merger integration. Hr magazine,55(10), 42- 46.
Goyal, K. A. and Joshi, V. (211). Mergers inBanking Industry of India: SomeEmerging Issues. Asian Journal ofBusiness and Management Sciences,1(2), 157-165.
Khan, azeem ahmad(2012), post-mergerfinancial performance appraisal ofacquiring banks in india: a caseanalysis, volume no. 3 issue no. 7 (july)
Loderer, C. and Martin K, (1992): "Post-Acquisition Performance of AcquiringFirms?, Financial Management, Vol 21,No 3, pp 69-79.
Meena,smita. Kumar,pushpender.(2014)mergers and acquisitions prospects:indian banks study, internationaljournal of recent research in commerceeconomics and management (ijrrcem)vol. 1, issue 3, pp: (10-17), month:October.
P. M. Healy, k.g. Palepu, and r. S. Ruback,(1992): "does corporate performanceimprove after mergers??, journal offinancial economics, vol 31, pp 135- 175
Surjit Kaur (2002): PhD Thesis Abstract, "Astudy of corporate takeovers in India?,submitted to University of Delhi, pp 1-11.
Ganesh Prasad Panda

SKILL DEVELOPMENT IN BUSINESSEDUCATION- A NEED BASED CHALLENGE
*Research Scholar, Dept. of Commerce, Utkal University, Bhubaneswar -4,Mob: 09437151202; Mail id:[email protected]**Reader, P. G. Dept. of Commerce, Utkal University, Bhubaneswar -751004
Prabir Kumar Mohapatra*Dr. Prabodha Kumar Hota**
INTRODUCTION
"Live as if you were to die tomorrow.Learn as if you were to live forever."-
Mahatma Gandhi"Education is more important but skill is
most important!!"
India is at the edge of becoming the world'smost populous country with its populationestimated to increase to 1.45 billion by 2028,surpassing that of China. While many arguethat most of India's challenges arise due to
its large population base, the flipside is thatmore than 60% of its current population isin the age group of 15 to 59 years; whichmakes India home to the largest employablemanpower base. The demographic dividendindicates a tremendous supply of theworking age population. However, the realquestion for India's business houses andthe government is: "Is this manpower reallyskilled to be employable?" In order to steerIndia towards higher economic growth, ithas become imperative to utilise this
ABSTRACTThe impact of Skill in present business context is very much influential. India is witnessing as a youthbase country in the world as its majority population belongs to the age group of below 35 years. Insteadof depending on the jobs, country should try to create the jobs by empowering the youth to be anentrepreneur. Despite the main focus on education and training, there is heavy shortage of skilledmanpower which is the needs and demands of the present economy. We should adopt some steps toprotect the youth mass from unemployment crisis by empowering them through Re-Skill (mean teachnew skills to a person, especially an unemployed person) and Up-skill (teach an employee the additionalskills and New skill). Government of India has adopted Skill Development as a national priority overthe next 10 years. The Government of India has taken up some steps to gear up the skill based trainingto enhance the entrepreneurship ability in the youth mass of the country. Skills and knowledgemanagement are the driving forces of economic growth and social development in developing economies.Persons with appropriate, adequate and better skills adjust more effectively to face emerging challengesand seize work opportunities for better development. Skill development initiative focusing on specificneeds of rural youths is the key to help them self-employed or make them employable or promisingentrepreneurs in the changing socio-economic scenario. Finally, Skill development is the need of thehour for the development of the economy.
Key Words : Skill Development, National Policy, Skill Parameter, Entrepreneurship
The Utkal Business ReviewDecember, 2015, Vol - XXIX, pp.-260-271

261
demographic dividend through skilldevelopment and increasing employability.
2. STATEMENT OF PROBLEMS
During the last few years Technical andVocational Sectors have witnessed a rapidadvancement throughout India.Availability of quality employment orientededucation ensures an increase in theworking capability, productivity andemployability of the people of the country.Education and Training are both strategicnecessities that deliver employmentenhancing skills, in turn increasingproductivity and accelerating the future ofeconomic growth of India.
The Planning Commission of India hasestimated that around 500 million skilledpersons are required by 2022while thecurrent capacity of the skill developmentprogram is 3.1 million. Considering issueslike population growth, unplanned rural-urban migration causing urban poverty,high school dropout rates, India is likely towitness a deficit of 5.25 million employablegraduates and vocationally trainedworkforce in next few years. In a few states,it has been observed that the economicprogress of the state is directly related to thedevelopment of Technical and VocationalEducation System. Those states, where goodprogress has been made in the field of skilldevelopment, have attracted higher PrivateInvestments as well.
The available of white collar jobs areinadequate to absorb our youths aftergraduation/ higher study from colleges,which leads to increase in the rate ofunemployment in the country. The massunemployment situation has led to seriesof crimes. India is witnessing as a youth
base country in the world as its majoritypopulation belongs to the age group ofbelow 35 years. Instead of depending on thejobs, country should try to create the jobs byempowering the youth to be anentrepreneur.
Inspite of existence of large working youthgroup, we are unable to mobilise them intoproductive ways due to shortage of skillsbased education. India spends only 3.3 %of its GDP on education compared to anaverage 5.8 % in developed countries. Thelarge number of Indian youth is movingtowards overseas study due to lack ofstandard institution which can provideneed based education. The number of Indianstudents is going overseas to study risingday by day. One of the main reasondepression or stress in today's youth is, theyare not able to recognise their talents andpassion and end up doing jobs they are notmade for.
In the opinion of the several national levelindustrial organisations, the man-powercurrently being trained by the Technical /Non-Technical Educational Institutions isnot as per the demand of the market andindustry. Although there has been a sharpincrease in the technical educationalinstitutions offering graduate and post-graduate level courses in various states, thenumber of institutions, the number ofcourses, availability of seats and intakecapacity has not increased in the sameproportion.
3. BACKGROUND OF THE STUDY
Skills and knowledge are the driving forcesof economicgrowth and social developmentfor a nation. Countrieswith higher andbetter levels of education and skills aremore
Prabir Kumar Mohapatra & Dr. Prabodha Kumar Hota

262
likely to adjust effectively to the challengesandopportunities of the world. In recentyears, India has gradually emerging as aknowledge-based economy due to theexistence of capable and qualified humancapital. India has a created a special imagein the world market due to the immenseopportunities to establish its distinctiveposition in the world. However, Indiashould develop and empower the humancapital to ensure its global competiveness.Despite the main focus on education andtraining, there is heavy shortage of skilledmanpower which is the needs and demandsof the present economy.
The need to equip the workforce withtechnical capabilities and varied skills,consistent with the demands of the industryhas been recognised by the PlanningCommission also. The Eleventh Five YearPlan laid out the framework to movetowards a sustainable long-term skillsdevelopment initiative. The National SkillDevelopment Policy (NSDP) announced in2009attempts to address the skillsmismatch in the economy from the largerperspective of the vision of 'inclusivegrowth'. Under this policy, the governmenthaving recognised that skill developmentwill play a vital role in transforming Indiainto an economic super power in the futurehas set a target of skilling 500 millionpeople by 2022. To complement theachievement of this ambitious target, it hasto be ensured that there is correspondingcreation of employment opportunitiesforthe youth, to enable them to participateand contribute to the growth. While theeconomy may be on a steady track of growth,data on social indicators indicate widedisparities and inequalities across the
country. Further, the Twelfth Five Year Plangoals of "faster, more inclusive andenvironmentally sustainable growth", alsoindicates that skill development in India iscritical for both the growth, on the one handand for providing decent employmentopportunities to the growing youngpopulation, on the other hand.
If our education system is effective, thenthere is question arising that 'Does thecurriculum allows a student to find hispassion in his study time? And 'Does theeducation is able to provide the humancapital as per need based requirement inthe industry? We should impact theknowledge on Life Management Skill,which will deal to enhance his inner andouter personality. So the main reasonbehind this is the ineffective educationalpolicy in higher education and skill basedtraining and vocational education to caterthe employability. We should adopt somesteps to protect the youth mass fromunemployment crisis by empowering themthrough Re-Skill (mean teach new skills toa person, especially an unemployedperson) and Up-skill (teach an employee theadditional skills and New skill.
At present, the Indian Government is takinginitiatives to achieve and empower thepresent youth mass through Highereducation and vocational education andskill training through dedicated agencies.Government has also created anindependent ministry as "Ministry of SkillDevelopment & Entrepreneurship" in thegovernment. National Policy on Skills (2009)is exist with an objective to expand onoutreach, equity and access to educationand training, which it has aimed to fulfill
Skill development in Business Education - A Need Based Challenge

263
by establishing several industrial traininginstitutes (ITIs), vocational schools,technical schools, polytechnics, sector-specific skill development, training for self-employment and etc.. In addition, the privatesector has also recognized the importanceof skill development and has begunfacilitating the same. Economic growth canbe enhanced by creating a sizeable numberof jobs, which should be skill based.
4. OBJECTIVES
1. To examine the skill expected frombusiness education and presentinstitutional support to enhance skillsamong business students.
2. To develop a strategy for skillsdevelopment by matching today'scapabilities and tomorrow's skillsneeds.
5. SKILL DEVELOPMENT- ALITERARY OVERVIEW
Venetia Saunders and Katherine Zuzel(2010) in their study they found a strongcorrelation between employer and graduatestudent perceptions of the relative prioritiesamongst employability skills.
Yorke (2006), this study shows that beyondthe subject knowledge in higherqualification, the employer expects studentsto have well developed skills, so that theycan make some contribution to theworkplace when recruited.
An OECD report on Skills DevelopmentPathways in Asiaalso finds that developingcountries like India in Asia commonly facea lack of skills development in SMEs,especially internal training. Thisphenomenon has not been effectively
addressed in donor partnerships either. Thereport advocates the development of localskills ecosystems that bind organizations,institutions and firms in a certain local areaor labor market in area-based partnershipsfor training and skills development. Thereare many advantages in putting moreemphasis on devolving more responsibilityand resources for partnership developmentto the local level. The one hand, the scale ofinvestments for skills development in theinformal sector needs to match the need ofthe sector. On the other hand, innovativeand alternative routes to traditional trainingare also required.
The 2012 Global Monitoring Report onEducation says that, 'People needfoundation skills to stand a chance of gettingjobs thatpay decent wages and becoming aproductive force in the economy'. It arguesthat these skills are best acquired throughformal education and policies and practicesshould encourage young people to staylonger in formal education. Foundationskills usually refer to language literacy andnumeracy.
In developing countries in Asia, the lack ofadequate foundation skills makesvocational training less effective. As perUNESCO, in East Asia and the Pacific, over28 million people aged 15 to 24 have noteven completed primary school and needalternative pathways to acquire basic skillsfor employment. It is well known that SouthAsia is home to the world's largest numbersof adult illiterates. When the attainmentlevels of the work force are below secondaryor even primary education, skillsdevelopment institutions are challenges toremedy the lack of adequate foundation
Prabir Kumar Mohapatra & Dr. Prabodha Kumar Hota
264
skills. This is not only a matter of concernfor developing countries.
Yet, strengthening foundation skills are notincluded as an important priority in skillsdevelopment institutions. This despitefindings in skills audits that the technicalskill associated with a vocation is rarelymore than half of overall skill requirementsrequired, both in terms of effectiveperformance in the work place, and withregard to what employers are looking forwhen recruiting.
Lack of adequate of foundation skillscombined with poor life skills (referred to ina number of ways such as transferable skills,21st century skills, soft skills - problemsolving skills, creativity, work ethics, inter-personal skills and ability to work in teamsand so on) further impede skills developmenton a continuum and at the work place.Specific examples of the types of attributesin high demand among employers include,the ability to think critically and creatively,process information, make decisions,manage conflict, and work in teams.Furthermore, in many vocational andprofessional contexts, competencesassociated with the following are gainingground in importance - management,leadership, information and digitaltechnology management, negotiation, selling,marketing and public relations.
An Asia Society Report on partnership forglobal learning suggests that students arenot learning 21st century skills because theyare not explicitly taught, the traditionalmethod of teaching is not suited for teachingsuch skills and adequate methods to assesslearning of 21stcentury skills are notuniversally available.
6. GAPS IN THE EXISTING BUSINESSEDUCATION SYSTEM
In India, employment growth is almostexclusively concentrated in the informaleconomy, where more than 90 per cent ofIndia's workers are employed at low levelsof productivity and income. Half of thecountry's population over the age of 25 hashad no education and an additional thirdhave at best primary schooling. Four out offive new entrants to the workforce have neverhad any opportunity for skills training.While enrolment in business educationinstitutions has increased (from 1.1 millionin 2000 to some 2.8 million in 2012), there isa very high drop-out rate in theseinstitutions. There is a huge shortage ofteaching faculty in these colleges. At thesame time, significant skills shortages arereported throughout the formal economy.The major gap experienced in the existingbusiness education system to match theexpectations of the employers are summedup as follows:
1. Seating capacity
The available data on seating capacityclearly underscores the requirement toscale up the capacity of business schoolsin the country.
2. Business Education System
The under-utilisation of the capacity forMaster in Business Administrationexamination indicates a need to reformthe stream to make it more relevant tothe needs of the students like option forvertical mobility etc.
Non - availability of courses in new andemerging areas.
Skill development in Business Education - A Need Based Challenge
265
Inadequate infrastructure facilities andobsolete equipment.
System unable to attract quality teachers Inadequate financial resources
3. Management and Governance Presence of multiple authorities like
universities, AICTE etc. in businesseducation system leading tooverlapping of authority andduplication in efforts.
It has been expressed that the affiliationprocess is slow and hence theresponsiveness of the trade offered to thedemands of the industry is low.Moreover, the role of the state is verylimited in the current system.
The financial and academic autonomyat the institute level is low which needsto be relooked, especially for IIMs orUniversities, which are being positionedas Centres of Excellence. The privateinstitutions are not engaged ineffectively in administrative decisionmaking and enjoy much less autonomyin aspects like admissions,examinations, course development etc.
The quality of delivery of training inprivate institutions may be compromiseddue to low fee structure, due togovernmental interferences.
4. Faculty Development
The current system of Facultydevelopment requires a systemicintervention as no mandatory trainingand development programs or Industrialorientation is being offered to thetrainers. The private institutions receiveno support from the Government on thisfront.
No minimum qualification prescribed forthe faculty/trainers with respect to theindustrial experiences.
Inadequate or non-existence of policiesfor training and retraining of faculty andstaff.
Lack of flexibility and autonomy to theinstitutions with respect to HR issues.
5. Industry participation
No adequate Industry participation inthe field of curricula development,training of instructors and other aspectsof business educations.
Inadequate industry-institute interface
Lack of Research and Development intechnician education
Antiquated Curricula basing onclassroom teaching only
The challenges are immense and in order toachieve the goals there has to be substantialexpansion of quality technical/ vocationaleducation and training for raisingemployability and productivity. The skillsprovided have to be attuned to:
1. New business requirements;
2. Improving quality of education andtrainings at all levels; and
3. Make business education systemmore flexible and inclusive forsustainable growth.
7. DIFFERENT SKILL PARAMETERSREQUIRED BY THE EMPLOYERS
Different analysis of recent requirements ofCorporate and public sector has given animportance to different skill, which is achallenge before the business education.
Prabir Kumar Mohapatra & Dr. Prabodha Kumar Hota

266
The organisation is also conductingdifferent programmes, which should helpthe employees to identify the competencythrough Competency developmentprogrammes and help employees toimplement in the work life. On the basis ofthat some of the parameter has beendiscussed as below:
Technical skill-This skill is judged bythe technical acumen of a person whoshows or exhibits technical skill sets. Itshows the efficiency in the work place.
Problem solving skill-This skill is howproblem is being solved. This skill isimportant to solve critical problems injobs. It shows the leadership quality.
Communication skill-This skill isimportant in articulation andinterpretation of information provided.Skill in persuasion and convincing. Italso says how much is displayed inlanguage. It able the employee towardsthe better communication in the workplace. Again, The person's ability toshowcase the skill of reading andwriting. Information can be transferredby verbal and nonverbalcommunication. Both are necessary, butnonverbal communication is moreimportant in an organisation. So theemployee should be able to understandthe nonverbal/ written communication,which is essential.
Team work -This shows how a personis cooperative in behaviour and is a teamplayer. An employee should be in a team,when he is in work place. So he shouldknow, how to work in a team.
Management skill-Skill which helps to
manage all functions through propermanagement.
Supervisory skill-This skill helps one tohave supervisory quality and inculcatein the person the supervision quality.
Basic Employability-The person'semployability is judged in this qualityand can be found the basic employablenature in the person.
Learning, capture & flexibility skill-Thisskill helps one person to learn, captureand flexible nature adaptation while injob, or in profession.
Creative, discovery, innovation skill-This skill is important in creativity andinnovation while in job or doing somework. This quality is important intoday's changing and fast growthenvironment.
Computer/latest devices skill- This skillis to know different ways required whiledoing jobs in computer and latestgadgets etc. The IT knowledge isimportant in today's fast requirement ofbusiness.
8. TOP TEN SKILLS IN APROFESSIONAL WORKPLACE
1. Commercial awareness: knowinghow a business or industry Worksand what makes a company sick andhow it competes in its marketplace.
2. Communication: covers verbal andwritten communication, andlistening. It's about being clear,concise and focused; being able totailor your message for the audienceand listening to the views of othersand How to impress the audiencewith your communication skills.
Skill development in Business Education - A Need Based Challenge

267
3. Teamwork: Every employee has toprove that he is a team player. Itshows the ability to manage anddelegate to others and take onresponsibility. It indicates towardsthe positive working relationships,which help everyone to achieve goalsand objectives of business. Employeeshould know to use teamwork skillsto get success.
4. Negotiation and persuasion: aboutbeing able to put forward your way,but also being able to understandwhere the other person is comingfrom so that you can both get whatyou want or need and feel positiveabout it.
5. Problem solving: Employee needs todisplay an ability to take a logicaland analytical approach to solvingthe problems and resolving issues.Employee has to show employersabout problem solving skills fromdifferent angles.
6. Leadership: It does not refer to amanager, butone need to showpotential to motivate teams and othercolleagues that may work for them. Itis about assigning and delegatingtasks well, setting deadlines andleading by good example. It showsthe leadership potential in jobapplications
7. Organization: It is about to show thatthe employee can priorities, workefficiently and productively, andmanage time well and decidingabout the importance to focus on andget done, and meeting deadlines.
8. Perseverance and motivation:Working culture presents manychallenges and need to showemployers that person who will finda way through, even when the goinggets tough... and stay cheerful
9. Ability to work under pressure: it isabout keeping calm in a crisis andnot becoming too overwhelmed orstressed. Decisions should be takenunder cool and calm mentality.
10. Confidence: Every employee shouldkeep themselves as a confidence onenot arrogant, and also create theconfidence in other colleagues andthe company
9. FRAMEWORK FOR SKILLSDEVELOPMENT - MEETING TODAY'SAND TOMORROW'S SKILLS NEEDS
International experience shows thatcountries that have succeeded in linkingskills development to gains in productivity,employment and development havetargeted skills development policy towardsthree main objectives: Matching supply to current demand for
skills: - This is about the relevance andquality of training. Matching theprovision of skills with labour marketdemand requires labour marketinformation systems to generate, analyseand disseminate reliable sectoral andoccupational information, andinstitutions that connect employers withtraining providers. It is also aboutequality of opportunity in access toeducation, training, employmentservices and employment, in order thatthe demand for training from all sectorsof society is met.
Prabir Kumar Mohapatra & Dr. Prabodha Kumar Hota

268
Helping workers and enterprises adjustto change: - It is about easing themovement of workers and enterprisesfrom declining or low-productivityactivities and sectors into expanding andhigher productivity activities andsectors. Learning new skills, upgradingexisting ones and lifelong learning canall help workers to maintain theiremployability and enterprises to adaptand remain competitive.
Building and sustaining competenciesfor future labour market needs: The thirdobjective calls for a long-termperspective, anticipating the skills thatwill be needed in the future andengendering a virtuous circle in whichmore and better education and trainingfuels innovation, investment,technological change, economicdiversification and competitiveness,and thus job growth.
Issues for consideration Possible Strategies Expectations
Addressing the pressing challenges of jobs and skills for development in India
a) Skills policies linked with labour market and social protection policies
b) Affirmative action to overcome obstacles to workforce participation
a) Increased training opportunities and improved employment prospects
b) Reduced vulnerability and informality of employment
Addressing the paradox of skills mismatch with employer needs
a) Training courses based on an assessment of “right skills” required for the workforce, with a mix of high, medium, and basic skills levels.
b) Incentives for skills development for high-technology industry employers
a) Reduced skills mismatches to jobs and reduced graduate unemployment
b) A highly skilled workforce supports technology absorption and moving up the value chain
Leveraging skills training to improve competitiveness
a) Matching skills development priorities with economic and industrial priorities
a) Well-conceived and systematic skills training frameworks can support the overall economic growth aspirations and global competitiveness of nations
Ensuring industry-led systems for skills training
a) Conducive regulatory framework for the private sector. Employer representation on governing boards of training institutions and employer program advisory committees.
b) Industry representation in sector skills councils and in accreditation of skills
a) Availability of “work-ready” human resources and“ certified” employees
b) A responsive and diversified skills training system aligned to industry needs and focused on applied learning
Ensuring recognition of skills training and certification but setting realistic expectations from national qualifications frameworks
a) Developing national qualification frameworks.
b) Industry led occupational standards and their use in training.
c) Establishment of a“ qualification corridor”
a) Certification, accreditation, and recognition of qualifications and training improve market orientation and confidence in learning outcomes
Skill development in Business Education - A Need Based Challenge

269
10. GOVERNMENT INITIATIVES INSKILL DEVELOPMENT
As per the World Bank, India is one of thefew countries in the world where there isworking age population is more than theirdependent and this will continue for at leastthree decades till 2040. This is an indicationtowards the strengthening the nationaleconomy by providing and upgrading theskills of the population in the working agegroup. Government of India has adoptedSkill Development as a national priority overthe next 10 years. The Government of Indiahas taken up some steps to gear up the skillbased training to enhance theentrepreneurship ability in the youth massof the country. Mr. Modi, Hon'ble PrimeMinister of India, has taken a step towardsin this regards by launching 'Skill India' and'Make in India' mission. In Union Budget2015, paved way for the launch of a muchawaited National skills Mission to
complement Skill India and Make in Indiaeffort. There is a challenge of adding 12million people adding the workforce everyyear where 4% have ever received anyformal training is the concern for thegovernment. Thus a concrete Road map isrequired in analyzing this grave situation.Nonetheless, Indian Government isspending thousands of crores every year onskill development schemes through 18different central government ministries andstate governments. But the lack of resourcemobilization and systematic findingsolution is the main concern area fordevelopment of skilled manpower. Some ofthe major initiatives of the Governmenttowards the skill development have beendiscussed in below paragraphs.
1. National Skill Development Agency(NSDA): The Government of India hassetup the National Skill DevelopmentAgency (NSDA) as an autonomous body
Increasing the prestige of skills training and rebranding TVET
a) Policy framework blending skills training with higher education.
b) Introduction of associate degrees and applied bachelor’s degree programs
a) Horizontal and vertical mobility in learning without dead ends
b) Increased opportunities to upgrade skills and improve education qualifications
Strengthening foundationalskills
a) Using tools for direct measurement of skills such as the Program for International Assessment of Adult Competencies in Asia.
b) Strengthening non routine cognitive skills
a) Better assessment of actual skills b) Improve foundational skills that
help advance skills development.
Mainstreaming soft skills into technical skill straining systems
a) Incorporation of soft skills development, particularly critical thinking, communication, and collaboration, into training programs
a) Application of technical skills at the workplace is improved with good soft skills, and productivity is increased
Complementing skill straining with employment services
a) Complementing skill straining with employment services
b) Linking employment services such as career guidance, placement services, internships, and apprenticeship programs with training programs
a) Training leads to jobs; work force participation is improved.
b) There is better utilization of skills
Prabir Kumar Mohapatra & Dr. Prabodha Kumar Hota

270
which will coordinate and harmonizethe skill development efforts of theGovernment and the private sector toachieve the skilling targets of the 12thPlan and beyond. The Central Ministriesand National Skill DevelopmentCorporation will continue to implementschemes in their remit. The NSDA willanchor the National SkillsQualifications Framework (NSQF) andfacilitate the setting up of professionalcertifying bodies in addition to theexisting ones. NSDA has subsumed thethree earlier bodies of Office of Advisorto PM on Skill Development, NationalCouncil of Skill Development andNational Skill DevelopmentCoordination Board.
2. National Skill DevelopmentCorporation (NSDC): The National SkillDevelopment Corporation (NSDC) is aone of its kind, Public PrivatePartnership in India. It aims to promoteskill development by catalyzing creationof large, quality, for-profit vocationalinstitutions. It provides viability gapfunding to build scalable, for-profitvocational training initiatives. Itsmandate is also to enable supportsystems such as quality assurance,information systems and train thetrainer academies either directly orthrough partnerships. Its objective is tocontribute significantly (about 30%) tothe overall target of skilling/up skilling500 million people in India by 2022,mainly by fostering private sectorinitiatives in skill developmentprogrammes and providing viability gapfunding. NSDC is a not-for-profitcompany set up by the Ministry of
Finance, under Section-25 of theCompanies Act. It has an equity base ofRs. 10 crore, of which the Governmentof India accounts for 49%, while theprivate sector has the balance 51%.
3. National Skill Development Policy: TheNational Skill Development Policy isaimed at empowering all individualsthrough improved skills, knowledge andinternationally recognizedqualifications to enable them to accessdecent employment, to promoteinclusive national growth and to ensureIndia's competitiveness in the globalmarket. NSDP covers:a) Institution-based skill development
including ITIs/ITCs/vocationalschools/technical schools/polytechnics/ professional colleges,etc.
b) Learning initiatives of sectoral skilldevelopment organised by differentministries/departments.
c) Formal and informalapprenticeships and other types oftraining by enterprises
d) Training for self-employment/entrepreneurial development
e) Adult learning, retraining of retiredor retiring employees and lifelonglearning
f) Non-formal training includingtraining by civil society organisations
g) E-learning, web-based learning anddistance learning.
Incuding the above intitives, Government ofIndia has also taken a major step byimplemnting skill development program invarious activities of different ministries and
Skill development in Business Education - A Need Based Challenge
271
created a separate ministry named as'Ministry of Skill Development &Entrepreneurship' to give special focus on skilldevelopment. The progrms like Soft SkillDevelopment Council (SSDC) is alsoconducted to upgrade the skill. Indiangovernment started 'Prime Minister KaushalVikas Yojna' to enhance the skills in ruralareas in 23 sectors and to make success SkillIndia. Not only India, the foreign countriesi.e. Australia, Germany,United Kingdom,Singapore have also taken some intiatives forSkill development in their respective countriesto development the skill. In present context ofcompetitive market, Skill Development isplaying an important role towards the growthof the economy in the world.
CONCLUSIONSkills and knowledge management are thedriving forces of economic growth and socialdevelopment in developing economies.Persons with appropriate, adequate andbetter skills adjust more effectively to faceemerging challenges and seize workopportunities for better development. Skilldevelopment initiative focusing on specificneeds of rural youths is the key to help themself-employed or make them employable orpromising entrepreneurs in the changingsocio-economic scenario.A skilled workforce in the current centuryis a sine qua non for India's vibrant rurallivelihood strategy. India has yet to put inplace a comprehensive result-oriented skilldevelopment programme forunemployment sector on lines as being donein other sectors of the economy.
REFERENCESA Global study to get India World-Ready,
Building Sector Skills Body for India byManipal City and Guilds
A Path Out of Poverty, Developing Rural andWomen Entrepreneurship, UNIDO,Vienna, (2003)
Annual Report to the People on Employment,Ministry of Labour and Employment,Government of India, 2010
Annual Report, 2011, Ministry of Labour andEmployment
Better Skills, Better Jobs, Better Lives, OECD,2012
Economic Survey of India 2011, Ministry ofFinance
India Labour Report 2007, TeamLease ServicesMid-Term Appraisal of the Eleventh Five Year
Plan, Employment and SkillDevelopment, Chapter PP: 204 to 220.
Ministry of Skill Development andE n t r e p r e n e u r s h i p ,www.skilldevelopment.gov.in/
National Policy on Skill Development,Ministry of Labour & Employment,Govt. of India
Report of National Skill Development MissionReport on National Workshop on Equivalence,
Vertical Mobility of vocational coursesat 10+2 level & Placement prospects ofvocational pass-outs, 13th May 2010.
Reports of National Skill DevelopmentCorporation (NSDC), www. nsdcindia.org
Reports of Pradhan Mantri Kaushal VikasYojana (PMKVY), www. pmkvyofficial.org
Skill Development in India: The VocationalEducation and Training System, WorldBank, 2007
The Challenge of Employment in India - AnInformal Economy Perspective,National Commission for Enterprisesin the Unorganised Sector (NCEUS),April 2009
UNESCO GED 2010
Prabir Kumar Mohapatra & Dr. Prabodha Kumar Hota

THE NEW DYNAMICS OF CORPORATE SOCIALRESPONSIBILITY : A COMPARATIVE STUDY OF
NALCO & VEDANTA LTD.
*Ph.D Scholar, P.G. Department of Commerce, Utkal Univesity, Vanivihar, Bhubaneswar.
Mr. Ramakrushna Nayak*
INTRODUCTION
'If you want to walk fast, walk alone. If youwant to work far, walk together.' This quoteby Ratan Tata, the chairman of the TataGroup, sums up the new spirit of doingbusiness in India. Both large and smallbusiness organizations have acknowledgedimportance of social responsibility being anessential part of long term sustainability ofbusiness. According to Liz Maw, the CEOof the non-profit organization Net Impact,CSR is becoming more and moremainstream as forward-thinking companiesembed sustainability into the core of theirbusiness operations to create shared valuefor business and society.
The concept of CSR has come a long wayfrom being a mandatory contribution to thesociety to being the cornerstone forintegrating business with communitydevelopment. The earlier notion thatbusiness only has to be 'seen doing good'has evolved into the the belief that doinggood is the first step to be 'seen doing good'.Business houses have realized that CSR'spotential to contribute to the social,environmental and economic objectives canalso be leveraged to increase businesscompetitiveness.
In India, particularly, CSR's intertwiningrelationship with long term sustainabilityhas been widely acknowledged. It has
ABSTRACTSince its inception, idea of Corporate Social Responsibility has evolved with time. From the initialmoral obligation of business houses, it went on to become a mandatory contribution by big industrieswith the Companies Act of 2013. Now in its new avatar, CSR has emerged as a strategic part of businesslogistics that can be leveraged to ensure both profits and long term sustainability. With a growingawareness among consumers and stakeholders about the positive and negative impact of industries,companies are framing policies in line with the new mantra of 'profit, people and planet'. As sustainabledevelopment becomes the new buzzword of the business world, the role of CSR becomes pivotal for thegrowth and goodwill of the corporate sector. In the light of these latest developments, this paper aims tostudy the dynamically changing notions about CSR and its implementation through the social activitiesundertaken by NALCO. This research paper will also analyse how CSR is a two way bridge that canhelp both- the corporate and the community.
Key Words : Corporate Social Responsibility, Corporate Governance, NALCO Foundation, CompaniesACT, Triple Bottom Line, Periphery Development, RPDAC.
The Utkal Business ReviewDecember, 2015, Vol - XXIX, pp.-272-281
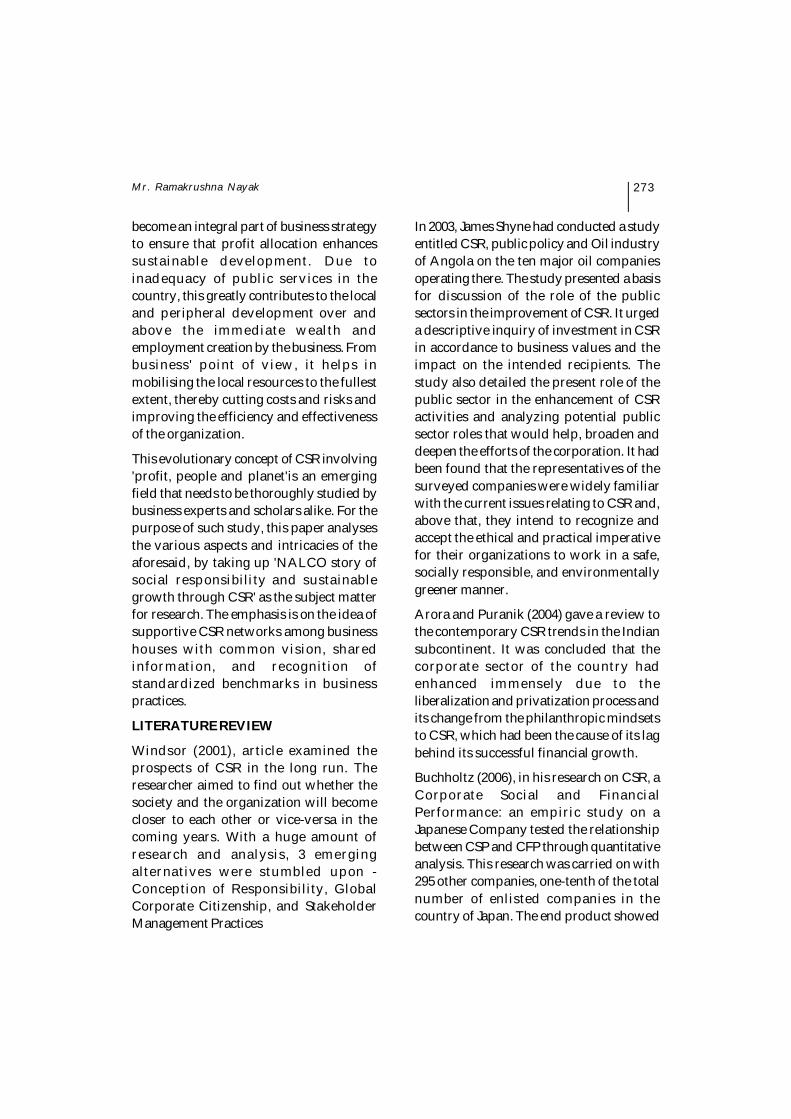
273
become an integral part of business strategyto ensure that profit allocation enhancessustainable development. Due toinadequacy of public services in thecountry, this greatly contributes to the localand peripheral development over andabove the immediate wealth andemployment creation by the business. Frombusiness' point of view, it helps inmobilising the local resources to the fullestextent, thereby cutting costs and risks andimproving the efficiency and effectivenessof the organization.
This evolutionary concept of CSR involving'profit, people and planet'is an emergingfield that needs to be thoroughly studied bybusiness experts and scholars alike. For thepurpose of such study, this paper analysesthe various aspects and intricacies of theaforesaid, by taking up 'NALCO story ofsocial responsibility and sustainablegrowth through CSR' as the subject matterfor research. The emphasis is on the idea ofsupportive CSR networks among businesshouses with common vision, sharedinformation, and recognition ofstandardized benchmarks in businesspractices.
LITERATURE REVIEW
Windsor (2001), article examined theprospects of CSR in the long run. Theresearcher aimed to find out whether thesociety and the organization will becomecloser to each other or vice-versa in thecoming years. With a huge amount ofresearch and analysis, 3 emergingalternatives were stumbled upon -Conception of Responsibility, GlobalCorporate Citizenship, and StakeholderManagement Practices
In 2003, James Shyne had conducted a studyentitled CSR, public policy and Oil industryof Angola on the ten major oil companiesoperating there. The study presented a basisfor discussion of the role of the publicsectors in the improvement of CSR. It urgeda descriptive inquiry of investment in CSRin accordance to business values and theimpact on the intended recipients. Thestudy also detailed the present role of thepublic sector in the enhancement of CSRactivities and analyzing potential publicsector roles that would help, broaden anddeepen the efforts of the corporation. It hadbeen found that the representatives of thesurveyed companies were widely familiarwith the current issues relating to CSR and,above that, they intend to recognize andaccept the ethical and practical imperativefor their organizations to work in a safe,socially responsible, and environmentallygreener manner.
Arora and Puranik (2004) gave a review tothe contemporary CSR trends in the Indiansubcontinent. It was concluded that thecorporate sector of the country hadenhanced immensely due to theliberalization and privatization process andits change from the philanthropic mindsetsto CSR, which had been the cause of its lagbehind its successful financial growth.
Buchholtz (2006), in his research on CSR, aCorporate Social and FinancialPerformance: an empiric study on aJapanese Company tested the relationshipbetween CSP and CFP through quantitativeanalysis. This research was carried on with295 other companies, one-tenth of the totalnumber of enlisted companies in thecountry of Japan. The end product showed
Mr. Ramakrushna Nayak

274
a deep relationship among CSP, EquityCapital ratio, and the number of workingemployees.
Samuel Odowu and PapasplomouLoanna(2007) conducted a research on twentycompanies present in the UK andproclaimed that the UK companies had nowbecome ethical in the content of Sociallyresponsibility as they disclosed its CSR witha look of public welfares, Governmentpleads, and provide information toStakeholders because the companies believethat the modern century stakeholders arefar better educated as that compared to thepast.
Gond, Crane (2008) paper inquired thedecrease in the importance of CSR. It alsorecommended some methods to further thestudy related to Corporate Social.
Vasanthi Srinivasan (2010) in his study onCSR and Ethics in MSMEs of Indiaattempted to draw from the present body ofInformation from both the academic andfamous literature in the country in order toknow the CSR practices and build up aninquiry agenda for responsible businessmethods in the small-medium enterprisesin India. The final results highlighted thatmajority of the studies conducted in Indiahad mostly been qualitative and discovery-type in nature. The study also revealed thefact that since the small and mediumenterprises contributed a lot to the economyand are geographically scattered across thecountry, the acceptance of CSR and itspractices is necessary for a balanced growth.There was a scarcity of academicinvestigation in this area and thereby, theinvestigator opines that a study of the intra-country similarities and differences in the
acceptance of CSR practices in MSMEscould be valuable for policy framers.
Shah, Bhaskar (2010) took a case study ofPSUs like Bharat Petroleum CorporationLtd. Where it was discussed that there is adeep relationship of mutual benefit betweenthe organization and the society.
Prasenjit Maiti (2011) on his paper titled "Isit Politics or even Compassion? Unravellingthe Motivation for Corporate Citizenship"tried to study theoretically the intentions ofCorporates before their CSR initiatives. Thestudy found that CSR had a relation withthe profits, competent plays, political-legalequation, situation of Market Flux,responsible images, humane concerns, andother principled dynamics.
Hartman (2011) article "Corporate SocialResponsibility in the food sector" studiedthe relevance of CSR in the food sector,especially regarding the big and popularbranded companies. These companies weremore skillful than MSMEs and were givenmore preference by the consumers as theygave more preference to CSR activities andgave good products and services.
Borogonovi, Veronica (2011) article statedthat the concept of CSR differed fromcompany to company as there are nocompulsory guidelines to regulate theseactivities and sort out the troubles. Thearticle also talked about the views of theGovernment and their plan of actionregarding the CSR.
Mallen Baker (2012) in his article "Fouremerging trends in CorporateResponsibility" tried to exemplify three basicthings about the trends of CSR that hadsubstituted from the past years. First,
The New Dynamics of Corporate Social Responsibility : A Comparative Study of ...
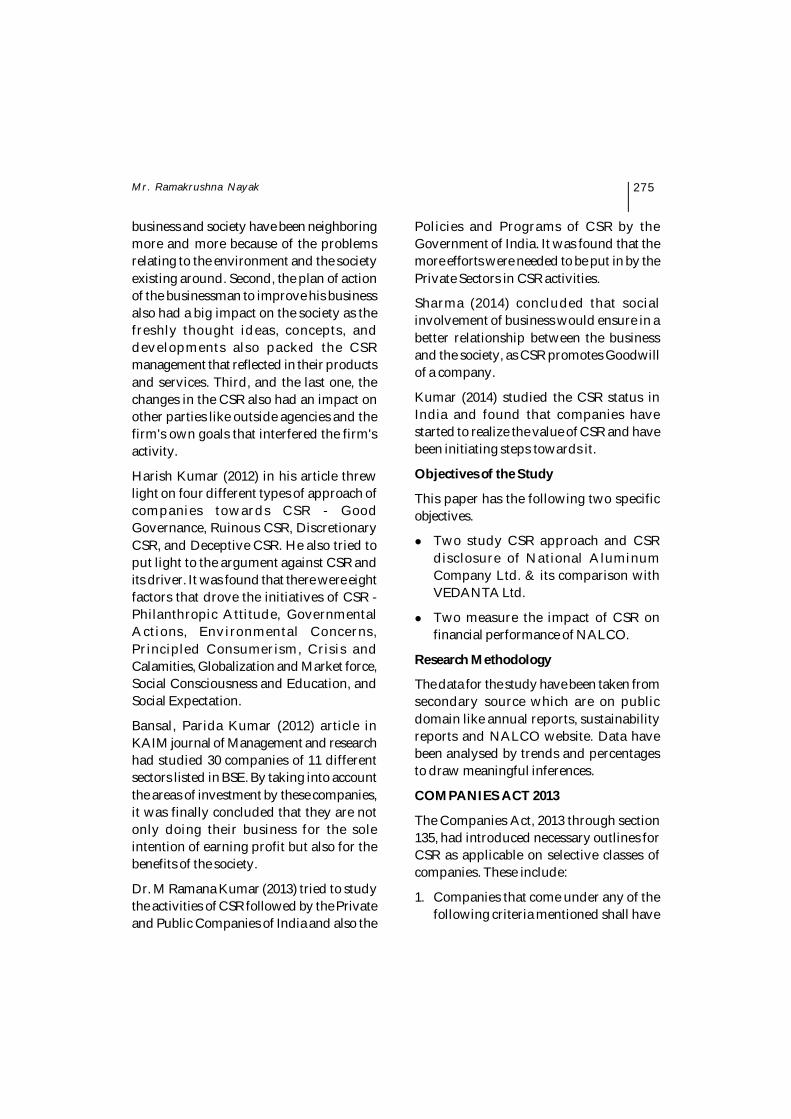
275
business and society have been neighboringmore and more because of the problemsrelating to the environment and the societyexisting around. Second, the plan of actionof the businessman to improve his businessalso had a big impact on the society as thefreshly thought ideas, concepts, anddevelopments also packed the CSRmanagement that reflected in their productsand services. Third, and the last one, thechanges in the CSR also had an impact onother parties like outside agencies and thefirm's own goals that interfered the firm'sactivity.
Harish Kumar (2012) in his article threwlight on four different types of approach ofcompanies towards CSR - GoodGovernance, Ruinous CSR, DiscretionaryCSR, and Deceptive CSR. He also tried toput light to the argument against CSR andits driver. It was found that there were eightfactors that drove the initiatives of CSR -Philanthropic Attitude, GovernmentalActions, Environmental Concerns,Principled Consumerism, Crisis andCalamities, Globalization and Market force,Social Consciousness and Education, andSocial Expectation.
Bansal, Parida Kumar (2012) article inKAIM journal of Management and researchhad studied 30 companies of 11 differentsectors listed in BSE. By taking into accountthe areas of investment by these companies,it was finally concluded that they are notonly doing their business for the soleintention of earning profit but also for thebenefits of the society.
Dr. M Ramana Kumar (2013) tried to studythe activities of CSR followed by the Privateand Public Companies of India and also the
Policies and Programs of CSR by theGovernment of India. It was found that themore efforts were needed to be put in by thePrivate Sectors in CSR activities.
Sharma (2014) concluded that socialinvolvement of business would ensure in abetter relationship between the businessand the society, as CSR promotes Goodwillof a company.
Kumar (2014) studied the CSR status inIndia and found that companies havestarted to realize the value of CSR and havebeen initiating steps towards it.
Objectives of the Study
This paper has the following two specificobjectives.
Two study CSR approach and CSRdisclosure of National AluminumCompany Ltd. & its comparison withVEDANTA Ltd.
Two measure the impact of CSR onfinancial performance of NALCO.
Research Methodology
The data for the study have been taken fromsecondary source which are on publicdomain like annual reports, sustainabilityreports and NALCO website. Data havebeen analysed by trends and percentagesto draw meaningful inferences.
COMPANIES ACT 2013
The Companies Act, 2013 through section135, had introduced necessary outlines forCSR as applicable on selective classes ofcompanies. These include:
1. Companies that come under any of thefollowing criteria mentioned shall have
Mr. Ramakrushna Nayak

276
to necessarily follow the provisions ofSection 135:
a) Having a minimum net worth ofRs. 500 crore;
b) Having a minimum turnover ofRs. 1000 crore; and
c) Having a minimum net profit of Rs. 5crore.
2. Companies falling under either of theabove mentioned criteria shall have toform a CSR Committee of the Boardhaving a minimum of three directors, outof which one shall have independentpowers.
3. The Roles of the committee shall be asfollows:
a) To formulate and recommend a CSRpolicy to the board;
b) To suggest amount of expenditure tobe incurred on CSR activities; and
c) To monitor the implementation ofCSR policy of the companyperiodically.
4. Roles of the Board formed of threedirectors shall be as follows:
a) To approve the CSR policy suggestedby the committee and reveal thecontents of such policy in its reportand put it up on its website;
b) To make sure that the CSR activitiesare carried out by the company;
c) To ensure 2% spending on suchactivities;
d) To inform about CSR activities inBoard's report and reveal any
disagreements with the CSRprovisions; and
e) The rough sketch of CSR rulesprovide the format in which allqualifying companies shall informthe details of their CSR undertakingsin the Director's report and on thecompany's website.
5. Sections 135 has made it compulsorythat the Board should spend at-least 2%of the average net profits made duringthree immediate preceding years shouldbe invested in CSR activities, and the netprofits should be calculated as perSection 198 of the Companies Act, 2013.
6. Schedule VII of the Act clearly mentionsthe list of activities which may be putforward by companies in their CSRpolicies:
a) Removing hunger, poverty, andmalnourishment, Promotingpreventive health care and sanitation,and providing safe drinking water;
b) Boosting education, includingspecial education and improvingvocal skills for employmentpurposes among children, women,elderly, and differently-abled alongwith life-enhancing tasks;
c) Ensuring gender equality,empowering women, building up ofhouses and hostels for women andfor the orphaned; setting up old agehomes that provide good services forthe old, and bringing about ways oferadicating the inequality problemsoften faced by the backward classes;
The New Dynamics of Corporate Social Responsibility : A Comparative Study of ...

277
d) Making sure of better sustainabilityof the environment, maintaining anecological balance, preserving floraand fauna, animal welfare,agroforestry, protection andpreservation of natural resources,and maintaining a good quality ofsoil, water and the air;
e) Preservation of Natural heritage, artand culture which include therestoring of historical buildings andartifacts, setting up of public libraries,and advancement in the fields oftraditional arts and handicrafts;
f) Measures to improve the life of thearmed forces vets, widows of warand their dependents;
g) Provide training to bring aboutdevelopment in the field of sports, beit rural or Olympic;
h) To Contribute to the Prime Minister'sNational Relief Fund (PMNRF) orany such kinds of fund as set up bythe Central Government of ourcountry and contribute to theadvancement of the ScheduledCastes, Scheduled Tribes, and OtherBackward Classes, minors, andwomen;
i) Contributions to Technologicalincubators found within theUniversities approved by the CentralGovernment;
j) Contributions to the various projectsundertaken for the development of theRural Areas of our country.
7. It has been enforced, under Section 135,that the companies shall prioritize theirlocal area of operation and the areas
around it more than the other areas, forspending the necessary amounts ofmoney.
8. Multiple disclosures that have beenspecified in the Companies Act, 2013 areas follows:
a) Under Section 134(3), the CSRcommittee's composition shall befully revealed in the report of theBoard of Directors;
b) If due to some reasons, the committeeis not able to fully utilize the requiredamount for CSR related activities,then the specific reasons have to bedisclosed in a report by the Board asspecified under Section 134(3).
Company Introduction
Incorporated in 1981 by the Government ofIndia, NALCO is Asia's sixth largestintegrated aluminium complexencompassing every part of aluminiumproduction from bauxite mining to powergeneration to rail and port operations. It wasfounded as a PSU in collaboration with theAluminium Pechiney of Trance to top thelarge bauxite deposits that had beendiscovered along the east coast of thecountry.
Centered primarily in the state of Odisha,its main units are situated at Damanjodi andAngul, while it is headquartered inBhubaneswar.
As of present, it is employing new projectswith its ongoing second phase of expansionthat is set to make it the sixth largest metalproducer in the globe. The Companyreceived Indira Priyadarshini VrikshamitraAward from Government of India for its
Mr. Ramakrushna Nayak

278
pioneering contributions in afforestationand wasteland development efforts. Thecompany had also set up a 1200 MWthermal power plant for which it wasawarded with the Indira GandhiParyavaran Puraskar for the year 2000 for'outstanding contributions in the field ofenvironmental management.' Besides, thecompany has also received variousnational, state and institutional awards forexcellent standards of safety andenvironment management by its units.
NALCO and CSR
Back in 1981, when the concept of CSR didnot exist, the company used to do its part ofmoral obligations to the society. After 1998,when charity was formalised into aresponsibility, NALCO made it a policy tocontribute 0.5% of its net profit towardsdevelopmental and social activities. Thispercentage doubled to 1% between 2002 and2003 due to the efforts by the Rehabilitationand Periphery Development AdvisoryCommittee (RPDAC) set up by uniongovernment comprising of the revenuedivisional commissioner as its chairmanand collectors, MLAs, MPs and people'srepresentatives as other members.
As CSR started gaining relevance as animportant part of business strategy, between2010-11, NALCO decided to create separateprovisions for CSR activities. An additional1%, over and above the initial 1% wasallocated out the net profits towards projectsundertaken for CSR. As of 2014-15, thecompany has allocated more 221 crores(excluding contributions to PM's nationalrelief fund and CM's relief fund) towardsperiphery development and otherfoundation projects.
Educational and Healthcare Initiatives
Even before the concept of CSR had comeinto being, NALCO, as a part of its moralresponsibility, had taken up initiatives inthe field of education and healthcare. Thecompany's hospitals in Angul andDamanjodi and its four schools the in sameregion are evident of the same.
Besides providing quality education tochildren of employees, it has opened upsimilar facilities at a subsidised rate for themajority of local students belonging to thesocially and economically backward areas.It has also started remedial schools in thetribal region in and around its area ofoperation which have helped more than 224drop outs be reintroduced into the formaleducation system. Many of theseinstitutions, especially in the Bhubaneswarregion, are residential in nature, whichhelps in drawing children from the mostinfused tribal dominated areas to the capitalwhere they can have access to qualitativefacilities, the costs of which are covered bythe Foundation.
Apart from that, the company's endeavoursin the field of health and medicare haveyielded results with mobile health unitsoperational in more than 43 villages in Anguland 142 villages in Damanjodi. These healthunits, alongside providing primary healthservices and free medicines to the villagers,also create awareness among them abouthealth and proper sanitation.
The company also lead a successfulcampaign under the Swacha VidyalayaAbhijan of the government by constructing364 toilets in 202 schools across Angul andKoraput districts of Odisha andVishakhapatnam district of Andhra
The New Dynamics of Corporate Social Responsibility : A Comparative Study of ...

279
Pradesh. Despite these regions being Maoistinfested with a deep paucity of skilledlabour, the company not only completed thework on time but also constructed anadditional 79 toilets catering to the groundreality and requests from the schoolauthorities.
Steps Towards Renewable Energy
With governments and big corporationsacknowledging the urgent needs forenvironmental actions, the emphasis onrenewable energy has grown. Keeping thisin mind, the company has undertakendifferent initiatives in the field of solar andhydro power.
To fulfil its vision of rural electrification, thecompany has installed solar lightingfacilities in more than 18 villages inDamanjodi. Besides, it has conceptualisedand implemented a unique water supplysystem under its Gravity Feel Water Supplyproject. Under this the company trains andprovides the local people with tools forrepair and maintenance of the watersystems, with extensive voluntary labourcovering upto 21% of the cost. About 900households have been covered under thisprogram in the Veedhimandal region ofVishakhapatnam.
COMPARATIVE ANALYSIS OF CSR OF NALCO AND VEDANTA LTD.
NALCO CSR VEDANTA CSR
YEAR CSR
AMOUNT (Rs. in cr.)
TREND (%)
PROFIT AFTER TAX
(Rs. in cr.)
CSR % ON PAT
CSR AMOUNT (Rs. in cr.)
TREND (%)
PROFIT AFTER TAX
(Rs. in cr.)
CSR % ON PAT
2009-10 11.28 100 814.22 1.38 31.18 100 277.33 11.23
2010-11 26.77 237 1069.30 2.50 12.79 41.02 (359.12) ______
2011-12 34.22 303 849.50 4.02 9.69 31.08 (1687.79) ______
2012-13 30.99 275 592.83 5.22 6.19 19.85 (1317.87) ______
2013-14 29.00 257 642.35 4.51 3.18 10 (847.60) ______
2014-15 19.31 171 1321.85 1.46 9.89 31.72 (563.57) ______
Source: Annual Report of Nalco and Vedanta Ltd. From 2010 to 2015
Keeping the base year as 2009-10, wherethe trend was considered 100%, we can seesharp differences between NALCO andVEDANTA Ltd., where there has been asteady rise in the Trend of Nalco'sspending on CSR, there has been a steadydecline in the spending of Vedanta'sspending on the same.
In 2010-11, NALCO spent more than twicethe amount than the preceding year, thereby
seeing the increase in the trend by more than2 times. For the same year, there was a sharpdecrease from the side of Vedanta Ltd., from31.18 cr. To 12.79 cr., which is less than halfof the amount of 2009-10, mainly due to thehuge loss suffered by the company.
In 2011-12, we see more than a three-foldincrease in the spending of CSR activitiesby NALCO as compared to the base year,but a steep drop in the spending of the same
Mr. Ramakrushna Nayak
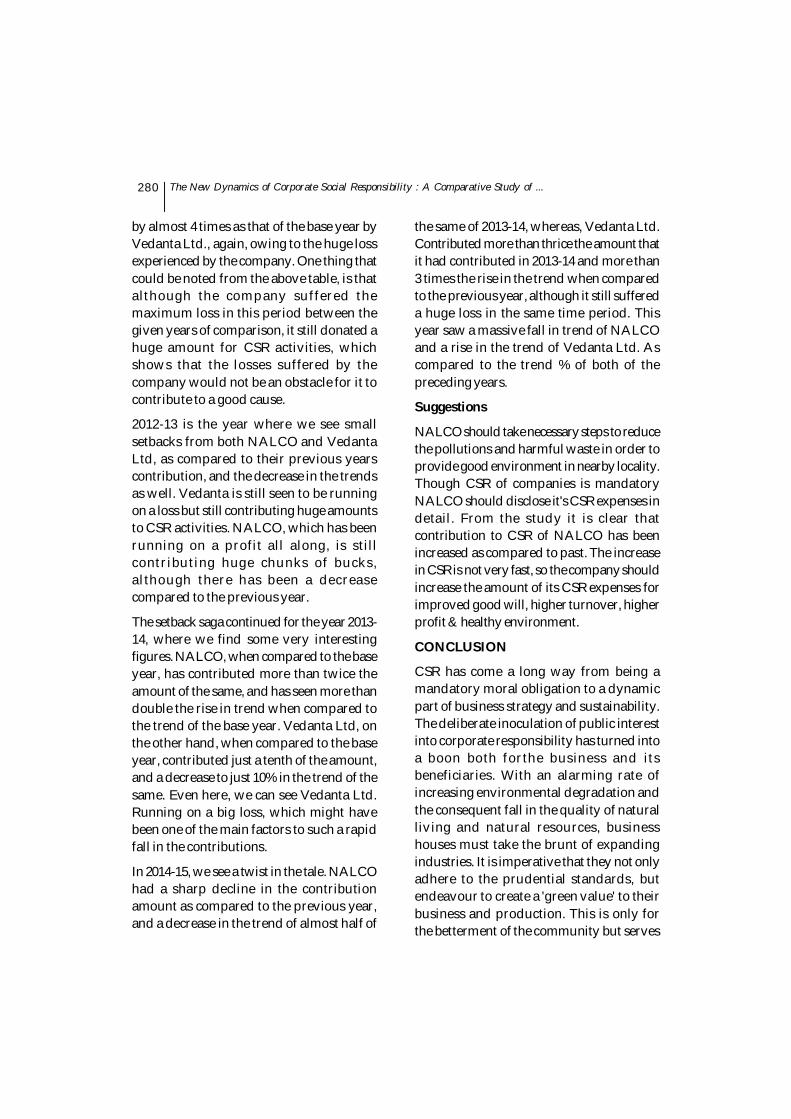
280
by almost 4 times as that of the base year byVedanta Ltd., again, owing to the huge lossexperienced by the company. One thing thatcould be noted from the above table, is thatalthough the company suffered themaximum loss in this period between thegiven years of comparison, it still donated ahuge amount for CSR activities, whichshows that the losses suffered by thecompany would not be an obstacle for it tocontribute to a good cause.
2012-13 is the year where we see smallsetbacks from both NALCO and VedantaLtd, as compared to their previous yearscontribution, and the decrease in the trendsas well. Vedanta is still seen to be runningon a loss but still contributing huge amountsto CSR activities. NALCO, which has beenrunning on a profit all along, is stillcontributing huge chunks of bucks,although there has been a decreasecompared to the previous year.
The setback saga continued for the year 2013-14, where we find some very interestingfigures. NALCO, when compared to the baseyear, has contributed more than twice theamount of the same, and has seen more thandouble the rise in trend when compared tothe trend of the base year. Vedanta Ltd, onthe other hand, when compared to the baseyear, contributed just a tenth of the amount,and a decrease to just 10% in the trend of thesame. Even here, we can see Vedanta Ltd.Running on a big loss, which might havebeen one of the main factors to such a rapidfall in the contributions.
In 2014-15, we see a twist in the tale. NALCOhad a sharp decline in the contributionamount as compared to the previous year,and a decrease in the trend of almost half of
the same of 2013-14, whereas, Vedanta Ltd.Contributed more than thrice the amount thatit had contributed in 2013-14 and more than3 times the rise in the trend when comparedto the previous year, although it still suffereda huge loss in the same time period. Thisyear saw a massive fall in trend of NALCOand a rise in the trend of Vedanta Ltd. Ascompared to the trend % of both of thepreceding years.
Suggestions
NALCO should take necessary steps to reducethe pollutions and harmful waste in order toprovide good environment in nearby locality.Though CSR of companies is mandatoryNALCO should disclose it's CSR expenses indetail. From the study it is clear thatcontribution to CSR of NALCO has beenincreased as compared to past. The increasein CSR is not very fast, so the company shouldincrease the amount of its CSR expenses forimproved good will, higher turnover, higherprofit & healthy environment.
CONCLUSION
CSR has come a long way from being amandatory moral obligation to a dynamicpart of business strategy and sustainability.The deliberate inoculation of public interestinto corporate responsibility has turned intoa boon both forthe business and itsbeneficiaries. With an alarming rate ofincreasing environmental degradation andthe consequent fall in the quality of naturalliving and natural resources, businesshouses must take the brunt of expandingindustries. It is imperative that they not onlyadhere to the prudential standards, butendeavour to create a 'green value' to theirbusiness and production. This is only forthe betterment of the community but serves
The New Dynamics of Corporate Social Responsibility : A Comparative Study of ...
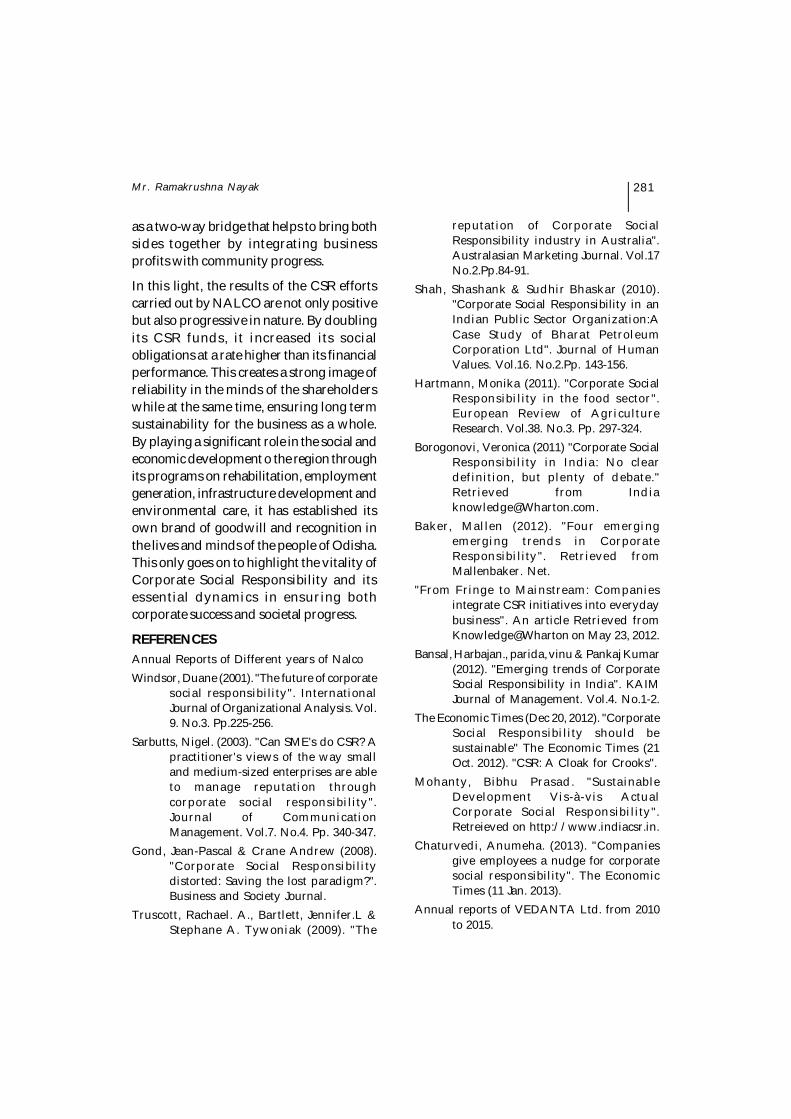
281
as a two-way bridge that helps to bring bothsides together by integrating businessprofits with community progress.
In this light, the results of the CSR effortscarried out by NALCO are not only positivebut also progressive in nature. By doublingits CSR funds, it increased its socialobligations at a rate higher than its financialperformance. This creates a strong image ofreliability in the minds of the shareholderswhile at the same time, ensuring long termsustainability for the business as a whole.By playing a significant role in the social andeconomic development o the region throughits programs on rehabilitation, employmentgeneration, infrastructure development andenvironmental care, it has established itsown brand of goodwill and recognition inthe lives and minds of the people of Odisha.This only goes on to highlight the vitality ofCorporate Social Responsibility and itsessential dynamics in ensuring bothcorporate success and societal progress.
REFERENCESAnnual Reports of Different years of NalcoWindsor, Duane (2001). "The future of corporate
social responsibility". InternationalJournal of Organizational Analysis. Vol.9. No.3. Pp.225-256.
Sarbutts, Nigel. (2003). "Can SME's do CSR? Apractitioner's views of the way smalland medium-sized enterprises are ableto manage reputation throughcorporate social responsibility".Journal of CommunicationManagement. Vol.7. No.4. Pp. 340-347.
Gond, Jean-Pascal & Crane Andrew (2008)."Corporate Social Responsibilitydistorted: Saving the lost paradigm?".Business and Society Journal.
Truscott, Rachael. A., Bartlett, Jennifer.L &Stephane A. Tywoniak (2009). "The
reputation of Corporate SocialResponsibility industry in Australia".Australasian Marketing Journal. Vol.17No.2.Pp.84-91.
Shah, Shashank & Sudhir Bhaskar (2010)."Corporate Social Responsibility in anIndian Public Sector Organization:ACase Study of Bharat PetroleumCorporation Ltd". Journal of HumanValues. Vol.16. No.2.Pp. 143-156.
Hartmann, Monika (2011). "Corporate SocialResponsibility in the food sector".European Review of AgricultureResearch. Vol.38. No.3. Pp. 297-324.
Borogonovi, Veronica (2011) "Corporate SocialResponsibility in India: No cleardefinition, but plenty of debate."Retrieved from [email protected].
Baker, Mallen (2012). "Four emergingemerging trends in CorporateResponsibility". Retrieved fromMallenbaker. Net.
"From Fringe to Mainstream: Companiesintegrate CSR initiatives into everydaybusiness". An article Retrieved fromKnowledge@Wharton on May 23, 2012.
Bansal, Harbajan., parida, vinu & Pankaj Kumar(2012). "Emerging trends of CorporateSocial Responsibility in India". KAIMJournal of Management. Vol.4. No.1-2.
The Economic Times (Dec 20, 2012). "CorporateSocial Responsibility should besustainable" The Economic Times (21Oct. 2012). "CSR: A Cloak for Crooks".
Mohanty, Bibhu Prasad. "SustainableDevelopment Vis-à-vis ActualCorporate Social Responsibility".Retreieved on http://www.indiacsr.in.
Chaturvedi, Anumeha. (2013). "Companiesgive employees a nudge for corporatesocial responsibility". The EconomicTimes (11 Jan. 2013).
Annual reports of VEDANTA Ltd. from 2010to 2015.
Mr. Ramakrushna Nayak

282