
The oxidative dehydrogenation of n-butane in a differential side-stream catalytic membrane reactor
9
Catalysis Today 156 (2010) 237–245 Contents lists available at ScienceDirect Catalysis Today journal homepage: www.elsevier.com/locate/cattod The oxidative dehydrogenation of n-butane in a differential side-stream catalytic membrane reactor David Milne ∗ , Tumisang Seodigeng, David Glasser, Diane Hildebrandt, Brendon Hausberger Centre of Material and Process Synthesis, University of the Witwatersrand, Johannesburg, Private Bag 3, WITS 2050, South Africa article info Article history: Available online 27 April 2010 Keywords: Attainable region Recursive Convex Control Policy Algorithm Butane Oxidative dehydrogenation Differential side-stream reactor abstract The synthesis of butenes and butadiene from the oxidative dehydrogenation of n-butane is a chemical reaction of economic relevance and the choice of catalyst is of considerable importance. In this simulation exercise a V/MgO catalyst in a differential side-stream catalytic membrane reactor was studied. The Recursive Convex Control (RCC) algorithm was used to determine the operating parameters required to determine the maximum yields of hydrocarbon products. The algorithm, in addition to select- ing for the duty a single differential side-stream catalytic membrane reactor (DSR) in preference to a CSTR and a PFR, also developed the profile for the optimal addition of oxygen along the length of the reactor. The maximum yield of butenes, all three isomers, was found to be 0.119 carbon mass fraction. The maximum yield of butadiene from the ODH of n-butane was found to be 0.799 carbon mass fraction. The rates of formation of hydrocarbon reactants and products are discussed. Statistical analyses of the ratios of formation rates of the butene isomers and of carbon dioxide to carbon monoxide are presented. The interplay between alternative reaction routes for the formation of butadiene is reviewed as well as the validity of the kinetic data at low oxygen partial pressures. © 2010 Elsevier B.V. All rights reserved. 1. Introduction The attainable region (AR) method uses geometrical principles to determine the multi-dimensional spatial region in which all the reactants and products for reaction systems with known kinetics can be found. The AR method can also be used to find the maximum yield of product as well as the reactor types and configurations nec- essary to yield any slate of products within this spatial region. It has been shown by Feinberg and Hildebrandt [1] that only three basic reactor types, a continuously stirred tank reactor (CSTR), a plug- flow reactor (PFR) and a differential side-stream reactor (DSR), in suitable configurations, are sufficient to provide any yield of reac- tion products. In the absence of a complete sufficiency condition, a presumed AR is usually termed a candidate AR (AR C ). It is not the intention in this paper to describe AR theory in detail. Instead, the attention of the reader is directed to the work of Glasser et al. [2,3] and Feinberg [4,5] for a comprehensive review of Attainable Region theory and practice. Abbreviations: AR, attainable region; AR C , candidate attainable region; CSTR, continuously stirred tank reactor; DSR, differential side-stream catalytic membrane reactor; IMR, inert membrane reactor; ODH, oxidative dehydrogenation; PFR, plug flow reactor; RCC, Recursive Convex Control algorithm. ∗ Corresponding author at: 16 Rooibos Avenue, Allen Grove, Kempton Park 1619, South Africa. Tel.: +27 11 394 7683; fax: +27 11 717 7557. E-mail address: [email protected] (D. Milne). Recently the Recursive Convex Control (RCC) algorithm has been developed and used successfully to analyse complex chemical reac- tions. These reactions, by virtue of many possible products, can be considered as possessing many dimensions to which can be added the further dimension of residence time. The RCC algorithm has been proved to be capable of solving multi-dimensional problems of a complexity previously considered too difficult to handle. Again, the characteristics of the RCC and its usage shall not be discussed in detail in this paper. Rather the attention of the reader is directed to the work of Seodigeng [6,7] for an extensive description of its capa- bilities. Suffice it to say that the use of the RCC algorithm requires no prior understanding of AR theory to use it successfully. However, knowledge of AR principles is useful in analysing the outputs from the RCC method. Another feature of the RCC algorithm is that no prior reactor assumptions are necessary as the recommended reac- tor type(s) and their sequencing are determined by the algorithm. N-butane and oxygen are supplied together at the tube inlet of a shell and tube reactor at atmospheric pressure and at a temper- ature of 773K. The reactor tubes are packed with a V/MgO catalyst containing 24 wt% of V 2 O 5 . A side-stream of oxygen at a pressure of up to 6 atm inside the shell diffuses through the inert porous inor- ganic membrane tube wall to react with the hydrocarbons inside the tubes which are packed with the catalyst. Téllez et al. [8,9] used a SiO 2 -modified -Al 2 O 3 membrane tube wall to distribute oxygen to the V/MgO catalyst inside the tubes. The pressure inside the tubes was taken to be 1 atm. The partial pressure of oxygen to the reactor 0920-5861/$ – see front matter © 2010 Elsevier B.V. All rights reserved. doi:10.1016/j.cattod.2010.03.033
-
Upload
david-milne -
Category
Documents
-
view
213 -
download
0
Transcript of The oxidative dehydrogenation of n-butane in a differential side-stream catalytic membrane reactor
Tc
DC
a
AA
KARBOD
1
trcyebrflstp
dGo
crfl
S
0d
Catalysis Today 156 (2010) 237–245
Contents lists available at ScienceDirect
Catalysis Today
journa l homepage: www.e lsev ier .com/ locate /ca t tod
he oxidative dehydrogenation of n-butane in a differential side-streamatalytic membrane reactor
avid Milne ∗, Tumisang Seodigeng, David Glasser, Diane Hildebrandt, Brendon Hausbergerentre of Material and Process Synthesis, University of the Witwatersrand, Johannesburg, Private Bag 3, WITS 2050, South Africa
r t i c l e i n f o
rticle history:vailable online 27 April 2010
eywords:ttainable regionecursive Convex Control Policy Algorithmutanexidative dehydrogenation
a b s t r a c t
The synthesis of butenes and butadiene from the oxidative dehydrogenation of n-butane is a chemicalreaction of economic relevance and the choice of catalyst is of considerable importance. In this simulationexercise a V/MgO catalyst in a differential side-stream catalytic membrane reactor was studied.
The Recursive Convex Control (RCC) algorithm was used to determine the operating parametersrequired to determine the maximum yields of hydrocarbon products. The algorithm, in addition to select-ing for the duty a single differential side-stream catalytic membrane reactor (DSR) in preference to a CSTRand a PFR, also developed the profile for the optimal addition of oxygen along the length of the reactor.
ifferential side-stream reactor The maximum yield of butenes, all three isomers, was found to be 0.119 carbon mass fraction.The maximum yield of butadiene from the ODH of n-butane was found to be 0.799 carbon mass fraction.The rates of formation of hydrocarbon reactants and products are discussed.Statistical analyses of the ratios of formation rates of the butene isomers and of carbon dioxide to
carbon monoxide are presented.altertic da
The interplay betweenas the validity of the kine
. Introduction
The attainable region (AR) method uses geometrical principleso determine the multi-dimensional spatial region in which all theeactants and products for reaction systems with known kineticsan be found. The AR method can also be used to find the maximumield of product as well as the reactor types and configurations nec-ssary to yield any slate of products within this spatial region. It haseen shown by Feinberg and Hildebrandt [1] that only three basiceactor types, a continuously stirred tank reactor (CSTR), a plug-ow reactor (PFR) and a differential side-stream reactor (DSR), inuitable configurations, are sufficient to provide any yield of reac-ion products. In the absence of a complete sufficiency condition, aresumed AR is usually termed a candidate AR (ARC).
It is not the intention in this paper to describe AR theory inetail. Instead, the attention of the reader is directed to the work oflasser et al. [2,3] and Feinberg [4,5] for a comprehensive reviewf Attainable Region theory and practice.
Abbreviations: AR, attainable region; ARC, candidate attainable region; CSTR,ontinuously stirred tank reactor; DSR, differential side-stream catalytic membraneeactor; IMR, inert membrane reactor; ODH, oxidative dehydrogenation; PFR, plugow reactor; RCC, Recursive Convex Control algorithm.∗ Corresponding author at: 16 Rooibos Avenue, Allen Grove, Kempton Park 1619,
outh Africa. Tel.: +27 11 394 7683; fax: +27 11 717 7557.E-mail address: [email protected] (D. Milne).
920-5861/$ – see front matter © 2010 Elsevier B.V. All rights reserved.oi:10.1016/j.cattod.2010.03.033
native reaction routes for the formation of butadiene is reviewed as wellta at low oxygen partial pressures.
© 2010 Elsevier B.V. All rights reserved.
Recently the Recursive Convex Control (RCC) algorithm has beendeveloped and used successfully to analyse complex chemical reac-tions. These reactions, by virtue of many possible products, can beconsidered as possessing many dimensions to which can be addedthe further dimension of residence time. The RCC algorithm hasbeen proved to be capable of solving multi-dimensional problemsof a complexity previously considered too difficult to handle. Again,the characteristics of the RCC and its usage shall not be discussed indetail in this paper. Rather the attention of the reader is directed tothe work of Seodigeng [6,7] for an extensive description of its capa-bilities. Suffice it to say that the use of the RCC algorithm requiresno prior understanding of AR theory to use it successfully. However,knowledge of AR principles is useful in analysing the outputs fromthe RCC method. Another feature of the RCC algorithm is that noprior reactor assumptions are necessary as the recommended reac-tor type(s) and their sequencing are determined by the algorithm.
N-butane and oxygen are supplied together at the tube inlet ofa shell and tube reactor at atmospheric pressure and at a temper-ature of 773K. The reactor tubes are packed with a V/MgO catalystcontaining 24 wt% of V2O5. A side-stream of oxygen at a pressure ofup to 6 atm inside the shell diffuses through the inert porous inor-
ganic membrane tube wall to react with the hydrocarbons insidethe tubes which are packed with the catalyst. Téllez et al. [8,9] useda SiO2-modified �-Al2O3 membrane tube wall to distribute oxygento the V/MgO catalyst inside the tubes. The pressure inside the tubeswas taken to be 1 atm. The partial pressure of oxygen to the reactor
238 D. Milne et al. / Catalysis Toda
Fb
wt
piftb
ts
2
bnwcaDwytcinfioat
imact
ctsttatcs
ro
Fig. 2 is the two-dimensional projection of the ARC identified bythe RCC method for the ODH of n-butane to butenes.
Fig. 2 shows the extreme points of the profiles in mass fractionspace for the yield of butenes (sum of all three isomers) from theODH of n-butane as derived from the application of the RCC algo-
ig. 1. Reaction network for the oxidative dehydrogenation (ODH) of n-butane toutenes and butadiene.
as used as the primary control variable. The reaction network forhe ODH of n-butane [8,9] is shown in Fig. 1.
This reaction network clearly shows the complexity of the ODHrocess. Omitted from the scheme is the formation of water which
s present ab initio. Of particular interest are the two reaction routesor the oxidation of n-butane to butadiene, one direct and the otherhrough the synthesis of butenes and their subsequent oxidation toutadiene. We shall discuss this later in the paper.
The kinetic data for the system, rates of formation, kinetic equa-ions and data for the ODH of n-butane, 1-butene and butadiene arehown in Appendix A.
. Experimental
Our previous papers [10,11] showed that the maximum possi-le theoretical yields of butenes and butadiene from the ODH of-butane could be derived from an inert membrane reactor (IMR)here the oxygen partial pressure was maintained at a very low and
onstant value along the length of the reactor. In line with Attain-ble Region terminology we shall refer henceforth to this IMR as aSR. Whereas the ensuing IMR, i.e. DSR, was of an impractical sizehat did emerge from these studies were the theoretical maximum
ields of hydrocarbon products possible from the ODH process. Thishen presented the challenge of determining the necessary processonditions to achieve these maxima in a smaller reactor. Again,n our earlier papers, we began with considering only a DSR andeglected the possibility that a PFR (or even a CSTR), in some con-guration with a DSR, might prove to be a better option. That theptimal reactor configuration, without having to make any priorssumptions regarding reactor types, emerges from the analysis ofhe RCC results is one of the strengths of this tool.
With the reaction scheme in Fig. 1 there is a very large increasen the number of moles as the reaction proceeds. To use the AR
ethod with linear mixing laws, all hydrocarbon concentrationsre expressed in terms of mass fractions of carbon, the number ofarbon atoms remaining constant from the beginning to the end ofhe reaction.
In the ODH of n-butane, the reaction system comprises ninehemical species including oxygen and water. When residenceime is considered, the ODH of n-butane requires a 10-dimensionalpace for a complete description. In our earlier papers [10,11]he kinetic equations were applied to the nine species withinhe 10-dimensions from which two-dimensional projections werebstracted. Where extensions of these two-dimensional concen-ration spaces were possible, i.e. through the elimination of any
oncave areas, they were done solely within the two-dimensionalpaces and not by intrusion into higher dimensional hyperspaces.In an attempt to keep the paper as focussed as possible on theesults from the RCC tool, we have assumed an isothermal conditionf 773 K and a constant tube pressure of 1 atm. These assumptions
y 156 (2010) 237–245
also were applicable to our earlier papers [10,11] and the relevanceof the results from the RCC tool to those from the earlier papersdepended upon identical operating parameters. Non-isothermalheat transfer in the determination of attainable regions has beeninvestigated in particular by Hildebrandt et al. [12], Nicol et al. [13]and Godorr et al. [14].
In a recent paper, Milne et al. [15] have described in greaterdetail the application of the RCC method to the ODH of n-butaneand 1-butene.
3. Results
The RCC algorithm has been employed to identify candidateattainable regions (ARCs) and yields of hydrocarbon products forthe following reactions.
• Case 1: ODH of n-butane to form butenes (all three isomers).• Case 2: ODH of n-butane to form butadiene.
The partial pressure of oxygen in the feed was varied between85 kPa and a very low value and should a DSR be selected by the RCCalgorithm as one of the three possible reactors additional oxygenwould be supplied optimally along the length of the DSR so as toattain the profile of the ARC. This reactor configuration is styled acritical DSR [1,16].
The results of these calculations are values of concentrations interms of carbon mass fractions of the boundary values of a con-vex region in a higher dimensional space. In order to present theseresults in a way that is understandable to the reader we will presentgraphical results of two-dimensional projections in terms of thevariables of interest.
3.1. Case 1—ODH of n-butane to form butenes
In the ODH of n-butane to butenes, we have nine possible chem-ical substances. These include oxygen and water as well as theoxidation both of butane and butenes to butadiene, the latter inthis case being considered as an undesirable by-product. To thesenine substances, a tenth variable, residence time, can be added.
Our earlier paper [11] found that a butenes yield of 0.119 carbonmass fraction was the theoretical maximum yield possible from theODH of n-butane.
Fig. 2. Projection of the set of extreme points derived from the RCC profile for theODH of n-butane to butenes (sum of all three isomers) plotted in mass fraction space.

is Toda
rh
iotics
iluoc
mt0tcbDvOfo
sctv
ivblOwrt1
p0
Fi
these rate constants for 1-butene, cis-2-butene and trans-2-buteneare 1.9, 1.2 and 1.0 respectively.
In Fig. 5 we show the optimal control policy derived from theRCC algorithm for the distribution of oxygen along the length of the
D. Milne et al. / Catalys
ithm. Fig. 2 is a two-dimensional projection from a 10-dimensionalypersurface.
In our earlier paper [11], the outer bound of the profile shownn Fig. 2 was associated with an extremely low and constant valuef oxygen partial pressure. A very large and impractical residenceime also was required. The RCC method, as shall be shown latern this paper, attained the profile shown in Fig. 2 by judiciouslyontrolling the addition of the oxygen in the DSR resulting in aignificantly lower residence time.
The lower bound of the RCC profile in Fig. 2 corresponds to annitial oxygen partial pressure of 85 kPa and the upper bound to aow partial pressure value. Our previous paper [11] showed that thepper bounds of this region for constant oxygen partial pressuresf 0.25 kPa and an extremely low value were indistinguishable solose were they together.
Fig. 2 shows that at a low value of oxygen partial pressure theaximum yield of butenes (the sum of all three isomers, 1-butene,
rans-2-butene and cis-2-butene) from the ODH of n-butane is.119 carbon mass fraction and occurs at a n-butane concentra-ion of 0.623. The maximum yield from the lower bound is 0.103arbon mass fraction. We conclude that the maximum yields ofutenes are relatively insensitive to the partial pressure of oxygen.espite the reduction of this partial pressure from 85 kPa to a lowalue, the maximum yield of butenes increased by less than 16%.ur earlier paper [11] commented that the selectivity of butane
or the maximum yield of butenes is but slightly influenced by thexygen partial pressure.
Detailed analysis of the results from this RCC application (to behown later in this paper) confirmed that the outermost limit wasommensurate with a DSR to which the supply of oxygen was con-rolled according to a specific regimen (not necessarily a constantalue of 0.25 kPa.)
Fig. 3 is a breakdown of the upper bound of Fig. 2 to show thesomeric constituents and their contribution to the outer bound’salues. A characteristic of Fig. 3 is the preferential synthesis of 1-utene followed by cis-2-butene with trans-2-butene having the
owest rate of formation. In the absence of kinetic data for theDH of the individual isomers to carbon monoxide, carbon dioxide,ater and butadiene, we cannot exclude the possibility that the
eaction rate for the subsequent ODH of trans-2-butene exceedshat for cis-2-butene and the latter, in turn, is greater than that for
-butene.The maximum yields of the individual isomers at the low oxygenartial pressure mandated by the RCC method are 0.055, 0.035 and.029 carbon mass fractions respectively for 1-butene, cis-2-butene
ig. 3. Breakdown of Fig. 2 to show the individual profiles of the three butenesomers plotted in mass fraction space at a very low value of oxygen partial pressure.
y 156 (2010) 237–245 239
and trans-2-butene and are associated with a butane concentrationof 0.623 carbon mass fraction.
The selectivity of butane to butenes at any point of the profilein Fig. 2 is given by the ratio of its y-coordinate to the distance ofits horizontal projection on the x-axis from the feed point. Anotherway of saying this is that the selectivity at any point of the pro-file is equal to the tangent of the angle between the x-axis and aline from the feed point to the relevant point on the profile. It isclear from Fig. 2 that the maximum selectivity occurs at the feedpoint and thereafter diminishes. It retains a positive value until themaximum point of the profile is attained and then becomes nega-tive. The butane-butenes profile is convex over its entire perimeterand a property of a convex profile is the occurrence of maximumselectivity at the feed point.
The ratio of the yields of the three isomers, relative to trans-2-butene, was found to be constant over the spectrum of oxygenpartial pressures. The ratios of formation were found to be 1.9:1.2:1for 1-butene:cis-2-butene:trans-2-butene and are shown in Fig. 4.This is only to be expected. Referring to Table 2 in Appendix A atthe end of this paper, the rate expressions for the oxidation of n-butane to the three isomers of butene, r1, r2 and r3, are functions ofthe partial pressure of n-butane and the selective oxidation of thecatalyst sites, �0. What differentiates these rate expressions are therespective rate constants, k1, k2 and k3 (Table 3) and the ratios of
Fig. 4. Ratio of yields of butene isomers relative to trans-2-butene as functions ofoxygen partial pressre.
Fig. 5. RCC operational oxygen control policy for the maximum yield of butenesfrom the ODH of n-butane.

240 D. Milne et al. / Catalysis Today 156 (2010) 237–245
Fy
rtaofa
twrotant
t
atTTvpno
syo
ttdddc
biat
saT
ig. 6. RCC oxygen control policy as a function of residence time for the maximumield of butenes from the ODH of n-butane.
eactor as a function of the yield of butenes. Fig. 5, in effect, sayshat the initial partial pressure to the reactor should be 15.5 kPand should be held constant at this level by the addition of freshxygen until the yield of butenes has reached 0.025 carbon massraction. This implies that initially the reactor should be a DSR withpolicy of constant oxygen partial pressure.
Once the yield of butenes has attained 0.025 carbon mass frac-ion, there is a change in the oxygen partial pressure. It now starts toane from a value of 15.5 kPa to a low value. According to the RCC
esults, if the oxygen partial pressure along the remaining lengthf the DSR is controlled in this manner and allowed to be reducedo a low value, the maximum yield of butenes can be secured. Fig. 5lso shows that the maximum yield of butenes from the ODH of-butane is relatively insensitive to oxygen partial pressures lesshan 2 kPa.
Fig. 6 shows the calculated optimal control policy for the addi-ion of oxygen to the reactor as a function of residence time.
Fig. 6 shows that the partial pressure of oxygen is held constantt 15.5 kPa for approximately 0.5 s after which the oxygen is effec-ively allowed to be depleted at the controlled rate specified in Fig. 6.he total residence time for this critical DSR is approximately 100 s.he RCC results [15], Figs. 5 and 6 also showed that one can achieveirtually this maximum yield after 14 s when the oxygen partialressure has dropped to 2 kPa. This is because of the asymptoticature of the residence time profile close to this maximum valuef butenes.
Fig. 5 should be studied in conjunction with Fig. 6.Figs. 5 and 6 together show the operational control policy for the
upply of oxygen along the length of the reactor for maximising theield of the desired hydrocarbon product, butenes, from the ODHf n-butane.
Our use of the word control implies optimal control of thehermodynamic conditions, pressure, temperature, flow etc. forhe best reaction rates and yields of hydrocarbon product. Itoes not refer to process control where the instrumentation isesigned by suitable feed-back loops to regulate these thermo-ynamic conditions and to correct any deviation from the setonditions.
It is concluded that a DSR, the feed to which is a stream of n-utane and oxygen, the partial pressure of the latter being 15.5 kPa,
s capable of providing the maximum possible yield of butenes aftertotal residence time of 100 s provided the supply of oxygen along
he length of the DSR follows a defined pattern.However, it must be stated that our previous papers [11,15]
howed that with a residence time of 75 s, it was possible to achieveyield of butenes of 99.7% of the theoretical maximum possible.
he reactor configuration for this was a DSR with a constant oxy-
Fig. 7. Set of extreme points derived from the RCC profile for the ODH of n-butaneto butadiene in mass fraction space.
gen partial pressure of 0.25 kPa. If the reaction were truncated oncethe oxygen partial pressure had dropped to 2 kPa, i.e. after 14 s, theyield of butenes would be 0.116 carbon mass fraction or 97% of thetheoretical maximum.
We conclude that the controlled addition of oxygen to a DSR asshown in Figs. 5 and 6 effectively yields the theoretical maximumamount of butenes from the ODH of n-butane and can do so with thetotal depletion of the oxygen and within a residence time of 100 s.Alternatively, the RCC concept has confirmed that for a residencetime of 14 s, a carefully controlled oxygen addition policy and a finaloxygen partial pressure of 2 kPa it is possible to produce yields ofbutenes very close to the theoretical maximum quantity.
3.2. Case 2—ODH of n-butane to form butadiene
In our earlier paper [11] the theoretical maximum yield of buta-diene from the ODH of n-butane was found to be 0.800 carbon massfraction. All the initial feed of n-butane was effectively oxidised toproduce this quantity of butadiene.
Fig. 7 shows the RCC profiles in mass fraction space for the yieldof butadiene from the ODH of n-butane. It is a two-dimensional pro-jection from a ten-dimensional hypersurface. As in Case 1 for theproduction of butenes from n-butane, in developing these profilesthe RCC method considered all possible permutations and combi-nations of a CSTR, a PFR and a DSR to extend the profile to its furthestextreme. A single membrane DSR was identified as the reactor typerequired to develop the ARC shown in Fig. 7.
The RCC maximum yield of butadiene, 0.799 carbon mass frac-tion, was obtained when the initial n-butane effectively had beentotally oxidised. These concentrations agree with those shown ear-lier [11].
In our earlier paper [11], the outer bound of the profile shownin Fig. 7 was associated with an extremely low and constant valueof oxygen partial pressure. A very large and impractical residencetime also was required. The RCC method, as shall be shown later,attained the profile shown in Fig. 7 by judiciously controlling theaddition of oxygen to a DSR and with a significantly lower residencetime.
As discussed earlier in this paper the ARC is the convex hull of theextreme points. Thus, the marked concavity apparent in Fig. 7 indi-cates a hyper-plane covering a large region of space. It was removed
by mixing fresh feed, Point A, with product from Point B in variousratios, the locus for all the resulting outputs lying along the line AB.The ARC for the system n-butane and butadiene was bounded bythe two axes and the line AB. This region matched that identifiedin our earlier paper [11].
D. Milne et al. / Catalysis Today 156 (2010) 237–245 241
Fp
ftcpIsmpw
ti
t
totar
id
ali
t
Y
TM
ig. 8. Profiles of maximum selectivity of butane to butadiene at oxygen partialressures between 0.05 kPa and 85 kPa.
The butane:butadiene mass fraction profile is concave from theeed point, A, to a point B between the feed point and the zenith ofhe profile. At high values of oxygen partial pressure, point B lieslose to point A but with the reduction in oxygen partial pressure,oint B moves along the profile in the direction of the maximum.
t is a property of a concave profile that the point of maximumelectivity is coincident with point B. As discussed in Case 1, theaximum value of the selectivity occurs when the tangent at a
oint on the profile emanates from the feed point. That this is soas shown in our earlier paper [17].
Fig. 8 below is a detailed analysis of Fig. 7 and shows the rela-ionship between the maximum selectivity of butane to butadiene,.e. the tangent point, at several values of oxygen partial pressure.
In Table 1 we show the residence times and butane concentra-ions for the values of oxygen partial pressure identified in Fig. 8.
Also shown in Fig. 8 is the locus of selectivity maxima. Initially, ashe partial pressure of oxygen is reduced, the maximum selectivityf butane to butadiene increases rapidly with respect to residenceime. Below 0.25 kPa, this rate of increase slows and in the limitpproaches a value of 0.8 with a corresponding increase in theesidence time necessary to attain this value.
Fig. 9 shows the relationship between the maximum selectiv-ty of n-butane to butadiene and the oxygen partial pressure in aifferential side-stream membrane reactor.
At low values of oxygen partial pressure, the profile assumes ansymptotic characteristic and as the partial pressure tends to a veryow value the maximum selectivity tends to a value of 0.8. That thiss so can be seen from a scrutiny of Fig. 7.
A sixth-order polynomial curve (solid line) was found to givehe best fit to the calculated data (shown as circles).
The equation of this profile is
= 0.2854 + 0.7503X−1 − 0.6488X−2 + 0.2786X−3
−0.0576X−4 + 0.0052X−5 − 0.0001X−6
able 1aximum selectivity of n-butane to butadiene, residence time and butane concentration
Oxygen partial pressure (kPa) Maximum selectivity
85 0.292 0.521 0.600.5 0.670.25 0.710.1 0.750.05 0.77
Fig. 9. Profile of maximum selectivity of butane to butadiene at oxygen partialpressures from 0.05 kPa to 85 kPa.
where Y = maximum selectivity of butane to butadiene andX = oxygen partial pressure (kPa).
This equation is valid over the range of oxygen partial pressuresfrom 0.05 kPa to 85 kPa.
The RCC algorithm specified a total residence time of approx-imately 15 000 s to yield a butadiene concentration of 0.8 carbonmass fraction.
In our previous paper [11] we showed that a butadiene yieldof 0.665 carbon mass fraction or 83% of the theoretical maximumcould be obtained from a DSR with a constant oxygen partial pres-sure of 0.25 kPa and with a residence time of 322 s. At a constantoxygen partial pressure of 2 kPa, the maximum yield of butadienewas found to be 0.359 (45% of the theoretical maximum yield) withan associated residence time of 58 s.
It is apparent that unlike Case 1, the synthesis of butenes, themaximum yield of butadiene as illustrated in Fig. 10 is extremelysensitive to low oxygen partial pressures.
In Fig. 10 we show the control policy for the partial pressure ofoxygen as a function of the yield of butadiene. Fig. 10, in effect, saysthat the initial partial pressure to the reactor configuration shouldbe approximately 12 kPa and its partial pressure in the tubes shouldbe controlled according to this profile until the yield of butadienehas reached 0.8 carbon mass fraction.
Fig. 11 shows that after a residence time of approximately1000 s, the oxygen partial pressure has been reduced to 0.07 kPa, i.e.effectively depleted, with a consequential cessation in the furtheryield of butadiene.
It is clear from Fig. 11 that after approximately 300 s, the oxy-gen added is only sufficient to keep its partial pressure in thetubes at a very low value and in effect only that which is requiredto compensate for the oxygen depleted during the oxidation
process.It is concluded that a maximum butadiene yield of 0.8 carbonmass fraction can be obtained from a DSR where the addition ofoxygen is rigorously controlled. The total residence time for this
for values of oxygen partial pressure.
Residence time (s) Butane concentration, carbon mass fraction
34 0.6834 0.4166 0.30
130 0.20254 0.12613 0.06
1 198 0.03

242 D. Milne et al. / Catalysis Today 156 (2010) 237–245
Ft
yiom0rpba
bp
t8oc(tcfttabra
Fy
of constant oxygen partial pressure.
ig. 10. RCC operational control policy for the maximum yield of butadiene fromhe ODH of n-butane.
ield, according to the RCC algorithm, is 15 000 s. However, accord-ng to the RCC algorithm, at a residence time of 1000 s, the yieldf butadiene is 0.745 carbon mass fraction, 93% of the theoreticalaximum. With a residence time of 332 s, the butadiene yield is
.665 carbon mass fraction, 83% of the theoretical maximum. If theeaction were ended after 32 s, by which time the oxygen partialressure had been reduced to 2 kPa, the yield of butadiene woulde 0.3 carbon mass fraction of 37% of the theoretical maximummount.
In Figs. 12 and 13, we show the rates of formation of butane,utene (all three isomers) and butadiene at constant oxygen partialressure values of 85 kPa and 0.25 kPa.
Scrutiny of Fig. 12 shows that the rates of formation of thehree isomers of butene at a constant oxygen partial pressure of5 kPa initially decline and become negative after a residence timef approximately 40 s. The three isomeric rates of formation are solose together that they cannot be identified separately in Fig. 12and in Fig. 13). After this milestone all the butenes resulting fromhe ODH of butane are oxidised to butadiene, carbon monoxide,arbon dioxide and water at a rate greater than their formationrom the oxidation of n-butane. In the case of butadiene, initiallyhere is a growth pattern and a peak is attained after a residence
ime of approximately 5 s. The rate of formation becomes negativefter 110 s as the butadiene is oxidised to carbon monoxide, car-on dioxide and water. At an oxygen partial pressure of 85 kPa, theeaction effectively has ceased after a residence time of 1000 s asll the hydrocarbons have been deep oxidised to carbon monoxide,ig. 11. RCC oxygen control policy as a function of residence time for the maximumield of butadiene from the ODH of n-butane.
Fig. 12. Rates of formation of butane, butenes, butadiene at a constant oxygen partialpressure of 85 kPa.
carbon dioxide and water. All the butane has been oxidised afterapproximately 500 s.
Fig. 13 shows a similar pattern to Fig. 12. At a constant oxygenpartial pressure of 0.25 kPa, the rates of formation of the buteneisomers become negative after a residence time of 60 s as a conse-quence of oxidation to butadiene, carbon monoxide, carbon dioxideand water. The initial rate of formation of butadiene reaches a max-imum after approximately 90 s and becomes negative after 320 s.Thereafter, the rate of formation of butadiene essentially staysconstant at a negative value of 0.002 mol/kg s until 1250 s wheneffectively it is completely oxidised to carbon monoxide, carbondioxide and water. The chemical reaction effectively has ceasedafter 1250 s. All the butane has been oxidised after approximately500 s.
In Fig. 4, we showed that the ratios of the yields of 1-butene,cis-2-butene to trans-2-butene were constant over the spectrumof oxygen partial pressures from 85 kPa to 0.05 kPa. In Fig. 14 weshow that a similar constancy is applicable to the generation ofcarbon monoxide and carbon dioxide.
In Fig. 14 the mean of the ratios of the moles of carbon dioxideto carbon monoxide at each value of residence time for each value
The data plotted in Fig. 14 represent the mean values of theCO2:CO ratio at each oxygen partial pressure over the full gamut ofresidence time. Superimposed upon Fig. 14 are the minimum and
Fig. 13. Rates of formation of butane, butenes and butadiene at a constant oxygenpartial pressure of 0.25 kPa.

D. Milne et al. / Catalysis Toda
Fig. 14. Molar ratio of yields of carbon dioxide relative to carbon monoxide asfunction of constant oxygen partial pressure.
F
mplmrcp1
op
pmsitsp
pcoOr
T
ig. 15. Standard deviation of the molar ratio of carbon dioxide to carbon monoxide.
aximum values of the carbon dioxide ratio at each oxygen partialressure. The minimum and maxima values are shown as broken
ines. The fact that the mean values are almost coincident with theaximum values despite significantly lower minimum values is a
eflection of the consistency of the data. The ratio of formation ofarbon dioxide to carbon monoxide over the spectrum of oxygenartial pressures is 3.5 with a slight increase from 20 kPa to 3.6 atkPa and thereafter declining to 3.4 at 0.05 kPa.
As an adjunct to Fig. 14, Fig. 15 shows the standard deviationf the carbon dioxide ratio around its mean value for each oxygenartial pressure.
Figs. 14 and 15 show that over the range of oxygen partialressures from 85 kPa to 20 kPa, the mean value of the ratio of for-ation of carbon dioxide to carbon monoxide is 3.5 with a declining
tandard deviation from 0.055 to 0.026. Below 20 kPa, the rationcreases to 3.6 (standard deviation of 0.06) at 1 kPa and reducingo 3.4 at 0.05 kPa with a standard deviation of 0.166. The minimumtandard deviation of the carbon dioxide ratio occurs at an oxygenartial pressure of 16 kPa.
Finally, we wish to comment upon the priority of the alternativeaths for the synthesis of butadiene. Referring to Fig. 1, butadienean be produced either by the direct oxidative dehydrogenationf n-butane or via the production of butenes and their subsequent
DH to butadiene. The question is posed as to which of the twoeaction paths predominates?The rate expressions for the ODH of n-butane are shown in
able 2. For the production of the butene isomers and butadiene,
y 156 (2010) 237–245 243
all these rate expressions are a function of the partial pressure of n-butane and of the selective oxidation catalyst sites, �0 (Appendix A).When we compare the ratio of the rate expressions for the two reac-tion paths, the relevant oxygen partial pressures and the oxidationcatalyst site expressions cancel each other and we are left with theratio of the respective rate constants, ki. The ratio of (k1 + k2 + k3)to k4 is 4.4 and is independent of the reactor’s operating condi-tions. This means that for every mole of n-butane that is directlysynthesised to butadiene, 4.4 moles are oxidised to butenes andsubsequently to butadiene.
4. Validity of kinetic data
The main thrust of this simulation study was to use the Recur-sive Convex Control (RCC) algorithm to determine the attainableregions, maximum yields and the optimal reactor configuration forthe synthesis of butenes and butadiene from the ODH of n-butane.Another reason for using the RCC algorithm was to establish themost favourable reactor operating conditions commensurate withreasonable residence times. What did emerge from his study wasthe utilisation of low oxygen partial pressures to achieve these ends.
Several authors have expressed opinions, either directly or indi-rectly, on the validity of kinetic data when applied at low partialpressures of oxygen. Dixon [19] commented that for a reactor, typ-ically of a shell-and-tube configuration, where a reactant is addedto the stream of reactants and products the apparently favourablekinetics quoted in the literature might well be unfavourable at thelower partial pressures of the added reactant that seem necessaryfor the maximisation of the desired product.
The experiments conducted by Téllez et al. [8] on a V/MgO cat-alyst seemingly spanned a range of oxygen partial pressures from2 to 10 kPa. Later papers by Téllez et al. [9,20] quoted molar ratiosfor oxygen to n-butane of 0.5–6 and furthermore pointed out thatoxygen-rich and oxygen-lean conditions can change the natureof the catalyst significantly. Assabumrungrat et al. [18] in theirresearch paper used an air to n-butane ratio of 8 in the reactantfeed as the standard condition but their experiments were carriedout over a range of air ratios between 1 and 15. This ratio range cor-responds to oxygen to n-butane molar ratios of 0.2–3. These limits,in turn, correspond to initial oxygen partial pressures of 18–76 kPa.Cortés et al. [21] studied the kinetics of a modified V/MgO cat-alyst in a fluidised-bed reactor under anaerobic conditions andclaimed an improvement in the selectivity of butane to butenes andbutadiene.
We have found that the yield of butenes seemingly is unaffectedby low oxygen partial pressures since yields close to the theoreticalmaximum are feasible at an oxygen partial pressure of 2 kPa, thisbeing the lower limit used by Téllez et al. (Fig. 5). This is not the casein the synthesis of butadiene where the yield is highly sensitive tothe oxygen partial pressure (Fig. 10).
Whereas we are not concerned unduly with the higher valuesof oxygen partial pressure, the kinetic data used in this study atlow oxygen partial pressures require corroboration or, if foundwanting, replaced with data that, like Caesar’s wife, are abovesuspicion.
This simulation study, inter alia, has emphasised the importancelow oxygen partial pressures and, a fortiori, the need for reliablekinetic data under these conditions. Consequently, the validity ofour kinetic data at low oxygen partial pressures must be taken asbeing unproven and of qualified applicability.
5. Conclusions
The attainable region analysis of the ODH of n-butane and 1-butene has been undertaken using the Recursive Convex Control

2 is Today 156 (2010) 237–245
(uam
bbotr
co
f
p
A
rr
a
�
� + 11
abctb
arv
uA
Table 2Chemical reactions and rate expressions for the oxidative dehydrogenation of n-butane to butene and butadiene.
Reaction Rate expression
Oxidation of n-butaneC4H10 + 1/2O2 → 1-C4H8 + H2O (1) r1 = k1PC4H10 �0
C4H10 + 1/2O2 → Trans-2-C4H8 + H2O (2) r2 = k2PC4H10 �0
C4H10 + 1/2O2 → Cis-2-C4H8 + H2O (3) r3 = k3PC4H10 �0
C4H10 + O2 → C4H6 + 2H2O (4) r4 = k4PC4H10 �0
C4H10 + 9/2O2 → 4CO + 5H2O (5) r5 = k5PC4H10 �0
C4H10 + 13/2O2 → 4CO2 + 5H2O (6) r6 = k6PC4H10 �0
Oxidation of 1-butene1-C4H8 + 1/2O2 → C4H6 + H2O (7) r7 = k7PC4H8 �0
1-C4H8 + 4O2 → 4CO + 4H2O (8) r8 = k8PC4H8 �0
1-C4H8 + 6O2 → 4CO2 + 4H2O (9) r9 = k9PC4H8 �0
Oxidation of butadieneC4H6 + 7/2O2 → 4CO + 3H2O (10) r10 = k10PC4H6 �0
C4H6 + 11/2O2 → 4CO2 + 3H2O (11) r11 = k11PC4H6 �0
TR
44 D. Milne et al. / Catalys
RCC) algorithm. Whereas earlier simplistic approaches dependedpon a starting premise of a specific reactor configuration, the RCClgorithm does not and the optimal reactor configuration for attain-ent of the ARC emerges from the algorithm as an output.The simulation study shows that for the ODH of n-butane to
utenes and butadiene a differential side-stream catalytic mem-rane reactor with predefined control patterns for the addition ofxygen can result in yields of hydrocarbon product close to theheoretical maxima. Yields of butenes, in contrast to butadiene, areelatively unaffected by low values of oxygen partial pressure.
Ratios of formation of butene isomers and carbon dioxide toarbon monoxide were shown to be constant over a wide range ofxygen partial pressures.
The synthesis of butenes from the ODH of n-butane proceedsaster than the direct synthesis of butadiene by a factor of 4.4.
The validity of the kinetic data at low values of oxygen partialressure remains unproven and requires corroboration.
ppendix A.
Téllez et al. [8,9] identified the independent balanced chemicaleactions involved in the ODH (Fig. 1) of butane and their associatedate expressions as:
In Table 2, �0 and �0 refer to the oxidation of catalyst sites andre defined as:
Selective oxidation catalyst sites
0 = 2k12poxygen
2k12poxygen + (k1 + k2 + k3 + 2k4)pbutane + k7pbutenes
Non-selective oxidation catalyst sites
0 = 2k13poxygen
2k13poxygen + (9k5 + 3k6)pbutane + (8k8 + 2k9)pbutenes + (7k10
X and Z refer to the reduced active sites of the catalyst.X0 and Z0 refer to the oxidised active sites of the catalyst.pi is the partial pressure of the subscripted species, i, atm.The rate expressions presented by Téllez et al. [8,9] indicate
dependency upon the partial pressures of butane, butene andutadiene and the selective (�0) and non-selective (�0) oxidationatalyst sites respectively. The latter two, in turn, are functions ofhe partial pressure of oxygen and of the partial pressures of butane,utene and butadiene.
Because the partial pressure of oxygen influences the selectivend non-selective oxidation catalyst sites which in turn affects the
ate expressions it was adopted as the primary independent controlariable.The kinetic data for the system n-butane:butenes:butadienesed in this study were taken from Téllez et al. [8,9] and fromssabumrungrat et al. [18] and are shown in Table 3.
able 3ate constants and activity coefficients from Téllez et al. [8,9] and Assabumrungrat et al.
Reaction Rate constant, kio (m
C4H10 + 1/2O2 → 1-C4H8 + H2O 62.33 × 10⁻³
C4H10 + 1/2O2 → Trans-2-C4H8 + H2O 32.83 × 10⁻³
C4H10 + 1/2O2 → Cis-2-C4H8 + H2O 39.67 × 10⁻³
C4H10 + O2 → C4H6 + 2H2O 30.83 × 10⁻³
C4H10 + 9/2O2 → 4CO + 5H2O 9.17 × 10⁻³
C4H10 + 13/2O2 → 4CO2 + 5H2O 25.83 × 10⁻³
C4H8 + 1/2O2 → C4H6 + H2O 685.0 × 10⁻³
C4H8 + 4O2 → 4CO + 4H2O 32.33 × 10⁻³
C4H8 + 6O2 → 4CO2 + 4H2O 115.67 × 10⁻³
C4H6 + 7/2O2 → 4CO + 3H2O 118.17 × 10⁻³
C4H6 + 11/2O2 → 4CO2 + 3H2O 435 × 10−3
O2 + 2X → 2X0 2995 × 10−3
O2 + 2Z → 2Z0 3255 × 10−3
k11)pbutadiene
Oxidation and reduction of catalyst sitesO2 + 2X → 2X0 (12) r12 = k12PO2 (1 − �0)O2 + 2Z → 2Z0 (13) r13 = k13PO2 (1 − �0)
The rate constant, ki = kio exp(−(Eai/R)(1/T − 1/T0)), whereT0 = 773 K.
The equations for rates of formation, r1 to r9, of the severalspecies are:
n-Butane
r1 = −((k1 + k2 + k3 + k4)�0 + (k5 + k6)�0)pbutane
Oxygen
a1 = ((k1 + k2 + k3 + k4)�0 + (9k5 + 13k6)�0)0.5pbutanea2 = (k7�0 + 8k8�0)0.5pbutenes + 12 × 0.5k9pbutenes�0a3 = (7k10 + 11k11)0.5�0pbutadienea4 = (k12(1 − �0) + k13(1 − �0))0.5poxygen
r2 = −(a1 + a2 + a3 + a4)
1-Butene
r3 = (k1pbutane − k7p1-butene)�0 − (k8 + k9)p1-butene�0
Trans-2-butene
r4 = (k2pbutane − k7ptrans-2-butene)�0 − (k8 + k9)ptrans-2-butene�0
[18].
ol/kg s) Activity coefficient, Eai (kJ/mol)
144.9142.7139.1148.5175.5138.4164.7146.2107.2146.6102.0114.5
5.5
is Toda
r
r
r
r
r
0)
sst
R
[
[
[
[
[
[
[
[
[
[19] A.G. Dixon, Catalysis, vol. 14, The Royal Society of Chemistry, 1999, pp. 40–
D. Milne et al. / Catalys
Cis-2-butene
5 = (k3pbutane − k7pcis-2-butene)�0 − (k8 + k9)pcis-2-butene�0
Butadiene
6 = (k4pbutane + k7pbutenes)�0 − (k10 + k11)pbutadiene�0
Carbon monoxide
7 = 4(k5pbutane�0 + k8pbutenes�0 + k10pbutadiene�0)
Carbon dioxide
8 = 4(k6pbutane�0 + k9pbutenes�0 + k11pbutadiene�0)
Water
9 = (k1 + k2 + k3 + 2k4)pbutane�0 + 5(k5 + k6)pbutane�0
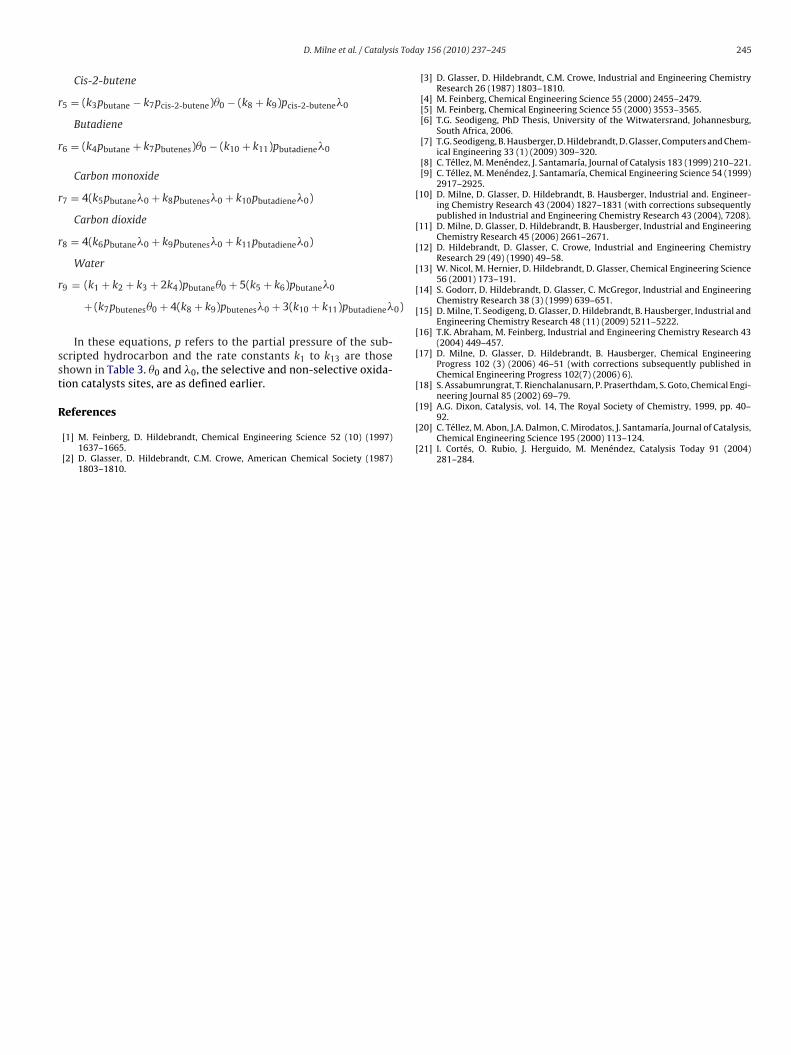
+ (k7pbutenes�0 + 4(k8 + k9)pbutenes�0 + 3(k10 + k11)pbutadiene�
In these equations, p refers to the partial pressure of the sub-cripted hydrocarbon and the rate constants k1 to k13 are thosehown in Table 3. �0 and �0, the selective and non-selective oxida-ion catalysts sites, are as defined earlier.
eferences
[1] M. Feinberg, D. Hildebrandt, Chemical Engineering Science 52 (10) (1997)1637–1665.
[2] D. Glasser, D. Hildebrandt, C.M. Crowe, American Chemical Society (1987)1803–1810.
[
[
y 156 (2010) 237–245 245
[3] D. Glasser, D. Hildebrandt, C.M. Crowe, Industrial and Engineering ChemistryResearch 26 (1987) 1803–1810.
[4] M. Feinberg, Chemical Engineering Science 55 (2000) 2455–2479.[5] M. Feinberg, Chemical Engineering Science 55 (2000) 3553–3565.[6] T.G. Seodigeng, PhD Thesis, University of the Witwatersrand, Johannesburg,
South Africa, 2006.[7] T.G. Seodigeng, B. Hausberger, D. Hildebrandt, D. Glasser, Computers and Chem-
ical Engineering 33 (1) (2009) 309–320.[8] C. Téllez, M. Menéndez, J. Santamaría, Journal of Catalysis 183 (1999) 210–221.[9] C. Téllez, M. Menéndez, J. Santamaría, Chemical Engineering Science 54 (1999)
2917–2925.10] D. Milne, D. Glasser, D. Hildebrandt, B. Hausberger, Industrial and. Engineer-
ing Chemistry Research 43 (2004) 1827–1831 (with corrections subsequentlypublished in Industrial and Engineering Chemistry Research 43 (2004), 7208).
11] D. Milne, D. Glasser, D. Hildebrandt, B. Hausberger, Industrial and EngineeringChemistry Research 45 (2006) 2661–2671.
12] D. Hildebrandt, D. Glasser, C. Crowe, Industrial and Engineering ChemistryResearch 29 (49) (1990) 49–58.
13] W. Nicol, M. Hernier, D. Hildebrandt, D. Glasser, Chemical Engineering Science56 (2001) 173–191.
14] S. Godorr, D. Hildebrandt, D. Glasser, C. McGregor, Industrial and EngineeringChemistry Research 38 (3) (1999) 639–651.
15] D. Milne, T. Seodigeng, D. Glasser, D. Hildebrandt, B. Hausberger, Industrial andEngineering Chemistry Research 48 (11) (2009) 5211–5222.
16] T.K. Abraham, M. Feinberg, Industrial and Engineering Chemistry Research 43(2004) 449–457.
17] D. Milne, D. Glasser, D. Hildebrandt, B. Hausberger, Chemical EngineeringProgress 102 (3) (2006) 46–51 (with corrections subsequently published inChemical Engineering Progress 102(7) (2006) 6).
18] S. Assabumrungrat, T. Rienchalanusarn, P. Praserthdam, S. Goto, Chemical Engi-neering Journal 85 (2002) 69–79.
92.20] C. Téllez, M. Abon, J.A. Dalmon, C. Mirodatos, J. Santamaría, Journal of Catalysis,
Chemical Engineering Science 195 (2000) 113–124.21] I. Cortés, O. Rubio, J. Herguido, M. Menéndez, Catalysis Today 91 (2004)
281–284.


![Reforming and oxidative dehydrogenation of ethane with · PDF file4 . and catalyst deactivation. [2] Other reactions of CO 68 2 and ethane include oxidative dehydrogenation of 69 ethane](https://static.fdocuments.in/doc/165x107/5a78c98c7f8b9ae6228cf3f2/reforming-and-oxidative-dehydrogenation-of-ethane-with-and-catalyst-deactivation.jpg)


