The Outlook for the Broadcast Networks - CBS Corporation
127
Outlook For The Broadcast Networks David Poltrack - December 5, 2011 UBS 39th Annual Global Media and Communications Conference 1 Good Morning. First, the required preamble. UBS 39TH ANNUAL GLOBAL MEDIA AND COMMUNICATIONS CONFERENCE David F. Poltrack David F. Poltrack Chief Research Officer, CBS Corporation Chief Research Officer, CBS Corporation President, CBS Vision President, CBS Vision The Outlook The Outlook for the Broadcast Networks for the Broadcast Networks
Transcript of The Outlook for the Broadcast Networks - CBS Corporation

Outlook For The Broadcast Networks David Poltrack - December 5, 2011
UBS 39th Annual Global Media and Communications Conference 1
Good Morning. First, the required preamble.
UBS 39TH ANNUAL GLOBAL MEDIA AND COMMUNICATIONS CONFERENCE
David F. PoltrackDavid F. PoltrackChief Research Officer, CBS CorporationChief Research Officer, CBS CorporationPresident, CBS VisionPresident, CBS Vision
The Outlook The Outlook for the Broadcast Networks for the Broadcast Networks

Outlook For The Broadcast Networks David Poltrack - December 5, 2011
UBS 39th Annual Global Media and Communications Conference 2
The Cautionary Statement Regarding Forward-Looking Statements.
2
CAUTIONARY STATEMENT REGARDING FORWARD-LOOKING STATEMENTSThis presentation may include "forward-looking statements" within the meaning of section 27A of the Securities Act of 1933 and section 21E of the Securities Exchange Act of 1934. Forward-looking statements inherently involve risks and uncertainties that could cause actual results to differ materially from the forward-looking statements including those due to changes in economic, business, competitive, technological, strategic and/or regulatory factors, and other factors affecting the operations of the entities' businesses described herein including, without limitation, of CBS Corporation. Such entities' news releases and filings with the Securities and Exchange Commission including, but not limited to, their respective most recent Forms 10-K, 10-Q and 8-K contain a more detailed description of factors that could affect future results. The forward-looking statements are made only as of the date of the presentation and we do not undertake to update any forward-looking statements to reflect subsequent events or circumstances.

Outlook For The Broadcast Networks David Poltrack - December 5, 2011
UBS 39th Annual Global Media and Communications Conference 3
My theme this morning will be that broadcast network television not only remains a the dominant mass medium today but that it has enhanced its mass medium status by…
UBS 39TH ANNUAL GLOBAL MEDIA AND COMMUNICATIONS CONFERENCE
David F. PoltrackDavid F. PoltrackChief Research Officer, CBS CorporationChief Research Officer, CBS CorporationPresident, CBS VisionPresident, CBS Vision
The Outlook The Outlook for the Broadcast Networks for the Broadcast Networks

Outlook For The Broadcast Networks David Poltrack - December 5, 2011
UBS 39th Annual Global Media and Communications Conference 4
…Amassing viewers through new distribution channels. Let’s start with the short-term outlook.
Broadcast Network Television:Broadcast Network Television:The AThe Amassmassing Mediuming Medium
4

Outlook For The Broadcast Networks David Poltrack - December 5, 2011
UBS 39th Annual Global Media and Communications Conference 5
Before presenting the Outlook for 2012, I will review my 2011 forecast from last year.
The OutlookThe OutlookOutlook for 2012Outlook for 2012
Review of forecast for 2011Review of forecast for 2011
5

Outlook For The Broadcast Networks David Poltrack - December 5, 2011
UBS 39th Annual Global Media and Communications Conference 6
My original forecast for 2011 called for a gain of 3.4% in broadcast network television advertising revenues. Since this was a non-Olympic year, adjusting for the 2010 Olympics yields an underlying gain of 5.0%.
Original 2011 ForecastOriginal 2011 Forecast
Network Television Ad RevenuesNetwork Television Ad Revenues +3.4%+3.4%Underlying Growth RateUnderlying Growth Rate +5.0%+5.0%
6

Outlook For The Broadcast Networks David Poltrack - December 5, 2011
UBS 39th Annual Global Media and Communications Conference 7
At this time last year, we were fairly confident that we were on the road to recovery but less confident regarding the pace of that recovery. Moving forward to the present time, we remain confident that we are still on the road to recovery and still less confident about the pace of that recovery.
The OutlookThe OutlookOutlook for 2012Outlook for 2012
Review of forecast for 2011Review of forecast for 2011The economic picture turns hazyThe economic picture turns hazy
7

Outlook For The Broadcast Networks David Poltrack - December 5, 2011
UBS 39th Annual Global Media and Communications Conference 8
The recent recession was characterized by a significant shift inthe ratio of savings and spending among consumers, with consumers reacting to the loss in value of their 401K plans and their homes by increasing their rate of savings. This year that trend was reversed. The rate of consumer savings is down and consumer spending is increasing in real terms. Based on the early holiday sales, this trend appears to be continuing. In fact, the private part of the economy looks strong. The drag on the recovery is in the government sector. Government spending is down due to the national and local budget crises. This is the missing element relative to the previous recovery which was stimulated by increased spending from the government sector. This is also what is keeping the unemployment level so high. While the current government crisis and the problems in Europe will remain a drag on the recovery, we believe that consumer spending will continue to increase, fueling that recovery.
The OutlookThe OutlookOutlook for 2012Outlook for 2012
Review of forecast for 2011Review of forecast for 2011The economic picture turns hazyThe economic picture turns hazy
Savings down/Spending upSavings down/Spending upPrivate sector strengtheningPrivate sector strengtheningGovernment sector weakGovernment sector weak
8

Outlook For The Broadcast Networks David Poltrack - December 5, 2011
UBS 39th Annual Global Media and Communications Conference 9
The positive signs in the economy in the first half of 2011 led to a very strong scatter market which, in turn, led to a strong 2011-2012 Upfront Market. This was also in line with my original forecast. However, the difficulties in Washington and the growing European problems have created uncertainty on the economic horizon. This has led to some concern on the part of advertisers. While scatter prices for the 4th Quarter remain above Upfront, advertisers are moving cautiously. Marketers want to get out infront, but not too far out in front, of the consumer as that consumer increases spending. Some of them are now holding back as the calendar year closes due to the continued economic uncertainty and the normal last minute efforts to reach their full-year financial goals.
The Current MarketThe Current MarketStrong Upfront MarketStrong Upfront MarketCautious Scatter MarketCautious Scatter Market
9

Outlook For The Broadcast Networks David Poltrack - December 5, 2011
UBS 39th Annual Global Media and Communications Conference 10
Despite the impact of these factors, I still expect the full year 2011 gain to equal my original 3.4% estimate and 5.0% underlying growth rate, adjusting for the 2010 Olympics.Which brings us to 2012.
Current 2011 ForecastCurrent 2011 Forecast
Network Television Ad RevenuesNetwork Television Ad Revenues +3.4%+3.4%Underlying Growth RateUnderlying Growth Rate +5.0%+5.0%
10

Outlook For The Broadcast Networks David Poltrack - December 5, 2011
UBS 39th Annual Global Media and Communications Conference 11
I am going to stay with my original 2011 underlying growth rate of 5.0% through 2012. Adjusting for the 2012 Summer Olympics, that brings the total ad revenue growth for the four broadcast networks in 2012 to 7.3%. I would use the analogy of a NASCAR race to describe the current television advertising market. The latest economic setbacks have resulted in the advertisers operating under a “caution” flag during the 4th Quarter of 2011. They are jockeying for position, conserving fuel, and fine-tuning their race strategies, but no one has dropped out of the race. As soon as the economic clouds clear and the green flag is given, they will begin competing at full throttle to capture a share of the increased consumer spending. The only question is when they will see that green flag.
2012 Forecast2012 Forecast
Network Television Ad RevenuesNetwork Television Ad Revenues +7.3%+7.3%Underlying RateUnderlying Rate +5.0%+5.0%
11
Outlook For The Broadcast Networks David Poltrack - December 5, 2011
UBS 39th Annual Global Media and Communications Conference 12
Meanwhile, the fundamentals for the broadcast networks are very strong. Starting with their season-to-date performance.
The OutlookThe OutlookOutlook for 2012The Audience SituationThe Audience SituationThe Competition from CableThe Election Year ImpactThe Summer Olympics
12

Outlook For The Broadcast Networks David Poltrack - December 5, 2011
UBS 39th Annual Global Media and Communications Conference 13
As is the case every year, the networks’ ability to capitalize on any increased market demand will be affected by the audience delivery of their programming and the degree to which they avoidaccumulating a significant amount of audience deficiencies with their upfront advertisers. Let’s see how they are doing.
The OutlookThe OutlookOutlook for 2012Outlook for 2012The Audience SituationThe Audience Situation
Audience DeficienciesAudience Deficiencies
13

Outlook For The Broadcast Networks David Poltrack - December 5, 2011
UBS 39th Annual Global Media and Communications Conference 14
First, looking from the viewers’ perspective, we see a positive picture for three of the four major broadcast networks in Live+7day program ratings.
Primetime Primetime –– YearYear--OverOver--YearYear20112011--12 Season12 Season--toto--Date Date –– Live+7Live+7
Source: Nielsen NPM. 9/19/11-11/13/11 vs. 9/20/10-11/14/10; Primetime, All Programs; Live+7 Data
14
+6%
-6%
+3%+3% +1%
+21%
+4%
-6%
+27%
+6%
-7%
+23%+22%
-8%
+3% n.c.
CBS NBC ABC FOXHomes Viewers A25-54 A18-49

Outlook For The Broadcast Networks David Poltrack - December 5, 2011
UBS 39th Annual Global Media and Communications Conference 15
Overall, the four networks are up on a total audience and key demographic basis.
Primetime 4Primetime 4--Network TotalsNetwork Totals20112011--12 Season12 Season--toto--Date Date –– Live+7Live+7
15
+6% +7% +6%+2%
4-NETWORKSHomes Viewers A25-54 A18-49
Source: Nielsen NPM. 9/19/11-11/13/11 vs. 9/20/10-11/14/10; Primetime, All Programs; Live+7 Data

Outlook For The Broadcast Networks David Poltrack - December 5, 2011
UBS 39th Annual Global Media and Communications Conference 16
Switching to the advertiser’s perspective and the all-important C3 currency measure, we see two of the four networks posting gains and two posting declines. The higher percentage gains shown here for FOX are a function of the big gain from a seven-game World Series which has a low ratio of playback to live viewing.
Primetime Primetime –– YearYear--OverOver--YearYear20112011--12 Season12 Season--toto--Date Date –– ““C3C3””
+4%
-6%
+3%
-2%
+46%
+2%
-7%
+38%
+3%
-6%
+31%
-1%
+45%
-5% -5% -6%
CBS NBC ABC FOXHomes Viewers A25-54 A18-49
16
Source: Nielsen NPM. 9/19/11-11/13/11 vs. 9/20/10-11/14/10; Primetime, All Programs; Live+3 Commercial Data

Outlook For The Broadcast Networks David Poltrack - December 5, 2011
UBS 39th Annual Global Media and Communications Conference 17
Collectively, the four networks are up in Total Viewers and in the key demos. So, on an overall basis, we do not see the network market being negatively affected by a significant audience deficiency problem. But that is on an overall basis. We all know that the broadcast networks’ leverage in the ad market is derived, to a large extent, by the demand for their top programs. When we look at just the top programs, the results for the networks are even stronger.
Primetime 4Primetime 4--Network TotalsNetwork Totals20112011--12 Season12 Season--toto--Date Date vs. Year Ago vs. Year Ago –– ““C3C3””
+8% +8% +5% +5%
Homes Viewers A25-54 A18-49
17
Source: Nielsen NPM. 9/19/11-11/13/11 vs. 9/20/10-11/14/10; Primetime, All Programs; Live+3 Commercial Data

Outlook For The Broadcast Networks David Poltrack - December 5, 2011
UBS 39th Annual Global Media and Communications Conference 18
Whether you focus on the top ten programs or the broader top twenty programs, on a key demo basis, season-to-season gains for both Live+7 or C3 measures reflect that the top network programs are, collectively, performing better than last year. In other words, the “big money” shows are performing well.
Primetime Primetime –– Top Show PerformanceTop Show Performance20112011--12 Season12 Season--toto--DateDate vs. Year Ago vs. Year Ago –– Live+7 and Live+7 and ““C3C3””
+3%
-1%
+4%+1% +1% n.c.
+11% +8% +5%+12% +9% +8%
n.c.
-2%
+7% +9%
Live+7 C3 Live+7 C3Homes Viewers A25-54 A18-49
Source: Nielsen NPM. 9/19/11-11/6/11 vs. 9/20/10-11/7/10; All Programs; Live+7 and Live+3 Commercial Data
Top 10Top 10 Top 20Top 20
18

Outlook For The Broadcast Networks David Poltrack - December 5, 2011
UBS 39th Annual Global Media and Communications Conference 19
The key to the long term success of a broadcast network is its ability to re-generate its primetime line-up with new franchise programs to replace key aging hit programs.This season the networks have been quite successful in developing promising new series.
The OutlookThe OutlookOutlook for 2012Outlook for 2012The Audience SituationThe Audience Situation
Audience DeficienciesAudience DeficienciesNew ProgramsNew Programs
19

Outlook For The Broadcast Networks David Poltrack - December 5, 2011
UBS 39th Annual Global Media and Communications Conference 20
Here are the top new programs ranked by total viewers. Also shown for each program is whether or not it is number one in itstime period in viewers or key demos; and whether or not it is upfrom the program in its time period last fall. As has been reported, there are several promising freshman series.
Primetime Primetime –– New Series RankNew Series Rank20112011--12 Season12 Season--toto--DateDate
20
Source: Nielsen NPM. 9/19/11-11/27/11, Excludes cancelled series;Live+SD and Most Current Data

Outlook For The Broadcast Networks David Poltrack - December 5, 2011
UBS 39th Annual Global Media and Communications Conference 21
Now let’s take a look at the cable competition.
The OutlookThe OutlookOutlook for 2012Outlook for 2012The Audience SituationThe Audience Situation
Audience DeficienciesAudience DeficienciesNew ProgramsNew ProgramsThe Cable CompetitionThe Cable Competition
21
Outlook For The Broadcast Networks David Poltrack - December 5, 2011
UBS 39th Annual Global Media and Communications Conference 22
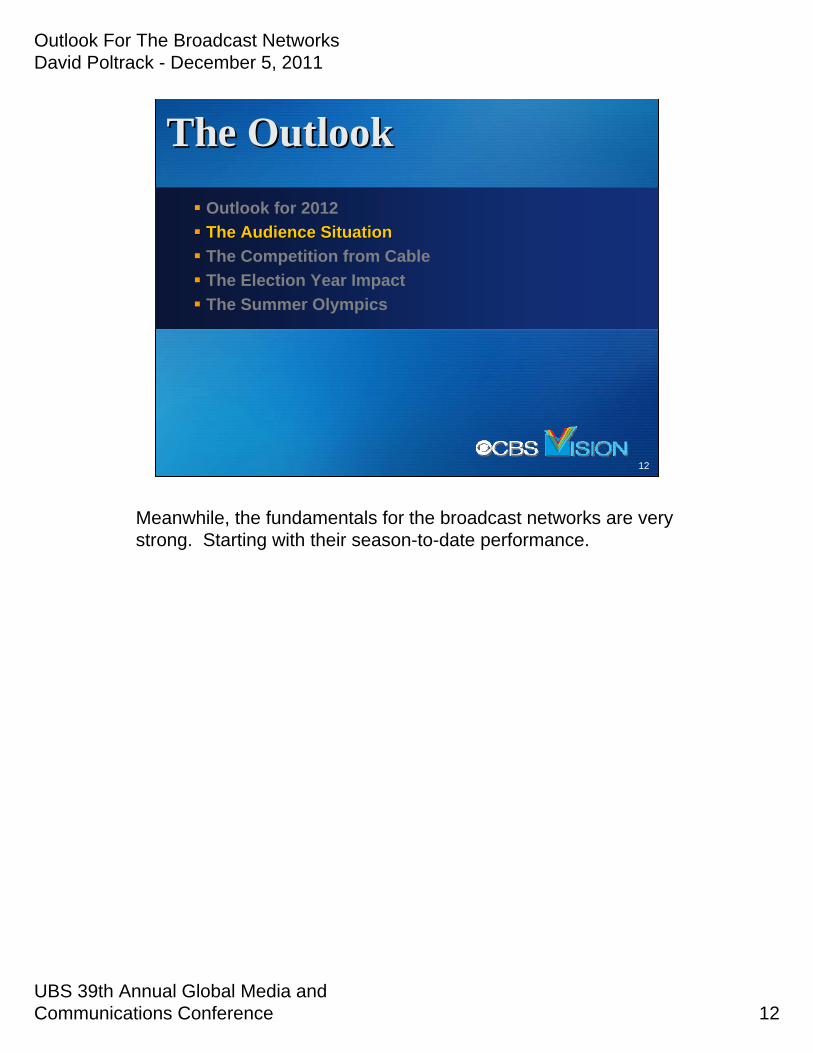
On a Most Current basis, the Ad Supported Networks are down slightly in Total Viewers and up slightly in the key demos. However, the Top 10 Billing Cable Networks are down in all key categories.
Primetime Primetime –– YearYear--OverOver--YearYear20112011--12 Season12 Season--toto--Date Date –– Most CurrentMost Current
+1%
-4%-1%
+2%
-9%
+2%
-5%-2%
All Ad Supported Cable Top 10 Billing CableHomes Viewers A25-54 A18-49
Source: Nielsen NPM. 9/19/11-11/20/11 vs. 9/20/10-11/21/10; All Programs; Most Current Data
22

Outlook For The Broadcast Networks David Poltrack - December 5, 2011
UBS 39th Annual Global Media and Communications Conference
3064Adults 25-54
Adults 18-49
All (40) Ad-Supported Cable Networks
2488
SameMinusPlus
Primetime Cable C3 Primetime Cable C3 –– SeasonSeason--toto--DateDate20112011--12 Season12 Season--toto--Date Date vs. Year Agovs. Year Ago
Source: NTI, 9/19/11-11/6/11 vs. 9/20/10-11/7/10; 40 Measured Ad-Supported Cable Networks
23
On a network-by-network basis, we see a continuation of the pattern of last year with a fairly even split of gainers and losers…
23

Outlook For The Broadcast Networks David Poltrack - December 5, 2011
UBS 39th Annual Global Media and Communications Conference
730Adults 25-54
Adults 18-49
Top 10 Billing Ad-Supported Cable Networks
253
SameMinusPlus
Primetime Cable C3 Primetime Cable C3 –– SeasonSeason--toto--DateDate20112011--12 Season12 Season--toto--Date Date vs. Year Agovs. Year Ago
Source: NTI, 9/19/11-11/6/11 vs. 9/20/10-11/7/10
24
…and a slight majority of losers among the Top 10 networks.
24

Outlook For The Broadcast Networks David Poltrack - December 5, 2011
UBS 39th Annual Global Media and Communications Conference
Primetime Primetime -- Share of A18Share of A18--49 Audience49 Audience20112011--12 Combined Broadcast vs. 12 Combined Broadcast vs. AllAll AdAd--Supported Cable Supported Cable
Source: NTI, 9/19/11-11/20/11 vs. 9/20/10-11/21/10, Most Current Data
41%59%
4-Broadcast NetworksAd Supported Cable Networks
LAST SEASONLAST SEASONTHIS SEASONTHIS SEASON
40%60%
4-Broadcast NetworksAd Supported Cable Networks
25
When you put it all together, you have the broadcast networks gaining on their cable competitors…
25
Outlook For The Broadcast Networks David Poltrack - December 5, 2011
UBS 39th Annual Global Media and Communications Conference
Source: NTI, 9/19/11-11/20/11 vs. 9/20/10-11/21/10, Most Current Data
67%33%
4-Broadcast NetworksTop 10 Cable Networks
LAST SEASONLAST SEASONTHIS SEASONTHIS SEASON
64%
36%
4-Broadcast NetworksTop 10 Cable Networks
Primetime Primetime -- Share of A18Share of A18--49 Audience49 Audience20112011--12 Combined Broadcast vs. 12 Combined Broadcast vs. Top 10Top 10 AdAd--Supported Cable Supported Cable
26
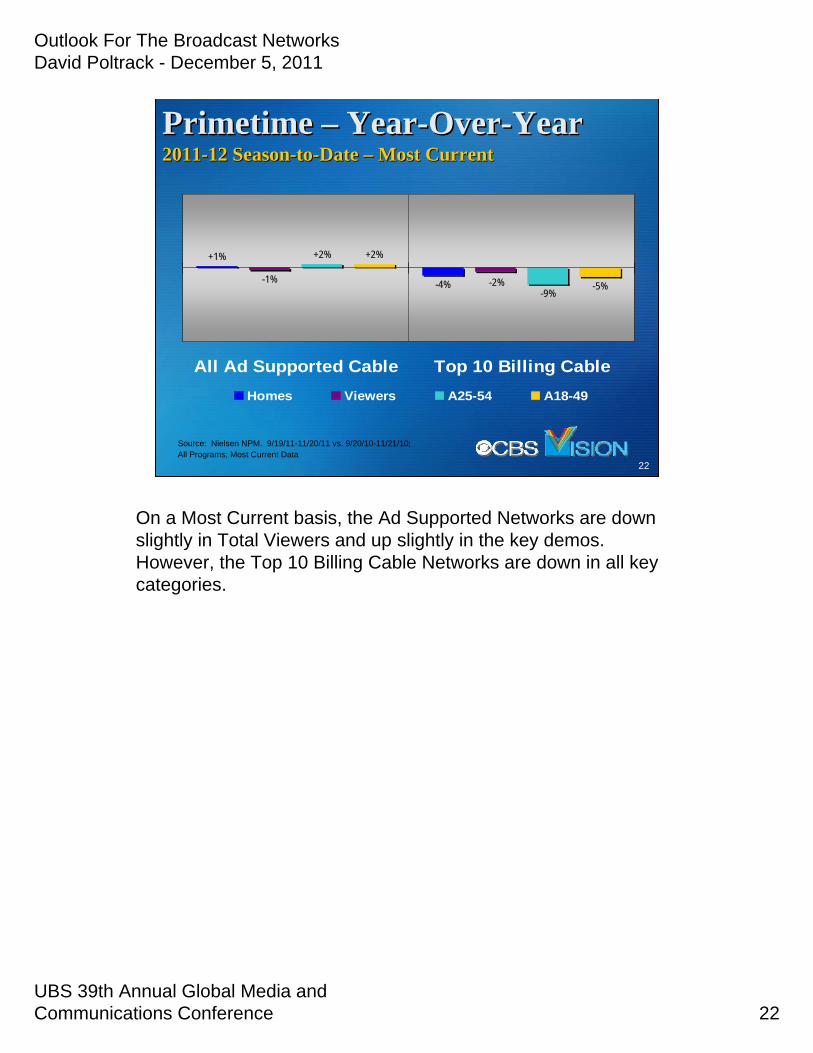
…and making more substantial progress against the Top 10 ad-supported cable networks.
26

Outlook For The Broadcast Networks David Poltrack - December 5, 2011
UBS 39th Annual Global Media and Communications Conference 27
The DVR continues to have a major impact on the primetime performance of the broadcast networks and their cable competition.
The OutlookThe OutlookOutlook for 2012Outlook for 2012The Audience SituationThe Audience Situation
Audience DeficienciesAudience DeficienciesThe Cable CompetitionThe Cable CompetitionThe Continued Impact of the DVRThe Continued Impact of the DVR
27

Outlook For The Broadcast Networks David Poltrack - December 5, 2011
UBS 39th Annual Global Media and Communications Conference 28
DVR penetration is still growing at a significant albeit slower pace. From last fall to this fall penetration went from 38% to 43%.
DVR PenetrationDVR Penetration
43%38%
21%11%
29% 34%
0%
10%
20%
30%
40%
50%
60%
70%
80%
90%
100%
Fall 2006 Fall 2007 Fall 2008 Fall 2009 Fall 2010 Fall 2011
Source: Nielsen NPM Sample Penetration
28

Outlook For The Broadcast Networks David Poltrack - December 5, 2011
UBS 39th Annual Global Media and Communications Conference 29
While the absolute gains in time-shifted viewing remain substantial, the relative gains are lessening. This season, time-shifted viewing is up just 8% on a household basis and 6% for younger adults, compared to 17% and 12%, respectively, last season.
DVR ImpactDVR Impact20112011--12 Season12 Season--toto--DateDate vs. Prior Two Yearsvs. Prior Two Years
Primetime - All DVR Playback
4.8
6.8
4.5
6.3
4.0
5.4
A18-49
HHLDS
2011-12 2010-11 2009-10DVR PENETRATION
34%38%
43%
2009-10 2010-11 2011-12
+12%
+6%
+17%
+8%
Source: Nielsen NPM. 9/19/11-11/13/11 vs. 9/20/10-11/14/10vs.. 9/21/09-11/15/09
Primetime Primetime –– All DVR Playback*All DVR Playback*DVR PENETRATIONDVR PENETRATION
29
Outlook For The Broadcast Networks David Poltrack - December 5, 2011
UBS 39th Annual Global Media and Communications Conference 30
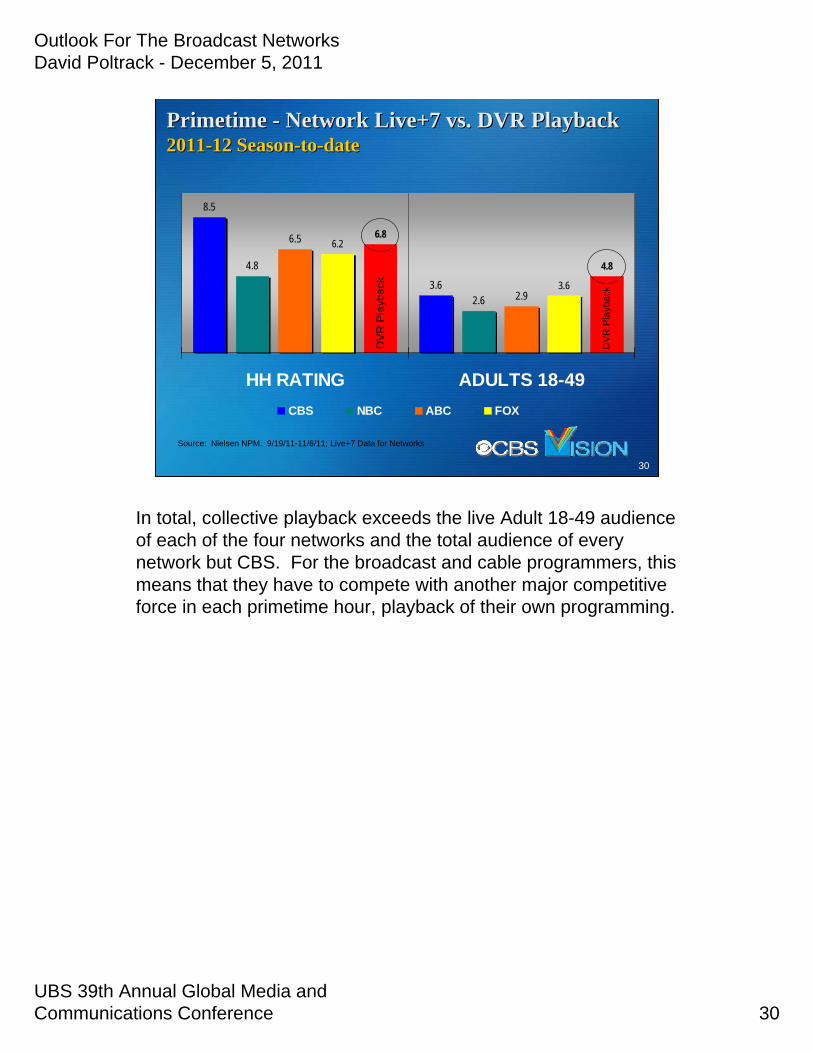
In total, collective playback exceeds the live Adult 18-49 audience of each of the four networks and the total audience of every network but CBS. For the broadcast and cable programmers, this means that they have to compete with another major competitive force in each primetime hour, playback of their own programming.
Primetime Primetime -- Network Live+7 vs. DVR Playback Network Live+7 vs. DVR Playback 20112011--12 Season12 Season--toto--datedate
8.5
3.6
4.8
2.6
6.5
2.9
6.2
3.6
6.8
4.8
HH RATING ADULTS 18-49CBS NBC ABC FOX
Source: Nielsen NPM. 9/19/11-11/6/11; Live+7 Data for Networks
30
DV
R P
layb
ack
DVR
Pla
ybac
k

Outlook For The Broadcast Networks David Poltrack - December 5, 2011
UBS 39th Annual Global Media and Communications Conference
10,082
17,040
7,246
3,438
2,438
4,659
1,650
13,019
18,608
8,028
1,064
3,011
Live Same Day Playback 1-7 Day Playback C3
5-Net Avg
Modern Family
NCIS
9,960
22,489
18,179
31
DVR Playback DVR Playback –– Viewers (000) Viewers (000) 20112011--12 Season12 Season--toto--datedate
Source: Nielsen NPM, Primetime Original Entertainment Series;9/19/11-11/6/11
Up until now, I have been dealing with averages. However, time shifted viewing is concentrated among the most popular shows. This charthighlights two shows with an extraordinary amount of playback, NCIS and MODERN FAMILY. NCIS, the #1 program, adds over five million playback viewers to its 17 million live viewer base to reach over 20 million viewers overall. MODERN FAMILY, the program with the highest playback audience, adds about 8 million viewers to its 10 million live audience base. Unfortunately, not all of these viewers are included in the C3 currency audience. The yellow bars show the C3 viewers for each of these programs
31

Outlook For The Broadcast Networks David Poltrack - December 5, 2011
UBS 39th Annual Global Media and Communications Conference
Primetime Primetime -- Share of PlaybackShare of Playback20112011--12 Season12 Season--toto--DateDate
36%
64%
Broadcast NetworksAd-Supported Cable Networks
Source: NTI, 9/20/11-11/6/11, Playback Only, Households
32
The DVR has provided the broadcast networks with a valuable weapon in their fight for viewers with the growing array of cable challengers. This season, looking at the combined broadcast + adsupported cable audience in Primetime, 64% of Primetime playback is to broadcast network programs vs. just 36% to cable programs.
32
Outlook For The Broadcast Networks David Poltrack - December 5, 2011
UBS 39th Annual Global Media and Communications Conference
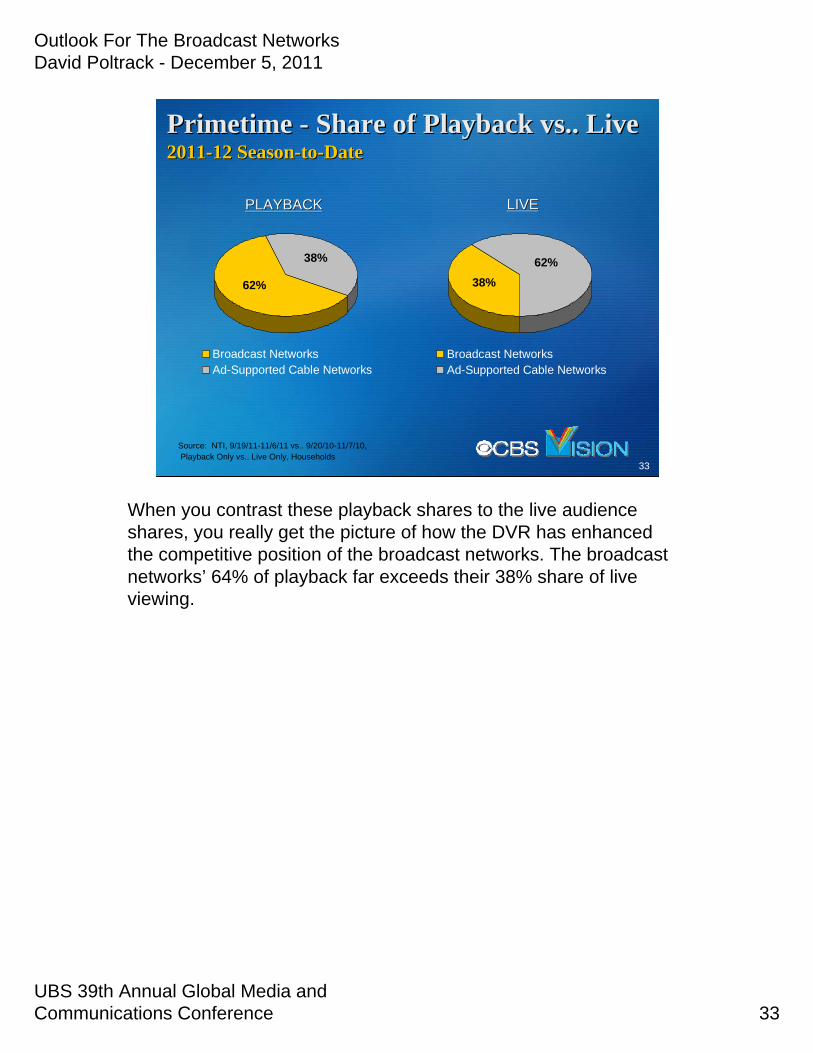
62%
38%
Broadcast NetworksAd-Supported Cable Networks
LIVELIVEPLAYBACKPLAYBACK
38%62%
Broadcast NetworksAd-Supported Cable Networks
33
Primetime Primetime -- Share of Playback vs.. LiveShare of Playback vs.. Live20112011--12 Season12 Season--toto--DateDate
Source: NTI, 9/19/11-11/6/11 vs.. 9/20/10-11/7/10,Playback Only vs.. Live Only, Households
When you contrast these playback shares to the live audience shares, you really get the picture of how the DVR has enhanced the competitive position of the broadcast networks. The broadcast networks’ 64% of playback far exceeds their 38% share of live viewing.
33

Outlook For The Broadcast Networks David Poltrack - December 5, 2011
UBS 39th Annual Global Media and Communications Conference
58%45%
4-Broadcast NetworksAd Supported Cable Networks
LAST SEASONLAST SEASONTHIS SEASONTHIS SEASON
59%43%
4-Broadcast NetworksAd Supported Cable Networks
34
Primetime Primetime –– Broadcast vs. Cable ShareBroadcast vs. Cable Share20112011--12 Season12 Season--toto--Date vs. Year AgoDate vs. Year Ago
Source: NTI, 9/19/11-11/13/11 vs. 9/20/10-11/14/10,Household Share, Live+7 Data
Overall, this season-to-date the networks have re-captured share from their cable competition, moving from an overall primetime share of 43% to 45% while the ad supported cable networks collectively dropped one point, from 59% to 58%. Remember, shares can add up to over 100% because a home can have a cable show on one TV and a broadcast show on another TV.
34

Outlook For The Broadcast Networks David Poltrack - December 5, 2011
UBS 39th Annual Global Media and Communications Conference 35
The final two elements that will a boost the advertising revenues for the four broadcast networks are the quadrennial elements of political advertising and the Summer Olympics.
The OutlookThe OutlookOutlook for 2012Outlook for 2012The Audience SituationThe Audience Situation
Audience DeficienciesAudience DeficienciesThe Cable CompetitionThe Cable CompetitionThe Continued Impact of the DVRThe Continued Impact of the DVRThe Election Year ImpactThe Summer Olympics
35
Outlook For The Broadcast Networks David Poltrack - December 5, 2011
UBS 39th Annual Global Media and Communications Conference 36
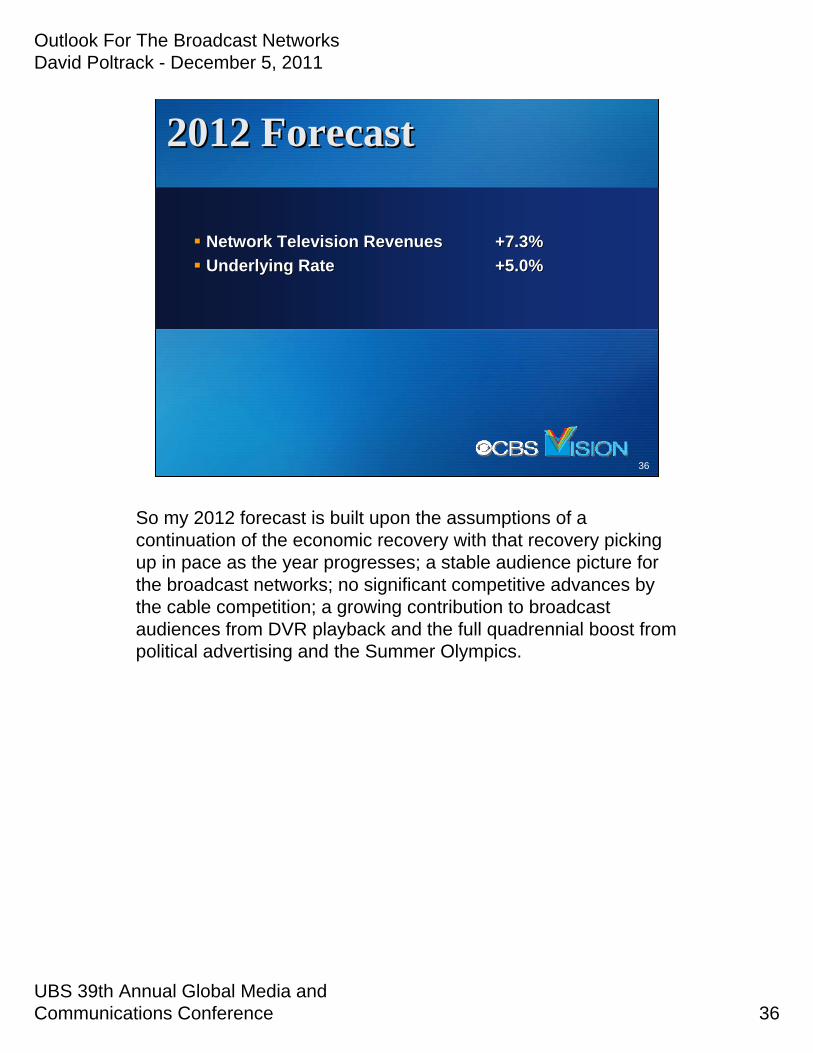
So my 2012 forecast is built upon the assumptions of a continuation of the economic recovery with that recovery pickingup in pace as the year progresses; a stable audience picture forthe broadcast networks; no significant competitive advances by the cable competition; a growing contribution to broadcast audiences from DVR playback and the full quadrennial boost from political advertising and the Summer Olympics.
2012 Forecast2012 Forecast
Network Television RevenuesNetwork Television Revenues +7.3%+7.3%Underlying RateUnderlying Rate +5.0%+5.0%
36

Outlook For The Broadcast Networks David Poltrack - December 5, 2011
UBS 39th Annual Global Media and Communications Conference 37
Now I would like to turn to the longer-term outlook for the broadcast networks.
The LongerThe Longer--Term Outlook Term Outlook
37

Outlook For The Broadcast Networks David Poltrack - December 5, 2011
UBS 39th Annual Global Media and Communications Conference 38
As I was beginning the preparation for this report, I thought tomyself at least this year I will not have to refute the “end of broadcast network television” theme that has been regularly surfaced by the misinformed and misguided throughout the thirtyyears that I have been speaking at this conference. You can, therefore, appreciate how surprised I was to see the following headline in one of the major trade publications.
An OverviewAn Overview
38

Outlook For The Broadcast Networks David Poltrack - December 5, 2011
UBS 39th Annual Global Media and Communications Conference 39
“ Big 4 TV Nets Wane As Google, Facebook Command Ad Dollars”. If this article was confined to the belief of its author, I would not be concerned, since this author has incorrectly forecast the end of broadcast network television for most of that thirty-year period. What does concern me is that the article used material from several of the most respected Wall Street analysts to support its argument. So today I will, once again, present the case for broadcast network television. I will, hopefully, demonstrate how the broadcast networks will not only survive, but thrive, in the new video marketplace.
39
Big 4 TV Nets Wane As Google, Facebook Command Ad Dollars

Outlook For The Broadcast Networks David Poltrack - December 5, 2011
UBS 39th Annual Global Media and Communications Conference 40
Those of you that have heard my earlier addresses know that I believe that you cannot evaluate the future prospects of the networks if you do so outside of the context of the full networktelevision system. That system begins with a studio that develops and produces programs for the network and it includes the owned stations that carry the network’s lineup, the syndication operations that sell the network’s programs internationally, in the secondary domestic syndication market and the new internet, VOD, and mobile platforms for those programs. My comments this morning will be made in reference to this broader broadcast network television system.
The Broadcast Network Television SystemThe Broadcast Network Television System
40

Outlook For The Broadcast Networks David Poltrack - December 5, 2011
UBS 39th Annual Global Media and Communications Conference 41
What I will be presenting to you today is a somewhat contrarian perspective on the outlook for the broadcast networks. I will address this subject from the perspectives of the viewer, the advertiser, and the subscriber. I will make the case for a scenario that has viewers gaining greater access to broadcast network content; advertisers favoring the mass medium of television overtargeted media; and the realignment of the subscribers’ video subscription expenditures in favor of the broadcaster. Let’s start with the viewer.
An OverviewAn OverviewThe Outlook for the Broadcast Networks
The Viewer: Greater access to their programming by viewersThe Advertiser: Growing demand for television advertisingThe Subscriber: Potential new revenues from realignment of current consumer video subscription fees
41

Outlook For The Broadcast Networks David Poltrack - December 5, 2011
UBS 39th Annual Global Media and Communications Conference 42
The television business is centered on the viewer as both a consumer of television programs and a target of television advertising. Today, the average viewer has the choice of over 130 channels of programming, thousands of hours of VOD content, and a vast library of legacy programs from suppliers such as Netflix, iTunes and Amazon. In addition, the average viewer has wide choice of video options online. Finally, almost one-half of those consumers have their own inventories of stored programs on their DVRs. So my first premise is that the average consumer has more content than they need or are seeking.
An OverviewAn OverviewThe Viewer
More content than they need or are seeking
42
Outlook For The Broadcast Networks David Poltrack - December 5, 2011
UBS 39th Annual Global Media and Communications Conference 43
What the average viewer does not currently have is adequate access to that content. New technologies have, in the past few years, done a great deal to solve the problem of limited access to content. They have substantially increased the amount of program content available and the places where that content can be accessed. What they have not done is fully eradicate the major constraint to the viewer’s access to that content, the lack of time. Life gets in the way. Most of the population of the United States has access to more video content that appeals to them, than they have the time to watch that content.
An OverviewAn OverviewThe Viewer
More content than they need or are seekingLimited access to that content
Life gets in the way
43

Outlook For The Broadcast Networks David Poltrack - December 5, 2011
UBS 39th Annual Global Media and Communications Conference 44
So, I will argue that the consumers are not so much seeking new programming choices, as seeking greater access to their favoriteprogramming. And, today, as has been the case throughout the last sixty+ years, the majority of their favorite programs are the programs presented by the broadcast networks. And while the consumers welcome the increased choice provided by the new technologies, they welcome even more the increased access to their favorite broadcast network programs provided by those technologies.
An OverviewAn OverviewThe Viewer
More content than they need or are seekingLimited access to that content
Life gets in the wayNeeded: Greater access to favorite programs
44

Outlook For The Broadcast Networks David Poltrack - December 5, 2011
UBS 39th Annual Global Media and Communications Conference 45
The other critical player for the broadcast networks is the advertiser. Even as new revenue streams are opening to those networks, the major source of revenue is, and, for the foreseeable future, will continue to be, advertising. Overall, the news on the advertising front is very good. New research tools are allowing marketers to accurately measure the ROI from advertising investments. As a result, the marketing department is better able to defend advertising investments with the CFO and CEO. This is resulting in a movement of dollars back into advertising.
An OverviewAn OverviewThe Advertiser
Better measures of ROI

Outlook For The Broadcast Networks David Poltrack - December 5, 2011
UBS 39th Annual Global Media and Communications Conference 46
These same research tools have also demonstrated the superior ROI for television advertising, resulting in gains for television in share of total advertising expenditures despite the emergence ofthe internet as a major new advertising medium. The development of internet search has actually contributed to the value of television advertising. For the first time, consumers have an immediate way to act on the awareness of, and interest in, a new product or a new product feature generated by television advertising.
An OverviewAn OverviewThe Advertiser
Better measures of ROITelevision Advertising gains share
Search enhances television advertising

Outlook For The Broadcast Networks David Poltrack - December 5, 2011
UBS 39th Annual Global Media and Communications Conference 47
As I read the aforementioned article suggesting that Google and Facebook were going to lead to the demise of the four broadcast networks as advertising media, I realized that the position presented in the article may have been invalidated by a false assumption as to how advertising works. Underlying the discussion in the article is a belief that consumers devote a substantial amount of their time to seeking out information foreveryday buying decisions; that they are willing to devote time to researching which snack food or soft drink to buy. That is not how it works. Most consumers want to make these decisions as efficiently and effortlessly as possible. Television advertising is so effective because it employs the concept of borrowed interest toimpart information about the benefits of certain products and services in the context of an activity, the viewing of television programs, that consumers seek out and with which they spend a great deal of time. Neither Google or Facebook has yet figured out how to command the attention of consumers for enough time to match the commercial message delivery power of network television.
An OverviewAn OverviewThe Advertiser
Better measures of ROITelevision Advertising gains share
Search enhances television advertisingBorrowed Interest

Outlook For The Broadcast Networks David Poltrack - December 5, 2011
UBS 39th Annual Global Media and Communications Conference 48
Another popular theme with the new media advocates cited in thisarticle is the targeting advantage of these new media versus themass media and the resulting lack of “wasted” impressions. While, on the surface, this makes intuitive sense, in practice is usually does not work out that way. Today, I will present research showing that, in most real life cases, mass media efficiency trumps targeted media precision.
An OverviewAn OverviewThe Advertiser
Better measures of ROITelevision Advertising gains share
Search enhances television advertisingBorrowed Interest“Mass “ media efficiency versus targeting precision

Outlook For The Broadcast Networks David Poltrack - December 5, 2011
UBS 39th Annual Global Media and Communications Conference 49
Most U.S. households are paying some form of subscription fee for their television content. For cable and satellite customers, this fee is usually determined by pre-set or tiered packages of channels. These fees have grown considerably as the number of channels have grown. Economic pressures and new, more limited, but less expensive, video distribution options have led to recent resistance to these fees; and some minimal “cord cutting”; and a more significant amount of downgrading of these subscriptions or cord “shaving”. From the subscribers’perspective, what they are paying for includes clear access to the broadcast channels. Until recently, the broadcast stations and networks did not share in the subscriber revenues. Today, that is changing. The broadcasters’ are beginning to receive retransmission payments from the cable and satellite distributors and also are entering into shared revenue arrangements with the new video distributors.
An OverviewAn OverviewThe Subscriber
Point of ResistanceBroadcasters’ Share
Outlook For The Broadcast Networks David Poltrack - December 5, 2011
UBS 39th Annual Global Media and Communications Conference 50
The new configuration of the video distribution market is likely to lead to a significant realignment of the allocation of subscription fees among the various players. It is still too early to predict how this disruption of the current video distribution market will play out. However, it is very likely to result in a more consistent alignment of subscription fees and actual viewing. If this does turn out to be the case, the upside for the broadcasters, with their large shares of overall viewing, will be substantial.
An OverviewAn OverviewThe Subscriber
Point of ResistanceBroadcasters’ ShareTowards subscription fee/viewing alignment

Outlook For The Broadcast Networks David Poltrack - December 5, 2011
UBS 39th Annual Global Media and Communications Conference 51
Returning to the viewers and their quest for greater access to their favorite programs, one place where access to that content is growing is on the internet, through video streaming.
Broadcast Network Television:Broadcast Network Television:The AThe Amassmassing Mediuming Medium
51

Outlook For The Broadcast Networks David Poltrack - December 5, 2011
UBS 39th Annual Global Media and Communications Conference
TV Program StreamingTV Program StreamingHave Streamed ProgramsHave Streamed Programs
60%
86%
62%
41%
64%
85%
68%
51%
Total Viewers Adults 18-34 Adults 35-54 Adults 55+
2010 2011
Source: CBS Entertainment Panel, Nov. 2010, Nov. 2011
52
We have been tracking video streaming for several years now with the members of our Entertainment panel. This panel in made up primarily of people that are heavier than average television viewers and internet users. Last month, just under two-thirds of these panelists, 64%, reported streaming television programs. This percentage was up from 60% last November. As you would expect, the younger adults are more likely to be streamers. However, the rate of growth in streaming is greatest among the older viewers.
52

Outlook For The Broadcast Networks David Poltrack - December 5, 2011
UBS 39th Annual Global Media and Communications Conference
TV Program StreamingTV Program StreamingMore OftenMore Often
30% 34% 31%24%
36% 41% 35% 34%
Total Viewers Adults 18-34 Adults 35-54 Adults 55+
2010 2011
Source: CBS Entertainment Panel, Nov. 2010, Nov. 2011
53
About one-third of these streamers, 36%, say that they are streaming programs more often, up from 30% last November.
53

Outlook For The Broadcast Networks David Poltrack - December 5, 2011
UBS 39th Annual Global Media and Communications Conference
TV Program StreamingTV Program StreamingLess OftenLess Often
21% 20% 21% 22%13% 10% 12% 15%
Total Viewers Adults 18-34 Adults 35-54 Adults 55+
2010 2011
Source: CBS Entertainment Panel, Nov. 2010, Nov. 2011
54
This compares to the much lower, and declining, percentage of viewers that say they are streaming less often.
54

Outlook For The Broadcast Networks David Poltrack - December 5, 2011
UBS 39th Annual Global Media and Communications Conference
TV Program StreamingTV Program StreamingHow StreamedHow Streamed
50%58%
18%10%
42%
62%
27%19%
On Desktop On Laptop On TV On Mobile Device
2010 2011
Source: CBS Entertainment Panel, Nov. 2010, Nov. 2011
55
This streaming is also moving from the desktop computer to the laptop computer and, more significantly, to the television set and/or mobile devices.
55

Outlook For The Broadcast Networks David Poltrack - December 5, 2011
UBS 39th Annual Global Media and Communications Conference
CBS.com Breaks Records with Premiere WeekCBS.com Breaks Records with Premiere WeekResults extending through Q4Results extending through Q4
CBS.com had the best premiere week ever with 7.5mm unique visitors (up +50% YOY).
Set single day record for traffic on Monday 9/19 with over 1.8mm Unique Visitors.
Broke that record the next day, Tuesday 9/20, with more than 2mm Unique Visitors (up 100% YOY).
Broke records in social referrals (2mm+) …reflecting the popularity of CBS.com social events like Tweet Week and its Facebook pages.
CBS.com/CBS Audience Network generated nearly 18mm total video views and 7.5mm full episode views the first full week of premieres.
Source: CBS internal logs
This season, the impact of this growth in streaming activity was clearly evident in the performance of CBS.com. For Premiere Week, CBS.com attracted 7.5 million unique visitors, up 50% from last season’s premiere week level. Overall, CBS.com and the CBS Audience Network generated nearly 18 million total video views and 7.5 million full program views during the first week of premieres.
56

Outlook For The Broadcast Networks David Poltrack - December 5, 2011
UBS 39th Annual Global Media and Communications Conference
CBS CBS -- The #1 Broadcast Network Online for 35 monthsThe #1 Broadcast Network Online for 35 months
Source: comScore VideoMetrix, September’10-September’11
Monthly Average Total Streams (SeptMonthly Average Total Streams (Sept’’1010‐‐SeptSept’’11)11)
Monthly Average Total Minutes (SeptMonthly Average Total Minutes (Sept’’1010‐‐SeptSept’’11)11)
18.2M
8.6M
5.4M 4.6M
CBS ABC NBC FOX
330M275M
90M 79M
CBS ABC NBC FOX
Monthly Average Total Unique ViewersMonthly Average Total Unique Viewers(Sept(Sept’’1010‐‐SeptSept’’11)11)
#1
#1
#1
1.1B804M
386M352M
CBS ABC NBC FOX
#1
Keeping CBS.com #1 among the broadcast network home sites consistent with the CBS dominance with Total Viewers on air.
57

Outlook For The Broadcast Networks David Poltrack - December 5, 2011
UBS 39th Annual Global Media and Communications Conference
58Source: CBS internal logs, Q2 2011; *FreeWheel Q2 2011 Report
Leading Ad CompletionLeading Ad CompletionVideo Ad Completion Rate by Video Length, Q2 2011Video Ad Completion Rate by Video Length, Q2 2011
81%
59%
96%77%
Full Episodes Clips
Industry Average CBS/CAN
This has enhanced online as a valuable advertising outlet for CBS on both a full-episode and program clip basis. Ad completion rates for CBS & Audience Network have been consistently high. In Q2 2011,overall video ad completion rates for Full episodes was 96%, 15 percentage points above industry average, while completion rates for Clips was 77%, 18 percentage points above industry average.
58

Outlook For The Broadcast Networks David Poltrack - December 5, 2011
UBS 39th Annual Global Media and Communications Conference
A New Broadcast Network Television Model?A New Broadcast Network Television Model?Current ModelCurrent Model
2 Minutes of Ads = 4 Ads x 1.00
10 Minutes of Ads = 20 Ads x .44
10 Minutes of Ads = 20 Ads x .95
Online Streaming
DVR Playback
Live
4.0
8.8
19.0
Ad Value
Last year at this conference I introduced the concept of a new Broadcast Network Television Model. Let’s revisit that subject. Originally, online streaming of television programs only included two minutes of ads. This made online streaming a far less attractive alternative than either live on-air or DVR playback viewing in terms of advertising revenues. However, research we had done at that time and experimentation with full ad loads online by CW demonstrated that viewers would accept far greater ad loads online.
59

Outlook For The Broadcast Networks David Poltrack - December 5, 2011
UBS 39th Annual Global Media and Communications Conference
A New Broadcast Network Television Model?A New Broadcast Network Television Model?Current ModelCurrent Model
10+ Minutes of Ads = 20 Ads x 1.00+
10 Minutes of Ads = 20 Ads x .44
10 Minutes of Ads = 20 Ads x .95
Online Streaming
DVR Playback
Live
20.0+
8.8
19.0
Ad Value
So we increased our ad loads in the CBS programs online to 14 ads per hour. Since not every ad position is filled each day, wehave used a 10+ ad unit level in the chart shown. We also currently get a significant CPM premium for these online ads as compared to the broadcast CPM. All of which translates to an advalue of 20 plus for an online streamed view. What that means is that a viewer streaming our program online is now worth substantially more to us than a person watching that program in playback mode and skipping many of the commercials. In fact, the value of the online viewer is now surpassing that of the live viewer as well.
60
Outlook For The Broadcast Networks David Poltrack - December 5, 2011
UBS 39th Annual Global Media and Communications Conference
That is truly amassing! The broadcast network system amasses audiences in other ways as well. Let’s look at what is happening with VOD.
Broadcast Network Television:Broadcast Network Television:The AThe Amassmassing Mediuming Medium
61
61

Outlook For The Broadcast Networks David Poltrack - December 5, 2011
UBS 39th Annual Global Media and Communications Conference
VODVOD
62
When I spoke to this conference in 2003 and 2004 I took the thencontroversial position that the DVR would enhance not damage theposition of the broadcast networks. I called that one right. However, I made another prediction which has not yet been realized. I predicted that the DVR was a transitional technology that would be rendered obsolete by VOD. The cable and satellite distributors went in another direction promoting the DVR. As this device brought in new revenues, they resisted the advertising-subsidized VOD model that I believed would replace the DVR. Well, I have not given up on this prediction yet.
62

Outlook For The Broadcast Networks David Poltrack - December 5, 2011
UBS 39th Annual Global Media and Communications Conference
63
An industry coalition, the Advanced Advertising Media Project, has recently been formed to study the subject of VOD advertising.
63

Outlook For The Broadcast Networks David Poltrack - December 5, 2011
UBS 39th Annual Global Media and Communications Conference
SponsorsSponsors
64
The coalition includes key players from all sectors of the business, broadcast and cable networks, MSOs, advertising agencies, the 4As, and technology companies. The first two phases of a planned three-phase research project have been completed.
64

Outlook For The Broadcast Networks David Poltrack - December 5, 2011
UBS 39th Annual Global Media and Communications Conference
1. VOD is fundamentally a television experience, but different2. Consumers accept advertising on VOD3. Ad load on VOD does not impact ad efficacy or viewer
enjoyment4. VOD rewards different ad formats
Key FindingsKey Findings
Source: AAMP | Ipsos
65
Here are the key findings: VOD is fundamentally a television experience, but different; Consumers accept advertising on VOD; Ad load on VOD does not impact ad efficacy or viewer enjoyment; VODrewards different ad formats; Work is just beginning on Phase III a real world test of the recommended approaches from this research.
65

Outlook For The Broadcast Networks David Poltrack - December 5, 2011
UBS 39th Annual Global Media and Communications Conference
CBS VOD PerformanceCBS VOD Performance20112011--12 Season12 Season--toto--DateDate
Viewing IncreaseViewing Increase
2011 vs. 20102011 vs. 2010
Source: Rentrak OnDemand Essentials; 9/20/11–11/27/11 vs.. 9/21/10–11/28/10.
66
15 Primetime Shows15 Primetime Shows
Meanwhile, VOD is growing as a distribution medium for primetimenetwork programming. At CBS we have seen a 19% increase in VOD viewing of our primetime series this fall.
6666

Outlook For The Broadcast Networks David Poltrack - December 5, 2011
UBS 39th Annual Global Media and Communications Conference
CBS VOD PerformanceCBS VOD Performance20112011--12 Season12 Season--toto--DateDate
15 Primetime Shows15 Primetime Shows
Source: Rentrak OnDemand Essentials; 9/20/11–11/27/11 vs.. 9/21/10–11/28/10.
67
70 Million Views70 Million Views
Adding up to 70 million views. With its addressability and dynamic ad insertion capabilities, VOD remains an advertising medium of great potential. I have not given up on my prediction yet.
67

Outlook For The Broadcast Networks David Poltrack - December 5, 2011
UBS 39th Annual Global Media and Communications Conference
I have characterized the U.S. viewer as having access to more desirable television content than they could possibly watch. I would not make that same characterization regarding television viewers outside of the U.S.
Broadcast Network Television:Broadcast Network Television:The AThe Amassmassing Mediuming Medium
68
68

Outlook For The Broadcast Networks David Poltrack - December 5, 2011
UBS 39th Annual Global Media and Communications Conference
Today, there are approximately 1.3 billion people throughout theworld for which English is a first or second language. Three quarters of them live outside of the U.S. In addition, English is the Internet language for over 500 million internet users. The English-speaking portion of the world’s population outside of the U.S. represents a huge and growing market for the programs of the broadcast network system.
The International MarketThe International Market
1,300,000,000 English speaking people in the world
75% outside of the U.S.
565,000,000 Internet users access Internet in English
69
Source: Wikipedia
69

Outlook For The Broadcast Networks David Poltrack - December 5, 2011
UBS 39th Annual Global Media and Communications Conference
And that market is not confined to just those English speaking viewers. CBS International currently has top performing series dubbed into many different languages.
6 of Top 10 U.S. series in Italy4 of Top 10 U.S. series in Germany3 of Top 10 U.S. series in France and Sweden2 of Top 10 U.S. series in Spain
70
Source: CAD/MSS/MediaMetrie, October 2011
70

Outlook For The Broadcast Networks David Poltrack - December 5, 2011
UBS 39th Annual Global Media and Communications Conference
As a result, International distribution is a fast growing part of the broadcast network system. CBS International is poised to break the billion dollar mark in revenues.CSI was named by MediaMetrie as the most watched series in the world. And CBS International is also entering new distribution relationships with Netflix in Canada and Latin America and Hulu in Japan.
Reaching $1 Billion revenue markCSI named by Mediametrie as the most watched series in the worldNew Distribution deals
Netflix: Canada, Latin AmericaHulu: Japan
71
Source: MediaMetrie
71

Outlook For The Broadcast Networks David Poltrack - December 5, 2011
UBS 39th Annual Global Media and Communications Conference
We are also very excited about the early returns from our new, jointly-owned networks in India, Australia and the U.K.
72
IndiaBoth channels have grown to #2 positions with their target markets in first year
AustraliaTv1 is the #2 subscription TV channelELEVEN is the #1 digital free-to-air channel in its target demoSci-Fi, the only channel in Australia dedicated to sci-fi and paranormal programming
U.K.Our channels have doubled their audiences since launch.
Source: India=TAM; Australia=OzTAM;UK=CAD/BARB
72

Outlook For The Broadcast Networks David Poltrack - December 5, 2011
UBS 39th Annual Global Media and Communications Conference
Now, let’s switch the focus to the advertiser. The argument for the future decline of the broadcast networks presented in the article contains two advertiser-related elements common to much of the conjecture about the bleak future for network television.They are…
73
Big 4 TV Nets Wane As Google, Facebook Command Ad Dollars
73

Outlook For The Broadcast Networks David Poltrack - December 5, 2011
UBS 39th Annual Global Media and Communications Conference
1. The broadcast networks will continue to lose share of national television advertising to cable television networks. 2. More targeted new media options will capture advertising dollars frommass media. Let’s start with broadcast versus cable.
The LongerThe Longer--Term Outlook Term Outlook
The broadcast networks will continue to lose share of national television advertising to cable television networks.More targeted new media options will capture advertising dollarsfrom mass media.
74
74

Outlook For The Broadcast Networks David Poltrack - December 5, 2011
UBS 39th Annual Global Media and Communications Conference
Advertising and MarketingAdvertising and Marketing
24.226.524.01,0802007
24.627.523.31,0652008
25.629.322.710152010
25.128.621.89752009
26.529.122.610402011
% of Total Television Advertising% of Total Advertising% of Total Marketing$ Billions
26.626.724.08802002
28.525.827.26501997
Broadcast NetworksTelevisionAdvertising
Total Marketing SpendingYear
75
Source: Wilkofsky & Gruen
During the recent recession, broadcast network advertising revenues were affected by the decline in marketing spending, andthe decline in advertising’s share of that spending. Offsetting those forces was the shift of a greater share of advertising dollars to television advertising. If you study the last column showing the share of television advertising going to the broadcast networks,you see a positive trend from 2007 to the present. However, thisis somewhat misleading. The gains in broadcast network share were a function of the decline in the local television share of overall television dollars. Actually, during this period, the broadcast networks were losing share to the cable networks.
75

Outlook For The Broadcast Networks David Poltrack - December 5, 2011
UBS 39th Annual Global Media and Communications Conference
All TV Ad Spending All TV Ad Spending -- Share Shift Share Shift Broadcast to CableBroadcast to Cable
62%
38%52% 48%48% 52%
Broadcast Share Cable Share
2000 2005 2010
Source: Wilkofsky & Gruen;4 Broadcast Networks vs.. All Cable Networks, All Dayparts
Total Spending Total Spending –– All CategoriesAll Categories
76
If we examine the long-term trend in television spending, we see a greater share of television advertising dollars moving from the broadcast networks to the growing array of cable networks. Today, the split is 48/52 in favor of the cable networks for all advertisers.
76
Outlook For The Broadcast Networks David Poltrack - December 5, 2011
UBS 39th Annual Global Media and Communications Conference
Growth in the Number of Growth in the Number of ““RatedRated”” Cable NetworksCable Networks
43
65
95
2000 2005 2010
77
Source: Nielsen NPM; Ad-Supported Cable Networks rated by Nielsen
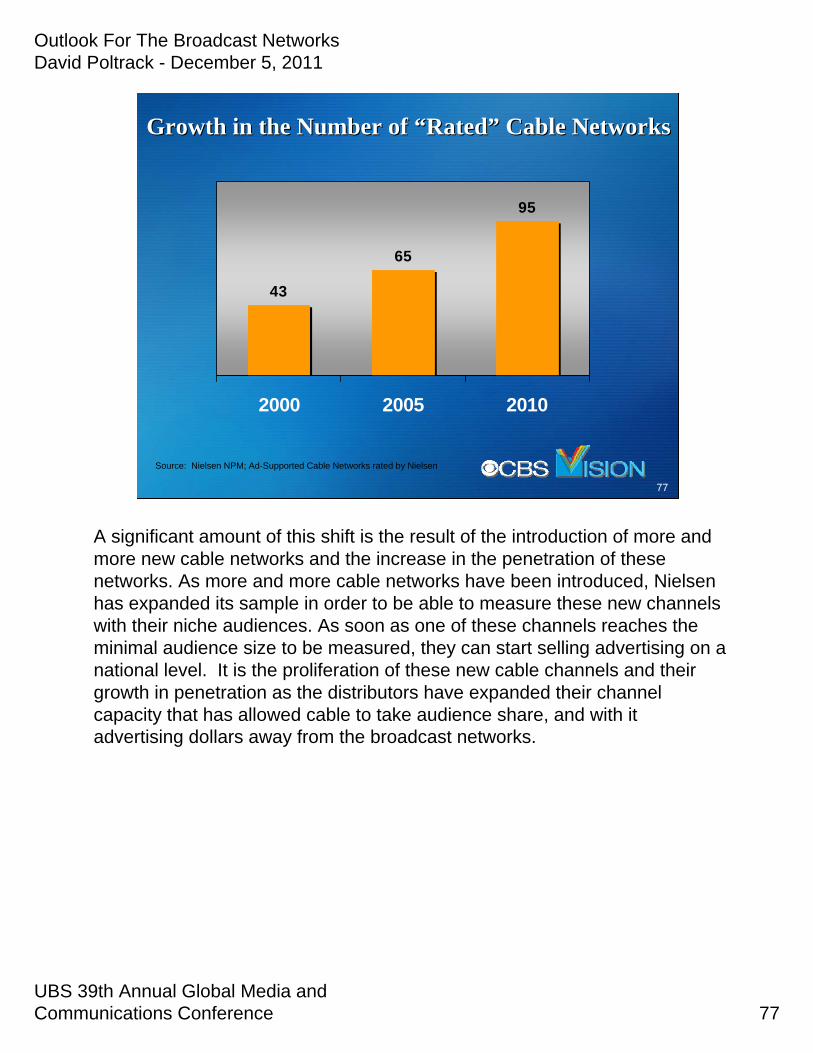
A significant amount of this shift is the result of the introduction of more and more new cable networks and the increase in the penetration of these networks. As more and more cable networks have been introduced, Nielsen has expanded its sample in order to be able to measure these new channels with their niche audiences. As soon as one of these channels reaches the minimal audience size to be measured, they can start selling advertising on a national level. It is the proliferation of these new cable channels and their growth in penetration as the distributors have expanded their channel capacity that has allowed cable to take audience share, and with it advertising dollars away from the broadcast networks.
77

Outlook For The Broadcast Networks David Poltrack - December 5, 2011
UBS 39th Annual Global Media and Communications Conference
All TV Ad Spending All TV Ad Spending -- Share ShiftShare Shift48% Share to 52% Share48% Share to 52% Share
Actual 4 Broadcast NetworkSpending
With 52% Share
Source: Wilkofsky & Gruen4 Broadcast Networks and Cable Networks, All Dayparts
Total Spending Total Spending ––All Categories All Categories
+$1,600,000,000
78
Since 2005 alone, this change in share has moved 1.6 billion dollars from the broadcast networks’ to the cable networks’ column. The billion dollar+ question is whether or not this migration will continue. We have already seen some evidence suggesting it will slow down significantly, if not stop. The proliferation of cable networks has pretty much run its course and most of the popular cable networks have reached full penetration. And, as we have already seen, the cable networks, particularly the major cable networks, do not appear to be capturing significant audience share from the broadcast networks. But this competitive change is likely to be less important than the answer to the basic question: Did this shift to cable work? Did it deliver a positive ROI for the advertiser?
78

Outlook For The Broadcast Networks David Poltrack - December 5, 2011
UBS 39th Annual Global Media and Communications Conference
CPG TV Spending CPG TV Spending -- Share ShiftShare Shift20102010
32%
68%
Broadcast Share Cable Share
Source: Kantar Media/CMR, Jan-Dec Totals;Broadcast Networks and Cable Networks, All Dayparts
Total Spending Total Spending –– $20+ million with 60% Cable Share CPG Categories$20+ million with 60% Cable Share CPG Categories
79
Most of the money shifting from broadcast to cable came from the major CPG advertisers. These advertisers have always been the most price-conscious media buyers. Faced with static or declining demand during the recession, they shifted money to the lower CPM cable option. We have isolated 36 product categories each with over twenty million dollars in spending between broadcast and cable and over 60% of that money going to the cable networks.
79

Outlook For The Broadcast Networks David Poltrack - December 5, 2011
UBS 39th Annual Global Media and Communications Conference
CPG TV Spending Share Shift CPG TV Spending Share Shift –– 20102010From 32% to AllFrom 32% to All--Category 48% Broadcast ShareCategory 48% Broadcast Share
$688,000,000
$1,032,000,000
Actual Broadcast Spending With 48% Share
Source: Kantar Media/CMR, Jan-Dec Totals;4 Broadcast Networks and Cable Networks, All Dayparts
Total Spending Total Spending –– $20+ million with 60% Cable Share CPG Categories$20+ million with 60% Cable Share CPG Categories
+$344,000,000
80
What if we could demonstrate to these advertisers that they are spending too much in cable and not enough with the broadcast networks? Just getting these categories back to the all-category 48/52 split would add $344 million in broadcast network spending. Most of these CPG advertisers use some form of media mix model or algorithm to plan their television campaigns. In recent years, as media prices rose and audiences did not, the media buyers have found it more and more difficult to meet GRP and Reach & Frequency targets with the budgets they had beengiven. This led to a leaning of the mix, replacing higher cost media such as broadcast network primetime with lower cost media such as cable ROS. But did this leaning of the mix reduce the effectiveness of the advertising campaign?
80

Outlook For The Broadcast Networks David Poltrack - December 5, 2011
UBS 39th Annual Global Media and Communications Conference
81
New single-source marketing research tools from TRA and Nielsen/Catalina are allowing advertisers to answer that question for the first time. Advertisers can now directly measure the Return-On-Investment for each component of an advertising campaign.
81

Outlook For The Broadcast Networks David Poltrack - December 5, 2011
UBS 39th Annual Global Media and Communications Conference
82
TRA has specifically addressed the relative effectiveness of broadcast network primetime advertising versus advertising on cable and in other dayparts .
82

Outlook For The Broadcast Networks David Poltrack - December 5, 2011
UBS 39th Annual Global Media and Communications Conference
TRA TRA -- Primetime ROI AnalysisPrimetime ROI AnalysisBroadcast = 3X Greater ROI vs. CableBroadcast = 3X Greater ROI vs. Cable
Average Multivariate ROI (National)Average Multivariate ROI (National)
Source: TRA; eight multivariate studies conducted between 2008 and 2011.
$0.99
$0.32Cable
DominantBuys
BroadcastDominant
Buys
TRA’s early work in this area showed Broadcast Network dominant buys, despite their premium price, delivered superior Return-On-Investments when compared to cable dominant buys.
83

Outlook For The Broadcast Networks David Poltrack - December 5, 2011
UBS 39th Annual Global Media and Communications Conference
TRA TRA –– Primetime ROI AnalysisPrimetime ROI AnalysisHigher Broadcast = Better ROIHigher Broadcast = Better ROI
Source: TRA , Multivariate Studies Conducted Between 2008-2011
$0.1769.530.5Personal Care Brand “C”
$0.3167.532.5Personal Care Brand “B”
$0.3161.238.8Personal Care Brand “A”
$1.1043.856.2Food Brand “C”
$0.8742.157.9Food Brand “B”
$1.4945.555.5Food Brand “A”
ROIPercent Cable
Percent Broadcast
84
More recent work by TRA has specifically addressed the issue of the broadcast/cable mix of television campaigns. In this work, TRA found that campaigns with over 50% of the their GRPs on the Broadcast channels delivered consistently higher ROIs than campaigns with over sixty percent of their GRPs in cable.
84

Outlook For The Broadcast Networks David Poltrack - December 5, 2011
UBS 39th Annual Global Media and Communications Conference
IAG Program EngagementIAG Program Engagement20102010--1111
78%79%ABC
57%60%Total Cable *
A25-54 A18-49
CBS 79% 79%
NBC 77% 77%
FOX 74% 72%
Total Broadcast 78% 77%
Source: Nielsen IAG data, 9/20/10-5/30/11; Originals and Repeats* 18 Measured Cable Networks
Primetime Primetime –– All Regular, No SportsAll Regular, No Sports
85
This should come as no surprise to analysts familiar with the work of IAG which I have presented to you at previous conferences. IAG demonstrated that Broadcast Network Primetime programs offer advertisers a superior advertising environment with higher program engagement
85

Outlook For The Broadcast Networks David Poltrack - December 5, 2011
UBS 39th Annual Global Media and Communications Conference
IAG Brand RecallIAG Brand Recall20102010--1111
Primetime Primetime –– All Regular, No SportsAll Regular, No Sports
25%
32%
32%
30%
32%
33%
A25-54
29%ABC
23%Total Cable *
A18-49
CBS 31%
NBC 31%
FOX 30%
Total Broadcast 30%
86
Source: Nielsen IAG data, 9/20/10-5/30/11; Originals and Repeats* 18 Measured Cable Networks
Leading to higher levels of advertising recall, 32% vs. 25% for cable with Adults 25-54 and 30% vs. 23% with Adults 18-49.
86

Outlook For The Broadcast Networks David Poltrack - December 5, 2011
UBS 39th Annual Global Media and Communications Conference
CPG TV Spending Share Shift CPG TV Spending Share Shift –– 20102010From 32% to AllFrom 32% to All--Category 48% Broadcast ShareCategory 48% Broadcast Share
$688,000,000
$1,032,000,000
Actual Broadcast Spending With 48% Share
Source: Kantar Media/CMR, Jan-Dec Totals;4 Broadcast Networks and Cable Networks, All Dayparts
Total Spending Total Spending –– $20+ million with 60% Cable Share CPG Categories$20+ million with 60% Cable Share CPG Categories
+$344,000,000
87
So, I believe that this new research capability will motivate advertisers to shift ad dollars back to broadcast primetime. At CBS, we are investing heavily in creating experiments with these heavy cable spender CPG clients utilizing the single source resources of TRA and Nielsen/Catalina Solutions. With the main drivers of the migration of ad dollars from the broadcast networks to cable, a growing number of cable alternatives, greater cable penetration, and a recession-inspired search for lower CPMs all becoming less relevant, the demonstration of the true superior ROI from effective broadcast network campaigns should shift the momentum back to the broadcast networks.
87

Outlook For The Broadcast Networks David Poltrack - December 5, 2011
UBS 39th Annual Global Media and Communications Conference
To address the second point regarding the relative effectivenessof mass media vs. more targeted media, I will have to put on my academic hat and call on my 30 plus years of experience as an adjunct marketing professor at NYU and Columbia and my work with the Marketing Science Institute, where I am currently serving as Chairman of the Executive Committee. You see, this is a veryold debate among marketing academics, a debate that has, in the past, usually favored the mass media advocates.
The LongerThe Longer--Term Outlook Term Outlook
88
The broadcast networks will continue to lose share of national television advertising to cable television networks.More targeted new media options will capture advertising dollarsfrom mass media.
88

Outlook For The Broadcast Networks David Poltrack - December 5, 2011
UBS 39th Annual Global Media and Communications Conference
““The new technology from TiVo and Replay The new technology from TiVo and Replay provides the ultimate in television provides the ultimate in television convenience, it will spy on you, destroy convenience, it will spy on you, destroy prime time and shatter the power of the prime time and shatter the power of the mass marketmass market””
——““Boom BoxBoom Box””, Michael Lewis; , Michael Lewis; New York Times New York Times
MagazineMagazineAugust 13, 2000August 13, 2000
89
The DVRThe DVR
At the turn of the century, this was a major part of the argument put forth by those predicting that the DVR would spell the end of mass media. They referred to the coming age of de-massification. This argument is essentially an argument regarding the relative trade-off of the efficiency of mass media and the precision of targeted media.
89

Outlook For The Broadcast Networks David Poltrack - December 5, 2011
UBS 39th Annual Global Media and Communications Conference
The Ehrenberg-Bass Institute for Marketing Science is one of the most prestigious international academic centers for the study ofmarketing. Its U.S corporate sponsors include Unilever, Procter & Gamble, Coca-Cola, Mars, Kellogg’s, Nielsen and CBS. The Institute has done a great deal of research on the subject of targeting which is brilliantly summarized in a paper entitled “Smarter Targeting” by Jenni Romaniuk. I cannot possibly do the full paper justice in the short time that I have today. I urge you to get a copy. Here are some of the key points made in the paper…
Smarter TargetingSmarter Targeting
Associate Professor Jenni RomaniukAssociate Professor Jenni RomaniukEhrenbergEhrenberg--Bass Institute for Marketing Science Bass Institute for Marketing Science
90
90

Outlook For The Broadcast Networks David Poltrack - December 5, 2011
UBS 39th Annual Global Media and Communications Conference
Consumer profiles of competing brands seldom differ;
Smarter TargetingSmarter Targeting
Consumer profiles of competing brands seldom differConsumer profiles of competing brands seldom differ
91
91

Outlook For The Broadcast Networks David Poltrack - December 5, 2011
UBS 39th Annual Global Media and Communications Conference
Even big brands mostly have light buying customers;
Smarter TargetingSmarter Targeting
Consumer profiles of competing brands seldom differConsumer profiles of competing brands seldom differEven big brands mostly have light buying customersEven big brands mostly have light buying customers
92
92

Outlook For The Broadcast Networks David Poltrack - December 5, 2011
UBS 39th Annual Global Media and Communications Conference
For most brands the top twenty percent of customers do not, as the popular 80:20 Rule suggests, deliver 80% of sales. It is more like 50% to 60%;
Smarter TargetingSmarter Targeting
Consumer profiles of competing brands seldom differConsumer profiles of competing brands seldom differEven big brands mostly have light buying customersEven big brands mostly have light buying customersFor most brands the top twenty percent of customers do not, as For most brands the top twenty percent of customers do not, as the popular 80:20 Rule suggests, deliver 80% of sales. It is the popular 80:20 Rule suggests, deliver 80% of sales. It is more like 50% to 60%.more like 50% to 60%.
93
93

Outlook For The Broadcast Networks David Poltrack - December 5, 2011
UBS 39th Annual Global Media and Communications Conference
Only about half of your brand’s heavy buyers this year will be heavy buyers next year. So the first challenge is how do you define your target?
Smarter TargetingSmarter Targeting
Consumer profiles of competing brands seldom differConsumer profiles of competing brands seldom differEven big brands mostly have light buying customersEven big brands mostly have light buying customersFor most brands the top twenty percent of customers do not, as For most brands the top twenty percent of customers do not, as the popular 80:20 Rule suggests, deliver 80% of sales. It is the popular 80:20 Rule suggests, deliver 80% of sales. It is more like 50% to 60%.more like 50% to 60%.Only about half of your brandOnly about half of your brand’’s heavy buyers this year will be s heavy buyers this year will be heavy buyers next year.heavy buyers next year.
94
94

Outlook For The Broadcast Networks David Poltrack - December 5, 2011
UBS 39th Annual Global Media and Communications Conference
Now let’s look at the findings on the media side of the equation. Media audiences are largely homogenous with TV the least segmented of the media types analyzed.
Smarter TargetingSmarter Targeting
Media audiences are largely homogenous with TV the least segmentMedia audiences are largely homogenous with TV the least segmented ed of the media types analyzedof the media types analyzed
95
95

Outlook For The Broadcast Networks David Poltrack - December 5, 2011
UBS 39th Annual Global Media and Communications Conference
Audience differences are typically overstated in media propositions. Around half of a medium’s audience on average falls outside of its claimed target audience.
Smarter TargetingSmarter Targeting
Media audiences are largely homogenous with TV the least segmentMedia audiences are largely homogenous with TV the least segmented ed of the media types analyzedof the media types analyzedAudience differences are typically overstated in media propositiAudience differences are typically overstated in media propositions. ons. Around half of a mediumAround half of a medium’’s audience on average falls outside of its s audience on average falls outside of its claimed target audience.claimed target audience.
96
96

Outlook For The Broadcast Networks David Poltrack - December 5, 2011
UBS 39th Annual Global Media and Communications Conference
Even with a reasonable percent (of its core), often larger media still have greater actual numbers.
Smarter TargetingSmarter Targeting
Media audiences are largely homogenous with TV the least segmentMedia audiences are largely homogenous with TV the least segmented ed of the media types analyzedof the media types analyzedAudience differences are typically overstated in media propositiAudience differences are typically overstated in media propositions. ons. Around half of a mediumAround half of a medium’’s audience on average falls outside of its s audience on average falls outside of its claimed target audience.claimed target audience.Even with a reasonable percent (of its core), often larger mediaEven with a reasonable percent (of its core), often larger media still still have greater actual numbers.have greater actual numbers.
97
97

Outlook For The Broadcast Networks David Poltrack - December 5, 2011
UBS 39th Annual Global Media and Communications Conference
Media that claim to be more targeted deliver more wastage, not less.
Smarter TargetingSmarter Targeting
Media audiences are largely homogenous with TV the least segmentMedia audiences are largely homogenous with TV the least segmented ed of the media types analyzedof the media types analyzedAudience differences are typically overstated in media propositiAudience differences are typically overstated in media propositions. ons. Around half of a mediumAround half of a medium’’s audience on average falls outside of its s audience on average falls outside of its claimed target audience.claimed target audience.Even with a reasonable percent (of its core), often larger mediaEven with a reasonable percent (of its core), often larger media still still have greater actual numbers.have greater actual numbers.Media that claim to be more targeted deliver more wastage, not lMedia that claim to be more targeted deliver more wastage, not less.ess.
98
98

Outlook For The Broadcast Networks David Poltrack - December 5, 2011
UBS 39th Annual Global Media and Communications Conference
Professor Romaniuk offers four steps to smarter targeting: Know your category-aim for inclusion rather than exclusion; Learn about media-follow absolute numbers, not skews; Do the math-check the returns outweigh the costs, don’t assume, factor in fixed costs; Kick the habit, have a default plan; And what does she recommend that default plan should be?
Smarter TargetingSmarter Targeting
Four steps to smarter targeting:Four steps to smarter targeting:1.1. Know your categoryKnow your category--aim for inclusion rather than exclusionaim for inclusion rather than exclusion2.2. Learn about mediaLearn about media--follow absolute numbers, not skewsfollow absolute numbers, not skews3.3. Do the mathDo the math--check the returns outweigh the costs, doncheck the returns outweigh the costs, don’’t assume, factor t assume, factor
in fixed costsin fixed costs4.4. Kick the habit, have a default planKick the habit, have a default plan
99
99

Outlook For The Broadcast Networks David Poltrack - December 5, 2011
UBS 39th Annual Global Media and Communications Conference
The Default Plan: Target Market = Everyone who buys in category; Media Objective = Reach as many of these people as cost effectively aspossible; Message Strategy = Tap into the different reasons people buy the category. Conceptually targeting makes sense, practically it often does not. Let me provide you with a real life demonstration.
Smarter TargetingSmarter Targeting
The Default Plan:The Default Plan:
Target MarketTarget Market Everyone who buys in categoryEveryone who buys in category
Media ObjectiveMedia Objective Reach as many of these people as cost Reach as many of these people as cost effectively as possibleeffectively as possible
Message StrategyMessage Strategy Tap into the different reasons people Tap into the different reasons people buy the category.buy the category.
100
100

Outlook For The Broadcast Networks David Poltrack - December 5, 2011
UBS 39th Annual Global Media and Communications Conference
101
Television Audiences Can No Longer BeTelevision Audiences Can No Longer BeDefined by Age and Sex AloneDefined by Age and Sex Alone
Many of you are familiar with my perpetual battle against the advertising industry practice of defining television audiences by age and sex alone. Age, in particular, has been found to be a very poor surrogate for consumption or potential consumption for most products and services. Yet, the practice of buying and selling television time still focuses on the two age segments of Adults 18-49 and Adults 25-54, and their male and female components, as the key currency measures. Now, with far more relevant and precise measures of true audience value, advertisers have the analytical tools necessary to finally move beyond these inadequate measures in media planning and buying. And the time to do that is now.
101

Outlook For The Broadcast Networks David Poltrack - December 5, 2011
UBS 39th Annual Global Media and Communications Conference
102
Adults 18Adults 18--4949As a Percent of Total Adult PopulationAs a Percent of Total Adult Population
18-4962%
50-549%
65+16%
55-6413%
18-4957%
50-5410%
65+17%
55-6416%
20022002‐‐0303 20102010‐‐1111
Source: Nielsen Universe Estimates
You see, the Adult 18-49 demo has actually been declining as a percent of the total adult market since 2002, from 62% to 57%, while the Adult 50+ segments have been growing.
102

Outlook For The Broadcast Networks David Poltrack - December 5, 2011
UBS 39th Annual Global Media and Communications Conference
103
Adults 18Adults 18--4949As a Percent of Total Adult PopulationAs a Percent of Total Adult Population
Source: Nielsen Universe Estimates
18-4957%
50-5410%
65+17%
55-6416% 18-49
55%
50-549%
65+19%
55-6417%
20102010‐‐1111 20152015‐‐16 (Est.)16 (Est.)
From today through 2016, the 18-49 segment will continue to decline as a percent of the adult population, from 57% to 55%, and the 50-54 segment will also decline, from 10% to 9%. The growth will be in the 55-64 and 65+ segments. Marketers cannot afford to let these 55+ consumers disappear from their marketing sights.
103

Outlook For The Broadcast Networks David Poltrack - December 5, 2011
UBS 39th Annual Global Media and Communications Conference
New Television Audience SegmentationNew Television Audience Segmentation
104
Therefore, we believe that now is the time to develop a better way to define television audiences. This has led us to develop a new television audience segmentation model.But we did not do this alone.
104

Outlook For The Broadcast Networks David Poltrack - December 5, 2011
UBS 39th Annual Global Media and Communications Conference
New Television Audience SegmentationNew Television Audience Segmentation
105
Tied to All Nielsen DatabasesNielsen “Ratings” Can Be Computed by Segment
Collaboration of CBS and NielsenCollaboration of CBS and Nielsen
We turned to Nielsen to help us build this new segmentation model. More precisely, we turned to Cambridge Marketing, the renowned marketing consulting firm recently acquired by Nielsen. We commissioned Cambridge not to just develop this segmentation model, but to integrate it with all of Nielsen’s data bases. As a result, we now have a new model defining andsegmenting the television audience which can offer us and our advertisers Nielsen “ratings” for each of the segments comprising the television audience as well as cross media usage profile encompassing the Nielsen online panel and the MRI data base.
105

Outlook For The Broadcast Networks David Poltrack - December 5, 2011
UBS 39th Annual Global Media and Communications Conference
TV Moderators
Program PassionatesStreamersTV
CompanionsSports
EnthusiastsMedia
Trendsetters
Dedicated to a group of programs. Most likely to time shift to stay up to date
Percent of Pop: 18%
Early adopters of both TV content and technology. Social diffusers
Percent of Pop: 21%
Interest is anchored in sports, but also extends to action-oriented programming
Percent of Pop: 15%
Seek to minimizetheir TV usage
Percent of Pop: 15%
Watch select content across multiple screens
Percent of Pop: 15%
Use TV for companion-ship. TV is always on, but in the background
Percent of Pop: 16%
106
Six Demand Profit Pool PersonasSix Demand Profit Pool PersonasRole and Relationship with TV and TechnologyRole and Relationship with TV and Technology
Let’s look at each of the six segments. I do not have enough time to full profiles. Here is a quick look at a typical member of each segment. First, TV Companion: Older female; stays at home; uses TV for companionship. Sports Enthusiast: Middle-aged male; interest anchored in sports+action-oriented programs. Streamer: Younger man or woman; watches select content across multiple screens. TV Moderator: Older, conservative; seeks to minimize TV usage. Media Trendsetter: Urban, multicultural social diffuser. Program Passionate: Younger, upscale woman; most likely to time shift favorite programs.
106

Outlook For The Broadcast Networks David Poltrack - December 5, 2011
UBS 39th Annual Global Media and Communications Conference
107
Six Demand Profit Pool PersonasSix Demand Profit Pool PersonasMedia ConsumptionMedia Consumption
These segments divide the population into six groups that are clearly different in terms of lifestyle and consumer interests. Given that the segmentation was done on a profile that was very detailed in respect to media use and, more specifically, television viewing, you would expect the television viewing choices of the members to vary significantly.Nielsen was able to employ the analytical process of fusion to combine this segmentation base with the TV panel and develop Nielsen “ratings” for each program. Here are the season-to-date results…
107

Outlook For The Broadcast Networks David Poltrack - December 5, 2011
UBS 39th Annual Global Media and Communications Conference
Six Demand Profit Pool Primetime RatingsSix Demand Profit Pool Primetime Ratings20112011--12 Season12 Season--toto--DateDate
108
Source: Nielsen/Cambridge Fusion, 9/19/11-10/9/11, Primetime Regular Programs, No Sports; Live+7 Data
On a network-by-network basis, CBS is the leader in all six categories. Yes, CBS is number one with Streamers. The actual rating levels change but the overall ranking is about the same. FOX and ABC which are close on an overall viewer basis do switch place in some categories. More significant is the fact that this pattern holds on the top program level.
108

Outlook For The Broadcast Networks David Poltrack - December 5, 2011
UBS 39th Annual Global Media and Communications Conference
Source: Nielsen/Cambridge Fusion, 9/19/11-10/9/11, Primetime Regular Programs, No Sports; Live+7 Data
Six Demand Profit Pool Primetime RankingsSix Demand Profit Pool Primetime Rankings20112011--12 Season12 Season--toto--DateDate
109
Here are the Top Ten programs with each of the segments. You cansee, for the most part, the same programs make up the top ten for each segment.
109

Outlook For The Broadcast Networks David Poltrack - December 5, 2011
UBS 39th Annual Global Media and Communications Conference
Six Demand Profit Pool Primetime RankingsSix Demand Profit Pool Primetime Rankings20112011--12 Season12 Season--toto--DateDate
Source: Nielsen/Cambridge Fusion, 9/19/11-10/9/11, Primetime Regular Programs, No Sports; Live+7 Data
110
And, yes, there are a lot of CBS programs on these lists. Which brings us back to the paper on Smarter Targeting.
110

Outlook For The Broadcast Networks David Poltrack - December 5, 2011
UBS 39th Annual Global Media and Communications Conference
This segmentation clearly supports two of Professor Romaniuk’s findings related to media: Media audiences are largely homogenous with TV the least segmented of the media types analyzed; Even with a reasonable percent (of its core), often larger media still have greater actual numbers of any target group. So, another problem with targeting is that it does not work well with television. And television is the most effective advertising medium. Which brings me to another major CBS/Nielsen initiative.
Smarter TargetingSmarter Targeting
Media audiences are largely homogenous with TV the least segmentMedia audiences are largely homogenous with TV the least segmented of ed of the media types analyzedthe media types analyzedAudience differences are typically overstated in media propositiAudience differences are typically overstated in media propositions. Around ons. Around half of a mediumhalf of a medium’’s audience on average falls outside of its claimed target s audience on average falls outside of its claimed target audience.audience.Even with a reasonable percent (of its core), often larger mediaEven with a reasonable percent (of its core), often larger media still have still have greater actual numbers.greater actual numbers.Media that claims to be more targeted deliver more wastageMedia that claims to be more targeted deliver more wastage--not less.not less.
111
111

Outlook For The Broadcast Networks David Poltrack - December 5, 2011
UBS 39th Annual Global Media and Communications Conference
112
CBS has been working with Nielsen and their partner, Catalina Marketing, on the development of a single-source measurement service combining purchase behavior and television viewing activity in the same households. This work has led to the creation of an analytical tool for media planning and selection.
112

Outlook For The Broadcast Networks David Poltrack - December 5, 2011
UBS 39th Annual Global Media and Communications Conference
113
VolumetricsVolumetrics
Volumetrics enables Nielsen Catalina Solutions to define television audiences for advertisers in terms of actual product purchase behavior as opposed to surrogate demographic measures. The application of this form of audience evaluation often substantially changes the relative ranking of programs.
113

Outlook For The Broadcast Networks David Poltrack - December 5, 2011
UBS 39th Annual Global Media and Communications Conference
Source: Nielsen/Catalina Fusion, 6/28/10 – 6/26/11, Primetime Regular Programs, No Sports; Live+3 Commercial Data
114
Adults 18Adults 18--49 Rating Points49 Rating Points
As a reference point, let’s look at how primetime programs layout on a graph relative to Adults 18-49 delivery. The vertical axis represents the number of Adults 18-49 viewers being delivered. The higher on the graph, the better.
114

Outlook For The Broadcast Networks David Poltrack - December 5, 2011
UBS 39th Annual Global Media and Communications Conference
Source: Nielsen/Catalina Fusion, 6/28/10 – 6/26/11, Primetime Regular Programs, No Sports; Live+3 Commercial Data
115
Adults 18Adults 18--49 Rating Points49 Rating Points
The horizontal axis represents the concentration of Adults 18-49 by program. The further to the right, the higher the concentration. The goal is to be in the right-hand, upper quadrant. The fact that there are not many colored boxes in that quadrant is a testimony to the homogeneous viewer profile of broadcast network primetime programs as Professor Romaniuk pointed out.
115

Outlook For The Broadcast Networks David Poltrack - December 5, 2011
UBS 39th Annual Global Media and Communications Conference
Source: Nielsen/Catalina Fusion, 6/28/10 – 6/26/11, Primetime Regular Programs, No Sports; Live+3 Commercial Data
Adults 18Adults 18--49 Rating Points49 Rating Points
116
Now we are going to compare this graph with the graphs based upon product usage as opposed to demographics. Watch how the programs’positions shift when I change the slide. I have highlighted one program, BLUE BLOODS, to make it easier to see how the switch from the demographic surrogate measure to the product usage measure changes the program landscape. I will use the soft drink category in this demo, since is a category that normally uses Adults 18-49 as a surrogate measure.
116
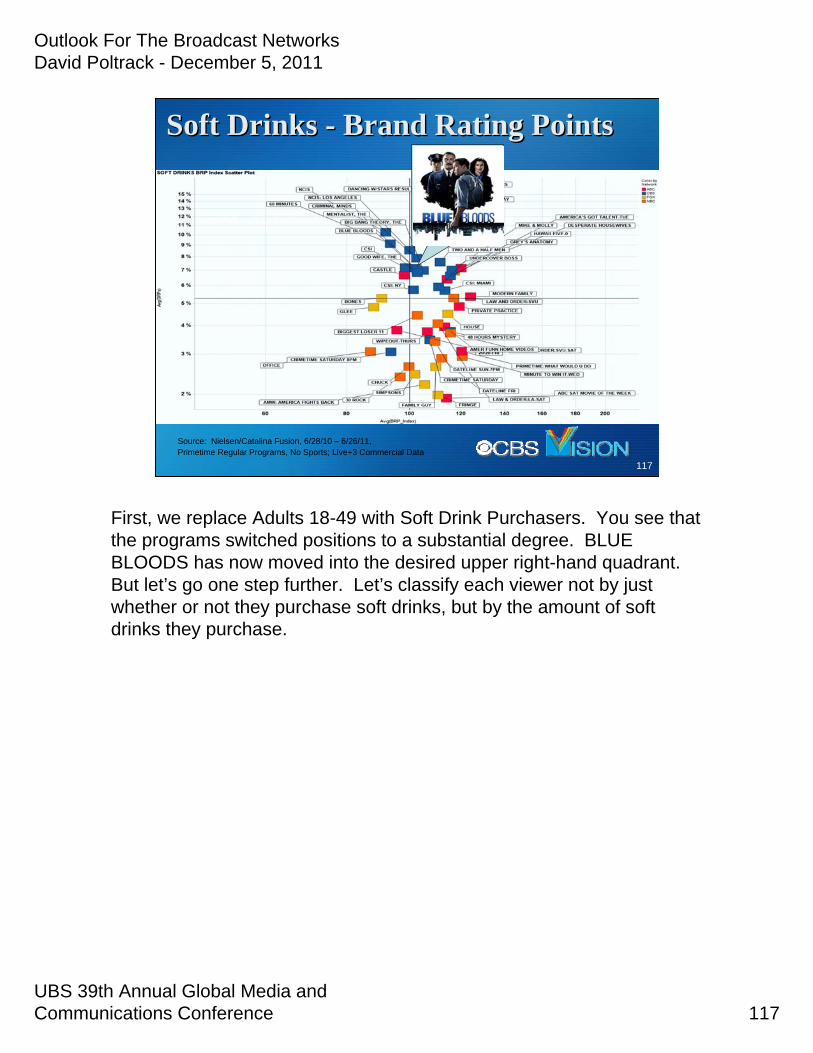
Outlook For The Broadcast Networks David Poltrack - December 5, 2011
UBS 39th Annual Global Media and Communications Conference
Source: Nielsen/Catalina Fusion, 6/28/10 – 6/26/11, Primetime Regular Programs, No Sports; Live+3 Commercial Data
Soft Drinks Soft Drinks -- Brand Rating PointsBrand Rating Points
117
First, we replace Adults 18-49 with Soft Drink Purchasers. You see that the programs switched positions to a substantial degree. BLUE BLOODS has now moved into the desired upper right-hand quadrant. But let’s go one step further. Let’s classify each viewer not by just whether or not they purchase soft drinks, but by the amount of soft drinks they purchase.
117

Outlook For The Broadcast Networks David Poltrack - December 5, 2011
UBS 39th Annual Global Media and Communications Conference
Source: Nielsen/Catalina Fusion, 6/28/10 – 6/26/11, Primetime Regular Programs, No Sports; Live+3 Commercial Data
Soft Drinks Soft Drinks -- Volume Rating PointsVolume Rating Points
118
Once again we see significant movement among the programs along the two axes. BLUE BLOODS has moved to an even more favorable position. Up until this point, we have not included the variable cost of an ad in each of the programs in our analysis. Since Adults 18-49 is a major currency measure in the national television market, programs with high concentrations of Adults 18-49 tend to get a premium Cost-Per-Point or CPM.
118
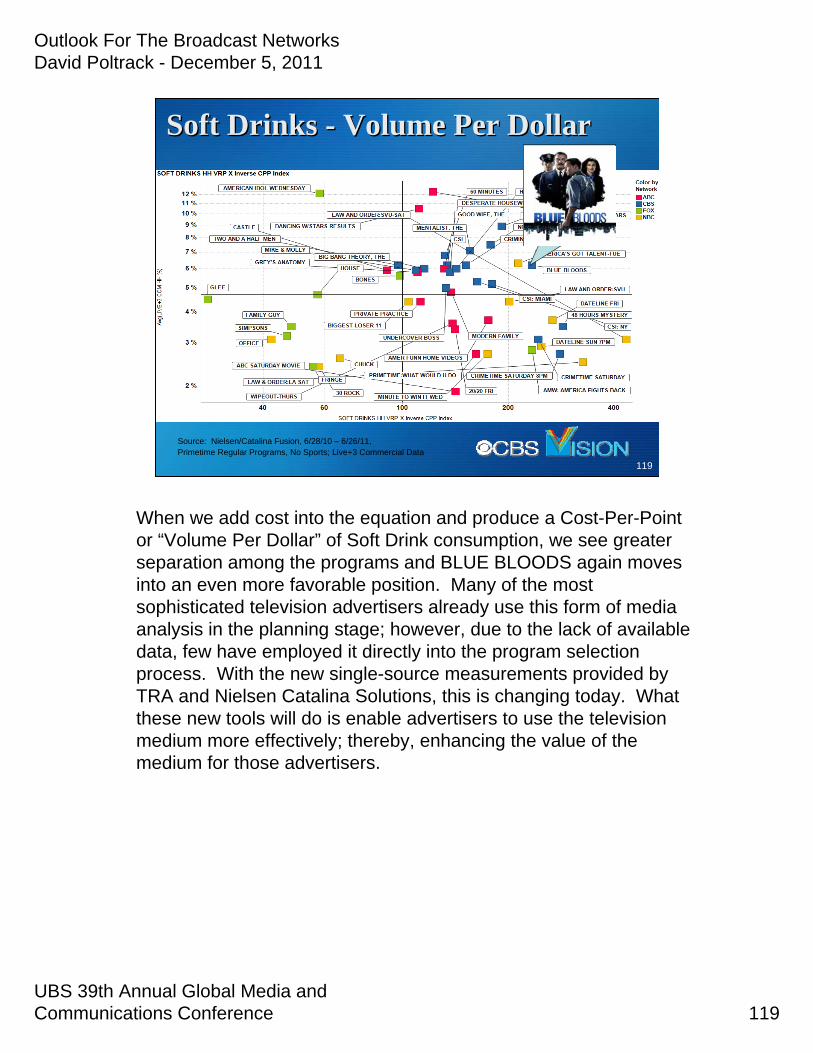
Outlook For The Broadcast Networks David Poltrack - December 5, 2011
UBS 39th Annual Global Media and Communications Conference
Source: Nielsen/Catalina Fusion, 6/28/10 – 6/26/11, Primetime Regular Programs, No Sports; Live+3 Commercial Data
Soft Drinks Soft Drinks -- Volume Per DollarVolume Per Dollar
119
When we add cost into the equation and produce a Cost-Per-Point or “Volume Per Dollar” of Soft Drink consumption, we see greater separation among the programs and BLUE BLOODS again moves into an even more favorable position. Many of the most sophisticated television advertisers already use this form of media analysis in the planning stage; however, due to the lack of available data, few have employed it directly into the program selection process. With the new single-source measurements provided by TRA and Nielsen Catalina Solutions, this is changing today. What these new tools will do is enable advertisers to use the television medium more effectively; thereby, enhancing the value of the medium for those advertisers.
119

Outlook For The Broadcast Networks David Poltrack - December 5, 2011
UBS 39th Annual Global Media and Communications Conference
Let me conclude my remarks with a brief update on the subscriber. Last year, I presented the results of research on new distribution options that we conducted at our Television City research facility in Las Vegas. Shortly after the conference, weupdated that research. In this new technology research we present all of the video distribution options available to the consumer. We have them compare these options to each other and to their current television distribution service.
The SubscriberThe Subscriber
Point of ResistancePoint of ResistanceBroadcastersBroadcasters’’ ShareShareTowards subscription fee/viewing alignmentTowards subscription fee/viewing alignment
120
120

Outlook For The Broadcast Networks David Poltrack - December 5, 2011
UBS 39th Annual Global Media and Communications Conference
The Viewers ChooseThe Viewers Choose
121
After the respondents have evaluated each of the options, we give them a list of all of the current television programs rated by Nielsen and ask them to tell us which of these programs a television distribution service would have to include for them to consider subscribing to that service. Here are the results…
121

Outlook For The Broadcast Networks David Poltrack - December 5, 2011
UBS 39th Annual Global Media and Communications Conference
Average Average ““Must HavesMust Haves”” = = 14 Shows14 ShowsTop 50 = Top 50 = 54%54% of Mentionsof MentionsTop 100 = Top 100 = 83%83% of Mentionsof Mentions
Broadcast Network ProgramsBroadcast Network Programs82%82% of Top 50 Mentionsof Top 50 Mentions67%67% of Top 100 Mentionsof Top 100 Mentions
Programs: A New Distribution SystemPrograms: A New Distribution SystemMust HaveMust Have
Source: CBS Television City Survey, January, 2011
122
From our master list of over 160 current television programs, the average respondent chooses 14 “must have” shows. Over half, 54%, of all mentions are accounted for by just 50 programs, Almost all of the mentions, 83%, are accounted for by 100 programs. Most of these programs are broadcast network programs: 82% of the top 50; 67% of the top 100.
122

Outlook For The Broadcast Networks David Poltrack - December 5, 2011
UBS 39th Annual Global Media and Communications Conference
Average Average ““Must HavesMust Haves”” = = 14 Shows14 ShowsTop 50 = Top 50 = 54%54% of Mentionsof MentionsTop 100 = Top 100 = 83%83% of Mentionsof Mentions
Broadcast Network ProgramsBroadcast Network Programs82%82% of Top 50 Mentionsof Top 50 Mentions67%67% of Top 100 Mentionsof Top 100 Mentions
Programs A New Distribution SystemPrograms A New Distribution SystemMust HaveMust Have
Source: CBS Television City Survey, January, 2011
Would failure to include at least half of Would failure to include at least half of ““must havemust have””programs be a deal breakerprograms be a deal breaker??
123
After this exercise, we asked our respondents: if you were offered a new distribution alternative that provided less than one-half of your “must-have” programs, would that be a deal breaker regarding paying for it.
123

Outlook For The Broadcast Networks David Poltrack - December 5, 2011
UBS 39th Annual Global Media and Communications Conference
Average Average ““Must HavesMust Haves”” = = 14 Shows14 ShowsTop 50 = Top 50 = 54%54% of Mentionsof MentionsTop 100 = Top 100 = 83%83% of Mentionsof Mentions
Broadcast Network ProgramsBroadcast Network Programs82%82% of Top 50 Mentionsof Top 50 Mentions67%67% of Top 100 Mentionsof Top 100 Mentions
Programs A New Distribution SystemPrograms A New Distribution SystemMust HaveMust Have
Source: CBS Television City Survey, January, 2011
90%90% DEAL BREAKERDEAL BREAKER
124
…90% said that it would.
124

Outlook For The Broadcast Networks David Poltrack - December 5, 2011
UBS 39th Annual Global Media and Communications Conference 125
The new competition in the distribution sector is heating up. This has already increased the value of those must-have broadcast network programs and will continue to do so. As a result, the broadcast networks are substantially increasingtheir revenues from retransmission fees for the existing cable, satellite and teleco distributors and entering into new revenue-generating arrangements with the new distributors such as Netflix and Amazon. And there is clearly more to come.
The SubscriberThe Subscriber
Point of ResistancePoint of ResistanceBroadcastersBroadcasters’’ ShareShareTowards subscription fee/viewing alignmentTowards subscription fee/viewing alignment
Retransmission FeesRetransmission FeesNew DistributorsNew Distributors
125
Outlook For The Broadcast Networks David Poltrack - December 5, 2011
UBS 39th Annual Global Media and Communications Conference 126
In summary, going into 2012, I see broadcast network television:in a stronger position with audiences; in a stronger position with advertisers; and in a stronger position with subscribers and thedistributors seeking those subscribers. As the economic recovery gains momentum, the broadcast networks are positioned to lead the way.
Broadcast Network Television:Broadcast Network Television:The AThe Amassmassing Mediuming Medium
126

Outlook For The Broadcast Networks David Poltrack - December 5, 2011
UBS 39th Annual Global Media and Communications Conference
Thank YouThank You
THANK YOU