The Outliers - Ad Library€¦ · The Play is Mature Enough to Start Identifying Outliers Source:...
18
January 2015 The Outliers
Transcript of The Outliers - Ad Library€¦ · The Play is Mature Enough to Start Identifying Outliers Source:...
January 2015
The Outliers
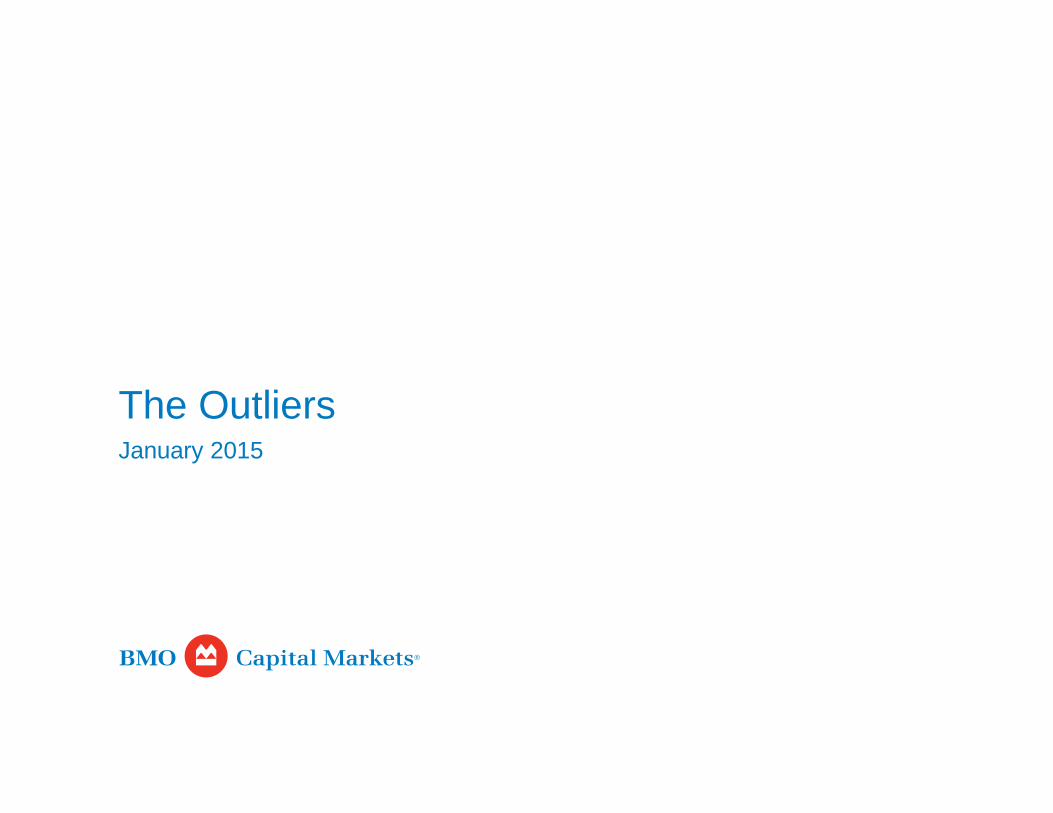
Finding Triple Digit IRRs in the Unconventional Montney Fairway
Outlier
>100% IRR
Liquids
(Thermal Maturity)
Set in Stone
Deliverability - IP
(Depth, Pressure, Completion)
Capital - $
(Depth, Pressure, Execution)
Source: Modified after EIA (US Energy Information Administration)
Unconventional Montney fairway spans an estimated 37,000 sq. km
2
3
4
5
6
7
8
30
40
50
60
70
80
90
100
110
Jan Feb Mar Apr May Jun Jul Aug Sep Oct Nov Dec Jan
$/G
J
$/b
bl
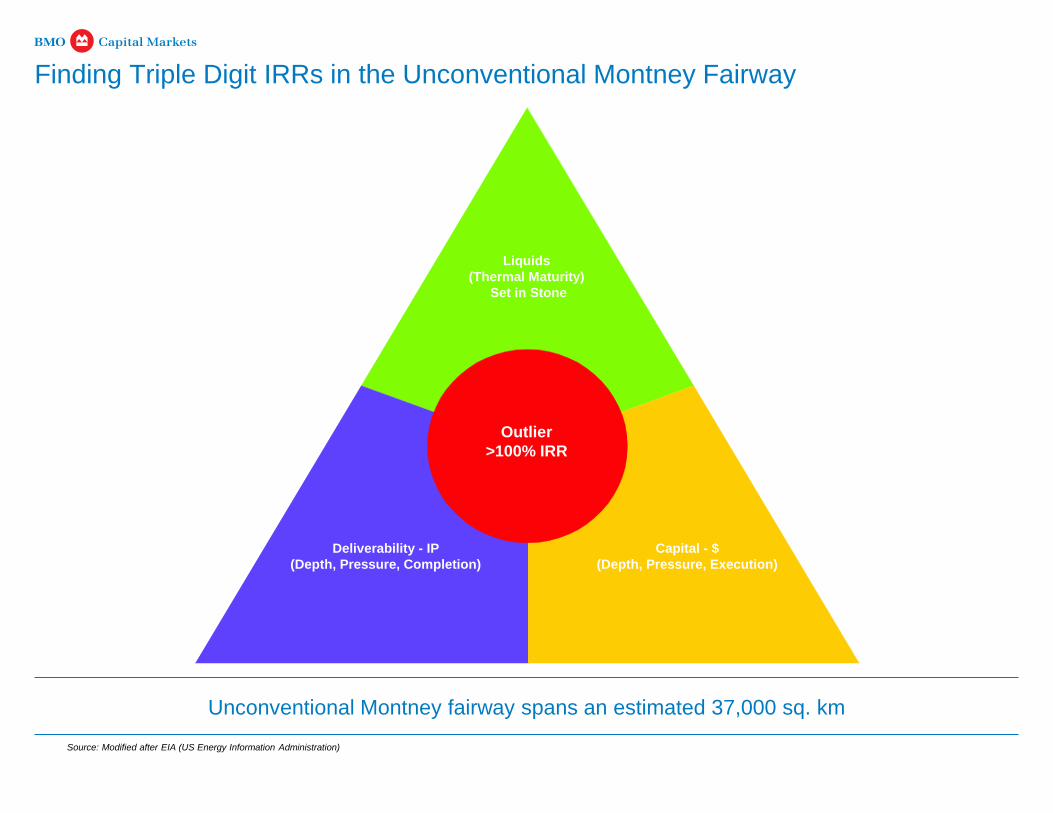
Edmonton Light WCS AECO
WCS -49.2%
AECO -32%
Edm. Light -48.3%
Catching the Falling Knife
Source: Bloomberg, all prices in CAD
As of January 9, 2015
CANADIAN COMMODITIES (SINCE JAN. 1, 2014)
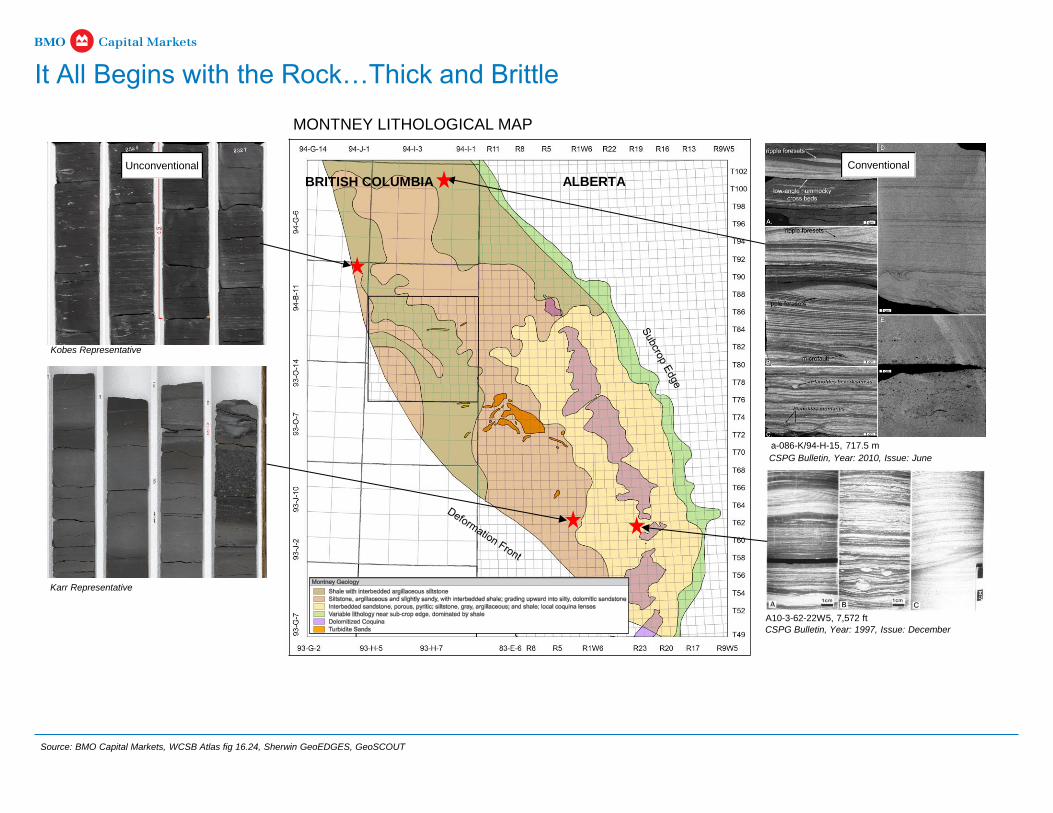
It All Begins with the Rock…Thick and Brittle
Source: BMO Capital Markets, WCSB Atlas fig 16.24, Sherwin GeoEDGES, GeoSCOUT
ALBERTA
CSPG Bulletin, Year: 1997, Issue: December
Unconventional Conventional
Kobes Representative
Karr Representative
BRITISH COLUMBIA
CSPG Bulletin, Year: 2010, Issue: June
a-086-K/94-H-15, 717.5 m
MONTNEY LITHOLOGICAL MAP
A10-3-62-22W5, 7,572 ft

Normal Pressure Line
North
Montney
South
Montney
ALBERTA BC
Conventional
C.I. = 250 m
1000
2000
3000
4000
TOTAL VERTICAL DEPTH TO TOP OF MONTNEY
Over-pressured Reservoir Increases Deliverability, Storage and Capture
Source: BMO Capital Markets, GeoSCOUT, geoEDGES, BC OGC
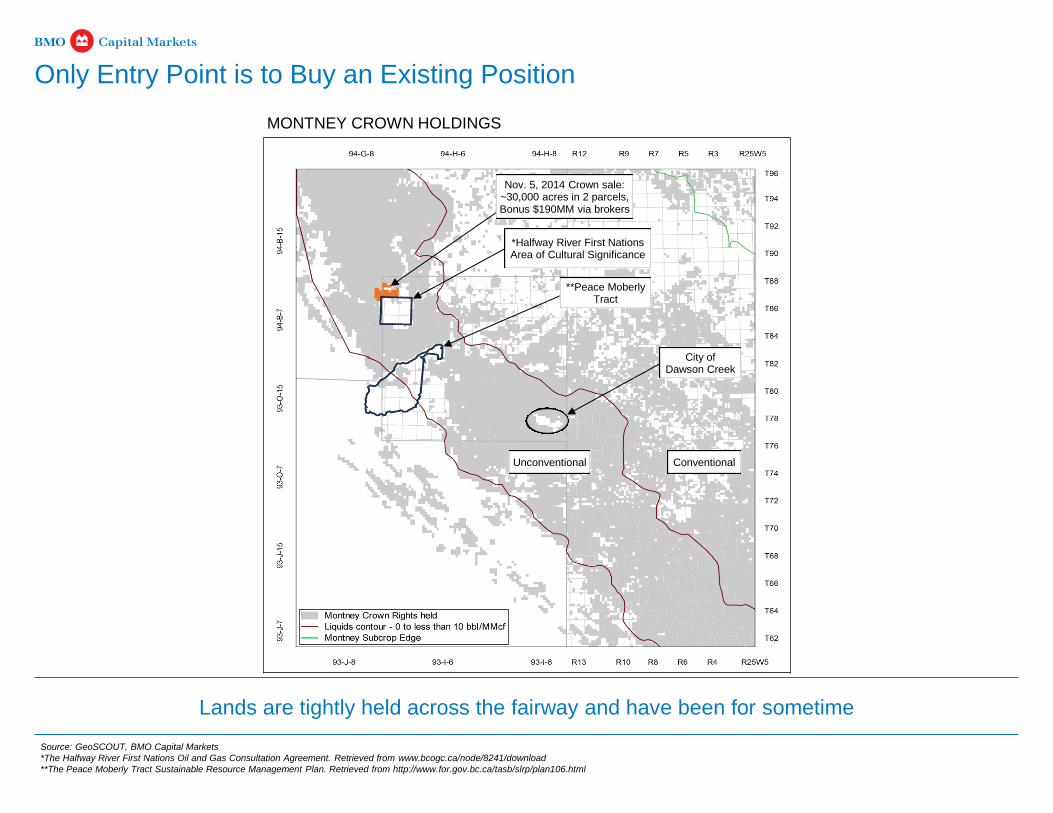
*Halfway River First Nations Area of Cultural Significance
**Peace Moberly Tract
City of Dawson Creek
Unconventional Conventional
Nov. 5, 2014 Crown sale: ~30,000 acres in 2 parcels, Bonus $190MM via brokers
MONTNEY CROWN HOLDINGS
Only Entry Point is to Buy an Existing Position
Source: GeoSCOUT, BMO Capital Markets
*The Halfway River First Nations Oil and Gas Consultation Agreement. Retrieved from www.bcogc.ca/node/8241/download
**The Peace Moberly Tract Sustainable Resource Management Plan. Retrieved from http://www.for.gov.bc.ca/tasb/slrp/plan106.html
Lands are tightly held across the fairway and have been for sometime
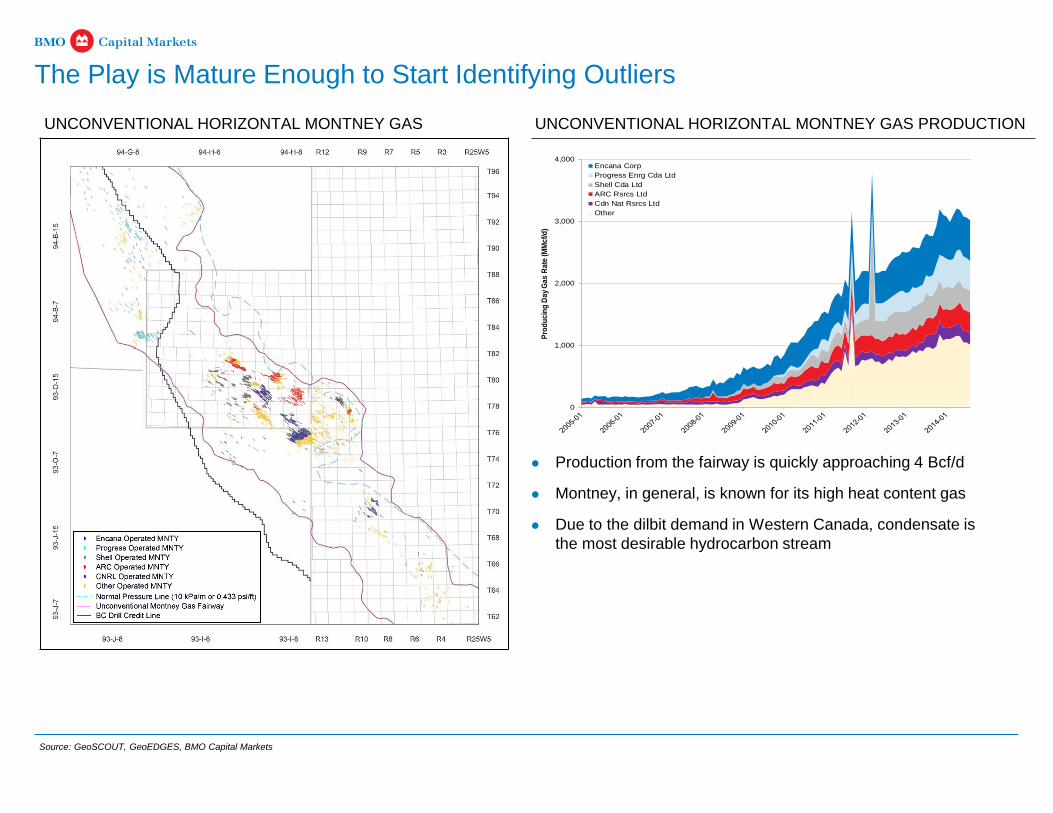
UNCONVENTIONAL HORIZONTAL MONTNEY GAS
The Play is Mature Enough to Start Identifying Outliers
Source: GeoSCOUT, GeoEDGES, BMO Capital Markets
UNCONVENTIONAL HORIZONTAL MONTNEY GAS PRODUCTION
Production from the fairway is quickly approaching 4 Bcf/d
Montney, in general, is known for its high heat content gas
Due to the dilbit demand in Western Canada, condensate is
the most desirable hydrocarbon stream
0
1,000
2,000
3,000
4,000
Pro
du
cin
g D
ay
Ga
s R
ate
(M
Mc
f/d
)
Encana Corp
Progress Enrg Cda Ltd
Shell Cda Ltd
ARC Rsrcs Ltd
Cdn Nat Rsrcs Ltd
Other
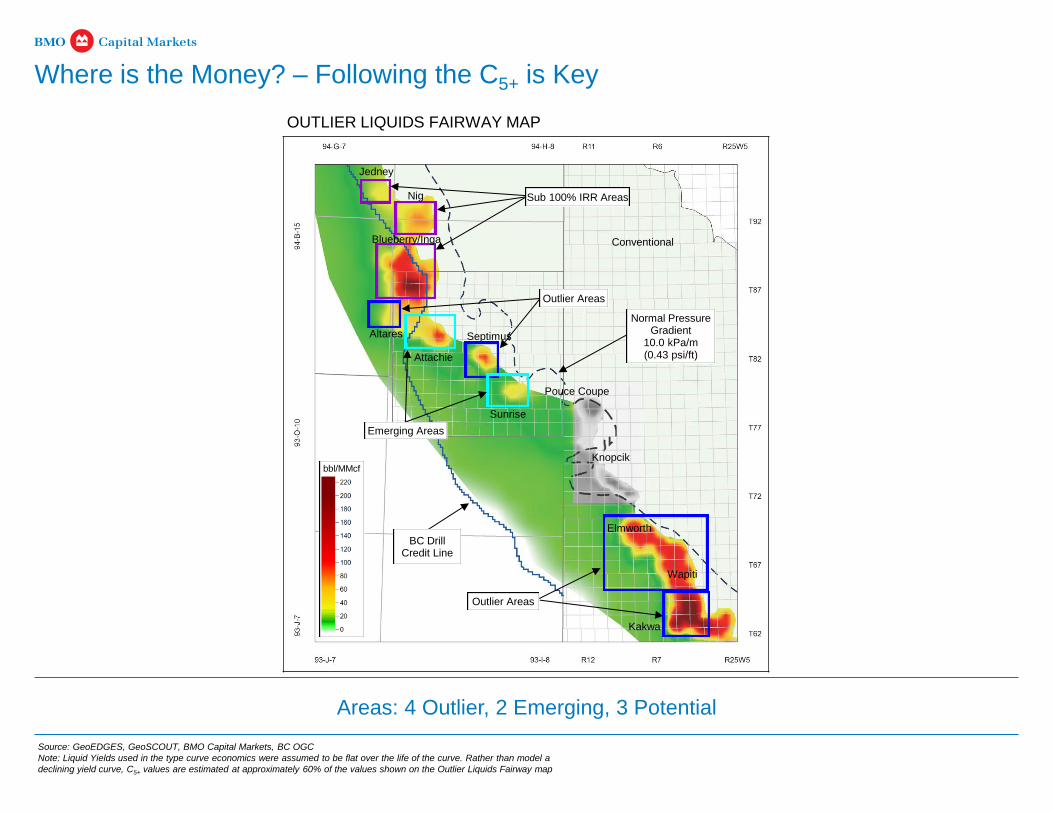
Jedney
Nig
Blueberry/Inga
Altares
Attachie
Sunrise
Pouce Coupe
Knopcik
Elmworth
Wapiti
Kakwa
bbl/MMcf
Normal Pressure Gradient
10.0 kPa/m (0.43 psi/ft)
Sub 100% IRR Areas
Emerging Areas
Outlier Areas
Outlier Areas
Septimus
Conventional
OUTLIER LIQUIDS FAIRWAY MAP
Where is the Money? – Following the C5+ is Key
Source: GeoEDGES, GeoSCOUT, BMO Capital Markets, BC OGC
Note: Liquid Yields used in the type curve economics were assumed to be flat over the life of the curve. Rather than model a
declining yield curve, C5+ values are estimated at approximately 60% of the values shown on the Outlier Liquids Fairway map
Areas: 4 Outlier, 2 Emerging, 3 Potential
BC Drill Credit Line
0
150
300
450
600
0.0
1.5
3.0
4.5
6.0
0 12 24 36 48
Co
nd
en
sa
te R
ate
(bb
l/d)
PD
GR
(M
Mc
f/d
)
Month
Gas Profile
Constant Yield
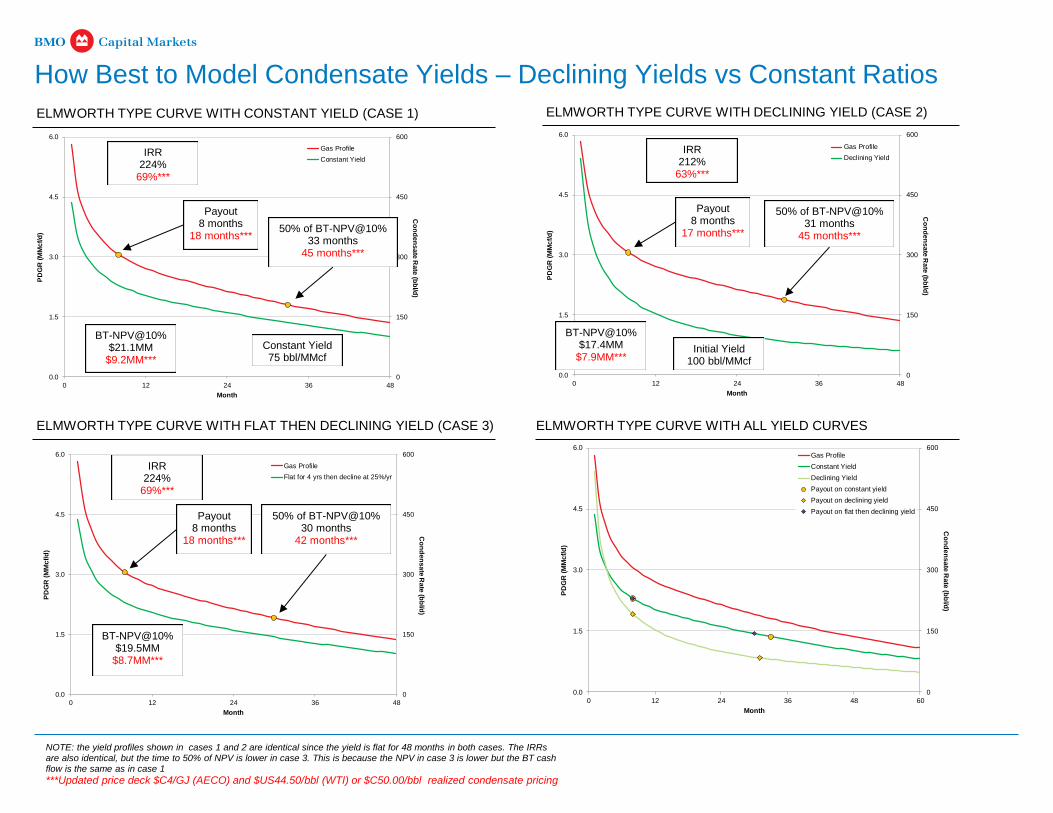
ELMWORTH TYPE CURVE WITH CONSTANT YIELD (CASE 1)
Payout 8 months
18 months*** 50% of BT-NPV@10%
33 months 45 months***
Constant Yield 75 bbl/MMcf
0
150
300
450
600
0.0
1.5
3.0
4.5
6.0
0 12 24 36 48
Co
nd
en
sa
te R
ate
(bb
l/d)
PD
GR
(M
Mc
f/d
)
Month
Gas Profile
Declining Yield
ELMWORTH TYPE CURVE WITH DECLINING YIELD (CASE 2)
0
150
300
450
600
0.0
1.5
3.0
4.5
6.0
0 12 24 36 48
Co
nd
en
sa
te R
ate
(bb
l/d)
PD
GR
(M
Mc
f/d
)
Month
Gas Profile
Flat for 4 yrs then decline at 25%/yr
ELMWORTH TYPE CURVE WITH FLAT THEN DECLINING YIELD (CASE 3)
Payout 8 months
17 months***
50% of BT-NPV@10% 31 months
45 months***
Initial Yield 100 bbl/MMcf
Payout 8 months
18 months***
50% of BT-NPV@10% 30 months
42 months***
0
150
300
450
600
0.0
1.5
3.0
4.5
6.0
0 12 24 36 48 60
Co
nd
en
sa
te R
ate
(bb
l/d)
PD
GR
(M
Mc
f/d
)
Month
Gas Profile
Constant Yield
Declining Yield
Payout on constant yield
Payout on declining yield
Payout on flat then declining yield
IRR 224%
69%***
IRR 212%
63%***
IRR 224%
69%***
ELMWORTH TYPE CURVE WITH ALL YIELD CURVES
NOTE: the yield profiles shown in cases 1 and 2 are identical since the yield is flat for 48 months in both cases. The IRRs are also identical, but the time to 50% of NPV is lower in case 3. This is because the NPV in case 3 is lower but the BT cash flow is the same as in case 1
***Updated price deck $C4/GJ (AECO) and $US44.50/bbl (WTI) or $C50.00/bbl realized condensate pricing
BT-NPV@10% $19.5MM
$8.7MM***
BT-NPV@10% $21.1MM
$9.2MM***
BT-NPV@10% $17.4MM
$7.9MM***
How Best to Model Condensate Yields – Declining Yields vs Constant Ratios

LOCATOR MAP
0.0
4.0
8.0
12.0
16.0
0 12 24 36 48
PD
GR
* (M
Mc
f/d
)
Month
* Normalised on Peak IP30
Kakwa/Karr
INPUT SENSITIVITY TO THE BASE VALUE IRR
The Outliers – Karr/Kakwa – IRR 350% (66%)***
Source: GeoSCOUT, BMO Capital Markets, BC OGC
**Flat pricing with $C4/GJ (AECO) and $US90/bbl (WTI)
***Updated price deck $C4/GJ (AECO) and $US44.50/bbl (WTI) or $C50.00/bbl realized condensate pricing
AREA PRODUCTION BY OPERATOR
TYPE WELL FORECAST
IP30 5.4 MMcf/d
C5+ Yield 150 bbl/MMcf
BT-NPV@10% $28.3MM
$10.2MM***
IRR 350%
IRR 66%***
Payout 0.5 yrs
Payout 1.3 yrs***
Drill Credit $3.3MM
Drill Credit $3.3MM***
Active Operators:
Seven Generations
Paramount
NuVista
CNRL
Harvest
XTO
Exposure:
Kicking Horse
(Donnycreek + Contact)
$76.97/bbl
$13.2MM
120 bbl/MMcf
4.5 MMcf/d
$3.21/Mcf
4.4 Bcf
$115.45/bbl
$8.8MM
180 bbl/MMcf
6.3 MMcf/d
$4.81/Mcf
6.6 Bcf
0 100 200 300 400 500 600
Condensate Price
Capital
Condensate Yield
30 Day IP
Gas Price
EUR
Change in IRR from base value (%)
Base Value**: BT-NPV@10% = $28.3MM, IRR > 350%
350
$96.21/bbl
150 bbl/MMcf
5.4 MMcf/d
$4.01/Mcf
5.5 Bcf
$11.0MM
0
25
50
75
0
25
50
75
We
ll Co
un
t
PD
GR
(M
Mc
f/d
)
Seven Generations
Paramount
XTO
Well Count
Normal Pressure Gradient
10.0 kPa/m (0.43 psi/ft)
BC Drill Credit Line

0.0
4.0
8.0
12.0
0 12 24 36 48
PD
GR
* (M
Mc
f/d
)
Month
* Normalised on Peak IP30
LOCATOR MAP
The Outliers – Elmworth/Wapiti – IRR >220% (69%)***
Source: GeoSCOUT, BMO Capital Markets, BC OGC
**Flat pricing with $C4/GJ (AECO) and $US90/bbl (WTI)
***Updated price deck $C4/GJ (AECO) and $US44.50/bbl (WTI) or $C50.00/bbl realized condensate pricing
TYPE WELL FORECAST
INPUT SENSITIVITY TO THE BASE VALUE IRR
IP30 5.8 MMcf/d
C5+ Yield 75 bbl/MMcf
BT-NPV@10% $21.1MM
$9.2MM***
IRR 224%
IRR 69%***
Payout 0.7 yrs
Payout 1.5 yrs***
Drill Credit $2.6MM
Drill Credit $2.6MM***
$10.8MM
$76.97/bbl
60 bbl/MMcf
$3.21/Mcf
5.1 MMcf/d
4.4 Bcf
$7.2MM
$115.45/bbl
90 bbl/MMcf
$4.81/Mcf
6.4 MMcf/d
6.7 Bcf
0 50 100 150 200 250 300 350 400 450
Capital
Condensate Price
Condensate Yield
Gas Price
30 Day IP
EUR
Change in IRR from base value (%)
Base Value**: BT-NPV@10% = $21.1MM, IRR > 224%
224
$9.0MM
75 bbl/MMcf
$4.01/Mcf
5.8 MMcf/d
5.5 Bcf
$96.21/bbl
Active Operators:
Encana
SINOPEC-Daylight
NuVista
Paramount
Shell
CNRL
Exposure:
Chinook
Birchcliff
0
50
100
150
0
50
100
150
We
ll Co
un
t
PD
GR
(M
Mc
f/d
)
Nuvista Enrg Ltd
Sinopec Daylight Enrg Ltd
Encana Corp
Paramount Rsrcs Ltd
Other
Well Count
Elmworth/Wapiti
AREA PRODUCTION BY OPERATOR
Normal Pressure Gradient
10.0 kPa/m (0.43 psi/ft)
BC Drill Credit Line
0.0
3.0
6.0
9.0
12.0
15.0
0 12 24 36 48
PD
GR
* (M
Mc
f/d
)
Month
* Normalised on Peak IP30
LOCATOR MAP
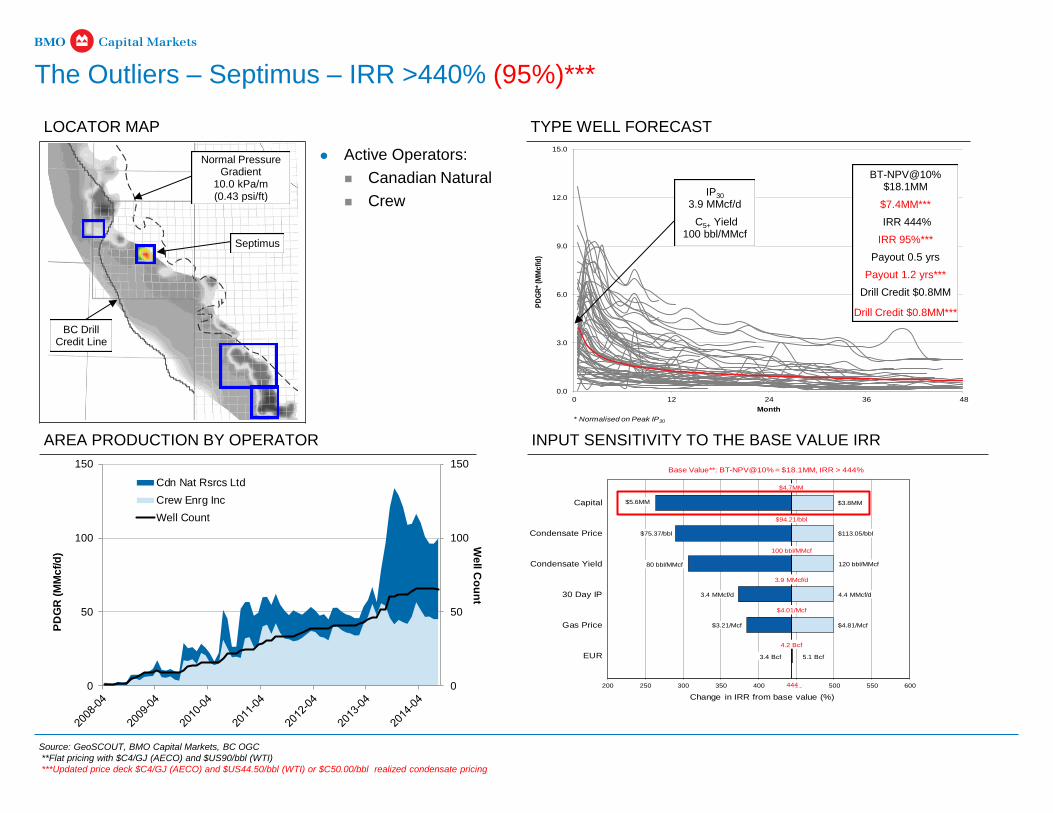
The Outliers – Septimus – IRR >440% (95%)***
Source: GeoSCOUT, BMO Capital Markets, BC OGC
**Flat pricing with $C4/GJ (AECO) and $US90/bbl (WTI)
***Updated price deck $C4/GJ (AECO) and $US44.50/bbl (WTI) or $C50.00/bbl realized condensate pricing
TYPE WELL FORECAST
INPUT SENSITIVITY TO THE BASE VALUE IRR
0
50
100
150
0
50
100
150
We
ll Co
un
t
PD
GR
(M
Mc
f/d
)
Cdn Nat Rsrcs Ltd
Crew Enrg Inc
Well Count
IP30 3.9 MMcf/d
C5+ Yield 100 bbl/MMcf
BT-NPV@10% $18.1MM
$7.4MM***
IRR 444%
IRR 95%***
Payout 0.5 yrs
Payout 1.2 yrs***
Drill Credit $0.8MM
Drill Credit $0.8MM***
Active Operators:
Canadian Natural
Crew
$5.6MM
$75.37/bbl
80 bbl/MMcf
3.4 MMcf/d
$3.21/Mcf
3.4 Bcf
$3.8MM
$113.05/bbl
120 bbl/MMcf
4.4 MMcf/d
$4.81/Mcf
5.1 Bcf
200 250 300 350 400 450 500 550 600
Capital
Condensate Price
Condensate Yield
30 Day IP
Gas Price
EUR
Change in IRR from base value (%)
Base Value**: BT-NPV@10% = $18.1MM, IRR > 444%
444
$4.7MM
100 bbl/MMcf
$94.21/bbl
3.9 MMcf/d
$4.01/Mcf
4.2 Bcf
Septimus
AREA PRODUCTION BY OPERATOR
Normal Pressure Gradient
10.0 kPa/m (0.43 psi/ft)
BC Drill Credit Line
0.0
3.0
6.0
9.0
12.0
15.0
0 12 24 36 48
PD
GR
* (M
Mc
f/d
)
Month
*Normalised on Peak IP30
LOCATOR MAP
The Outliers – Altares – Approaching 100% IRR (34%)***
Source: GeoSCOUT, BMO Capital Markets, BC OGC
**Flat pricing with $C4/GJ (AECO) and $US90/bbl (WTI)
***Updated price deck $C4/GJ (AECO) and $US44.50/bbl (WTI) or $C50.00/bbl realized condensate pricing
TYPE WELL FORECAST
INPUT SENSITIVITY TO THE BASE VALUE IRR
0
25
50
75
100
0
25
50
75
100
PD
GR
(M
Mc
f/d
)
Canbriam Enrg Inc
Progress Enrg Cda Ltd
Suncor Enrg Inc
Well Count
BT-NPV@10% $13.6MM
$5.2MM***
IRR 98%
IRR 34%***
Payout 1.1 yrs
Payout 2.2 yrs***
Drill Credit $2.6MM
Drill Credit $2.6MM***
IP30 5.4 MMcf/d
C5+ Yield 42 bbl/MMcf
$12.0MM
4.3 MMcf/d
$75.37/bbl
$3.21/Mcf
34 bbl/MMcf
5.4 Bcf
$8.0MM
6.5 MMcf/d
$113.05/bbl
$4.81/Mcf
50 bbl/MMcf
7.1 Bcf
0 20 40 60 80 100 120 140 160 180
Capital
30 Day IP
Condensate Price
Gas Price
Condensate Yield
EUR
Change in IRR from base value (%)
Base Value**: BT-NPV@10% = $13.6MM, IRR > 98%
98
$10.0MM
$94.21/bbl
$4.01/Mcf
42 bbl/MMcf
6.2 Bcf
5.4 MMcf/d
Active Operators:
Canbriam
Progress
Suncor
Altares
AREA PRODUCTION BY OPERATOR
Normal Pressure Gradient
10.0 kPa/m (0.43 psi/ft)
BC Drill Credit Line
***Updated price deck $C4/GJ (AECO) and $US44.50/bbl (WTI) or $C50.00/bbl realized condensate pricing
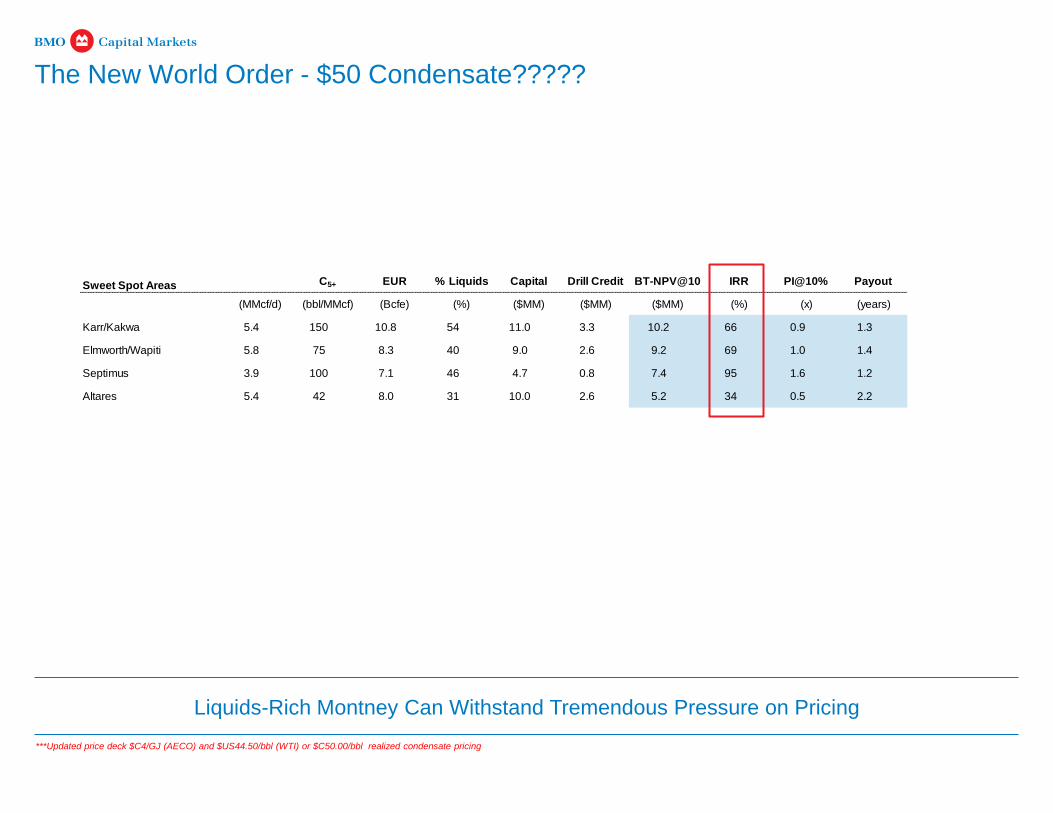
The New World Order - $50 Condensate?????
Liquids-Rich Montney Can Withstand Tremendous Pressure on Pricing
Sweet Spot Areas C5+ EUR % Liquids Capital Drill Credit BT-NPV@10 IRR PI@10% Payout
(MMcf/d) (bbl/MMcf) (Bcfe) (%) ($MM) ($MM) ($MM) (%) (x) (years)
Karr/Kakwa 5.4 150 10.8 54 11.0 3.3 10.2 66 0.9 1.3
Elmworth/Wapiti 5.8 75 8.3 40 9.0 2.6 9.2 69 1.0 1.4
Septimus 3.9 100 7.1 46 4.7 0.8 7.4 95 1.6 1.2
Altares 5.4 42 8.0 31 10.0 2.6 5.2 34 0.5 2.2
IP30 C5+ EUR % Liquids Capital Drill Credit BT-NPV@10 IRR PI@10% Payout
(MMcf/d) (bbl/MMcf) (Bcfe) (%) ($MM) ($MM) ($MM) (%) (x) (years)
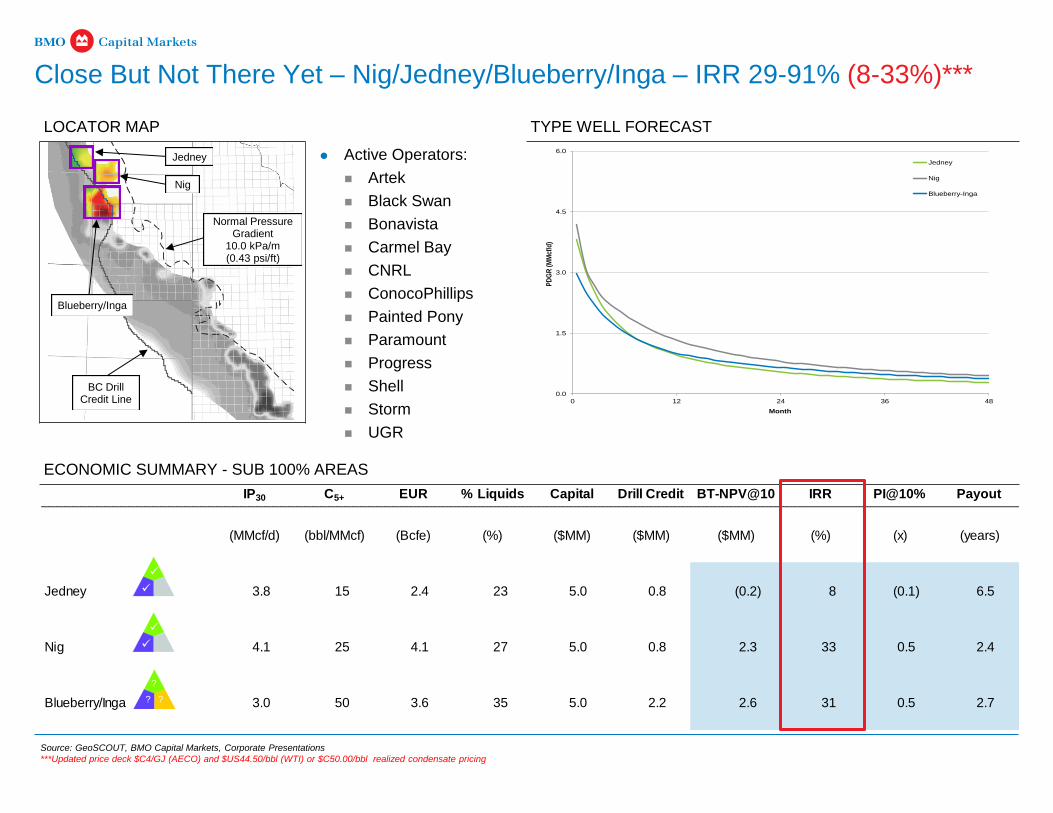
Jedney 3.8 15 2.4 23 5.0 0.8 (0.2) 8 (0.1) 6.5
Nig 4.1 25 4.1 27 5.0 0.8 2.3 33 0.5 2.4
Blueberry/Inga 3.0 50 3.6 35 5.0 2.2 2.6 31 0.5 2.7
LOCATOR MAP
Close But Not There Yet – Nig/Jedney/Blueberry/Inga – IRR 29-91% (8-33%)***
Source: GeoSCOUT, BMO Capital Markets, Corporate Presentations
***Updated price deck $C4/GJ (AECO) and $US44.50/bbl (WTI) or $C50.00/bbl realized condensate pricing
TYPE WELL FORECAST
0.0
1.5
3.0
4.5
6.0
0 12 24 36 48
PD
GR
(M
Mcf
/d)
Month
Jedney
Nig
Blueberry-Inga
ECONOMIC SUMMARY - SUB 100% AREAS
Active Operators:
Artek
Black Swan
Bonavista
Carmel Bay
CNRL
ConocoPhillips
Painted Pony
Paramount
Progress
Shell
Storm
UGR
Jedney
Nig
Blueberry/Inga
?
? ?
BC Drill Credit Line
Normal Pressure Gradient
10.0 kPa/m (0.43 psi/ft)
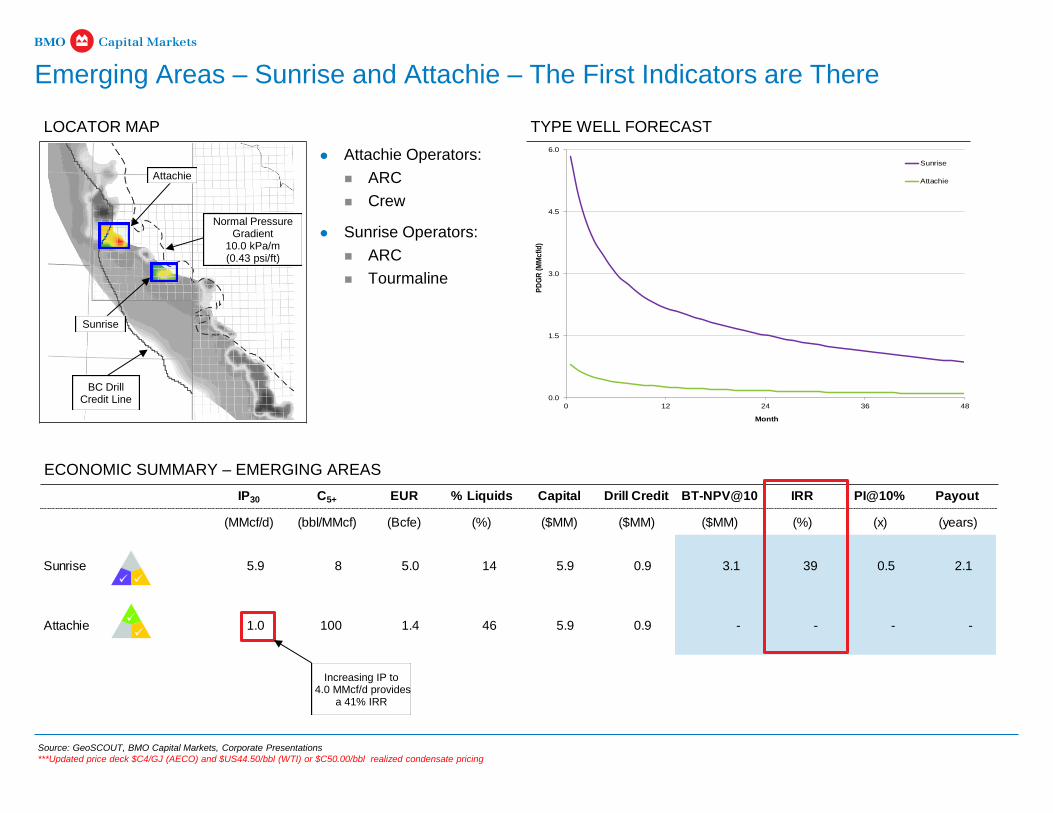
Attachie
Sunrise
IP30 C5+ EUR % Liquids Capital Drill Credit BT-NPV@10 IRR PI@10% Payout
(MMcf/d) (bbl/MMcf) (Bcfe) (%) ($MM) ($MM) ($MM) (%) (x) (years)
Sunrise 5.9 8 5.0 14 5.9 0.9 3.1 39 0.5 2.1
Attachie 1.0 100 1.4 46 5.9 0.9 - - - -
Emerging Areas – Sunrise and Attachie – The First Indicators are There
Source: GeoSCOUT, BMO Capital Markets, Corporate Presentations
***Updated price deck $C4/GJ (AECO) and $US44.50/bbl (WTI) or $C50.00/bbl realized condensate pricing
TYPE WELL FORECAST
ECONOMIC SUMMARY – EMERGING AREAS
0.0
1.5
3.0
4.5
6.0
0 12 24 36 48
PD
GR
(M
Mc
f/d
)
Month
Sunrise
Attachie
Attachie Operators:
ARC
Crew
Sunrise Operators:
ARC
Tourmaline
LOCATOR MAP
BC Drill Credit Line
Normal Pressure Gradient
10.0 kPa/m (0.43 psi/ft)
Increasing IP to 4.0 MMcf/d provides
a 41% IRR

OUTLIER LIQUIDS FAIRWAY MAP
bbl/MMcf
Pouce Coupe
Knopcik
Jedney
Nig
Blueberry-Inga
Altares
Attachie
Sunrise
Elmworth
Wapiti
Kakwa
Septimus
Conventional
Source: GeoEDGES, GeoSCOUT, BMO Capital Markets, BC OGC
Note: Liquid Yields used in the type curve economics were assumed to be flat over the life of the curve. Rather than model a
declining yield curve, C5+ values are estimated at approximately 60% of the values shown on the Outlier Liquids Fairway map
What to Watch For
OUTLIER AREAS
Focus on continued well performance in the ranges
observed to date
For the outliers, control over infrastructure solutions will be
key to success
Continued improvements in capital efficiencies – will we see
declining cost structure?
EMERGING AREAS
Here the focus will be on consistent C5+ results from
appraisal wells
Continued improvements in deliverability as completion
practices are refined
Lay the groundwork for thoughtful development of
infrastructure – particularly liquids
SUB 100% IRR AREAS
Movement of the drill credit line east will materially and
positively impact the economics at Nig and Jedney
Changes in well completion techniques that could improve
the co-production of C5+ (slow back, larger fracs etc.) and IPs
Normal Pressure Gradient
10.0 kPa/m (0.43 psi/ft)
BC Drill Credit Line

These materials are confidential and proprietary to, and may not be reproduced, disseminated or referred to, in whole or in part without the prior consent of BMO Capital
Markets (“BMO”). These materials have been prepared exclusively for the BMO client or potential client to which such materials are delivered and may not be used for
any purpose other than as authorized in writing by BMO. BMO assumes no responsibility for verification of the information in these materials, and no representation or
warranty is made as to the accuracy or completeness of such information. BMO assumes no obligation to correct or update these materials. These materials do not
contain all information that may be required to evaluate, and do not constitute a recommendation with respect to, any transaction or matter. Any recipient of these
materials should conduct its own independent analysis of the matters referred to herein.
BMO Capital Markets is a trade name used by BMO Financial Group for the wholesale banking businesses of Bank of Montreal, BMO Harris Bank N.A. (member FDIC),
Bank of Montreal Ireland p.l.c., and Bank of Montreal (China) Co. Ltd and the institutional broker dealer businesses of BMO Capital Markets Corp. (Member SIPC) and
BMO Capital Markets GKST Inc. (Member SIPC) in the U.S., BMO Nesbitt Burns Inc. (Member Canadian Investor Protection Fund) in Canada and Asia, BMO Capital
Markets Limited (authorized and regulated by the Financial Conduct Authority) in Europe and Australia and BMO Advisors Private Limited in India. “BMO Capital
Markets” is a trademark of Bank of Montreal, used under license. "BMO (M-Bar roundel symbol)" is a registered trademark of Bank of Montreal, used under license.
BMO does not provide tax or legal advice. Any discussion of tax matters in these materials (i) is not intended to be used, and cannot be used or relied upon, for the
purposes of avoiding any tax penalties and (ii) may have been written in connection with the “promotion or marketing” of the transaction or matter described herein.
Accordingly, the recipient should seek advice based on its particular circumstances from an independent tax advisor.
Disclaimer
All values in this document are in C$ unless otherwise specified
BMO Capital Markets is a trade name used by BMO Financial Group for the wholesale banking businesses of Bank of Montreal, BMO Harris Bank N.A. (member
FDIC), Bank of Montreal Ireland p.l.c., and Bank of Montreal (China) Co. Ltd and the institutional broker dealer businesses of BMO Capital Markets Corp. (Member
SIPC) and BMO Capital Markets GKST Inc. (Member SIPC) in the U.S., BMO Nesbitt Burns Inc. (Member Canadian Investor Protection Fund) in Canada and Asia,
BMO Capital Markets Limited (authorised and regulated by the Financial Conduct Authority) in Europe and Australia and BMO Advisors Private Limited in India.
“Nesbitt Burns” is a registered trademark of BMO Nesbitt Burns Corporation Limited, used under license. “BMO Capital Markets” is a trademark of Bank of Montreal,
used under license. "BMO (M-Bar roundel symbol)" is a registered trademark of Bank of Montreal, used under license.
® Registered trademark of Bank of Montreal in the United States, Canada and elsewhere.
©COPYRIGHT 2015 BMO CAPITAL MARKETS CORP.