
The Outer Halos of Very Massive Galaxies: BCGs and their ... · Version August 25, 2017 submitted...
14
Article The Outer Halos of Very Massive Galaxies: BCGs and their DSC in the Magneticum Simulations Rhea-Silvia Remus 1, *, Klaus Dolag 1,2 , and Tadziu L. Hoffmann 1 1 Universitäts-Sternwarte München, Scheinerstr. 1, D-81679 München, Germany 2 Max Planck Institut for Astrophysics, D-85748 Garching, Germany * [email protected] Academic Editor: name Version August 25, 2017 submitted to Galaxies Abstract: Recent hydrodynamic cosmological simulations cover volumes up to Gpc 3 and resolve 1 halos across a wide range of masses and environments, from massive galaxy clusters down to normal 2 galaxies, while following a large variety of physical processes (star-formation, chemical enrichment, 3 AGN feedback) to allow a selfconsistent comparison to observations at multiple wavelengths. Using 4 the Magneticum simulations we investigate the buildup of the diffuse stellar component (DSC) 5 around massive galaxies within group and cluster environments. The DSC in our simulations 6 reproduces the spatial distribution of the observed intracluster light (ICL) as well as its kinematic 7 properties remarkably well. For galaxy clusters and groups we find that, although the DSC in almost 8 all cases shows a clear separation from the brightest cluster galaxy (BCG) with regard to its dynamic 9 state, the radial stellar density distribution in many halos is often characterized by a single Sérsic 10 profile, representing both the BCG component and the DSC, very much in agreement with current 11 observational results. Interestingly, even in those halos that clearly show two components in both 12 the dynamics and the spatial distribution of the stellar component, no correlation between them is 13 evident. 14 Keywords: Galaxy clusters – intracluster light – numerical simulation 15 1. Introduction 16 Brightest cluster galaxies (BCGs), residing in the centers of galaxy clusters, are the most massive 17 and luminous galaxies in the universe. During their lifetime they experience frequent interactions with 18 satellite galaxies, and their growth is dominated by merger events. These merger events also lead to 19 the buildup of a diffuse stellar component (DSC), which very likely contains a significant fraction of 20 the total stellar mass of the galaxy clusters (see Murante et al., 2007 [1] and references therein). The 21 velocities of the stars in the BCG and the DSC have distinct kinematic distributions, which can be 22 characterized by two superposed Maxwellian distributions, as demonstrated by Dolag et al., 2010 [2]. 23 While the velocity dispersion of the stars in the BCG represents the central mass of the stars, the 24 velocity dispersion of the DSC is much larger and is comparable to that of the dark matter halo (see, 25 for example, Dolag et al., 2010 [2], Bender et al., 2015 [3], and Longobardi et al., 2015 [4]). More details 26 on this matter can also be found in a recent review by Mihos et al., 2016 [5]. 27 Similarly, early simulations of galaxy clusters found that the density distributions of BCGs in 28 clusters can be described by a superposition of two extended components as well (e.g., Puchwein et al., 29 2010 [6]). However, more recent simulations find the opposite, namely that in many cases the radial 30 density profiles can be described by a single profile, which is in good agreement with observations. 31 These simulations also indicate that a double-component fit to the radial density profiles is only needed 32 in rare cases. Interestingly, the three-dimensional distribution of these outer stellar halos seems to be 33 Submitted to Galaxies, pages 1 – 14 www.mdpi.com/journal/galaxies
Transcript of The Outer Halos of Very Massive Galaxies: BCGs and their ... · Version August 25, 2017 submitted...

Article
The Outer Halos of Very Massive Galaxies: BCGs andtheir DSC in the Magneticum Simulations
Rhea-Silvia Remus 1,*, Klaus Dolag1,2, and Tadziu L. Hoffmann1
1 Universitäts-Sternwarte München, Scheinerstr. 1, D-81679 München, Germany2 Max Planck Institut for Astrophysics, D-85748 Garching, Germany* [email protected]
Academic Editor: nameVersion August 25, 2017 submitted to Galaxies
Abstract: Recent hydrodynamic cosmological simulations cover volumes up to Gpc3 and resolve1
halos across a wide range of masses and environments, from massive galaxy clusters down to normal2
galaxies, while following a large variety of physical processes (star-formation, chemical enrichment,3
AGN feedback) to allow a selfconsistent comparison to observations at multiple wavelengths. Using4
the Magneticum simulations we investigate the buildup of the diffuse stellar component (DSC)5
around massive galaxies within group and cluster environments. The DSC in our simulations6
reproduces the spatial distribution of the observed intracluster light (ICL) as well as its kinematic7
properties remarkably well. For galaxy clusters and groups we find that, although the DSC in almost8
all cases shows a clear separation from the brightest cluster galaxy (BCG) with regard to its dynamic9
state, the radial stellar density distribution in many halos is often characterized by a single Sérsic10
profile, representing both the BCG component and the DSC, very much in agreement with current11
observational results. Interestingly, even in those halos that clearly show two components in both12
the dynamics and the spatial distribution of the stellar component, no correlation between them is13
evident.14
Keywords: Galaxy clusters – intracluster light – numerical simulation15
1. Introduction16
Brightest cluster galaxies (BCGs), residing in the centers of galaxy clusters, are the most massive17
and luminous galaxies in the universe. During their lifetime they experience frequent interactions with18
satellite galaxies, and their growth is dominated by merger events. These merger events also lead to19
the buildup of a diffuse stellar component (DSC), which very likely contains a significant fraction of20
the total stellar mass of the galaxy clusters (see Murante et al., 2007 [1] and references therein). The21
velocities of the stars in the BCG and the DSC have distinct kinematic distributions, which can be22
characterized by two superposed Maxwellian distributions, as demonstrated by Dolag et al., 2010 [2].23
While the velocity dispersion of the stars in the BCG represents the central mass of the stars, the24
velocity dispersion of the DSC is much larger and is comparable to that of the dark matter halo (see,25
for example, Dolag et al., 2010 [2], Bender et al., 2015 [3], and Longobardi et al., 2015 [4]). More details26
on this matter can also be found in a recent review by Mihos et al., 2016 [5].27
Similarly, early simulations of galaxy clusters found that the density distributions of BCGs in28
clusters can be described by a superposition of two extended components as well (e.g., Puchwein et al.,29
2010 [6]). However, more recent simulations find the opposite, namely that in many cases the radial30
density profiles can be described by a single profile, which is in good agreement with observations.31
These simulations also indicate that a double-component fit to the radial density profiles is only needed32
in rare cases. Interestingly, the three-dimensional distribution of these outer stellar halos seems to be33
Submitted to Galaxies, pages 1 – 14 www.mdpi.com/journal/galaxies

Version August 25, 2017 submitted to Galaxies 2 of 14
described universally by a so-called Einasto profile over a wide range of halo masses, as shown by34
Remus et al., 2016 [7], where the curvature of the radial profiles appears to be more closely linked to35
the cluster’s assembly history than the separation of the radial profiles into distinct components.36
In this study we analyse the velocity distributions as well as the projected radial surface density37
profiles of the stellar component in galaxy clusters selected from a state-of-the-art cosmological38
simulation, and test for possible correlations between these distributions.39
2. Simulations40
We use galaxy clusters selected from the Magneticum1 Pathfinder simulation set. This suite41
of fully hydrodynamic cosmological simulations comprises a broad range of simulated volumes,42
with box lengths of 2688 Mpc/h to 18 Mpc/h, covering different resolution levels of stellar particle43
masses from mStar = 6.5 × 10⁸M�/h at the lowest resolution level down to particle masses of mStar =44
1.9 × 10⁶M�/h at the highest resolution level. For this work we use two different simulations, Box2b45
and Box4, with the smaller one (Box4) having a higher resolution. The details of these two simulations46
are summarized in Table 1.47
Table 1. Magneticum simulations used in this work.
box size Npart mStar εStar
Box2b hr 910 Mpc 2 × 28803 3.5 × 10⁷ M�/h 2 kpc/hBox4 uhr 68 Mpc 2 × 5763 1.9 × 10⁶ M�/h 0.7 kpc/h
All simulations of the Magneticum Pathfinder simulation suite are performed with an advanced48
version of the tree-SPH code P-Gadget3 (Springel, 2005 [8]). They include metal-dependent radiative49
cooling, heating from a uniform time-dependent ultraviolet background, star formation according50
to Springel & Hernquist, 2003 [9], and the chemo-energetic evolution of the stellar population as51
traced by SN Ia, SN II, and AGB stars, including the associated feedback from these stars (Tornatore52
et al., 2007 [10]). Additionally, they follow the formation and evolution of supermassive black holes,53
including their associated quasar and radio-mode feedback. For a detailed description see Dolag et54
al. (in prep), Hirschmann et al., 2014 [11], and Teklu et al., 2015 [12].55
Galaxy clusters are chosen according to the total mass of a structure as found by the baryonic56
SUBFIND algorithm (see Dolag et al., 2009 [13]). For the larger, less resolved volume (Box2b) we classify57
all structures with masses of Mtot > 2 × 10¹⁴M� as clusters, independent of their dynamical state, and58
find 890 objects. For the smaller volume (Box4) there are no massive galaxy clusters, but the increased59
resolution enables us to utilize halos with masses down to 1 × 10¹³M� < Mtot < 1 × 10¹⁴M�, and60
therefore allows us to add galaxy groups down to the limit of massive field galaxies to this study.61
Including the 3 clusters and 35 groups from the smaller volume simulation we end up with a total62
sample of 928 objects, which is an unprecedentedly large sample of simulated galaxy clusters and63
groups for which we here, for the first time, provide a statistically representative analysis of the64
decomposition of the stellar components into the BCG and the DSC, providing predictions for future65
observational studies of the ICL and the BCGs.66
3. Velocity Distributions and Radial Surface Density Profiles67
In their detailed study, Dolag et al., 2010 [2] demonstrated that the two dynamical components68
found in the velocity distribution of the stellar component of galaxy clusters very well represent the69
stellar component of the BCGs and the DSC, the latter of which is itself a good approximation of the70
observed ICL in galaxy clusters. Following their approach we subtract all substructures (identified with71
1 www.magneticum.org

Version August 25, 2017 submitted to Galaxies 3 of 14
SUBFIND) from the stellar component of each cluster and use the remaining stars for this analysis. First,72
we calculate the velocities of all stellar particles in a cluster and bin them in small equal-width bins73
of ∆v = 10 km/s, thereby obtaining the intrinsic 3D velocity distribution of the stars in each cluster.74
Similarly, we choose a random viewing angle and calculate the projected radius of each stellar particle.75
Subsequently, we radially bin these particles using equal-particle bins, thus obtaining radial surface76
density distributions, effectively mimicking the radial surface brightness profiles that are commonly77
observed for galaxies and galaxy clusters, assuming a constant mass-to-light ratio. Examples of the78
velocity distributions and surface density profiles obtained by this methods are shown in the lower79
panels of Figures 1, 2, 3, and 4.80
To obtain the different components of BCG and DSC in the simulations, we again follow Dolag etal., 2010 [2]. First, we fit a superposition of two Maxwellian distributions
N(v) = k1v2 exp
(− v2
σ21
)+ k2v2 exp
(− v2
σ22
)(1)
to the velocity distribution of each cluster. Additionally, we fit a single Maxwellian distribution to81
the velocity distributions for comparison purposes. In most cases, a double-Maxwellian fit is needed82
to properly represent the underlying velocity distributions, as shown, for example, in the lower left83
panels of Figures 1 and 2. For comparison, we also show the stellar particle surface density map of the84
clusters including all substructures in the large image at the top of these figures. The white contours85
show equal-density lines of the stellar distribution without the substructures. For both clusters shown86
in Figs. 1 and 2, the BCG is clearly visible, but while the velocity distributions can be well described87
by double-Maxwellian fits in both cases, the morphological appearance of the two clusters is very88
different: While the cluster shown in Fig. 1 is clearly elongated with a massive colliding structure89
clearly visible even in the dark matter component (upper small image), the other cluster shown in90
Fig. 2 shows no signs of ongoing substantial accretion, and is only slightly elongated. This is true91
even in the X-ray map (middle small image), where the elongation is clearly visible for the first cluster92
while the second cluster shows a more compact shape. We also do not find a similarity between these93
clusters with regard to their shock properties: whereas the cluster shown in Fig. 1 has a clearly visible94
shock front in the upper right area of the cluster, indicating a recent merging event, the cluster shown95
in Fig. 2 shows no clear signs of such a recent merger event in the shock map (bottom small image).96
This clearly indicates that the velocity distribution of the cluster remembers the merger history of the97
cluster over a much larger timescale than other tracers like shocks or satellite distributions, which98
provide information only about the more recent mass assembly history of a cluster.99
In some cases, there is no improvement to the description of the velocity distribution of an100
individual cluster by using a double-Maxwellian distribution for the fit, as the velocity distributions of101
that particular cluster is already well described by a single Maxwellian distribution (see, for example,102
the lower left panel of Fig. 3). While the single-Maxwellian fit is a good approximation to the velocity103
distribution of the cluster stellar light, the stellar light map in the large image in the same figure clearly104
shows that the cluster is currently accreting another, relatively massive, substructure. This can be105
seen not only in the stellar component but also in the X-ray emission (middle small image) and the106
shock map (bottom small image). Thus, this clearly shows that the contribution from this merger to107
the cluster’s DSC is not very large yet and does not show up in the velocity distribution of the cluster108
as most stars that are brought in through the merger event have been subtracted by SUBFIND. Only109
in the very-high velocity end of the velocity distribution, the newly accreted component starts to be110
visible. This also indicates that the DSC of this cluster is very rich, which is caused by a rather diverse111
accretion history. However, these cases are very rare as we will show later on in this work.112
The lower left panel of Fig. 4 shows a very interesting albeit rare case for the velocity distribution113
of a galaxy cluster: for this cluster, a double-Maxwellian fit is still not sufficient and a third superposed114
component would be needed to actually capture all features visible in the velocity distribution.115

Version August 25, 2017 submitted to Galaxies 4 of 14
Figure 1. Example of a galaxy cluster where the velocity distribution is best described by a dou-ble Maxwellian fit, while the radial surface density profile can be well described by a single Sérsicprofile (class d/s). Upper left panel: Stellar particle density map of the cluster, with densest areas inyellow/green and least dense areas in blue/black. White contours mark the iso-brightness lines ofthe DSC with the galaxies subtracted. Upper right panels, from top to bottom: Total matter density map;X-ray surface brightness map; unsharp-masked image of the pressure map to visualize shock fronts, asindicated by the large, arc-like feature in the upper right corner. Lower left panel: Velocity histogram forthe stellar particles within the cluster, excluding those from substructures. (Continued in Fig.2.)
Version August 25, 2017 submitted to Galaxies 5 of 14
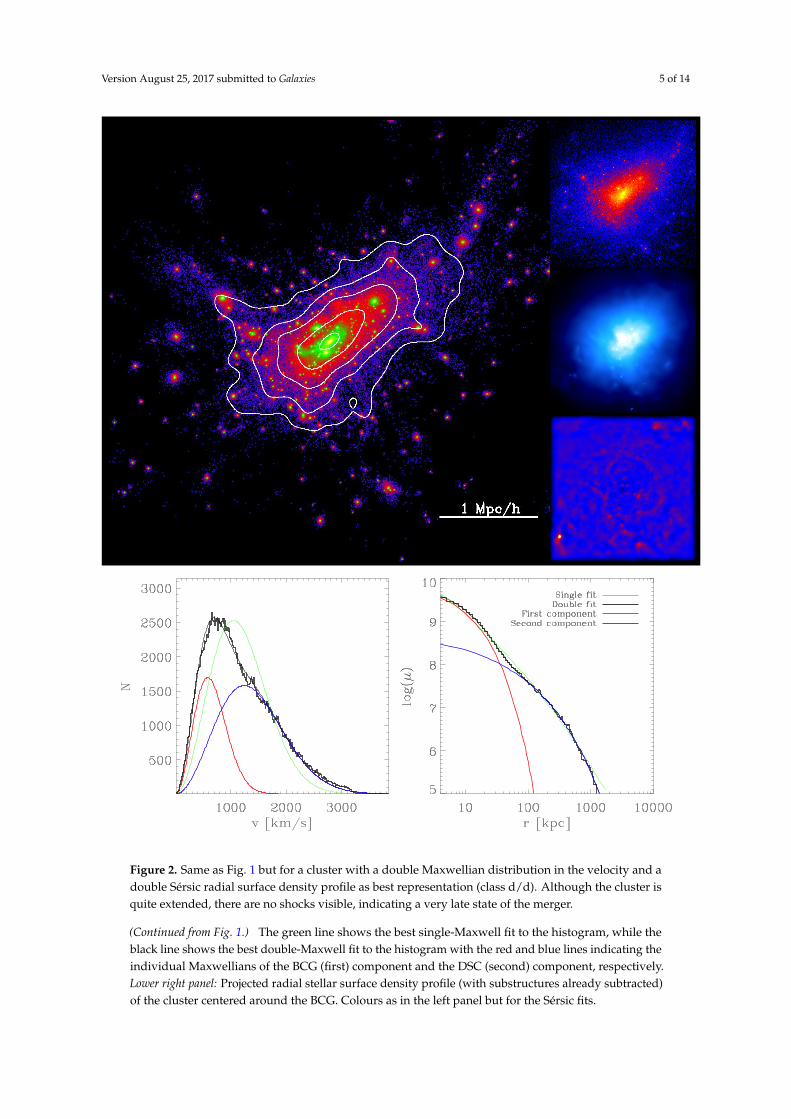
Figure 2. Same as Fig. 1 but for a cluster with a double Maxwellian distribution in the velocity and adouble Sérsic radial surface density profile as best representation (class d/d). Although the cluster isquite extended, there are no shocks visible, indicating a very late state of the merger.
(Continued from Fig. 1.) The green line shows the best single-Maxwell fit to the histogram, while theblack line shows the best double-Maxwell fit to the histogram with the red and blue lines indicating theindividual Maxwellians of the BCG (first) component and the DSC (second) component, respectively.Lower right panel: Projected radial stellar surface density profile (with substructures already subtracted)of the cluster centered around the BCG. Colours as in the left panel but for the Sérsic fits.
Version August 25, 2017 submitted to Galaxies 6 of 14
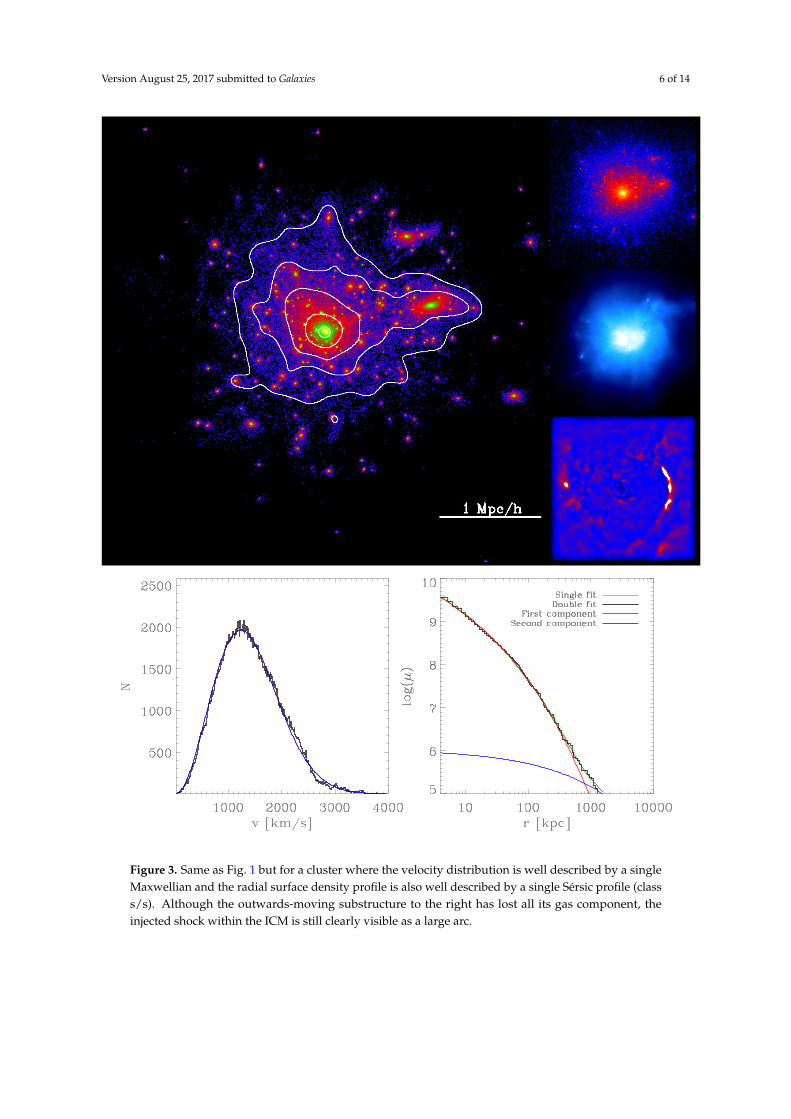
Figure 3. Same as Fig. 1 but for a cluster where the velocity distribution is well described by a singleMaxwellian and the radial surface density profile is also well described by a single Sérsic profile (classs/s). Although the outwards-moving substructure to the right has lost all its gas component, theinjected shock within the ICM is still clearly visible as a large arc.
Version August 25, 2017 submitted to Galaxies 7 of 14
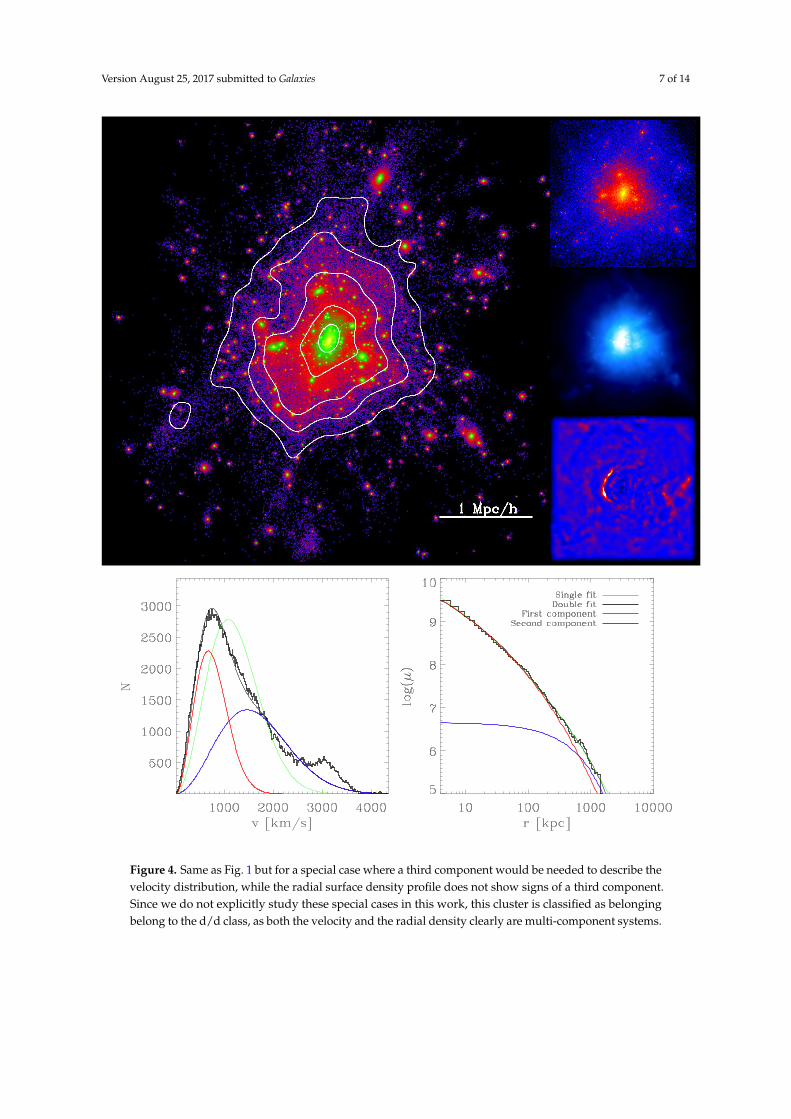
Figure 4. Same as Fig. 1 but for a special case where a third component would be needed to describe thevelocity distribution, while the radial surface density profile does not show signs of a third component.Since we do not explicitly study these special cases in this work, this cluster is classified as belongingbelong to the d/d class, as both the velocity and the radial density clearly are multi-component systems.
Version August 25, 2017 submitted to Galaxies 8 of 14
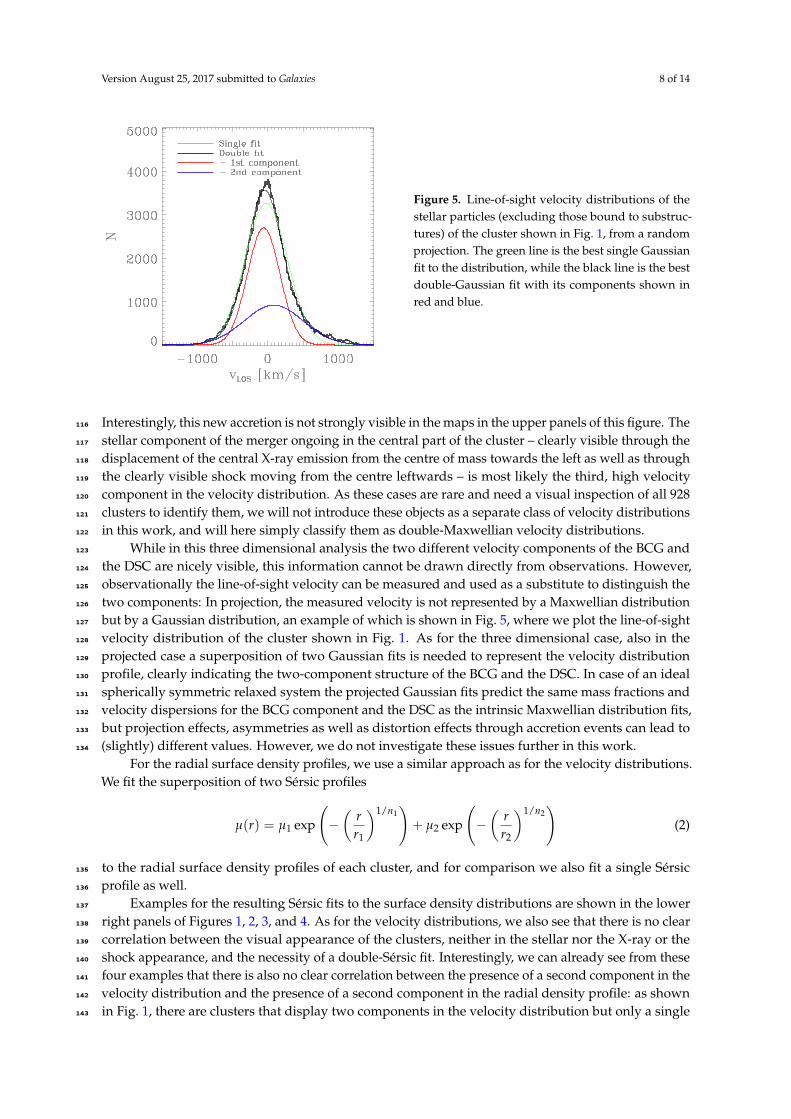
Figure 5. Line-of-sight velocity distributions of thestellar particles (excluding those bound to substruc-tures) of the cluster shown in Fig. 1, from a randomprojection. The green line is the best single Gaussianfit to the distribution, while the black line is the bestdouble-Gaussian fit with its components shown inred and blue.
Interestingly, this new accretion is not strongly visible in the maps in the upper panels of this figure. The116
stellar component of the merger ongoing in the central part of the cluster – clearly visible through the117
displacement of the central X-ray emission from the centre of mass towards the left as well as through118
the clearly visible shock moving from the centre leftwards – is most likely the third, high velocity119
component in the velocity distribution. As these cases are rare and need a visual inspection of all 928120
clusters to identify them, we will not introduce these objects as a separate class of velocity distributions121
in this work, and will here simply classify them as double-Maxwellian velocity distributions.122
While in this three dimensional analysis the two different velocity components of the BCG and123
the DSC are nicely visible, this information cannot be drawn directly from observations. However,124
observationally the line-of-sight velocity can be measured and used as a substitute to distinguish the125
two components: In projection, the measured velocity is not represented by a Maxwellian distribution126
but by a Gaussian distribution, an example of which is shown in Fig. 5, where we plot the line-of-sight127
velocity distribution of the cluster shown in Fig. 1. As for the three dimensional case, also in the128
projected case a superposition of two Gaussian fits is needed to represent the velocity distribution129
profile, clearly indicating the two-component structure of the BCG and the DSC. In case of an ideal130
spherically symmetric relaxed system the projected Gaussian fits predict the same mass fractions and131
velocity dispersions for the BCG component and the DSC as the intrinsic Maxwellian distribution fits,132
but projection effects, asymmetries as well as distortion effects through accretion events can lead to133
(slightly) different values. However, we do not investigate these issues further in this work.134
For the radial surface density profiles, we use a similar approach as for the velocity distributions.We fit the superposition of two Sérsic profiles
µ(r) = µ1 exp
(−(
rr1
)1/n1)+ µ2 exp
(−(
rr2
)1/n2)
(2)
to the radial surface density profiles of each cluster, and for comparison we also fit a single Sérsic135
profile as well.136
Examples for the resulting Sérsic fits to the surface density distributions are shown in the lower137
right panels of Figures 1, 2, 3, and 4. As for the velocity distributions, we also see that there is no clear138
correlation between the visual appearance of the clusters, neither in the stellar nor the X-ray or the139
shock appearance, and the necessity of a double-Sérsic fit. Interestingly, we can already see from these140
four examples that there is also no clear correlation between the presence of a second component in the141
velocity distribution and the presence of a second component in the radial density profile: as shown142
in Fig. 1, there are clusters that display two components in the velocity distribution but only a single143

Version August 25, 2017 submitted to Galaxies 9 of 14
Figure 6. Left panel: Histogram of the mass fraction ascribed to the BCG according to the double-Maxwell fits (blue) and the double-Sérsic fits (red). The mass ascribed to the BCG is always the mass ofthe slower (Maxwellian fits) or the innermost (Sérsic fits) component. Right panel: BCG mass fractionsobtained from the Maxwell fits versus that obtained with the Sérsic fits. Light blue symbols showthe clusters from Box2b, while dark blue open diamonds mark the galaxy groups selected from Box4.There is no evident correlation between the mass partitioning obtained with the two different methods,and there is also no difference between galaxy groups and clusters.
component in the radial surface density profile, while Fig. 2 shows a cluster where both distributions144
have a double structure. In the following we will study this behaviour in more detail.145
3.1. Statistical properties146
As we cannot check the properties of all 928 galaxy clusters from our sample individually, we147
now try to quantify their behaviour in a more statistical way. The biggest issue here is that a double148
fit with twice as many free parameters as a single fit will always yield a better fit, or one at least as149
good, according to simple statistical tests like χ2 or Komolgorov-Smirnov, if the number of degrees150
of freedom is much larger than the number of fit parameters (as is the case here). Thus, we need to151
find a better way to decide which fit adequately characterizes the properties in velocity and surface152
brightness of a cluster.153
One way to do this is to use the double-Maxwell and double-Sérsic fits of a cluster and integrate154
over each of the two components. This way, assuming that the two components always represent an155
inner, slower component that describes the BCG and an outer, faster component that describes the156
DSC, we can obtain the fraction of mass associated with each component, relative to the total stellar157
mass given by the full velocity distribution and the full radial surface density profile.158
The left panel of Fig. 6 shows a histogram of the mass fractions of the BCG, fBCG, obtained with159
both methods for all 928 halos. The blue line shows the distribution found from the double-Maxwell160
fits, while the red line shows the fractions obtained from the double-Sérsic fits. The right panel of the161
same figure shows a scatter plot of the BCG mass fractions obtained with both methods. As can clearly162
be seen there is no correlation at all between the mass fractions resulting from the two methods: while163
there is only a small amount of clusters that have BCG mass fractions below 10% and none with BCG164
mass fractions above 90% according to the double-Maxwell method, the double-Sérsic method results165
in about half of the clusters having BCG mass fractions of about 0% or 100%, clearly indicating that166

Version August 25, 2017 submitted to Galaxies 10 of 14
Table 2. Relative fractions of the 928 clusters and groups with regard to their Maxwell- and Sérsic-fitproperties.
Ncluster fcluster(%)
Single Maxwell sufficient 53 5.7Double Maxwell needed 875 94.3Single Sérsic sufficient 386 41.6Double Sérsic needed 542 58.4
Single Maxwell, Single Sérsic (s/s) 29 3.1Double Maxwell, Single Sérsic (d/s) 357 38.5Single Maxwell, Double Sérsic (s/d) 24 2.6Double Maxwell, Double Sérsic (d/d) 518 55.8
in those cases a double-Sérsic fit is not necessary and their radial surface density profiles can be well167
described by a single Sérsic profile.168
The latter is in good agreement with observations of radial surface brightness profiles for massive169
elliptical galaxies, where both single- and double-Sérsic-profiles are observed without a clear correlation170
to the global dynamical state of the cluster. From the double-Maxwell method, we find BCG mass171
fractions generally ranging between 20% < fBCG < 70%, but the large mass fractions are rare and172
most of the BCGs have mass fractions between 30 and 40%, which is in agreement with observational173
fractions obtained for the BCGs in very massive clusters (e.g., Presotto et al., 2014 [14], Burke et al.,174
2015 [15]).175
We use the BCG mass fractions obtained with both methods to decide whether a double-176
component fit is needed for the velocity distributions and the surface density profiles or if a single-177
component fit is sufficient: if the BCG mass fraction obtained through a double-Maxwell fit is below178
fBCG = 10% or above fBCG = 90%, we judge that there is no clear signal of a second component179
in this fit and we thus classify these clusters as single-Maxwell clusters. If the BCG mass fraction180
is between these values, i.e., 10% < fBCG < 90%, we gauge the double-Maxwell-fit to be necessary181
and thus classify the cluster as double-Maxwell cluster. As shown in the upper part of Table 2, the182
fraction of single-Maxwell clusters is below 6%, and nearly all clusters show velocity distributions183
that reflect two-component systems. Therefore, we conclude that the typical galaxy cluster shows184
a two-component behaviour in its velocity distribution, in agreement with recent observations, for185
example, by Longobardi et al., 2015 [4] and Bender et al., 2015 [3].186
Similarly, we classify a galaxy cluster as single-Sérsic cluster if the BCG mass fraction obtained187
from the double-Sérsic fit is below fBCG = 10% or above fBCG = 90%, while we classify a cluster as188
double-Sérsic cluster if the BCG mass fraction is between 10% < fBCG < 90%. Here, we clearly see189
the same split-up that we already saw from Fig. 6, i.e., that about half of the clusters are single-Sérsic190
clusters while the other half are double-Sérsic clusters, with a slight trend towards the latter (see upper191
part of Table 2).192
Using both classifications we can now test how many clusters show a double-fit-behaviour in193
both the velocity distribution and the surface density profiles. We find that this is the case for more194
than half of the galaxy clusters in our sample, as shown in the lower part of Table 2 and Fig. 7, while195
about 40% of the clusters are double-Maxwell but single-Sérsic clusters. The single-Maxwell clusters196
represent less than 6% of all our clusters; they are roughly evenly distributed between single-Sérsic197
and double-Sérsic cases.198
From these results we conclude that the velocity distribution of a cluster can still distinguish199
between the component that belongs to the direct potential of the BCG and the outer component200
that was accreted onto the cluster and stored in the outer regions of the BCG through stripping and201
flyby events, building up the DSC component that still retains this memory of the assembly history.202
On the other hand, the imprint of this assembly history is not always visible in the radial surface203
density profiles of the cluster BCGs as a separate component, where only in some cases the BCG can be204

Version August 25, 2017 submitted to Galaxies 11 of 14
Figure 7. Fraction of galaxy clusters and groups thatcan be described best by a single Maxwell distributionand a single Sérsic profile (class s/s; green), a dou-ble Maxwell distribution and a single Sérsic profile(class d/s; red), a single Maxwell distribution and adouble Sérsic profile(class s/d; yellow), and a dou-ble Maxwell distribution and a double Sérsic profile(class d/d; blue).
separated from the DSC through the surface density profiles, while in other cases this is not possible.205
Whether the assembly history can be traced from the shape of the outer stellar halo radial density206
profiles of BCGs and galaxies in general will be part of a forthcoming study (see Remus et al., 2016 [7]207
for a preview on these results).208
4. Mass–Velocity-Dispersion Relation209
Finally, we want to see if a correlation exists between the velocity dispersion obtained from the210
Maxwell fits for the BCG and the DSC and the virial mass of the host cluster, as presented by Dolag211
et al., 2010 [2]. For this purpose, the left panel of Fig. 8 shows the velocity dispersion of the BCG212
component versus the virial mass of the cluster in red, and the velocity dispersion of the DSC versus213
the virial mass of the cluster in blue. As can clearly be seen, we find a strong correlation for both214
components with the virial mass of the cluster, and these correlations hold even for the galaxy groups215
in the lower mass regime, indicating that the split-up between the brightest group galaxies (BGGs)216
and the Intra-group light (IGL) behaves similarly to that of clusters, clearly hinting at a similar growth217
mechanism for the IGL through stripping.218
The left panel of Fig. 8 also shows the fits to the velocity-dispersion–virial-mass relation presented219
by Dolag et al., 2010 [2] as red and blue dotted lines for the BCGs and the DSC, respectively. Although220
not fitted to the current simulation set but obtained from a less advanced simulation set of the local221
universe, these relations perfectly describe the behaviour found for the Magneticum simulation sample222
of galaxy clusters and galaxy groups, even at the low mass end. This additionally proves that this223
behaviour is independent of the details of the subgrid models included in the simulations.224
As can also be seen from Fig. 8, the relation between the velocity dispersion and the virial massfor the BCGs and the DSC has the same slope, with the DSC simply having overall larger velocitydispersions than the BCGs. More precisely, as shown in the right panel of Fig. 8, the relation betweenthe velocity dispersions of the BCG and the DSC is very tight and can be described as
σBCG = 0.5 σDSC. (3)
Again, this behaviour holds even at the galaxy group mass scale, as indicated by the open diamonds225
marking the groups selected from the smaller volume Box4 with the higher resolution. In addition,226
this not only demonstrates that galaxy groups and clusters show a similar behaviour, but it also proves227
that the correlations presented here are independent of the resolution of the simulation and thus only228
driven by physical processed like accretion and star formation.229
Interestingly, we can also explain the few outliers that can be seen in both the velocity-dispersion–230
virial-mass relation and the velocity-dispersion relation between the BCGs and their DSC: if we mark231

Version August 25, 2017 submitted to Galaxies 12 of 14
Figure 8. Left panel: Velocity dispersion σ obtained from the double-Maxwellian fit versus virial massMvir for the BCG-component (red) and the DSC-component (blue) for all galaxy clusters in Box2b (filledcircles) and all galaxy groups in Box4 (open diamonds). The red and blue lines are not fitted to thedata presented here but are those from Dolag et al., 2010 [2]. The orange and light blue symbols showvelocity dispersions from observations of NGC 6166 in the cluster Abell 2199 (bowties/hourglases)from Bender et al., 2015 [3] and M 87 in the Virgo cluster (stars) from Longobardi et al., 2015 [4]. Thevirial mass for Virgo is taken from Tully, 2015 [16] using the average of the masses based on the totalK-band luminosity and the virial mass inferred from the zero velocity surface. For Virgo this is inagreement with measurements by PLANCK [17], for Abell 2199 we included measurements of thevirial mass from the PLANCK mission [17] (hourglasses) as they give significantly smaller values thanthe one inferred by Tully (2015) [16] (bowties). Right panel: BCG velocity dispersion σBCG versus DSCvelocity dispersion σDSC obtained from the double-Maxwellian fits for the same clusters (filled circles)and groups (open diamonds) as in the left panel. The grey dashed line shows the σBCG = 0.5 σDSC
relation. Green symbols mark all clusters and groups for which the BCG-component has less than 5%of the stellar mass of the total stellar mass of the system, according to the mass partitioning obtainedfrom the double-Maxwellian fit. The yellow symbols show the same observations as in the left panel.
all clusters (and groups) where the BCG mass fraction obtained from the double-Maxwellian fit is232
below 5% (green circles and diamonds in the right panel of Fig. 8), all outliers are captured. This233
clearly indicates that for all galaxy clusters where a double-Maxwellian fit is the better representation234
of the velocity distribution, the discussed relation between both components and the virial mass of the235
cluster is present and very tight, and driven by the assembly history of the clusters.236
In addition, we also included the observations for NGC 6166 in the cluster Abell 2199 from Bender237
et al., 2015 [3] and M 87 in the Virgo cluster from Longobardi et al., 2015 [4] in both panels of Fig. 8 (for238
details on the virial mass estimated for these clusters see the figure caption). Both observations are in239
excellent agreement with the correlations found in this study, especially with respect to the BCG–DSC240
velocity dispersion correlation.241
5. Discussion and Conclusion242
In this work we presented a detailed and statistically sound analysis of the stellar velocity243
distributions and the projected stellar radial surface density profiles of galaxy clusters and galaxy244
groups selected from the Magneticum pathfinder simulation sample. Using two volumes of different245
sizes and resolutions, we showed that for more than 90% of all 928 clusters and groups in our sample246
the velocity distributions are represented best by a superposition of two Maxwellian distributions,247

Version August 25, 2017 submitted to Galaxies 13 of 14
with the slower component representing the BCG of the cluster and the faster component representing248
the DSC. We demonstrated that the relative mass fractions of the BCGs found through these fits is in249
agreement with recent observations. This behaviour in the velocity distribution strongly supports the250
idea that the DSC is built up from stripping of smaller satellites within the cluster potential close to its251
center, where the BCG resides.252
Furthermore, we found that there is a clear and tight correlation between the velocity dispersions253
of the two components obtained by these fits and the virial mass of the host clusters, and that this254
correlation holds down to group-mass scales. We also demonstrated that the velocity dispersions of255
both components are correlated tightly, with the BCG having about half the velocity dispersion of256
the DSC, and that the few available observations that distinguish between both components are in257
excellent agreement with our results.258
Additionally, we tested if the same separation into two distinct components is reflected in the259
projected radial surface density profiles of the cluster. Interestingly, we could only find a separation of260
the radial profiles into two components in about half of the clusters that exhibit a double-Maxwell261
imprint in the velocity distribution, clearly showing that the radial profile is not always suitable for262
distinguishing the two components and that further indicators are needed in the radial stellar profiles263
to obtain information about the assembly history of galaxy clusters. This issue will be addressed in a264
forthcoming study.265
Lastly, we also tested if we can find a correlation between the velocity distribution behaviour of266
the DSC and the X-ray or shock properties in the four objects we have examined in detail. No such267
correlations were evident. On the contrary, we find indications that the X-ray and shock properties268
describe the very recent assembly history of the cluster, where the presence of shocks and X-ray offsets269
indicate an ongoing merger event, while the velocity distribution of the stellar component of the galaxy270
clusters and the BCGs appears to be an indicator for the earlier assembly history of the cluster.271
Acknowledgments: We thank the anonymous referees for their helpful comments. The Magneticum Pathfinder272
simulations were partly performed at the Leibniz-Rechenzentrum with CPU time assigned to the Project “pr86re”.273
This work was supported by the DFG Cluster of Excellence “Origin and Structure of the Universe”. We are274
especially grateful for the support by M. Petkova through the Computational Center for Particle and Astrophysics275
(C2PAP).276
Author Contributions: K. D. performed the simulations; R.-S. R. and T. L. H. analysed the data; R.-S. R wrote the277
paper.278
Conflicts of Interest: The authors declare no conflict of interest.279
References280
1. Murante, G.; Giovalli, M.; Gerhard, O.; Arnaboldi, M.; Borgani, S.; Dolag, K. The importance of mergers281
for the origin of intracluster stars in cosmological simulations of galaxy clusters. MNRAS 2007, 377, 2–16,282
[astro-ph/0701925].283
2. Dolag, K.; Murante, G.; Borgani, S. Dynamical difference between the cD galaxy and the diffuse, stellar284
component in simulated galaxy clusters. MNRAS 2010, 405, 1544–1559, [0911.1129].285
3. Bender, R.; Kormendy, J.; Cornell, M.E.; Fisher, D.B. Structure and Formation of cD Galaxies: NGC 6166 in286
ABELL 2199. ApJ 2015, 807, 56, [1411.2598].287
4. Longobardi, A.; Arnaboldi, M.; Gerhard, O.; Hanuschik, R. The outer regions of the giant Virgo galaxy288
M 87: Kinematic separation of stellar halo and intracluster light. A&A 2015, 579, A135, [1502.02032].289
5. Mihos, J.C. Intragroup and Intracluster Light. The General Assembly of Galaxy Halos: Structure, Origin290
and Evolution; Bragaglia, A.; Arnaboldi, M.; Rejkuba, M.; Romano, D., Eds., 2016, Vol. 317, IAU Symposium,291
pp. 27–34, [1510.01929].292
6. Puchwein, E.; Springel, V.; Sijacki, D.; Dolag, K. Intracluster stars in simulations with active galactic293
nucleus feedback. MNRAS 2010, 406, 936–951, [1001.3018].294
7. Remus, R.S.; Burkert, A.; Dolag, K. A “Universal” Density Profile for the Outer Stellar Halos of Galaxies.295
ArXiv e-prints 2016, [1605.06511].296
8. Springel, V. The cosmological simulation code GADGET-2. MNRAS 2005, 364, 1105–1134.297

Version August 25, 2017 submitted to Galaxies 14 of 14
9. Springel, V.; Hernquist, L. Cosmological smoothed particle hydrodynamics simulations: a hybrid multi-298
phase model for star formation. MNRAS 2003, 339, 289–311.299
10. Tornatore, L.; Borgani, S.; Dolag, K.; Matteucci, F. Chemical enrichment of galaxy clusters from hydrody-300
namical simulations. MNRAS 2007, 382, 1050–1072, [0705.1921].301
11. Hirschmann, M.; Dolag, K.; Saro, A.; Bachmann, L.; Borgani, S.; Burkert, A. Cosmological simulations of302
black hole growth: AGN luminosities and downsizing. MNRAS 2014, 442, 2304–2324, [1308.0333].303
12. Teklu, A.F.; Remus, R.S.; Dolag, K.; Beck, A.M.; Burkert, A.; Schmidt, A.S.; Schulze, F.; Steinborn, L.K.304
Connecting Angular Momentum and Galactic Dynamics: The Complex Interplay between Spin, Mass, and305
Morphology. ApJ 2015, 812, 29, [1503.03501].306
13. Dolag, K.; Borgani, S.; Murante, G.; Springel, V. Substructures in hydrodynamical cluster simulations.307
MNRAS 2009, 399, 497–514, [0808.3401].308
14. Presotto, V.; Girardi, M.; Nonino, M.; Mercurio, A.; Grillo, C.; Rosati, P.; Biviano, A.; Annunziatella, M.;309
Balestra, I.; Cui, W.; Sartoris, B.; Lemze, D.; Ascaso, B.; Moustakas, J.; Ford, H.; Fritz, A.; Czoske, O.; Ettori,310
S.; Kuchner, U.; Lombardi, M.; Maier, C.; Medezinski, E.; Molino, A.; Scodeggio, M.; Strazzullo, V.; Tozzi,311
P.; Ziegler, B.; Bartelmann, M.; Benitez, N.; Bradley, L.; Brescia, M.; Broadhurst, T.; Coe, D.; Donahue, M.;312
Gobat, R.; Graves, G.; Kelson, D.; Koekemoer, A.; Melchior, P.; Meneghetti, M.; Merten, J.; Moustakas, L.A.;313
Munari, E.; Postman, M.; Regos, E.; Seitz, S.; Umetsu, K.; Zheng, W.; Zitrin, A. Intracluster light properties314
in the CLASH-VLT cluster MACS J1206.2-0847. A&A 2014, 565, A126, [1403.4979].315
15. Burke, C.; Hilton, M.; Collins, C. Coevolution of brightest cluster galaxies and intracluster light using316
CLASH. MNRAS 2015, 449, 2353–2367, [1503.04321].317
16. Tully, R.B. Galaxy Groups: A 2MASS Catalog. AJ 2015, 149, 171, [1503.03134].318
17. Planck Collaboration.; Ade, P.A.R.; Aghanim, N.; Arnaud, M.; Ashdown, M.; Aumont, J.; Baccigalupi, C.;319
Banday, A.J.; Barreiro, R.B.; Barrena, R.; et al.. Planck 2015 results. XXVII. The second Planck catalogue of320
Sunyaev-Zeldovich sources. A&A 2016, 594, A27, [1502.01598].321
c© 2017 by the authors. Submitted to Galaxies for possible open access publication under the terms and conditions322
of the Creative Commons Attribution (CC BY) license (http://creativecommons.org/licenses/by/4.0/).323