The outcome of Beta cell function after early insulin ...
32
The outcome of Beta cell function after early insulin therapy in the recently diagnosed type 2 diabetes (in Egyptian population) our experience in EL-Minia university hospital Youssif I Mousa , Ahmed A Mohamed, Sahar H. El-Hini , Mesbah S Kamel, Ahmed S El-deen, Ghada M EL-sagheer and*Ashraf M Osman Departments of Internal Medicine and * Clinial Pathology. El-Minia University - Egypt
Transcript of The outcome of Beta cell function after early insulin ...
The outcome of Beta cell function after early insulin therapy in the
recently diagnosed type 2 diabetes (in Egyptian population) our
experience in EL-Minia university hospital
Youssif I Mousa , Ahmed A Mohamed, Sahar H. El-Hini , Mesbah S Kamel, Ahmed S El-deen, Ghada M EL-sagheer and*Ashraf M
Osman Departments of Internal Medicine and * Clinial Pathology. El-Minia
University - Egypt

• The purpose of this prospective cohort study was to evaluate whether early insulin therapy is more advantageous in achieving long-term optimal glycemic control with improved B cell function than oral drugs in the recently diagnosed type 2 diabetes mellitus.

Study Design
Group1 20 Pts
• Premix Insulin 30/70
• 2 S/C Injections
• 10U morning,5U evening
Group2 20 Pts
• Bedtime NPH (10UHumalin N ) +3 Premeal regular insulin ( 5 U)
Group 3 20 Pts
• Sulphonylurea (Glimipride)
• And /or metformin
For group1&2the insulin dose was adjusted gradually according to FBG& PPBG as 2-4 units of insulin to achieve FBG less than 110 mg and PPBG less than 180 mg. For group3 the given dose of oral antidiabetic drugs (OADs) was increased to achieve the best blood glucose level or reaching to the maximum allowed dose . All the three groups were given the same dietary and exercise instructions.

• The treatment continued for 3 months till euglycemia was reached. Then, all medications were stopped and the patients were followed up till the end of the year. BMI, FBG, PPG, HbA1C, fasting level of insulin, proinsulin, C- peptide, HOMA-IR, HOMA-B, serum cholesterol, triglycerides were estimated.

0
2
4
6
8
10
12
14
16
Group1 Group2 Group3
7
14
4
13
6
16
Sex
Male Female
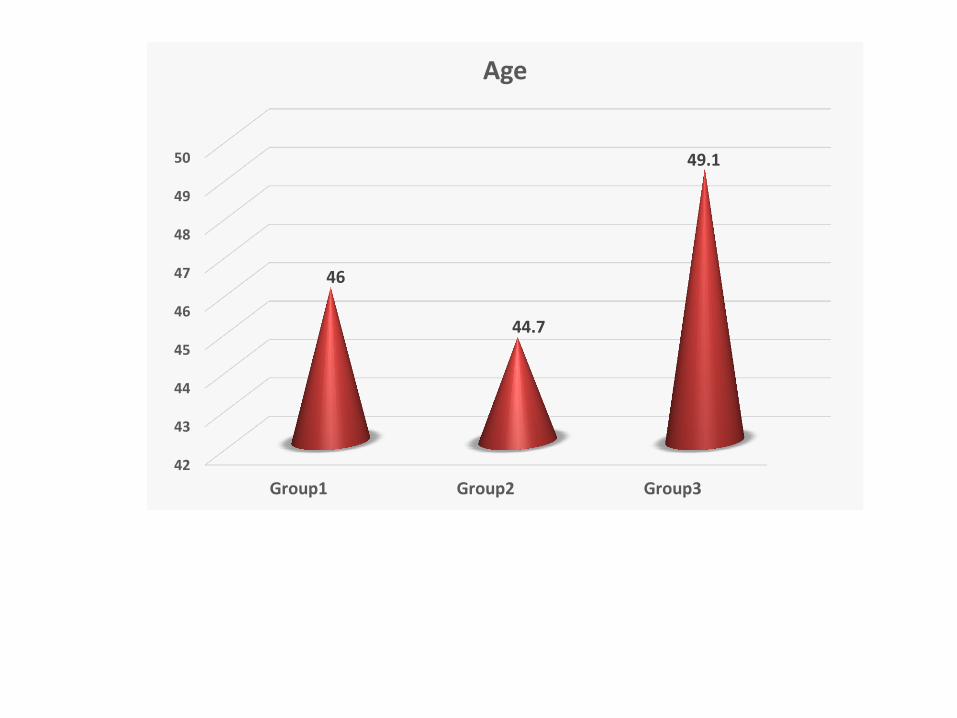
42
43
44
45
46
47
48
49
50
Group1 Group2 Group3
46
44.7
49.1
Age

27
27.5
28
28.5
29
29.5
Group1 Group2 Group3
27.94 28.04
28.69
28.89
29.17
29.32
BMI before ttt BMI after ttt
0
50
100
150
200
250
300
350
400
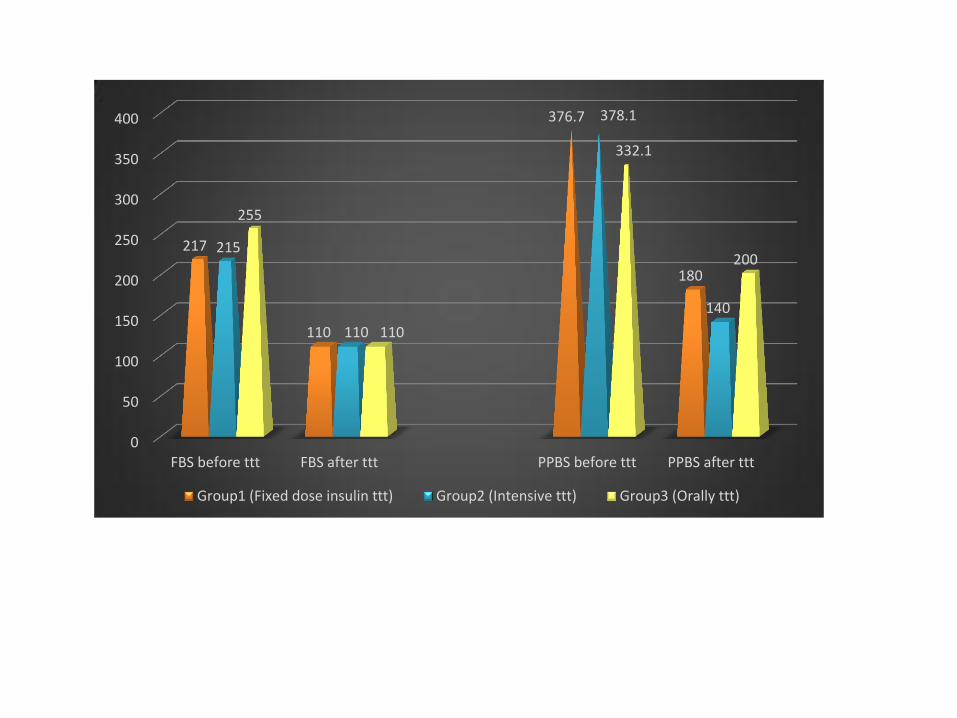
FBS before ttt FBS after ttt PPBS before ttt PPBS after ttt
217
110
376.7
180
215
110
378.1
140
255
110
332.1
200
Group1 (Fixed dose insulin ttt) Group2 (Intensive ttt) Group3 (Orally ttt)

0
1
2
3
4
5
6
7
8
9
HbA1C after 3 ms HbA1C after 6 ms HbA1C after 9 ms HbA1C after1 year
7
7.7 7.8 7.9
6.6 6.8 6.9 7.2
7.9
8.6 8.6 8.9
Group1 (Fixed dose insulin ttt) Group2 (Intensive ttt) Group3 (Orally ttt)

0
50
100
150
200
250
Serum CHLbefore ttt
Serum CHLafter 3 ms
Serumtriglycerides
before ttt
Serumtriglycerides
after 3 ms
206.3
176.3
213.9
160.3
220
188.2
210.8
166.9
219.3 208.6 213.9 211.1
Group1 (Fixed dose insulin ttt) Group2 (Intensive ttt) Group3 (Orally ttt)
0
1
2
3
4
5
6
Group1 (Fixed dose insulin ttt) Group2 (Intensive ttt) Group3 (Orally ttt)
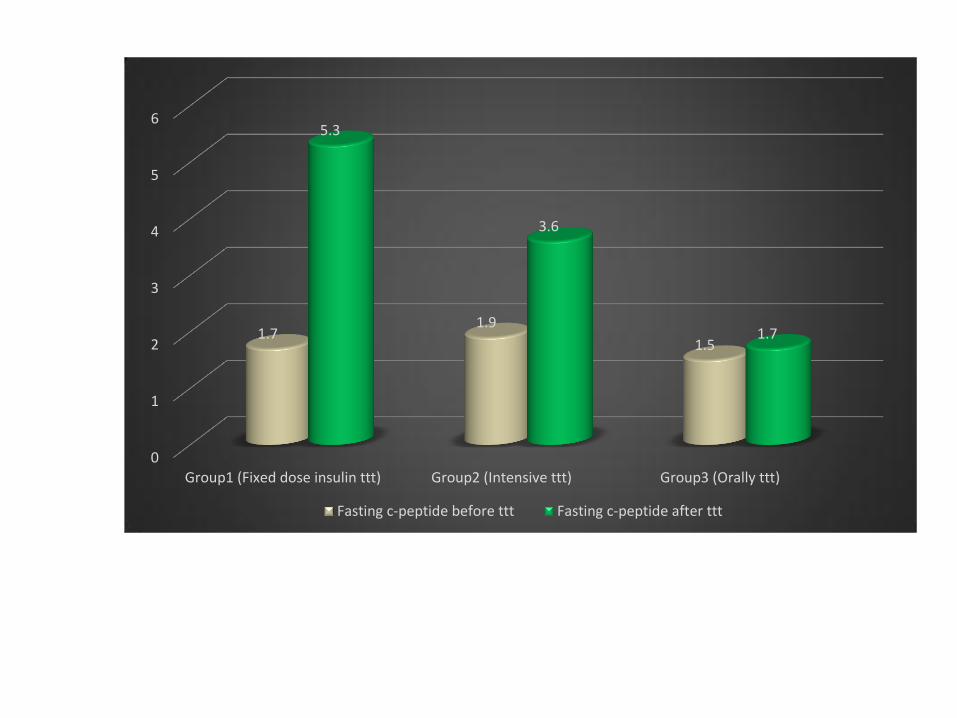
1.7 1.9
1.5
5.3
3.6
1.7
Fasting c-peptide before ttt Fasting c-peptide after ttt

0
20
40
60
80
100
120
140
Group1 (Fixed dose insulinttt)
Group2 (Intensive ttt) Group3 (Orally ttt)
60 62 59
122.25
137
79
Fasting serum insulin before ttt Fasting serum insulin after ttt
0
10
20
30
40
50
60
70
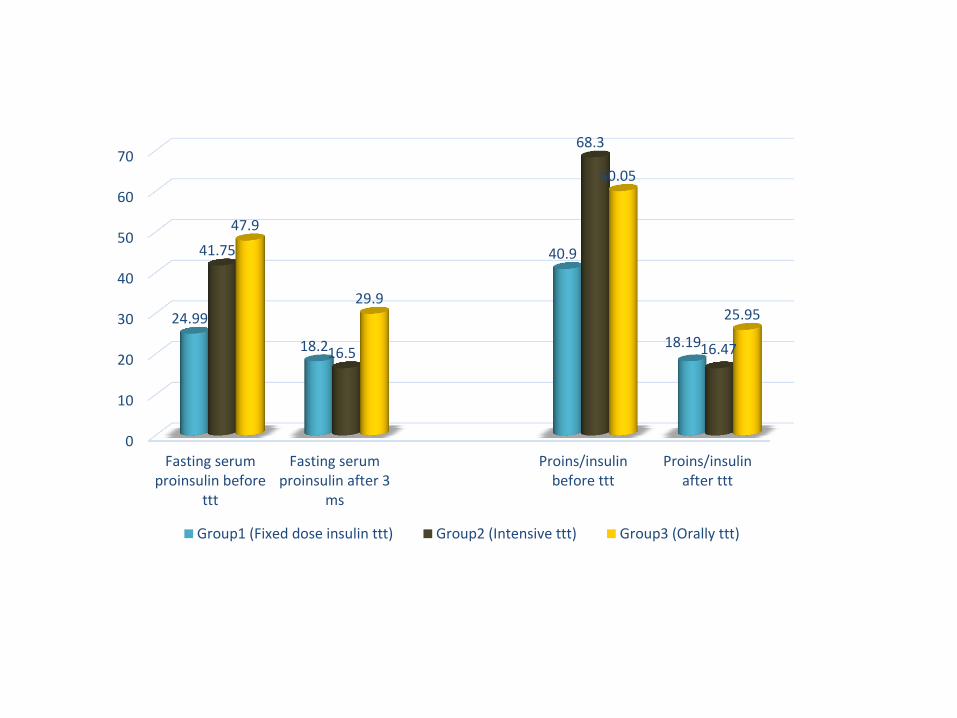
Fasting serumproinsulin before
ttt
Fasting serumproinsulin after 3
ms
Proins/insulinbefore ttt
Proins/insulinafter ttt
24.99
18.2
40.9
18.19
41.75
16.5
68.3
16.47
47.9
29.9
60.05
25.95
Group1 (Fixed dose insulin ttt) Group2 (Intensive ttt) Group3 (Orally ttt)

0
1
2
3
4
5
6
Group1 (Fixed doseinsulin ttt)
Group2 (Intensive ttt) Group3 (Orally ttt)
5.58
4.86
3.57 3.73 3.85
4.61
HOMA-IR before ttt HOMA-IR after 3 ms

0
20
40
60
80
100
120
140
Group1 (Fixed dose insulinttt)
Group2 (Intensive ttt) Group3 (Orally ttt)
24.99 26.7 25.35
93.83
123.4
47.91
HOMA-ß before ttt HOMA-ß after 3 ms
0
2
4
6
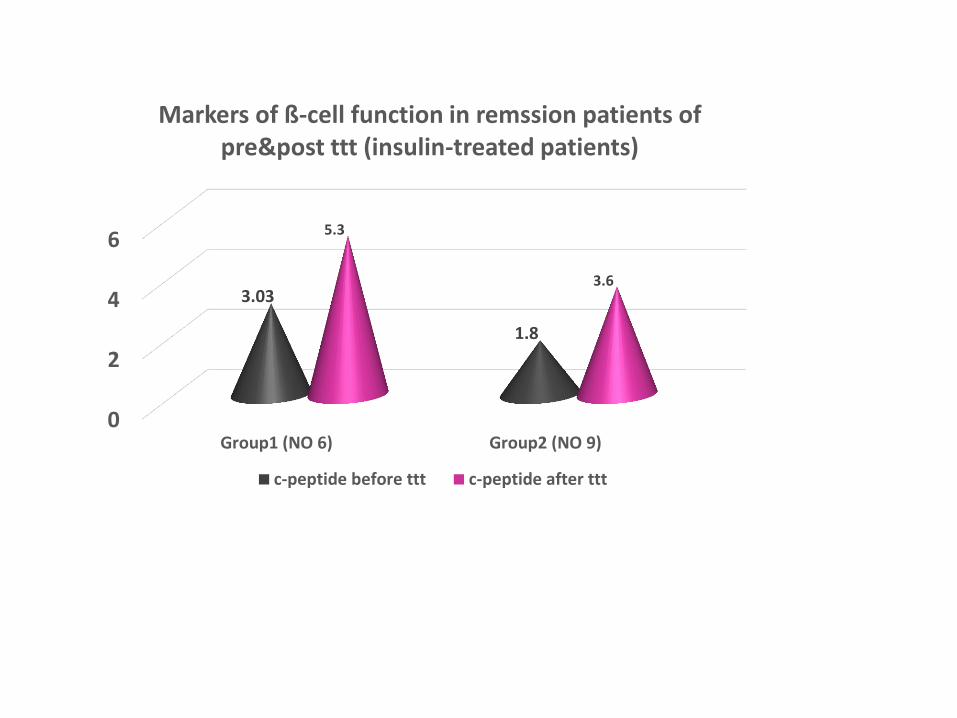
Group1 (NO 6) Group2 (NO 9)
3.03
1.8
5.3
3.6
Markers of ß-cell function in remssion patients of pre&post ttt (insulin-treated patients)
c-peptide before ttt c-peptide after ttt
0
20
40
60
80
100
120
140
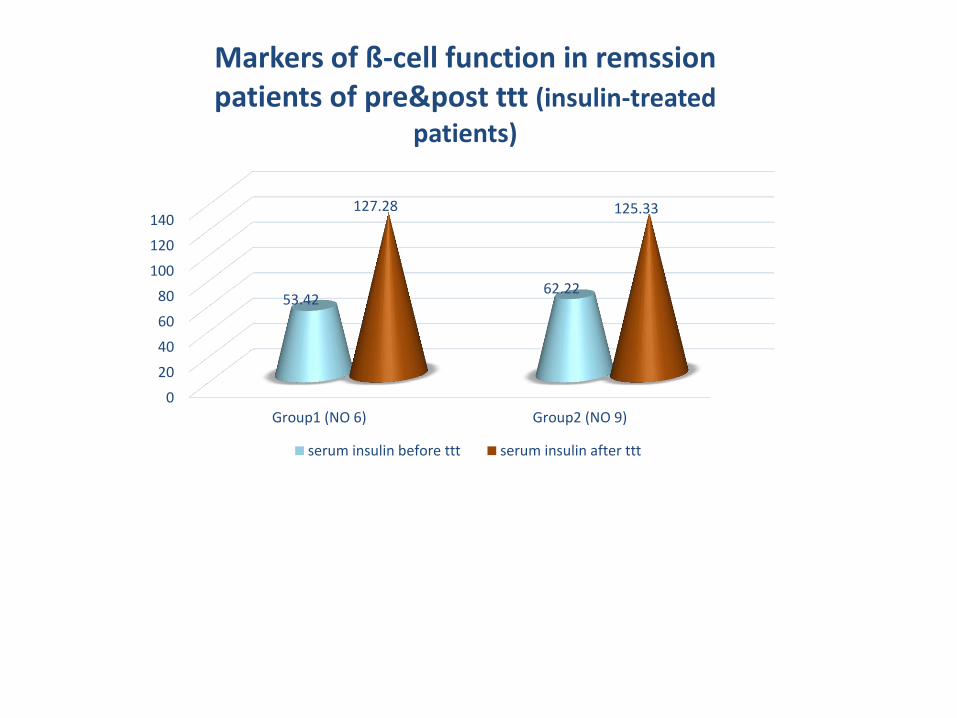
Group1 (NO 6) Group2 (NO 9)
53.42 62.22
127.28 125.33
Markers of ß-cell function in remssion patients of pre&post ttt (insulin-treated
patients)
serum insulin before ttt serum insulin after ttt
0
10
20
30
40
50
60
70
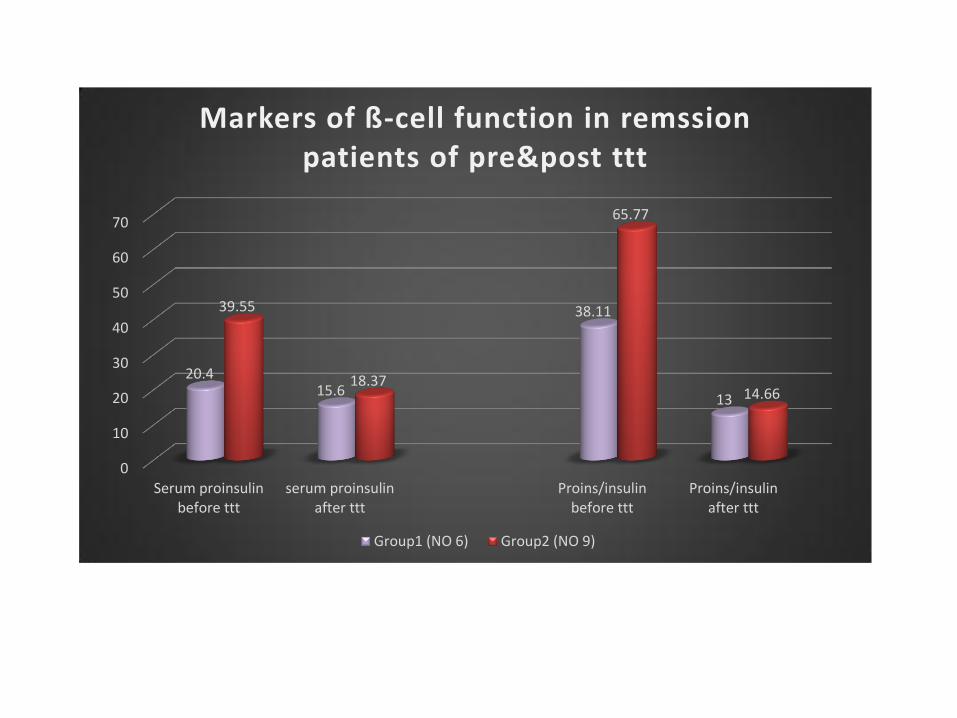
Serum proinsulinbefore ttt
serum proinsulinafter ttt
Proins/insulinbefore ttt
Proins/insulinafter ttt
20.4 15.6
38.11
13
39.55
18.37
65.77
14.66
Markers of ß-cell function in remssion patients of pre&post ttt
Group1 (NO 6) Group2 (NO 9)
0
1
2
3
4
5
6
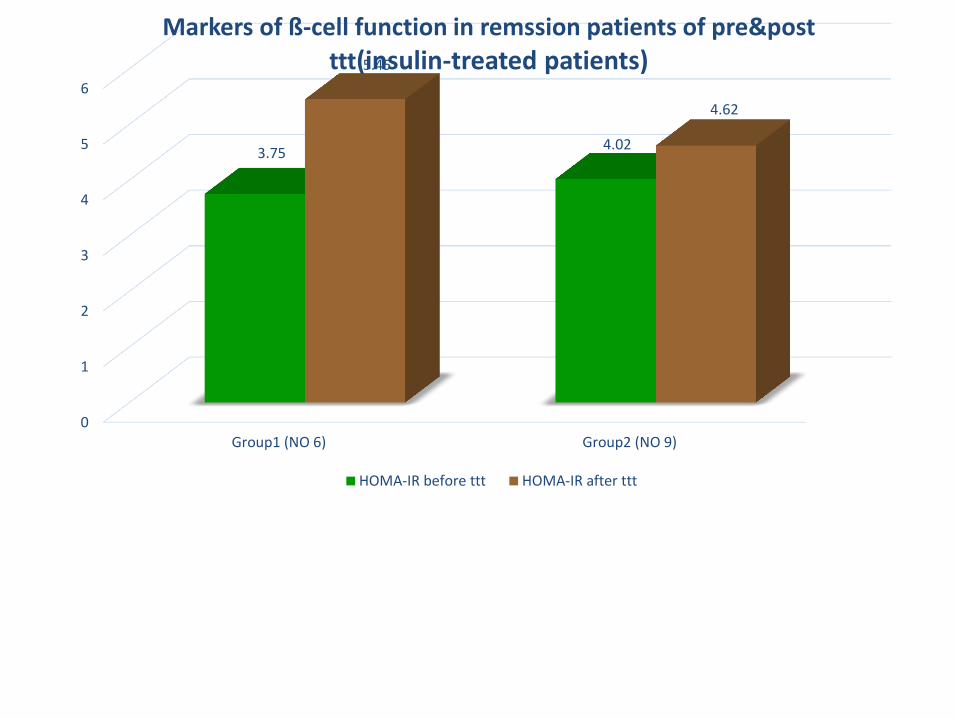
Group1 (NO 6) Group2 (NO 9)
3.75 4.02
5.45
4.62
Markers of ß-cell function in remssion patients of pre&post
ttt(insulin-treated patients)
HOMA-IR before ttt HOMA-IR after ttt
0
50
100
150
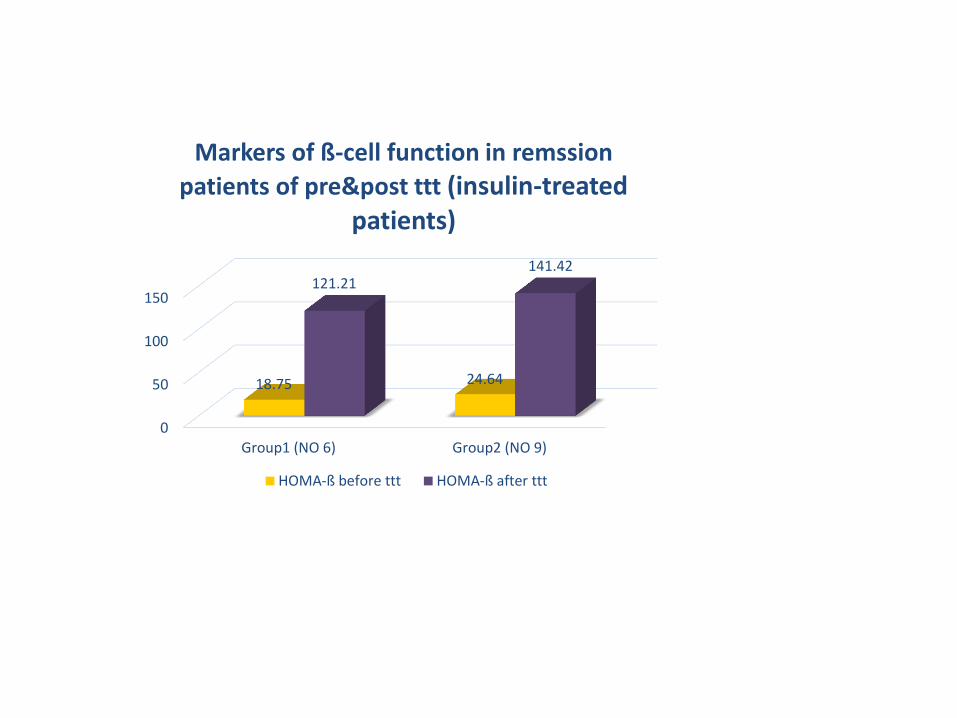
Group1 (NO 6) Group2 (NO 9)
18.75 24.64
121.21 141.42
Markers of ß-cell function in remssion
patients of pre&post ttt (insulin-treated patients)
HOMA-ß before ttt HOMA-ß after ttt
5.4
5.6
5.8
6
6.2
6.4
6.6
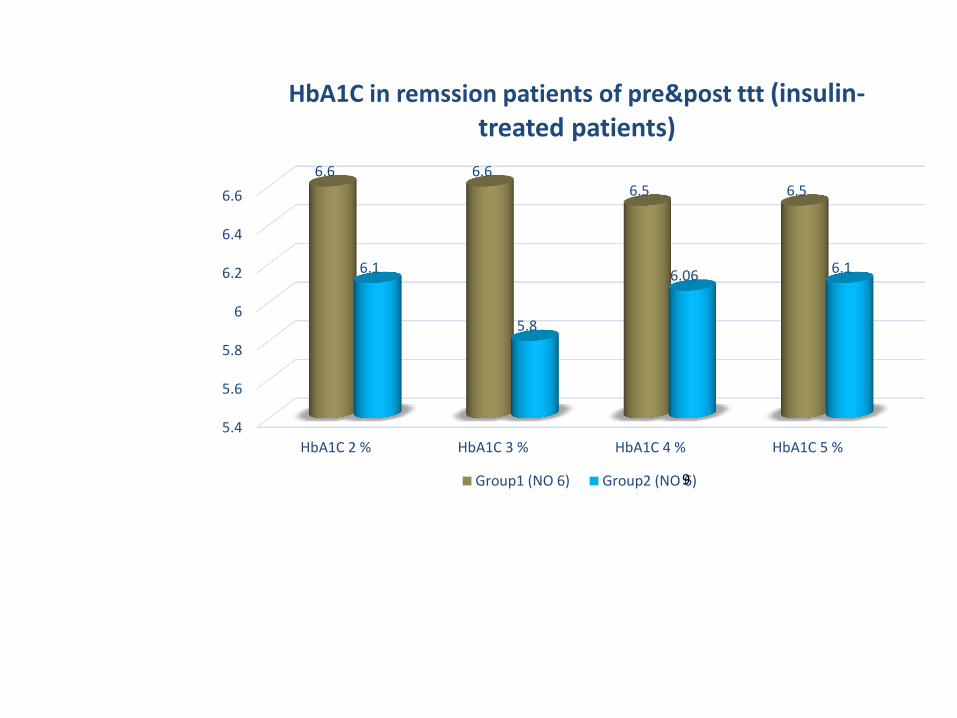
HbA1C 2 % HbA1C 3 % HbA1C 4 % HbA1C 5 %
6.6 6.6 6.5 6.5
6.1
5.8
6.06 6.1
HbA1C in remssion patients of pre&post ttt (insulin-treated patients)
Group1 (NO 6) Group2 (NO 6)9
Evaluation of parameters in succeeded and failed patients in three groups

0
20
40
60
80
100
120
140
160
180
200
Succeeded patients Failed patients
197.37 195.5
110.56
129.17
FBS before ttt FBS after ttt
0
1
2
3
4
5
6
7
8
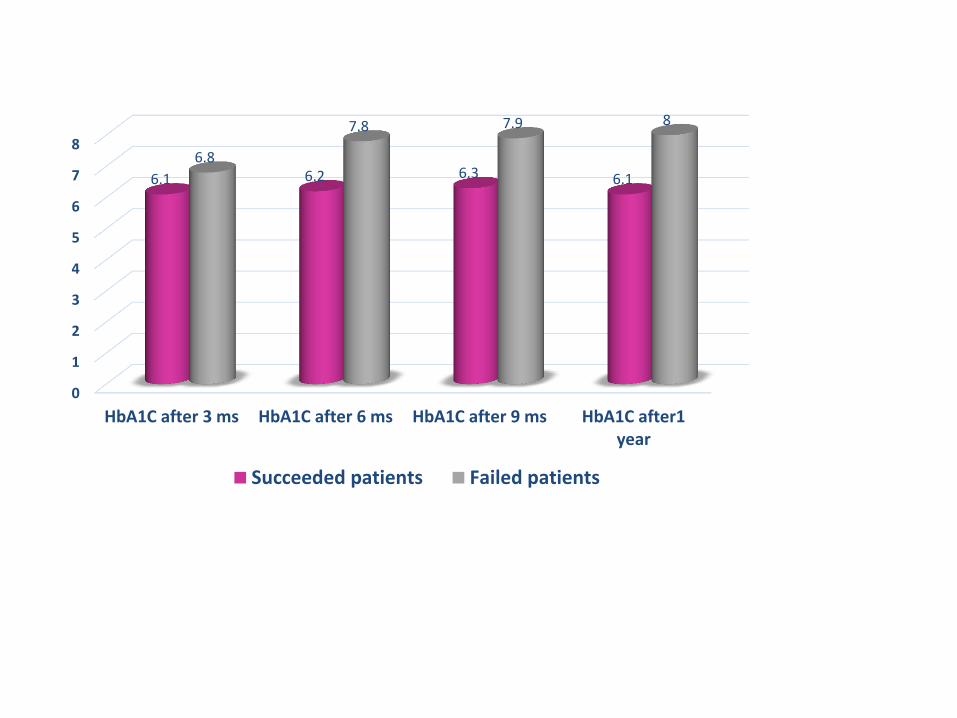
HbA1C after 3 ms HbA1C after 6 ms HbA1C after 9 ms HbA1C after1year
6.1 6.2 6.3 6.1
6.8
7.8 7.9 8
Succeeded patients Failed patients
0
10
20
30
40
50
60
Succeeded patients Failed patients
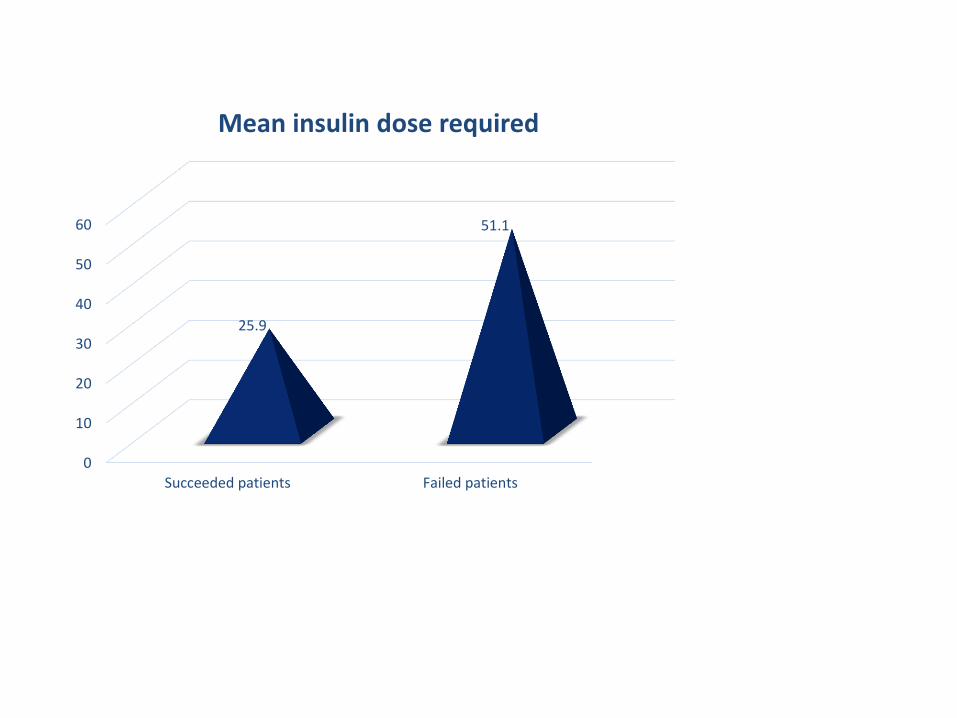
25.9
51.1
Mean insulin dose required
0
20
40
60
80
100
120
140
Succeeded patients Failed patients
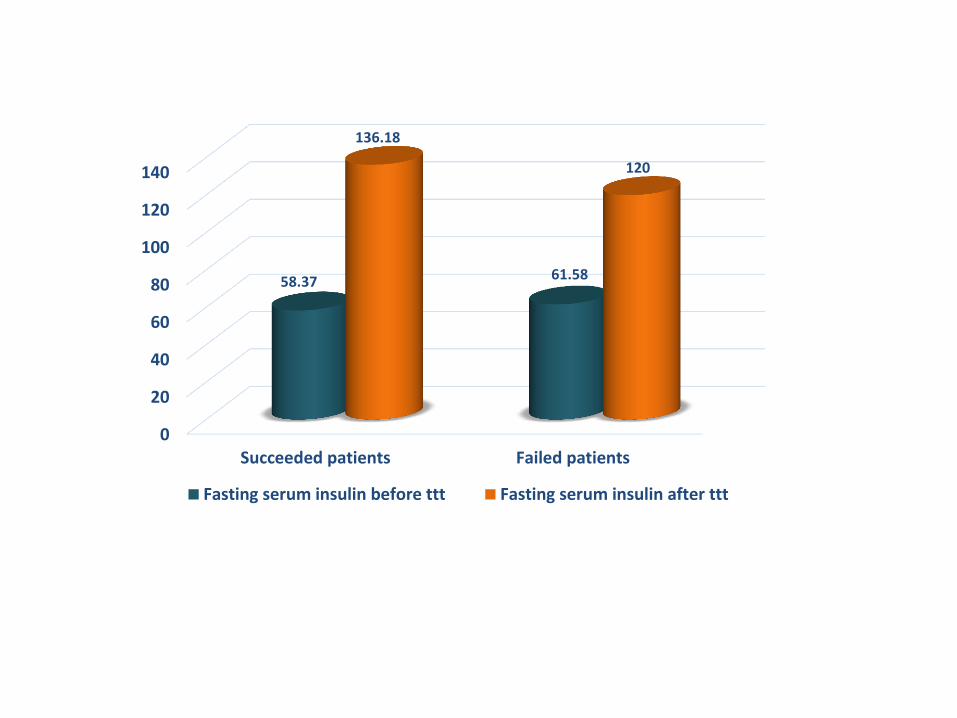
58.37 61.58
136.18
120
Fasting serum insulin before ttt Fasting serum insulin after ttt

1.5
1.55
1.6
1.65
1.7
1.75
1.8
Succeeded patients Failed patients
1.8
1.6
Fasting c-peptide before ttt
Summary and conclusion
• In the present study, the first favorable metabolic effect of insulin therapy was better glycemic control in the insulin treated groups versus orally treated group. There were a statistically significant decrease in FBS and HbA1c in the insulin treated groups compared to orally treated group (P=0.04, 0.001 for FBS and 0.001 for HbA1c level). HbA1c of the group 2(intensively treated group) decreased significantly than that of the group 1(mixed insulin group)( P=0.0001).This better glycemic control continued all through the folow up duration.
• The second favorable metabolic effect of insulin therapy was observed on lipid profile as serum total cholesterol was reduced significantly following insulin therapy(P=0.001) but did not change in the orally treated group. This is consistent with the study of Alvarsson et al., (2003) who demonstrated that the changes in glycemia were mirrored in an improvement of lipid profiles.
• In the present study, we found a significant increase of fasting C- peptide and insulin and HOMA-B and a significant decrease in the proinsulin level and proinsulin/insulin ratio in insulin treated groups (1&2) following insulin therapy versus orally treated group (3). This indicates that parameters of ß-cell function were better preserved in the insulin than in the orally treated patients.
• There is evidence that an early intervention with intensive insulin therapy in newly diagnosed type 2 diabetes restores the endogenous insulin secretion, characterized by normoglycemia and no need for hypoglycemic medications. This is because early insulin therapy reduced strain on the β-cell and can potentially induce ‘beta cell rest’, which results in increased insulin secretion and restoration of β-cell function compared with oral hypoglycemic agents (Alvarsson et al., 2003,Weng et al., 2008, Chen et al., 2008). It is also an effective line of therapy that helps in better control of serum cholesterol and triglycerides.
conclusion
• To our knowledge, it may be the first research in Egypt that looks for intensive insulin therapy in newly diagnosed naïve type 2 diabetes mellitus for relatively long time (3 months) with 12 months follow up. Advantages of this study are firstly, comparing the insulin intensively treated patients and patients treated with fixed dose insulin (2 doses: before breakfast and before dinner) with orally treated one ,in this way the results were less likely to be influnced by differences in other parameters known and unknown. Secondly, we use several parameters to evaluate if there is improvement of ß cell function or not. Further studies on this subject are eagerly awaited; the results of this study need to be confirmed in clinical trials.