
THE ORION NEBULA IN THE MID-INFRARED
30
THE ORION NEBULA IN THE MID-INFRARED M. Robberto, 1 S. V. W. Beckwith, and N. Panagia 1 Space Telescope Science Institute, 4300 San Martin Drive, Baltimore, MD 21218 S. G. Patel 2 University of California, Santa Cruz, 1156 High Street, Santa Cruz, CA 95064 T. M. Herbst and S. Ligori Max-Planck-Institut f u ¨r Astronomie, Ko ¨nigstuhl 17, D-69117 Heidelberg, Germany and A. Custo, 3 P. Boccacci, and M. Bertero INFM and Dipartimento di Informatica e Scienze dell’Informazione, Universita ` di Genova, Via Dodecaneso 35, I-16146 Genoa, Italy Receivv ed 2004 March 31; accepted 2004 December 13 ABSTRACT We present two wide-field (5 0 ; 3A5), diffraction-limited (k=D ’ 0B5 at 10 "m), broadband 10 and 20 "m images of the Orion Nebula, plus six 7–13 "m narrowband (k=k ’ 1) images of the BN/ KL complex taken at the 3.8 m UKIRT telescope with the MPIA MAX camera. The wide-field images, centered on the Trapezium and BN/KL regions, are mosaics of 35 00 ; 35 00 frames obtained with standard chopping and nodding techniques and reconstructed using a new restoration method developed for this project. They show the filamentary structure of the dust emission from the walls of the H ii region and reveal a new remarkable group of arclike structures 1 0 to the south of the Trapezium. The morphology of the Ney-Allen Nebula, produced by wind-wind interaction in the vicinity of the Trapezium stars, suggests a complex kinematical structure at the center of the cluster. We find indications that one of the most massive members of the cluster, the B0.5 V star 1 Ori D, is surrounded by a photoevaporated cir- cumstellar disk. Among the four historic Trapezium OB stars, this is the only one without a binary companion, suggesting that stellar multiplicity and the presence of massive circumstellar disks may be mutually exclusive. In what concerns the BN/KL complex, we find evidence for extended optically thin silicate emission on top of the deep 10 "m absorption feature. Assuming a simple two-component model, we map with ’0B5 spatial resolution the foreground optical depth, color temperature, and mid-IR luminosity of the embedded sources. We resolve a conspicuous point source at the location of the IRc2-A knot, approximately 0B5 north of the deeply embedded H ii region ‘‘I.’’ We analyze the spectral profile of the 10 "m silicate absorption feature and find indication for grain crystallization in the harsh nebular environment. In the OMC-1 South region, we detect several point sources and discuss their association with the mass-loss phenomenology observed at optical and millimeter wavelengths. Fi- nally, we list the position and photometry of 177 point sources, the large majority of which are detected for the first time in the mid-IR. Twenty-two of them lack a counterpart at shorter wavelengths and are therefore candidates for deeply embedded protostars. The comparison of photometric data obtained at two different epochs reveals that source variability at 10 "m is present up to a level of 1 mag on a timescale of 2 yr. With the possible exception of a pair of OB stars, all point sources detected at shorter wavelengths display 10 "m emission well above the photospheric level, which we attribute to disk circumstellar emission. The recent model of Robberto et al. provides the simplest explanation for the observed mid-IR excess. Key words: infrared: general — ISM: individual (Orion Nebula) — methods: data analysis — planetary systems: protoplanetary disks — stars: formation 1. INTRODUCTION The Great Orion Nebula ( M42=NGC 1976), with its associ- ated cluster of pre–main-sequence stars, represents the nearest (d ’ 450 pc) and best-studied episode of massive star formation (Lada & Lada 2003). The stellar cluster, distributed on a volume of 3 pc radius (Hillenbrand & Hartmann 1998), contains ap- proximately 2500 stars ’10 6 yr old spanning the mass range 45–0.02 M (Hillenbrand 1997; Hillenbrand & Carpenter 2000). There is clear evidence of mass segregation, with the most mas- sive OB stars (the Trapezium system) concentrated in the central 0.15 pc, where the stellar density approaches 2 ; 10 4 stars pc 3 . Ultraviolet radiation from the Trapezium stars, mostly the O6.5 V star 1 Ori C, has produced the Great Orion Nebula (O’Dell 2001a, 2001b), a blister cavity excavated on the surface of the parental molecular cloud OMC-1. The same UV radiation also photoablates the accreting circumstellar disks of the near- est stars, producing the characteristic photoionized ‘‘proplyds’’ ( Laques & Vidal 1979; O’Dell et al. 1993). Proplyds provide the most compelling evidence that the star formation process can be dramatically affected by the mutual interaction between cluster members. The Orion Nebula Cluster, especially the core region (the Trapezium cluster), has been investigated by several authors using 1 Affiliated with the Space Telescope Division of the European Space Agency, ESTEC, Noordwijk, Netherlands. 2 Space Telescope Science Institute Summer Student Program participant. 3 Current address: Massachusetts Institute of Technology, Computer Science and Artificial Intelligence Laboratory, 32 Vassar Street, Cambridge, MA 02139. 1534 The Astronomical Journal, 129:1534–1563, 2005 March # 2005. The American Astronomical Society. All rights reserved. Printed in U.S.A.
Transcript of THE ORION NEBULA IN THE MID-INFRARED

THE ORION NEBULA IN THE MID-INFRARED
M. Robberto,1S. V. W. Beckwith, and N. Panagia
1
Space Telescope Science Institute, 4300 San Martin Drive, Baltimore, MD 21218
S. G. Patel2
University of California, Santa Cruz, 1156 High Street, Santa Cruz, CA 95064
T. M. Herbst and S. Ligori
Max-Planck-Institut f ur Astronomie, Konigstuhl 17, D-69117 Heidelberg, Germany
and
A. Custo,3P. Boccacci, and M. Bertero
INFM and Dipartimento di Informatica e Scienze dell’Informazione, Universita di Genova,
Via Dodecaneso 35, I-16146 Genoa, Italy
Receivved 2004 March 31; accepted 2004 December 13
ABSTRACT
We present two wide-field (�50 ; 3A5), diffraction-limited (k=D ’ 0B5 at 10 �m), broadband 10 and 20 �m imagesof the Orion Nebula, plus six 7–13 �m narrowband (k=�k ’ 1) images of the BN/KL complex taken at the 3.8 mUKIRT telescope with the MPIA MAX camera. The wide-field images, centered on the Trapezium and BN/KLregions, are mosaics of 3500 ; 3500 frames obtained with standard chopping and nodding techniques and reconstructedusing a new restoration method developed for this project. They show the filamentary structure of the dust emissionfrom the walls of the H ii region and reveal a new remarkable group of arclike structures �10 to the south of theTrapezium. The morphology of the Ney-Allen Nebula, produced by wind-wind interaction in the vicinity of theTrapezium stars, suggests a complex kinematical structure at the center of the cluster. We find indications that oneof the most massive members of the cluster, the B0.5 V star �1 Ori D, is surrounded by a photoevaporated cir-cumstellar disk. Among the four historic Trapezium OB stars, this is the only one without a binary companion,suggesting that stellar multiplicity and the presence of massive circumstellar disks may be mutually exclusive. Inwhat concerns the BN/KL complex, we find evidence for extended optically thin silicate emission on top of thedeep 10 �m absorption feature. Assuming a simple two-component model, we map with ’0B5 spatial resolutionthe foreground optical depth, color temperature, and mid-IR luminosity of the embedded sources. We resolve aconspicuous point source at the location of the IRc2-A knot, approximately 0B5 north of the deeply embedded H ii
region ‘‘I.’’ We analyze the spectral profile of the 10 �m silicate absorption feature and find indication for graincrystallization in the harsh nebular environment. In the OMC-1 South region, we detect several point sources anddiscuss their association with the mass-loss phenomenology observed at optical and millimeter wavelengths. Fi-nally, we list the position and photometry of 177 point sources, the large majority of which are detected for the firsttime in the mid-IR. Twenty-two of them lack a counterpart at shorter wavelengths and are therefore candidates fordeeply embedded protostars. The comparison of photometric data obtained at two different epochs reveals thatsource variability at 10 �m is present up to a level of �1 mag on a timescale of �2 yr. With the possible exceptionof a pair of OB stars, all point sources detected at shorter wavelengths display 10 �m emission well above thephotospheric level, which we attribute to disk circumstellar emission. The recent model of Robberto et al. providesthe simplest explanation for the observed mid-IR excess.
Key words: infrared: general — ISM: individual (Orion Nebula) — methods: data analysis —planetary systems: protoplanetary disks — stars: formation
1. INTRODUCTION
The Great Orion Nebula (M42=NGC 1976), with its associ-ated cluster of pre–main-sequence stars, represents the nearest(d ’ 450 pc) and best-studied episode of massive star formation(Lada & Lada 2003). The stellar cluster, distributed on a volumeof �3 pc radius (Hillenbrand & Hartmann 1998), contains ap-proximately 2500 stars ’106 yr old spanning the mass range45–0.02M� (Hillenbrand 1997;Hillenbrand&Carpenter 2000).
There is clear evidence of mass segregation, with the most mas-sive OB stars (the Trapezium system) concentrated in the central�0.15 pc, where the stellar density approaches 2 ; 104 starspc�3. Ultraviolet radiation from the Trapezium stars, mostly theO6.5 V star �1 Ori C, has produced the Great Orion Nebula(O’Dell 2001a, 2001b), a blister cavity excavated on the surfaceof the parental molecular cloud OMC-1. The same UV radiationalso photoablates the accreting circumstellar disks of the near-est stars, producing the characteristic photoionized ‘‘proplyds’’(Laques &Vidal 1979; O’Dell et al. 1993). Proplyds provide themost compelling evidence that the star formation process can bedramatically affected by the mutual interaction between clustermembers.The Orion Nebula Cluster, especially the core region (the
Trapezium cluster), has been investigated by several authors using
1 Affiliated with the Space Telescope Division of the European SpaceAgency, ESTEC, Noordwijk, Netherlands.
2 Space Telescope Science Institute Summer Student Program participant.3 Current address: Massachusetts Institute of Technology, Computer Science
and Artificial Intelligence Laboratory, 32 Vassar Street, Cambridge, MA 02139.
1534
The Astronomical Journal, 129:1534–1563, 2005 March
# 2005. The American Astronomical Society. All rights reserved. Printed in U.S.A.

data collected at visible (Prosser et al. 1994; Hillenbrand 1997;Robberto et al. 2004) and near-IR wavelengths (McCaughrean &Stauffer 1994; Hillenbrand & Carpenter 2000; Lucas & Roche2000; Luhman et al. 2000; Lada et al. 2000). Since circumstellardisks emit in the IR the energy they ‘‘passively’’ absorb fromtheir central stars or ‘‘actively’’ produce by the viscous dissi-pation processes associated with mass accretion, there is a needfor similar observations at longer wavelengths, in particular inthe mid-IR (k ’ 5 20 �m), where ground-based telescopes canreach subarcsecond spatial resolution. Mid-IR observations havealso the potential of discovering objects more deeply embeddedwithin the molecular cloud, otherwise invisible at shorter wave-lengths (with the possible exception of hard X-rays), and even-tually identifying sites where protostellar contraction is stillongoing. Moreover, mid-IR data may also provide complemen-tary information on the structure of the H ii region through thediffuse emission of the dust grains and polycyclic aromatic hy-drocarbon (PAH) molecules mixed with the ionized gas or lo-cated in the surrounding photodissociation region (PDR).
The first 3.5 �m image of the Trapezium cluster taken with apanoramic detector was presented, but only briefly discussed,by McCaughrean et al. (1996). A more complete study of theTrapezium cluster at this wavelength has been published byLada et al. (2000). They found that 80%–85% of stars are sur-rounded by circumstellar disks, in agreement with earlier studiesmade at near-IR wavelengths, and identify 78 sources with ex-tremely red colors that they classify as candidate protostars.
At wavelengths k > 3:5 �m, the region remains largely un-explored.Mapsmadewith single-element bolometers in the earlydays of IR astronomy revealed two prominent sources, the BN/KL complex (Becklin & Neugebauer 1967; Kleinman & Low1967) and the Ney-Allen Nebula in the vicinity of the Trapezium(Ney & Allen 1969). Both fields have been widely investigatedwith increasing sensitivity and spatial and spectral resolution. Im-ages at 10 and 20 �m made with panoramic detectors have beenpublished by Gezari et al. (1998), Greenhill et al. (2004), andShuping et al. (2004) for BN/KL and by Hayward et al. (1994)for the Ney-Allen Nebula. Smith et al. (2004) have recentlypresented an image of the OMC-1 South region.
We have undertaken a large observational program on theOrion Nebula using the mid-IR camera MAX on the UKIRT4
telescope. Our research program consists of two parts: first, toobserve at 10 �m with relatively long integration times the mostprominent proplyds in order to detect and resolve their structurein the mid-IR, and second, to map the entire nebular core, i.e., anarea of approximately 50 ; 50 covering both the Ney-Allen andBN/KL regions, with shorter integration times. In this paper wepresent the results relative to this second study, complemented
by narrowband observations of the BN/KL complex. In x 2 wepresent our observations and our data reduction strategy, basedon a reconstruction method originally developed for this project.In x 3,we present ourmain results, the 10 and 20�mwide-field im-ages and the photometric catalog of 177 point sources detected at10�m. In x 4,we discuss the overall structure of the nebula (x 4.1),the Ney-Allen region (x 4.2), the BN/KL complex (x 4.3), theOMC-1 South region (x 4.4), and finally themain properties of oursample of point sources (x 4.5). In x 5,we summarize our findings.
2. OBSERVATIONS AND DATA REDUCTION
2.1. Data Acquisition
The wide-field maps presented in this paper were obtainedcombining observations made in 1998 November and 2000December at the 3.8 m United Kingdom Infrared Telescope(UKIRT) on Mauna Kea, Hawaii. We used MAX5 (Robberto& Herbst 1998), a mid-IR imager based on a Rockwell 128 ;128 Si:As blocked impurity band detector optimized for highbackground observations. MAX’s optics delivered a plate scaleof 0B26, corresponding to an approximately 3500 ; 3500 field ofview. Images have been obtained through broad N-band andQ-band filters. M. Cohen provided detailed modeling of our pho-tometric system, including typical Mauna Kea transmission,optics throughput, and detector response. For an A0 V star, theN-band filter has an effective wavelength k10 ¼ 10:1 �m and�k ¼ 3:13 �m, whereas the Q-band filter has k20 ¼ 19:7 �mand �k ¼ 2:44 �m. The narrowband images were obtained on2000 December 18, through the standard set of silicate filterscentered at 7.7, 8.7, 9.8, 10.2, 11.2, and 12.4 �m (see Robberto& Herbst 1998 for the detailed filter parameters).
UKIRT is equipped with tip-tilt adaptive correction at thesecondary mirror (Hawarden et al. 1999). Exploiting this ca-pability, MAX routinely reaches diffraction-limited performancesat k � 8 �m with k=D ’ 0B5. The guide system, however, onlyallows for chopping throws of at most 3000 (a maximum of’2000 was in fact suggested for the ’5 Hz chopping frequencywe used). Given the extent of the Orion Nebula and the MAXsensitivity, we could not chop onto empty sky areas for back-ground subtraction. We experimented with the use of sky framestaken several arcminutes away, nodding the telescope at a fre-quency’0.1Hz, constrained by the telescope pointing and tip-tiltreference star acquisition, but this method produced significantlosses of sensitivity and observing efficiency. We therefore optedfor the conventional chopping and nodding technique, adopting anobserving strategy optimized for image post-processing, namely,the reconstruction method envisioned in Bertero et al. (2000)and references therein. In Table 1, we list the main observing
4 TheUnitedKingdom Infrared Telescope is operated by the Joint AstronomyCentre on behalf of the UK Particle Physics and Astronomy Research Council.
TABLE 1
Main Observational Parameters
Night Filter
Integration Time
(ms)
Chop Frequency
(Hz)
Integration Time per Frame
(s)
Chop Throw
(arcsec)
1998 Nov 27.............. N 20.2 4.2 20.07 9.80 (N-S)
1998 Nov 27.............. N 20.2 4.2 40.14 18.55 (N-S)
2000 Dec 18 .............. N 9.9 3.9 25.36 24.64 (E-W)
2000 Dec 19 .............. N 9.9 3.9 25.36 24.64 (E-W)
2000 Dec 19 .............. Q 9.9 3.9 12.68 24.64 (E-W)
2000 Dec 18 .............. Silicates 20.2 4.12 12.944 24.64 (E-W)
5 The instrument has been decommissioned since 2000 December. The 20 �mmosaic represents the very last set of images taken by MAX.
ORION NEBULA IN MID-INFRARED 1535

parameters: night of the observation, filter, integration time persingle frame, chopping frequency, total exposure time on themain beam per each nodding cycle, and chopping throw am-plitude and direction.
We scanned the survey region both in declination and rightascension using different chopping and nodding amplitudes.At each step, the telescope was offset (nodding) by an amountequal to the chopping amplitude; i.e., the new pointing positionof the telescope on the main beam was coincident with the po-sition imaged in the previous offset beam. Directions and am-plitudes of chopping and nodding were carefully matched andaligned with the orientation of the array columns or rows. Be-cause of a �1� rotation of the detector with respect to the equa-torial coordinates, the chopping and nodding directions werenot exactly coincident with the north-south or east-west axes.Therefore, the combined rows or columns have a slight drift withrespect to the scan direction. The setup process and observingstrategy is detailed further in Bertero et al. (2000).
Scans were typically �40 long, with a small side overlay(�10 pixels) to maximize field coverage. Since in the two runsthe camera was mounted on different focal positions of thetelescope, images are rotated by 90� between the two runs. Therotation of the optical path allows us to easily individuate ghostimages produced by the brightest sources, BN in particular.
Observations were generally performed up to an air mass z ¼ 2under excellent weather conditions. Absolute flux calibration inthe N band has been obtained by observing at various air massesthe following standard stars: HR 337 (½N � ¼ �2:06), HR 1040(½N � ¼ 2:55), HR 1713 (½N � ¼ 0:06), HR 2061 (½N � ¼ �5:13),HR 4069 (½N � ¼�0:94), HR 2943 (½N � ¼�0:76), HR 4554(½N � ¼ 2:32), and HR 5340 (½N � ¼ �3:17). Our absolute fluxcalibration assumes for � Lyr ½N � ¼ 0 with a flux F ¼ 1:116 �0:015 ; 10�16 W cm�2 �m�1 at k10, corresponding to 37.9 Jy.Calibration at 20 �m was based on HR 1760 (½Q� ¼ �0:30),HR 2061 (½Q� ¼ 5:7), and HR 4069 (½Q� ¼ �1:00). The zero-magnitude flux in this case isF ¼ 7:887� 0:011 ; 10�18 W cm�2
�m�1 at k20, corresponding to 10.2 Jy. The narrowband im-ages of BNwere calibrated against HR 1040, 1457, 1713, 4069,2943 and 5340, with magnitudes and zero points given in Table 2.It is clear that the depth of our images is not uniform, since thetotal integration time in each scan is a function of the adoptedpattern (amplitude of the chopping throws and offset betweenadjacent rows/columns), air mass, repeated or discarded frames,etc. Moreover, in the final images, part of the field has been ob-served on more than one night. In general, we estimate that theaverage integration time in the N band is on the order of 200 s.Concerning the narrowband images, the total integration time is103.5 s at all wavelengths except the 8.7 �m band, where it is102.5 s.
As a final remark, we note that we were able to obtainseveral scans of the region only at 10 �m. The 20 �m data were
all collected in one night, with only one chopping and noddingamplitude. The final mosaic is therefore shallower and poten-tially more affected by reconstruction artifacts.
2.2. Data Reduction
The raw images were first median-filtered to remove a smallnumber (�15) of dead pixels and occasional extra noise in theframes containing the saturated BN peak. Cleaned frames werethen normalized to the same integration time and combined toform chopped and nodded pairs. The final combination in thewide-area mosaic required a special effort, described in thefollowing section.
2.2.1. Mosaics
All chopped and nodded pairs taken on the same night werecombined into rows or columns and then into a single mosaic.This operation was performed using MOSAIC, an IDL packagedesigned for mid-IR data and publicly available on the Internet(Varosi & Gezari 1993). The images were combined by integerpixels, rounding the coordinates of the FITS header (accurate to’0B1) to the nearest value. Figure 1 illustrates the mosaickingprocess using images directly grabbed from the MOSAIC out-put windows. The mosaics contain for each source two negativecounterparts at the position of the two offset beams. Hence, weneeded to reconstruct a true image.The restoration method we have used was specifically de-
veloped for this project. The theoretical basis has been illus-trated in a number of papers (Bertero et al. 1998, 1999, 2000);thus, we provide here only a brief outline. Since the problem isunderconstrained, it admits infinite solutions. In particular, theset of solutions whose chopped and nodded images are iden-tically zero constitutes the null space, infinite dimensional, ofthe chopping and nodding operator. Any linear combination ofthese functions can be added to a reconstructed image withoutaffecting the observed chopped and nodded image. In the nullspace it is possible to define a metric and apply minimizationprocesses. Our strategy is to search for the minimal positivesolution, assuming the celestial signal cannot be negative. Theimplementation of the algorithm is based on the Landwebermethod (Bertero & Boccacci 1998). It is iterative and thereforeproduces an approximate solution at each step. The number ofiterations needs to be optimized to control noise propagation,and our criterion has been described in Bertero et al. (2000).When applied to real images, it produces excellent results. Insome situations, however, it may generate artifacts, e.g., arti-ficial ghost images of the stars (appearing as dark images overa bright background or as bright images over a dark back-ground) or discontinuities in the background level. The loca-tion and periodicity of the artifacts are related to the values ofimage size and chopping amplitude through the mathematicalstructure of the problem (Bertero et al. 1999). For our 10 �m
TABLE 2
Calibrators for Narrowband Imaging
Source 7.7 �m 8.7 �m 9.8 �m 10.2 �m 11.2 �m 12.4 �m
HR 1040............... 2.55 2.55 2.55 2.55 2.55 2.55
HR 1457............... �2.97 �2.94 �3.00 �3.04 �3.07 �3.07
HR 1713............... 0.06 0.06 0.06 0.06 0.06 0.06
HR 4069............... �0.84 �0.83 �0.91 �0.96 �1.00 �1.00
HR 2943............... �0.77 �0.77 �0.76 �0.76 �0.76 �0.76
HR 5340............... �3.11 �3.10 �3.14 �3.17 �3.18 �3.18
Fm = 0 (Jy)......... 63.56 50.86 41.64 36.67 28.94 25.28
ROBBERTO ET AL.1536 Vol. 129

mosaic, they have been minimized by replacing at their po-sitions the information provided by the reconstructed imagesobtained with different chopping throws and orientation. An-other problem is that the inversion method we have usedprovides less than ideal results when the signal in the image tobe inverted is negative. In this case, the number of iterationsneeded to recover the signal may be larger than the number ofiterations corresponding to optimal noise reduction. Also inthis case, these problems have been greatly mitigated at 10 �mby using images taken with different orientation and choppingamplitudes.
2.2.2. Narrowband Imagges
The narrowband images were registered using the peak ofthe BN object, then combined and trimmed to the same sizeof 101 pixels ; 117 pixels, corresponding to 26B8 ; 31B0. Theastrometric solution was derived assuming for the BN peakthe following coordinates: R:A:(J2000) ¼ 05h35m14:s10 anddecl:(J2000) ¼ �05�22022B7, a nominal pixel scale of 0B26constant across the field, a rotation angle of �0N8 east ofnorth, as measured on the same night for the wide field areaproject. The BN center was set at the pixel position (64.2, 82.2)
and measured using a centroid procedure with 5 pixel (1B3)radius.
2.2.3. Photometry
Point sources have been identified by visual inspection ofthe original (chopped and nodded) images and then confirmedon the final reconstructed image. A few sources, indicated inTable 3, appear very faint only in the final mosaic and do notshow any counterparts at shorter wavelengths. It is possiblethat some are artifacts surviving the image cleaning processesdescribed in the previous section, and an independent confir-mation is needed to make sure they are real. On the other hand,the variations of exposure time and air mass across the imagemay have rendered invisible sources otherwise within reachwith our instrument in more ideal conditions.
Aperture photometry was obtained on individual chop/nodpairs using circular apertures with radii between 2 and 5 pixelsand applying an aperture correction based on the average en-circled energy of the standard stars observed during the samenight. Typically, all standards were used, with the exceptionof HR 2061 (� Ori), known to be extended in the mid-IR(Rinehart et al. 1998) and easily resolved by MAX. An air-mass
Fig. 1.—Example of the construction of the 10 �m mosaic. Clockwise from top left, individual chopped and nodded frames are progressively assembled into afinal strip. The restoration method works on each individual column (or row). The column, approximately 350 wide, contains the BN/KL complex and the OMC-1South region. North is at the top and west is on the right.
ORION NEBULA IN MID-INFRARED 1537No. 3, 2005

TABLE 3
Mid-Infrared Photometry of Sources in the Orion Nebula
MAX
(1)
H97
(2)
HC00
(3)
MLLA02
(4)
R.A. (J2000)
(5)
Decl. (J2000)
(6)
[N ]
(1998 Nov)
(7)
[N ]
(2000 Dec)
(8)
[N ]
(mosaic)
(9)
[Q]
(10)
Notes
(11)
1..................... 265 . . . 234 05 35 05.52 �05 24 09.9 . . . 6.55 � 0.14 . . . . . . MAX source is þ3B53 E, �0B28 N
2..................... 266 . . . 223 05 35 05.55 �05 24 14.5 . . . 7.50 � 0.39 . . . . . . MAX source is þ3B44 E, �0A19 N
3..................... 274 . . . 314 05 35 05.74 �05 23 44.5 . . . 6.72 � 0.16 . . . . . . MAX source is þ2B10 E, 0B19 S
4..................... 278 . . . 161 05 35 05.74 �05 24 18.4 . . . 5.90 � 0.11 . . . . . . MAX source is þ1B55 E, 0B32 S
5..................... 291 99 161 05 35 06.45 �05 24 39.0 . . . . . . 6.85 � 0.15 . . .6..................... 341 305 409 05 35 10.23 �05 23 21.0 . . . 4.70 � 0.09 . . . . . .
7..................... . . . . . . . . . 05 35 10.23 �05 21 43.5 . . . 6.48 � 0.18 . . . . . .
8..................... . . . 320 425 05 35 10.28 �05 23 15.8 . . . 7.46 � 0.14 . . . . . .
9..................... 349 146 220 05 35 10.56 �05 24 17.2 . . . 6.78 � 0.10 . . . . . .10................... 347 554 733 05 35 10.64 �05 21 56.8 . . . 6.16 � 0.13 . . . . . .
11................... 392 385 507 05 35 10.64 �05 22 55.8 . . . 6.14 � 0.09 . . . . . .
12................... 352 224 316 05 35 10.75 �05 23 44.1 . . . 7.27 � 0.13 . . . . . .13................... 355 416 542 05 35 10.90 �05 22 46.1 . . . 6.37 � 0.10 . . . . . .
14................... 356 93 148 05 35 10.94 �05 24 48.5 . . . 6.00 � 0.12 . . . . . .
15................... . . . 415 541 05 35 11.04 �05 22 46.3 . . . 6.50 � 0.11 . . . . . .
16................... . . . . . . . . . 05 35 11.11 �05 21 53.0 . . . 6.38 � 0.17 . . . . . .17................... . . . 434 575 05 35 11.20 �05 22 37.6 . . . 5.06 � 0.09 . . . . . .
18................... . . . 105 171 05 35 11.32 �05 24 38.4 . . . 6.34 � 0.13 . . . . . .
19................... . . . 203 289 05 35 11.49 �05 23 51.5 . . . 6.95 � 0.10 . . . . . .
20................... 366 140 207 05 35 11.65 �05 24 21.9 . . . 7.99 � 0.19 . . . . . .21................... . . . 611 809 05 35 11.75 �05 21 31.8 . . . . . . 7.23 � 0.3 . . .
22................... . . . 672 880 05 35 11.88 �05 20 59.9 . . . . . . 5.70 � 0.2 . . .
23................... 3058 664 872 05 35 11.92 �05 21 02.8 . . . . . . 6.85 � 0.3 . . .
24................... . . . . . . 710 05 35 11.95 �05 22 01.5 . . . . . . 7.17 � 0.4 . . .25................... 9009 395 516 05 35 11.98 �05 22 53.6 . . . 6.03 � 0.10 . . . . . .
26................... 373 . . . 944 05 35 12.01 �05 20 33.8 . . . . . . 6.10 � 0.3 . . .
27................... 378a, b 215 302A, B 05 35 12.27 �05 23 47.8 . . . 6.00 � 0.10 . . . . . .28................... 377a, b 698 914A, B 05 35 12.30 �05 20 45.6 . . . . . . 5.24 � 0.3 . . .
29................... . . . 761 793 05 35 12.41 �05 21 36.7 . . . 8.08 � 0.25 . . . . . .
30................... 9018 368 482 05 35 12.58 �05 23 02.0 . . . 7.43 � 0.15 . . . . . .
31................... 385 228 318 05 35 12.60 �05 23 43.9 . . . 5.49 � 0.10 . . . 1.39 � 0.20
32................... 391 699 916 05 35 12.85 �05 20 44.8 . . . . . . 8.97 � 0.3 . . .
33................... . . . 606, 608 804A, B 05 35 12.85 �05 21 33.6 6.33 � 0.13 . . . . . . . . .
34................... 9029 505 673 05 35 13.07 �05 22 16.1 7.36 � 0.31 7.38 � 0.29 . . . . . .
35................... 399a, b 487 651A, B 05 35 13.19 �05 22 21.8 7.27 � 0.19 7.04 � 0.18 . . . . . .36................... . . . . . . . . . 05 35 13.19 �05 22 04.6 7.14 � 0.12 7.35 � 0.19 . . . . . .
37................... 401 80 136 05 35 13.20 �05 24 55.5 . . . 3.79 � 0.11 . . . . . .
38................... 400 682 896 05 35 13.24 �05 20 54.7 6.34 � 0.20 . . . . . . . . .39................... . . . . . . . . . 05 35 13.31 �05 21 53.6 7.55 � 0.26 . . . . . . . . .
40................... . . . 273 369 05 35 13.40 �05 23 29.5 6.22 � 0.09 6.21 � 0.11 . . . . . .
41................... 409 240 327 05 35 13.44 �05 23 40.2 6.44 � 0.09 6.22 � 0.10 . . . . . .
42................... . . . 178 263 05 35 13.55 �05 24 00.2 6.74 � 0.09 6.87 � 0.12 . . . . . .43................... . . . 192 276 05 35 13.58 �05 23 55.0 6.40 � 0.09 6.24 � 0.11 . . . 2.9 � 0.3
44................... . . . 602 797 05 35 13.71 �05 21 35.7 6.43 � 0.09 6.39 � 0.13 . . . . . .
45................... 424 541 715 05 35 13.79 �05 22 03.5 . . . 6.28 � 0.50 . . . . . .
46................... 431 242 328 05 35 13.79 �05 23 40.1 2.69 � 0.08 2.78 � 0.09 . . . 0.68 � 0.19
1538

TABLE 3—Continued
MAX
(1)
H97
(2)
HC00
(3)
MLLA02
(4)
R.A. (J2000)
(5)
Decl. (J2000)
(6)
[N ]
(1998 Nov)
(7)
[N ]
(2000 Dec)
(8)
[N ]
(mosaic)
(9)
[Q]
(10)
Notes
(11)
47.................. . . . . . . . . . 05 35 13.8 �05 23 57.0 . . . . . . . . . 1.55 � 0.18
48.................. 423 703 703 05 35 13.81 �05 22 07.8 4.90 � 0.08 4.70 � 0.09 . . . . . .49.................. . . . 548 726 05 35 13.81 �05 22 00.6 1.98 � 0.08 1.90 � 0.09 . . . �0.64 � 0.16
50.................. . . . . . . . . . 05 35 13.9 �05 22 12.0 . . . . . . . . . 0.98 � 0.22
51.................. 9053 629 828 05 35 13.96 �05 21 22.8 5.99 � 0.08 . . . . . . . . .
52.................. . . . 314 413 05 35 13.97 �05 23 20.1 . . . . . . 6.73 � 0.3 . . .53.................. . . . 134 199 05 35 14.01 �05 24 25.4 . . . 7.47 � 0.21 . . . . . .
54.................. . . . . . . . . . 05 35 14.1 �05 23 00.0 . . . . . . . . . 1.65 � 0.21
55.................. . . . 704 707 05 35 14.12 �05 22 05.4 6.78 � 0.50 . . . . . . . . .56.................. . . . . . . . . . 05 35 14.18 �05 23 14.8 . . . 5.99 � 0.21 . . . . . .
57.................. 437 135 203 05 35 14.29 �05 24 24.7 5.57 � 0.09 5.66 � 0.10 . . . . . .
58.................. . . . 361 476 05 35 14.30 �05 23 04.3 6.04 � 0.09 6.51 � 0.11 . . . . . .
59.................. 9061 345 452 05 35 14.31 �05 23 08.4 5.81 � 0.08 5.51 � 0.10 . . . . . .60.................. 9062 399 518 05 35 14.33 �05 22 53.7 6.16 � 0.09 6.18 � 0.14 . . . . . .
61.................. . . . . . . 292 05 35 14.38 �05 23 50.6 4.40 � 0.08 3.68 � 0.09 . . . 0.42 � 0.18
62.................. 441 258 350 05 35 14.40 �05 23 33.8 5.83 � 0.08 6.05 � 0.11 . . . . . .
63.................. 9069 369 485 05 35 14.58 �05 23 02.6 . . . 6.97 � 0.19 . . . . . . MAX source is �2B80 E, þ0B29 S
64.................. . . . 189, 193 273A, B 05 35 14.54 �05 23 55.7 5.44 � 0.08 5.27 � 0.09 . . . 1.91 � 0.22
65.................. . . . 411 534 05 35 14.63 �05 22 50.2 . . . 6.95 � 0.19 . . . . . . MAX source is �2B25 E, �0B52 N
66.................. 9073, 9075 714 467A, B 05 35 14.84 �05 23 05.0 6.58 � 0.19 . . . . . . . . . MAX source is �3B35 E, 0B24 N
67.................. 445a, b . . . 922A, B 05 35 14.69 �05 20 43.7 . . . . . . 6.60 � 0.3 . . .
68.................. 9071 657 863 05 35 14.71 �05 21 05.9 6.32 � 0.10 . . . . . . . . .
69.................. 454 431 568 05 35 14.91 �05 22 39.6 4.79 � 0.08 4.75 � 0.10 . . . . . .
70.................. . . . 437 580 05 35 15.19 �05 22 37.3 6.59 � 0.10 6.53 � 0.26 . . . . . .71.................. 463 398 514 05 35 15.21 �05 22 54.7 4.44 � 0.08 4.28 � 0.10 . . . . . .
72.................. . . . . . . . . . 05 35 15.34 �05 22 50.4 7.21 � 0.17 . . . . . . . . .
73.................. 470 504 671 05 35 15.34 �05 22 16.3 4.85 � 0.08 4.60 � 0.10 . . . . . .
74.................. 472a, b, 9096 475, 476 630A, B, C 05 35 15.35 �05 22 25.7 7.00 � 0.11 7.07 � 0.32 . . . . . .75.................. 473 646 848 05 35 15.40 �05 21 13.6 5.45 � 0.08 . . . . . . . . .
76.................. 475 223 311 05 35 15.43 �05 23 45.0 6.81 � 0.09 7.26 � 0.16 . . . . . .
77.................. . . . . . . . . . 05 35 15.49 �05 23 52.3 7.31 � 0.17 . . . . . . . . .78.................. . . . . . . . . . 05 35 15.50 �05 23 48.2 . . . 6.21 � 0.11 . . . . . .
79.................. 5178 251 340 05 35 15.52 �05 23 37.5 6.51 � 0.09 5.97 � 0.12 . . . 1.39 � 0.20
80.................. . . . . . . . . . 05 35 15.6 �05 23 10.3 . . . . . . . . . 1.59 � 0.21
81.................. 480 172 249 05 35 15.64 �05 24 03.9 6.26 � 0.09 6.49 � 0.11 . . . . . .82.................. 479 389 503 05 35 15.65 �05 22 56.7 3.93 � 0.08 3.87 � 0.09 . . . . . .
83.................. 488w 307 405 05 35 15.72 �05 23 22.7 5.75 � 0.09 5.47 � 0.11 . . . 1.41 � 0.24a
84.................. 492 420 545 05 35 15.78 �05 22 46.4 8.33 � 0.82 . . . . . . . . .
85.................. 1865 336 440 05 35 15.80 �05 23 14.6 5.43 � 0.25 . . . . . . . . .86.................. 489 287 381 05 35 15.80 �05 23 26.7 5.44 � 0.08 5.28 � 0.11 . . . . . .
87.................. 488a 306 404 05 35 15.86 �05 23 22.5 4.48 � 0.08 4.46 � 0.11 . . . 1.41 � 0.24a
88.................. . . . 291 385 05 35 15.86 �05 23 25.0 5.65 � 0.18 . . . . . . . . . OW 158-326b
89.................. 490 . . . 925 05 35 15.88 �05 20 39.7 . . . . . . 8.83 � 0.3 . . .90.................. 9118 145 213 05 35 15.90 �05 24 18.0 . . . 6.91 � 0.12 . . . . . .
91.................. 496 490 653 05 35 15.93 �05 22 21.8 6.26 � 0.09 . . . . . . . . .
92.................. 499 213 296 05 35 15.95 �05 23 49.9 3.18 � 0.08 3.40 � 0.09 . . . 1.42 � 0.19
93.................. . . . . . . . . . 05 35 15.97 �05 22 36.1 6.86 � 0.22 . . . . . . . . .
94.................. 503 202 288 05 35 16.01 �05 23 52.8 5.16 � 0.08 5.08 � 0.10 . . . . . .
1539

TABLE 3—Continued
MAX
(1)
H97
(2)
HC00
(3)
MLLA02
(4)
R.A. (J2000)
(5)
Decl. (J2000)
(6)
[N ]
(1998 Nov)
(7)
[N ]
(2000 Dec)
(8)
[N ]
(mosaic)
(9)
[Q]
(10)
Notes
(11)
95.................... . . . . . . . . . 05 35 16.05 �05 22 33.4 6.68 � 0.10 . . . . . . . . .96.................... 9128 393 511 05 35 16.07 �05 22 54.4 5.50 � 0.08 5.07 � 0.10 . . . . . .
97.................... 1863b 350 460B 05 35 16.08 �05 23 07.2 3.63 � 0.09 3.66 � 0.09 . . . 1.44 � 0.19
98.................... . . . 296 389 05 35 16.09 �05 23 24.2 3.93 � 0.08 3.98 � 0.10 . . . 1.18 � 0.19
99.................... . . . 504a, b 926 05 35 16.13 �05 20 38.4 . . . . . . 8.13 � 0.3 . . .
100.................. . . . . . . . . . 05 35 16.15 �05 22 26.2 6.86 � 0.19 . . . . . . . . . To be confirmed
101.................. 1863a 354 460A 05 35 16.15 �05 23 07.1 5.76 � 0.37 6.52 � 0.10 . . . . . .
102.................. 511a, b 522 689A, B 05 35 16.28 �05 22 10.5 5.63 � 0.08 5.65 � 0.09 . . . . . .103.................. 9135 652 857 05 35 16.28 �05 21 08.9 6.40 � 0.10 . . . . . . . . .
104.................. 513 412 535 05 35 16.31 �05 22 49.0 6.62 � 0.33 6.97 � 0.19 . . . . . .
105.................. 512 322 422 05 35 16.32 �05 23 16.7 4.24 � 0.08 4.35 � 0.09 . . . 1.06 � 0.26
106.................. . . . . . . 401B 05 35 16.34 �05 23 22.6 3.06 � 0.08 3.07 � 0.09 . . . 0.27 � 0.17 SC 3c
107.................. . . . . . . . . . 05 35 16.4 �05 22 56.0 . . . . . . . . . 1.24 � 0.20
108.................. 515 171 246 05 35 16.41 �05 24 04.2 4.94 � 0.08 5.15 � 0.09 . . . . . .
109.................. . . . 112 173 05 35 16.41 �05 24 36.9 . . . . . . 8.10 � 0.3 . . .110.................. . . . 514 682 05 35 16.42 �05 22 13.0 5.52 � 0.08 4.88 � 0.09 . . . . . .
111.................. 1891 309 401A 05 35 16.46 �05 23 22.7 4.23 � 0.08 4.62 � 0.09 . . . . . .
112.................. . . . . . . . . . 05 35 16.51 �05 22 48.0 . . . 6.79 � 0.65 . . . . . .
113.................. . . . . . . . . . 05 35 16.51 �05 23 30.2 6.07 � 0.31 . . . . . . . . . To be confirmed
114.................. . . . 325 426 05 35 16.52 �05 23 15.5 5.45 � 0.25 . . . . . . . . .
115.................. . . . . . . . . . 05 35 16.7 �05 22 57.0 . . . . . . . . . 1.12 � 0.21
116.................. 524 323 424 05 35 16.76 �05 23 16.5 3.86 � 0.08 4.26 � 0.09 . . . 0.46 � 0.23
117.................. . . . . . . . . . 05 35 16.82 �05 23 58.2 . . . 5.97 � 0.74 . . . . . .118.................. . . . 289 383A, B 05 35 16.84 �05 23 26.0 2.15 � 0.08 2.29 � 0.10 . . . �0.64 � 0.18
119.................. 532 414 537 05 35 16.98 �05 22 49.1 . . . 6.95 � 0.21 . . . . . .
120.................. . . . . . . . . . 05 35 16.98 �05 22 31.0 . . . 6.97 � 0.42 . . . . . .
121.................. 534 252 341 05 35 16.99 �05 23 37.1 4.90 � 0.08 5.40 � 0.09 . . . 0.89 � 0.21
122.................. 533 375 489 05 35 16.99 �05 23 01.3 6.32 � 0.09 5.94 � 0.12 . . . . . .
123.................. 537 244 330 05 35 17.03 �05 23 40.1 . . . 6.65 � 0.19 . . . . . .
124.................. 538 259 348 05 35 17.06 �05 23 34.0 4.45 � 0.08 4.24 � 0.10 . . . . . .125.................. . . . . . . . . . 05 35 17.11 �05 23 26.6 . . . 5.09 � 0.12 . . . 0.78 � 0.25
126.................. . . . . . . . . . 05 35 17.11 �05 23 29.3 . . . 5.02 � 0.11 . . . . . . To be confirmed
127.................. 1889 . . . 423A, B 05 35 17.26 �05 23 17.0 . . . 5.97 � 0.46 . . . . . .
128.................. 548 440 584 05 35 17.37 �05 22 35.6 5.52 � 0.08 5.43 � 0.10 . . . . . .129.................. 549 180 261 05 35 17.39 �05 24 00.1 6.03 � 0.08 6.00 � 0.10 . . . . . .
130.................. 9180 313 411 05 35 17.46 �05 23 21.1 5.41 � 0.09 4.89 � 0.34 . . . . . .
131.................. 554 295 387 05 35 17.55 �05 23 25.0 5.94 � 0.09 5.92 � 0.11 . . . 1.7 � 0.3
132.................. 553a, b 388 499.2A, Bd 05 35 17.57 �05 22 57.10 5.67 � 0.09 5.72 � 0.10 . . . . . .133.................. 552a, b 586 773A, B 05 35 17.57 �05 21 45.9 5.30 � 0.08 5.15 � 0.11 . . . . . .
134.................. . . . 563 743 05 35 17.62 �05 21 54.3 6.33 � 0.09 6.69 � 0.17 . . . . . .
135.................. 558 241 325A 05 35 17.68 �05 23 41.1 6.44 � 0.10 . . . . . . . . .136.................. 9195 234 320 05 35 17.75 �05 23 42.7 6.88 � 0.11 . . . . . . . . .
137.................. 561 681 892 05 35 17.82 �05 20 54.2 . . . . . . 7.77 � 0.3 . . .
138.................. 9201 367 480 05 35 17.90 �05 23 02.0 5.91 � 0.32 . . . . . . . . .
139.................. . . . 542 714 05 35 17.90 �05 22 03.4 6.16 � 0.09 6.07 � 0.11 . . . . . .140.................. 567 425 549 05 35 17.92 �05 22 44.6 6.13 � 0.09 6.27 � 0.11 . . . . . .
141.................. 9196 230 317 05 35 17.93 �05 23 44.5 7.46 � 0.34 . . . . . . . . .
1540

TABLE 3—Continued
MAX
(1)
H97
(2)
HC00
(3)
MLLA02
(4)
R.A. (J2000)
(5)
Decl. (J2000)
(6)
[N ]
(1998 Nov)
(7)
[N ]
(2000 Dec)
(8)
[N ]
(mosaic)
(9)
[Q]
(10)
Notes
(11)
142.................. . . . 679 890 05 35 17.96 �05 20 55.8 . . . . . . 6.34 � 0.3 . . .
143.................. 9210 174 248 05 35 18.04 �05 24 03.0 4.86 � 0.08 4.76 � 0.10 . . . . . .
144.................. 575 177 256 05 35 18.08 �05 24 01.2 6.43 � 0.12 6.53 � 0.10 . . . . . .
145.................. MS-107 372 486 05 35 18.11 �05 23 02.8 6.71 � 0.23 . . . . . . . . .146.................. 581 253 344 05 35 18.21 �05 23 36.0 4.00 � 0.08 4.44 � 0.09 . . . . . .
147.................. . . . 533 705 05 35 18.24 �05 22 05.7 7.18 � 0.15 7.05 � 0.17 . . . . . .
148.................. . . . . . . . . . 05 35 18.31 �05 22 22.6 7.38 � 0.16 . . . . . . . . .
149.................. 9220 348 455 05 35 18.36 �05 23 06.7 6.71 � 0.17 . . . . . . . . .150.................. 582 331 431 05 35 18.37 �05 23 15.7 6.93 � 0.20 . . . . . . . . .
151.................. . . . . . . . . . 05 35 18.65 �05 23 43.1 . . . 7.85 � 0.17 . . . . . .
152.................. 596 337 441 05 35 18.65 �05 23 13.9 3.28 � 0.08 3.45 � 0.09 . . . . . .153.................. 598a, b 713 499.1A, Bd 05 35 18.70 �05 22 56.9 5.16 � 0.08 5.37 � 0.11 . . . . . .
154.................. 607 214 298 05 35 19.04 �05 23 49.6 . . . 3.91 � 0.09 . . . . . .
155.................. . . . 351 . . . 05 35 19.6 �05 23 07.0 . . . . . . . . . 2.8 � 0.25
156.................. 622 133 193 05 35 19.67 �05 24 26.5 . . . 5.71 � 0.10 . . . . . .157.................. 624 492 648 05 35 19.84 �05 22 21.9 . . . 6.32 � 0.10 . . . . . .
158.................. 3075 346 450 05 35 20.31 �05 23 06.9 . . . . . . 7.57 � 0.3 . . .
159.................. 648a, b 277, 279 366A, B 05 35 20.45 �05 23 29.9 . . . 6.21 � 0.10 . . . . . .
160.................. 9266 308 398 05 35 20.48 �05 23 22.9 . . . 7.60 � 0.18 . . . . . .161.................. 652 141 208 05 35 20.56 �05 24 20.9 . . . 7.37 � 0.14 . . . . . .
162.................. 658 97 154 05 35 20.62 �05 24 46.1 . . . 5.78 � 0.17 . . . . . .
163.................. 660 590 777 05 35 20.74 �05 21 45.2 . . . 6.23 � 0.13 . . . . . .164.................. 661 560 737 05 35 20.80 �05 21 56.1 . . . 6.64 � 0.14 . . . . . .
165.................. 665 574 753 05 35 20.95 �05 21 51.5 . . . 6.02 � 0.12 . . . . . .
166.................. 669 217 300 05 35 21.02 �05 23 49.2 . . . 7.51 � 0.18 . . . . . .
167.................. . . . . . . . . . 05 35 21.33 �05 23 42.7 . . . 6.86 � 0.13 . . . . . .168.................. 687a, b 585, 255 769A, B 05 35 21.67 �05 21 48.1 . . . 5.86 � 0.13 . . . . . .
169.................. 694 249 332 05 35 21.78 �05 23 39.5 . . . 7.12 � 0.12 . . . . . .
170.................. 698 204 282 05 35 21.79 �05 23 53.8 . . . 7.57 � 0.21 . . . . . .
171.................. 9294 358 465 05 35 21.84 �05 23 06.9 . . . . . . 8.01 � 0.3 . . .172.................. . . . . . . . . . 05 35 21.94 �05 22 28.9 . . . 7.28 � 0.42 . . . . . .
173.................. 5179 121 182 05 35 22.10 �05 24 32.9 . . . 6.48 � 0.10 . . . . . .
174.................. 707 139 201 05 35 22.20 �05 24 25.0 . . . 6.71 � 0.11 . . . . . .
175.................. 710 155 224 05 35 22.32 �05 24 14.5 . . . 6.66 � 0.11 . . . . . .176.................. 721 233 319 05 35 22.54 �05 23 43.8 . . . . . . 7.90 � 0.3 . . .
177.................. 723 339 443 05 35 22.80 �05 23 13.8 . . . 5.82 � 0.09 . . . . . .
178.................. 1993 82 129A, B 05 35 22.90 �05 24 57.5 . . . 4.97 � 0.18 . . . . . .179.................. 744 262 347 05 35 23.78 �05 23 34.6 . . . . . . 6.28 � 0.3 . . .
180.................. 9317 460 601 05 35 24.41 �05 22 31.9 . . . . . . 6.41 � 0.3 . . .
181.................. 756 110 164 05 35 24.44 �05 24 41.0 . . . 5.50 � 0.21 . . . . . .
182.................. 762 119 176 05 35 24.70 �05 24 36.0 . . . 6.31 � 0.31 . . . . . .183.................. 766a, b 387 494A, B 05 35 25.07 �05 22 59.4 . . . . . . 6.01 � 0.3 . . .
Note.—Units of right ascension are hours, minutes, and seconds, and units of declination are degrees, arcminutes, and arcseconds.a Sources 84 and 87 are unresolved in the Q band.b From O’Dell & Wen (1994).c From Hayward et al. (1994).d The identification number 499 is used the list of Muench et al. (2002) for two different stars (both are binaries).
1541

correction was applied to each frame. In several cases, thenonuniformity of the background emission dominates the finalphotometric accuracy. For point sources, an error in the sky es-timate affects in a predictable way the results of multiaperturephotometry with curve of growth correction: an overestimateof the sky will cause the source to become fainter with the radiusand vice versa. We used this property to tune the local sky valueto obtain photometric results as much as possible indepen-dent of the aperture. Sometimes, however, the variations of thesky brightness underneath the source or the extended point-spread function (PSF) profile produced unstable results. In thesecases, we adopted a different strategy. Using the IDL procedureMIN_CURVE_SURF, we estimated the brightness distributionof the sky below the source using the minimum curvature sur-face fitting a sky annulus surrounding the star. The assumptionhere is that in the presence of strongly variable background, ahigher order interpolation provides a more reliable estimate ofthe sky distribution under the source. The subtraction of this‘‘sky’’ frame from the original one provides stellar images thatsit on a relatively flat background and therefore can be mea-sured with greater accuracy. Results obtained with this methodturned out to depend on the choice of the inner and outer radiiof the annulus, typically 5 and 8 pixels, respectively. Our finalresults were then obtained by averaging the results providedby a few different, but reasonable on the basis of visual inspec-tion, combinations of inner and outer radius. Their scatter hasalso been added in quadrature to the total uncertainty. In gen-eral, photometric measurements obtained with different methodscoincide within their errors, especially for the smaller apertures(100–1B5) and within the same run. The uncertainties we quote com-bine quadratically the uncertainties of the zero points (0.12 magat 7.7 �m, 0.06 mag at 8.7 �m, 0.07 mag at 9.6 �m, 0.06 magat 10.2 �m, 0.05 mag at 11.6 �m, 0.05 mag at 12.4 �m, and0.06 mag in the broad N band, and 0.11 mag in the Q band), thesource photon statistics and sky uniformity, and the scatter be-tween the best estimates obtained with different methods or be-tween different choices of radius/annulus, as explained.
All sources that had photometric measurements different be-tween the two runs by an amount comparable to or larger thanthe quoted 1 � error were double-checked. A direct comparisonwith nearby sources provides in several cases strong evidencefor source variability. For sources that are isolated or super-posed on a large and complex background (observed with dif-ferent chopping throws or orientation in the two runs), it is notpossible to safely discriminate between variability and unac-counted photometric errors. Whereas the main photometric cata-log has been obtained analyzing the single individual imagesbefore mosaicking and reconstruction, we have also examinedthe final reconstructed mosaics, both as a sanity check and tofind possible evidence of faint sources that may appear onlyafter all frames have been stacked together.
Concerning the overall sensitivity, the final signal-to-noiseratios of our reconstructed mosaics depend on a number offactors such as the integration time of each exposure, the num-ber of overlaying exposures contributing at each point, air mass,background brightness, chopping direction, and noise propa-gation in the reconstruction algorithm. Therefore, the sensi-tivity and completeness limits vary across the field in a complexway. To provide an indicative value of our sensitivity limit, weobserve that our catalog of 10 �m sources contains objectsdown to ½N � ’ 8 mag (see x 4.5). Since all stars brighter than½N � ’ 6:0 mag are well detected in all partial mosaics, we canassume 6.0 mag as our completeness limit at 10 �m, at leastin the central 20 ; 20 of our field. However, according to this
criterion, this value rises to ½N � ’ 5 in the immediate vicinity ofthe Trapezium, where the nebular emission becomes stronger.This is because six sources in the range ½N � ¼ 5:0 6:0 havebeen detected only with favorable chopping throw and are mea-sured only at one epoch. For the narrowband images, a recur-sive standard deviation algorithm with sigma clipping gives,over an empty sky area at the southeast corner of our images,the following values, scaled over 100 area: 13.1 mJy at 7.7 �m,4.3 mJy at 8.7 �m, 11.6 mJy at 9.6 �m, 6.8 mJy at 10.2 �m,7.5 mJy at 11.6 �m, and 9.7 mJy at 12.4 �m.
3. RESULTS
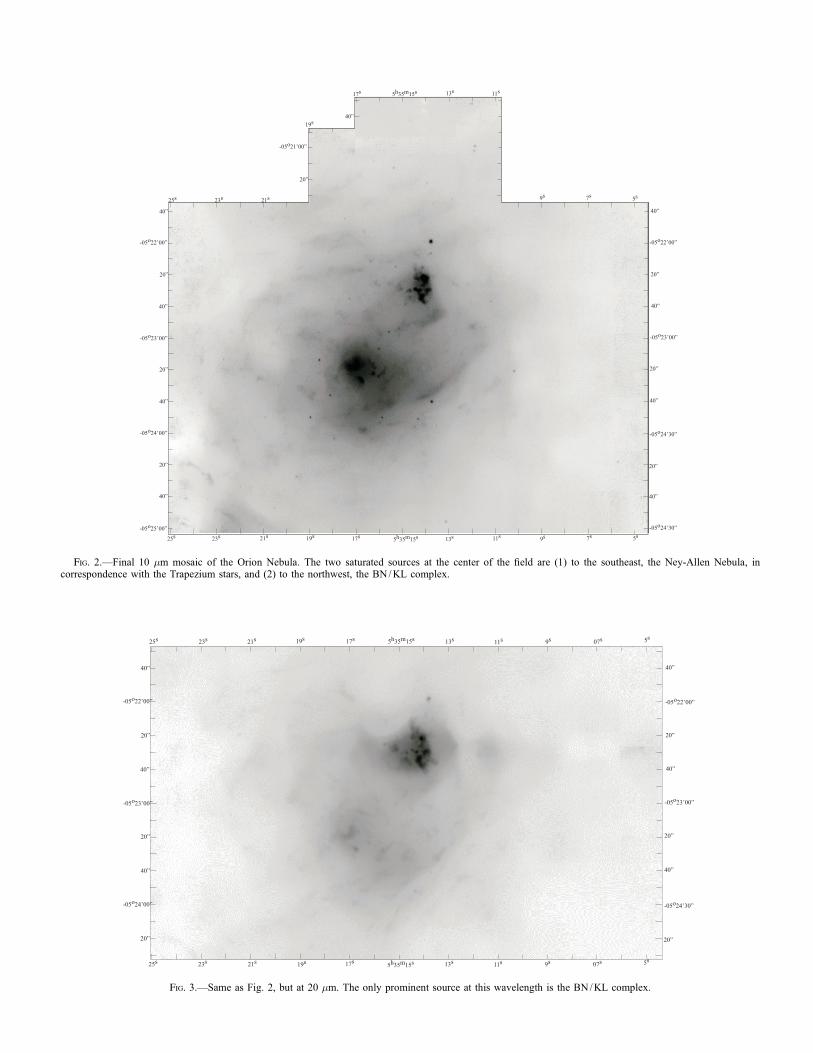
The final reconstructed images are shown in Figure 2 (10 �m)and Figure 3 (20 �m). The size of the final 10 �m mosaic is1144 pixels ; 1072 pixels, corresponding to approximately 5A0 ;4A7. However, since we were able to complete only the centralcolumns to their originally planned extent, the rectangular areafully imaged is smaller, i.e., 1144 pixels ; 800 pixels ¼ 5A0 ;3A5. The 20 �m image has a size of 1144 pixels ; 702 pixels,corresponding to approximately 5A0 ; 3A0.The morphology at 10 �m is clearly dominated by the BN/KL
complex and by the Ney-Allen Nebula, the two bright sourcesvisible at the center of the field (BN/KL to the north, Ney-Allento the south). Extended emission permeates the entire region,with a general decrease of surface brightness with increasingangular distance from the center. This intense, diffuse emissionis barely visible in the original, nonreconstructed images, sincethe chopping and nodding process filters low-frequency spatialcomponents. At 20 �m, the BN/KL complex dominates. Severalspatially resolved knots of diffuse emission are also visible atboth wavelengths. The ‘‘bright bar,’’ a PDR viewed edge-onapproximately 20 to the southwest of the Trapezium, is visibleat the bottom left corner of our 10 �m image, in the vicinity of�2 Ori A (source MAX 172). Several other filaments are visi-ble at 10 �m in the nebular background. Their lengths rangefrom �1000 to �10, and their surface brightness is comparable,with peaks in the range �0.1–0.2 Jy arcsec�2 at 10 �m. Inthe central region the peak brightness of the clumps and fila-ments rises to �0.7 Jy arcsec�2, in particular to the southwestand to the northwest of the Ney-Allen Nebula and to the southof BN/KL, in the vicinity of the OMC-1 South region (seex 4.4).The most remarkable new feature is represented by three,
possibly four, large arcs of mid-IR emission located approxi-mately 10 to the south of the Trapezium/Ney-Allen Nebula, atR:A:(J2000) ¼ 5h35m15s, decl:(J2000) ¼ �5�2401000 (Fig. 4).They point toward the Trapezium stars (see also Fig. 12 for asketch of their location inside the nebula) and appear brighteron the side facing the Trapezium. These structures are also visi-ble at shorter wavelengths, in particular in the Hubble SpaceTelescope (HST ) WFPC2 image of O’Dell &Wong (1996), andmost probably represent surfaces illuminated by grazing UVflux from the central stars.
3.1. The Trapezium Reggion
Our 10 and 20 �m images of the Trapezium region (Fig. 5)show, with improved sensitivity and spatial resolution, the gen-eral morphology first observed at 10 �m by McCaughrean &Gezari (1991) and studied in more detail by Hayward et al.(1994). The extended mid-IR emission discovered by Ney &Allen (1969) is resolved into a number of diffuse arclike struc-tures pointing toward �1 Ori C. The brightest one, correspond-ing to the brightness peak of the Ney-Allen Nebula, is centeredon the B0 V star �1 Ori D, undetected in our images. In the rest
ROBBERTO ET AL.1542
��� ��� ���������
�����
�
�
�����
��� ��� �� ��
������
�
�
������
�����
�
�
�����
�
�
�
��������������
���
���
�����
�
�
�����
�
�
�
�����
�
�
�� �� �������� ���
����������
Fig. 2.—Final 10 �m mosaic of the Orion Nebula. The two saturated sources at the center of the field are (1) to the southeast, the Ney-Allen Nebula, incorrespondence with the Trapezium stars, and (2) to the northwest, the BN/KL complex.
�����
�
�����
�
�
�����
�
�
�
�������������� ��� �� �� �������� ���
�������������� ��� �� �� �������� ���
������
�
�����
�
�
�
�����
�
�
���
���
Fig. 3.—Same as Fig. 2, but at 20 �m. The only prominent source at this wavelength is the BN/KL complex.

of this paper, we use the nameNey-Allen Nebula to indicate thisfeature only. Another five arcs encircle the sources LV 1–LV 5of Laques & Vidal (1979), the first photoionized disks observedin the vicinity of �1 Ori C.
All arcs are spatially resolved in our images and displaydifferent geometries and surface brightnesses. A most remark-able object lies in the immediate vicinity of �1 Ori C. This isthe circular knot at the center of Figure 5 (left) first identified asSC 3 by Hayward et al. (1994). �1 Ori C itself is also visible at10 �m, but not at 20 �m, as the fainter source ’1B8 to the eastof SC 3. All together, the arcs appear to trace the edge of a
cavity centered on �1 Ori C, filled with diffuse mid-IR emis-sion, and with surface brightness increasing to the northeast.The morphology at 20 �m is similar, but we do not detect thepeak that Hayward (1994) found 2000 to the southwest of theNey-Allen Nebula at wavelengths longer than 20 �m.
3.2. The BN/KL Complex
3.2.1. Morphologgy
In Figure 6 we show the 10 and 20 �m enlargements of theBN/KL complex from the data taken on 2000 December 18,
Fig. 4.—Arcs of mid-IR emission approximately 4500 south of the Trapezium (see Fig. 11 for their location). Left: Original image before image reconstruction.Right: Same field after image reconstruction and filtering. Scale is 4500 ; 4500, with standard orientation. The sources in the northwestern corner fall within the OMC-1South region (see Fig. 11).
Fig. 5.—Images of the Trapezium region at 10 �m (left) and at 20 �m (right). �1 Ori C and SC 3 are the two circular sources at the center of the 10 �m image, with�1 Ori C being the fainter one to the left. Field size is 10 ; 10, and north is up and east is to the left.
ROBBERTO ET AL.1544 Vol. 129

whereas in Figure 7 the same region is shown in the six nar-rowband silicate filters. All images are absolutely calibratedand presented in logarithmic scale to enhance the faintest emis-sion across the field.
A few artifacts are present, generally related to the extraor-dinary brightness of the BN peak: in the broad N-band image(Fig. 6, left) there are two ghost images of BN, approximately at(4B5, �0B5) and (0B5, 6B0), caused by inner reflections in thecamera optics (see also Fig. 8, left). Bandwidth limitations of thereadout electronics create in all narrowband images an anom-alous ‘‘spike,’’ approximately 4 pixels wide, protruding to thewest of BN. Some extra noise is also visible in the highlystretched N- and Q-band images as a horizontal periodic pat-tern and in the vertical direction in the rows and columns cor-responding to the BN peak. In general, however, the imageshave excellent quality and are diffraction-limited at all wave-lengths (k=D on UKIRT ranges from 0B41 at 7.7 �m to 0B67 at12.4 �m and 1B08 at 19.9 �m). Because of the high surfacebrightness of the region, it is not easy to see the spectaculardiffraction pattern of BN, with the exception of the first ringshown saturated in all images except the Q band. Several dif-fraction rings appear in the differential images that we willpresent in x 4.3. To preserve the highest resolution, consider-ing also that we are mostly dealing with the surface brightnessof extended objects, we have not rebinned or convolved ourimages to our lowest resolution. In Figure 9 we show a colorcomposite image of the BN/KL complex obtained combin-ing our 7.7 �m (blue), 12.4 �m (green), and 19.9 �m (red )images.
Early mid-IR studies (Becklin & Neugebauer 1967; Riekeet al. 1973) resolved this region into eight sources (IRc1–IRc8;BN corresponding to IRc1). Another 10 compact sources wereadded by Gezari et al. (1998) to the IRc list, and recentlyShuping et al. (2004) added five more. Our images have res-olution and sensitivity comparable to those of Greenhill et al.(2004) and Shuping et al. (2004) but cover the entire field ineight bands. Our narrowband 12.4 �m image (Fig. 7, bottom
right), in particular, is comparable to Figure 1 of Shuping et al.(2004) and Figure 2 of Greenhill et al. (2004). We detect newfeatures, especially in the unexplored outer regions of the com-plex. Like the large majority of compact sources already cata-loged, all new features appear extended and resolved into clumps,ridges, and arclike structures down to our �0B5 resolution limit.Instead of adding new entries to the already long list of IRcsources, we indicate the new sources using their offset (�R.A.00,�decl.00) relative to BN. For the 30 IRc sources and subcom-ponents already classified, we still use the list of Shuping et al.(2004). The position of the most relevant sources is indicated inFigure 8.
BN, the main luminosity peak longward of 2 �m, remainsunresolved at all wavelengths. Gaussian fits to the imageprofile at 10 �m show a ’3.2 pixel FWHM both in right as-cension and declination, corresponding to FWHM ’ 0B87. Foran IR source with a spectrum increasing with wavelength, likeBN, the diffraction limit in broadband filters is approximatelyset by the longest wavelength passing through the filter, kmax ’13 �m in our case. For an effective telescope diameter D ¼3:7 m, it is k=D ¼ 0B72. The pixel sampling and the mosaick-ing process, performed by integer pixels, add another ’1
2pixel
of image blur, bringing the FWHM right to the measured value.The BN peak sits on top of an extended clumpy plateau. Shu-ping et al. (2004) have already identified the remarkable south-west arc, and we just add to the list a compact source immediatelyto the south at (�200, 200).
Source n of Lonsdale et al. (1982), coincident with a bipolarradio source resolved by Menten & Reid (1995; their source‘‘L’’), has been recently analyzed in detail by Greenhill et al.(2004) and Shuping et al. (2004). Using LWS on Keck, bothteams find that source n is extended, with a FWHM of ap-proximately (0B75 ; 0B50) � 0B10 and major axis oriented at’120
�. Our pixel scale, approximately 3 times larger than that
of LWS, does not sample adequately the core of the diffrac-tion figure at 7.7 �m. A two-dimensional Gaussian fit at thiswavelength gives for source n a FWHM of (0B47 ; 0B51), but it
Fig. 6.—Images of the BN/KL complex at 10 �m (left) and 20 �m (right). The scale is logarithmic and ranges between 0.1 and 10 Jy arcsec�2 at 10 �m andbetween 3 and 300 Jy arcsec�2 at 20 �m.
ORION NEBULA IN MID-INFRARED 1545No. 3, 2005

must be remarked that the Airy function is poorly reproducedby a Gaussian curve. If we use the BN peak as a reference forthe PSF core and compare horizontal and vertical cuts acrossboth sources, then source n remains unresolved at all wave-lengths in our images.
Two other sources, IRc12 and IRc7, appear pointlike at 7.7 �mbut become extended at longer wavelengths. Sources IRc11 andIRc6, on the other hand, show compact cores at 12.4 �m. Thepoint source MAX 69 (see x 3.4) is clearly visible at (1100,�6B5),’2000 southeast of BN. This is a well-known double star which
Fig. 7.—Images of the BN/KL complex at 7.7 and 8.7 �m (top), 9.6 and 10.2 �m (middle), and 11.6 and 12.4 �m (bottom). All images are shown in logarithmicscale, and units are janskys per square arcsecond. To facilitate the comparison, all contours are plotted at the same levels of 0.1, 0.25, 0.50, 0.75, 1, 2.5, 5, 7.5, and10 Jy arcsec�2. Equatorial coordinates are relative to the peak of the BN source (see x 2.2.2).
ROBBERTO ET AL.1546 Vol. 129

remains unresolved in our images and most probably lies in theforeground of the BN/KL complex.
Diffuse emission becomes brighter to the southeast withlonger wavelengths. At 7.7 �m, sources IRc2, IRc4, and IRc5appear aligned in the northeast-southwest direction and abruptlytruncated to the southeast, but at longer wavelengths this sharpedge, especially for IRc4, becomes less prominent and a broadplateau of emission rises around IRc8 and IRc22. At 19.9 �m,extended emission fills the entire field and two dark lanes be-come clearly visible, one oriented north-south along a line roughlypassing through positions (800, 000) and (300,�1800), and the other,almost perpendicular, immediately to the south of the ‘‘equato-
rial belt’’ composed of IRc14, 12, 11, 2, and 7. These darklanes are coincident with the ammonia emission of Wilson et al.(2000), which traces the density distribution of the Orion hotcore (see Greenhill et al. 2004). Another remarkable feature isthe peculiar ‘‘eastern ring’’ of sources centered at (1000,�400) andtraced by IRc16, 15, 6E, 21, 2, 11, 12, 14, and 13, plus other faintemission around (1200, �200). The area inside the ring is mostlyfaint clumpy emission and contains the majority of the H2Omasers detected by Johnston et al. (1989) in OMC-1. The simi-lar shape of the prominent IRc3 and IRc4 sources is also notice-able; both are arclike and point to the IRc2 region. The tails oftheir arcs are part of another remarkable new feature , a groupof equally spaced knots tracing an arclike ‘‘necklace’’ betweenIRc5 and IRc3. The knots have all comparable brightness, areelongated and radially oriented, and point to the IRc2 centralregion.
Finally, IRc2 is well resolved at 10 �m (Fig. 6, left) and showsa morphology that matches the structure of sources IRc2-Ato IRc2-D resolved by Chelli et al. (1984) and Dougados et al.(1993) at shorter wavelengths. Itsmorphology has been discussedin detail by Greenhill et al. (2004) and Shuping et al. (2004).Wewill return to this object in x 4.3.
3.2.2. Photometry
In Table 4, we present the photometric data at 35 positionswithin the BN/KL complex. The first 30 are the sources listedin Table 1 of Greenhill et al. (2004), and the last five are thethree brightest knots to the southwest of IRc4 (knots 1–3), thecompact source south of the southwest arc (BN SW), andthe star MAX 69. Photometry has been obtained using a cir-cular aperture of 1B128 diameter, corresponding to 2 arcsec2
area, but the fluxes are normalized to janskys per square arc-second. The only exception is the BN peak, for which we givethe total flux within a synthetic aperture of 5B2. All values areuncorrected for the background emission, and the zero-pointerrors listed in x 2.2.3 represent the main source of uncertainty.The corresponding spectra are shown in Figure 10. The sili-cate absorption feature is prominent at all positions except for
Fig. 8.—Contour plot of the BN/KL complex at 10 �m (left) and 20 �m (right), with labels indicating the main features discussed in the text. Contour levels are0.22, 0.30, 0.37, 0.45, 0.60, 0.80, 1.0, 1.2, 1.35, 1.5, 1.87, 2.25, 3.0, 4.5, 6.0, 10, 15, 30, 60, 100, 150, and 200 Jy arcsec�2 at 10 �m and 7, 10, 12, 14, 16, 18, 20, 25,30, 35, 40, 50, 60, 80, 100, 120, 140, 160, 180, and 200 Jy arcsec�2 at 20 �m.
Fig. 9.—Color composite image of the BN /KL region obtained combiningthe 7.7 �m (blue), 12.4 �m (green), and 19.9 �m (red ) images.
ORION NEBULA IN MID-INFRARED 1547No. 3, 2005

the very last object, MAX 69, which is probably a foregroundmember of the Trapezium cluster. A secondary maximum atthe center of the absorption feature is also generally present,with the exception of the main BN peak and its immediatesurroundings. This emission feature sits at the center of thetelluric ozone absorption band and, especially at the lowestsignal levels, may be hard to detect in less than excellentweather conditions. Having carefully checked our absolutecalibration and verified that our photometry for the main BNpeak agrees with the previously published spectrophotomet-ric data (see x 4.3), we believe that this emission feature isreal.
3.3. OMC-1 South
The OMC-1 South region, located ’10000 south of the BN/KL complex, is characterized by intense outflow activity prob-ably generated by deeply embedded sources (O’Dell 2001a). InFigure 11, we show the position of the point sources found atshorter wavelengths together with the contours of the high-velocity outflow of Rodrıguez-Franco et al. (1999b). Part ofthe field is also visible in Figure 4. The Lada et al. (2000) list ofcandidate protostellar sources contains five objects in this area,TPSC 1, 2, 16, 48, and 78. Three of them, namely, TPSC 1, 2,
and 78, are the sources with the reddest K � L color of theentire L-band survey: the first two, undetected in the K band byLada et al. (2000), have lower limits at ½K � L� > 6:09 magand ½K � L� > 4:90 mag, respectively, whereas TPSC 78 has½K � L� ¼ 4:85 mag. TPSC 1 is nearly coincident with oursource, MAX 61, that shows significant variability at 10 �m,with ½N � ¼ 4:40 mag in 1998 November and ½N � ¼ 3:68 magin 2000 December (see x 4.5.1). Object TPSC 2 is MAX 64,and with ½N � ’ 5:3 mag it also shows a conspicuous L� N ’3:8 mag color index.
3.4. Point Sources
In Figure 12, we map the location of the 177 point sourcesdetected at 10 and 20 �m. In Table 3, we present their cross-identification, location, and 10 �m photometry. In particular,we list their sequential running number (col. [1]) and their en-try number in the catalogs of Hillenbrand (1997), Hillenbrand& Carpenter (2000), and Muench et al. (2002) (cols. [2]–[4]),all at shorter wavelengths; coordinates (cols. [5] and [6]) arederived from our final mosaic with typical accuracy ’0B5,accurate enough to unambiguously identify each source. In afew cases, residual pointing errors at the edges of the mosaiccause larger discrepancies, listed in the last column (col. [11]).
TABLE 4
Peak Surface Brightness of the BN /KL Complex
Narrowband Broadband
Source Name Offset R.A. Offset Decl. 7.7 �m 8.7 �m 9.8 �m 10.2 �m 11.2 �m 12.4 �m N Band Q Band
BN............................ 0.0 0.0 122.30 106.11 62.59 57.21 126.80 143.19 119.58 171.34
BN SW arc............... �1.4 �0.6 9.82 11.35 7.22 10.31 16.29 20.78 8.65 59.76
IR n .......................... 3.3 �9.8 2.11 1.06 1.62 1.22 3.23 7.14 2.12 31.53
IRc2 A+B................. 5.7 �7.0 15.21 1.07 1.38 0.89 5.62 20.24 3.52 34.07
IRc2 C...................... 4.6 �7.8 7.98 0.73 1.50 0.95 4.67 14.94 2.77 36.67
IRc2 D...................... 4.8 �7.0 10.37 1.58 1.59 1.14 6.67 19.64 3.85 41.70
IRc2 E ...................... 4.5 �6.3 4.55 1.08 1.02 0.86 3.96 10.17 1.86 28.45
IRc3 N...................... �1.6 �7.2 0.62 0.44 2.32 1.64 4.02 7.75 1.94 66.69
IRc3 S ...................... �1.4 �7.9 0.69 0.43 2.71 1.75 4.32 8.81 2.23 74.34
IRc4.......................... 1.1 �11.1 1.63 0.83 3.58 2.72 10.13 20.15 4.76 101.36
IRc5.......................... 0.5 �14.5 0.56 0.30 2.08 1.30 3.45 7.56 1.73 59.99
IRc6.......................... 0.4 �4.5 0.91 0.42 2.13 1.40 3.92 7.74 2.11 54.24
IRc6 N...................... �0.2 �3.2 0.89 0.61 2.30 1.64 3.58 5.97 1.99 52.92
IRc6 E ...................... 1.8 �4.8 0.75 0.24 1.43 0.96 2.81 6.13 1.52 38.26
IRc7.......................... 2.8 �7.8 4.29 1.21 2.84 1.89 8.86 23.88 4.93 73.93
IRc8.......................... 8.4 �12.2 0.13 0.07 1.02 0.63 1.07 2.04 0.58 28.24
IRc11........................ 8.5 �7.4 1.38 0.32 0.89 0.64 1.90 5.28 1.19 20.76
IRc12........................ 9.9 �7.9 1.58 0.22 0.72 0.51 1.45 3.64 0.85 16.94
IRc13........................ 14.1 �4.8 0.14 0.06 0.56 0.35 0.55 1.14 0.29 14.37
IRc14........................ 13.8 �6.7 0.18 0.09 0.78 0.49 0.96 1.87 0.52 19.42
IRc15........................ 3.1 �2.3 0.45 0.23 1.30 0.87 1.91 3.46 1.15 33.98
IRc16 N.................... 4.9 1.3 0.71 0.24 1.17 0.81 1.83 3.09 0.99 30.66
IRc16 S .................... 5.0 �0.3 0.51 0.18 1.17 0.77 1.77 3.26 1.37 31.12
IRc16 W................... 4.0 0.2 0.47 0.23 1.20 0.83 1.61 2.73 1.58 30.73
IRc17........................ 3.0 2.3 0.42 0.26 1.17 0.77 1.35 2.08 0.69 28.38
IRc19........................ 5.2 4.7 0.74 0.24 0.68 0.44 0.97 1.37 0.56 16.06
IRc20........................ 0.7 �6.9 0.74 0.31 1.36 0.90 2.22 5.17 1.10 37.28
IRc21........................ 4.4 �5.0 0.84 0.19 0.64 0.46 1.29 3.21 0.67 16.82
IRc22........................ 6.4 �11.3 0.23 0.08 0.72 0.46 0.76 1.83 0.50 17.30
IRc23........................ 6.3 2.2 0.38 0.12 0.56 0.35 0.84 1.59 0.45 15.81
Knot 1 ...................... �4.2 �10.4 0.17 0.07 0.96 0.53 0.82 1.68 0.42 25.13
Knot 2 ...................... �3.9 �12.7 0.21 0.08 0.82 0.48 0.66 1.53 0.38 23.44
Knot 3 ...................... �2.6 �14.6 0.25 0.10 0.95 0.54 0.81 1.80 0.45 25.70
BN SW..................... �2.0 �2.0 1.21 0.88 1.90 1.54 3.12 5.05 1.90 36.66
MAX 69................... 11.4 �16.6 0.13 0.15 0.65 0.42 0.40 0.48 0.38 11.17
ROBBERTO ET AL.1548 Vol. 129

The magnitudes are given for the two epochs (cols. [7] and[8]). For a few sources, we could derive photometry only in thefinal mosaic (column [9]). For 22 sources, there is no coun-terpart identified at shorter wavelengths. Those without coun-terparts can therefore be regarded as deeply embedded objects.
A few of them, however, are close to our sensitivity limits andappear only on the final mosaic. As explained in x 2.2.1, wecannot rule out in these cases the possibility that they are ar-tifacts of our data reconstruction algorithm. Further observa-tions are needed to confirm them as real sources.
Fig. 10.—Mid-IR spectral energy distribution for the 35 sources of Table 4. Errors refer to the typical zero-point error of our absolute calibration. The horizontalbar indicates the broadband N filter.
ORION NEBULA IN MID-INFRARED 1549No. 3, 2005

4. DISCUSSION
4.1. Diffuse Emission
With the exception of the bright BN/KL complex and theNey-Allen Nebula, the morphology of the Orion Nebula in themid-IR is more similar to the radio continuum and dereddenedline images obtained by O’Dell & Yusef-Zadeh (2000) than theoptical or near-IR images.This is because the foreground ‘‘veil’’ of neutral material
immediately in front of the nebula, which affects the mor-phology of the nebula in the visible, becomes optically thin atmid-IR (and radio) wavelengths, whereas the stellar emission,prominent at shorter wavelengths, becomes fainter. For thisreason, the ‘‘dark bay,’’ a region of high optical depth (AV � 3),approximately parabolic in shape, that is protruding from the eastof the nebula up to �3000 east of the Trapezium, is essentiallyinvisible in our images, confirming its nature as an enhancementof dust column density within the foreground neutral lid (O’Dell& Yusef-Zadeh 2000).The filamentary structures seen in emission at 10 �m appear
to be associated with the extinction-corrected color images ofO’Dell & Yusef-Zadeh (2000). In particular, the ‘‘east brightbar’’ and ‘‘E-W bright bar’’ shown in Figure 5 of O’Dell &Yusef-Zadeh (2000) have 10 �m counterparts. On the otherhand, their ‘‘north bright bar,’’ which is close to the top edge ofour 10 �m field, remains undetected, as well as the comet-like
���
���������
��
������
� �������������
��������
����������� �����
������
������
�������
������
���������
����
!��
!�
!��
!
!�"
!�
#���
#����
#���
#���$
#���#���
#��$#���
#�"$
#����
#����
#��
#�$�
#���"
#���� #���������"$
!�� !�
!�"
���
����
����
%%����
����
���"
Fig. 11.—Map of the sources located in the OMC-1 South region, togetherwith the intensity contours of the CO outflow mapped by Rodrıguez-Francoet al. (1999b). The naming conventions are: (1) MAX sources: this paper,(2) TPSC sources: Lada et al. (2000), (3) HC sources: Hillenbrand & Carpenter(2000), (4) 134-411 (et similia) and OOS sources: Zapata et al. (2004), and(5) FIR 4: Rodrıguez-Franco et al. (1999a).
Fig. 12.—Location of our mid-IR point sources. Thin open circles: 10 �m sources with counterparts at shorter wavelengths. Thick open circles: 10 �m sourcesdetected at 10 �m and not at shorter wavelengths. Filled circles: Sources detected only at 20 �m. Small circles: A subset of the near-IR sources that remainedundetected at 10 �m, presented here for reference and for ease of comparison with near-IR images. Thin solid lines trace the main filamentary structures and the arcsdiscussed in x 4. �1 Ori C is source 111; � 2 Ori A is source 178.
ROBBERTO ET AL.1550 Vol. 129

structure approximately 10 to the east of the Trapezium, butthey are clearly visible on the L-band images of both Lada et al.(2000) and McCaughrean et al. (1996). Most of the 10 �mfilaments appear aligned along arcs roughly centered on theTrapezium. This result suggests that the filaments trace theedges of the main H ii cavity rather than, e.g., shocks producedby collimated outflows. The morphological similarity betweenthe filaments and the bars seen in the radio and in extinction-corrected line images indicates that they are also associatedwith the folds in the ionization front seen edge-on. Mostprobably, the 10 �m emission is dominated by PAH emissionin the PDR. Sloan et al. (1996) have shown that the 11.3 �mPAH feature, produced by the aromatic C�H bonds when agrain is transiently heated through the absorption of a UVphoton, dominates the mid-IR spectrum of the Orion bar.
Similarly, the great arcs visible at 10 �m approximately 4500
south of the Trapezium (Fig. 4) may result from the advanceof the ionization front between the dense and clumpy mediumof the surrounding molecular cloud.
4.2. The Trapezium Reggion
The complex arclike morphology of the mid-IR emissionin the vicinity of �1 Ori C (Fig. 5) has clear optical counter-parts in recombination lines, first detected by McCulloughet al. (1995). Using [O iii] and H� line images taken with theHST, Bally et al. (1998) found that similar arcs are presentaround many proplyds within 3000 from �1 Ori C. Bally et al.(2000) also found arcs in the outskirts of the Orion Nebula,especially in the LL Ori region (which remains outside of ourimaged field). Hayward et al. (1994) first suggested the arcsare the bow shocks produced by the interaction of the fast(’500 km s�1) wind from �1 Ori C with the slow (’10–50 kms�1) photoevaporated flows emerging from the ionization frontat the proplyd surfaces. This interpretation is supported byproper-motion (Bally et al. 2000) and spectroscopic (Henneyet al. 2002)measurements, showing that these are stationary struc-tures. The wind-wind interaction originating the arcs has beenstudied analytically by several authors (e.g., Canto et al. 1996and references therein) and numerically by Garcıa-Arredondoet al. (2001). There are in fact two basic configurations: theinteraction of two spherical winds, of interest in our case, andthe interaction of a spherical wind with a plane-parallel flow.The latter is probably the case in the outskirts of the OrionNebula, where the wind-wind interaction is occurring betweenT Tauri winds and the plasma flowing from the main ionizationfront (Bally et al. 2000).
The analytical analysis of Canto et al. (1996), which leadsto an exact solution of the wind-wind interaction within the‘‘thin shell’’ approximation, provides an approximate solutionthat can be easily compared with observations. The ratio of thewind momenta,
� ¼ M1v1
M2v2; ð1Þ
where M and v are, respectively, the mass-loss rate and theterminal velocity of the two winds (represented by subscripts),governs both the location of the stagnation point and the shapeof the arcs. The ratio between the distance from the stagnationpoint to the source inside the arc, R0, and the separation of thetwo outflow sources, D, is given by
R0
D¼ �1=2
1þ �1=2: ð2Þ
The shape of the bow shock is characterized by the asymptoticangle of the tail, �1, given by
�1� tan �1 ¼ �
1� �: ð3Þ
If the bow shock axis is tilted with respect to the line of sightby an angle �i , the projection effect increases both the apparentR0=D ratio and the apparent asymptotic angle. For large tilt an-gles, the entire back side of the bow shock becomes visible andthe characteristic arclike geometry disappears. In these cases, thebow shock will look like a diffuse source in the vicinity of thecentral star.
Whereas the ratio R0=D can be easily obtained from the data,it is difficult to estimate the asymptotic angle, since the sur-face brightness of the arcs decreases in the tail region. For thisreason, we characterize the shape of the bow shock through theapparent distance, R90, between the central star and the arc at90� elongation from the direction of �1 Ori C. It turns out thatdifferent combinations of � and �i generate morphologies withratios R0=D and R90=D that vary within a relatively narrowrange. This variation is shown in Figure 13, where we haveplotted the combinations obtained for different values of � and�i. The bow shock morphology, limited to the cases with � ¼0:1, 0.04, and 0.004 and �i ¼ 30�, is also shown to visualizethe change of shape along the region.
In Figure 13, we also plot the values of R0=D and R90=Dmeasured for the Ney-Allen Nebula and the five LVarcs. In thecase of LV 1, LV 4, and possibly LV 5, the parameters arecompatible with the thin shell model. However, in the otherthree cases, namely, LV 2, LV 3, and the Ney-Allen Nebula,there is a clear disagreement. In correspondence to the ob-served values of R0=D, the values of R90=D should be muchlarger, because if the two winds carry a similar momentum(� ’ 1) and the stagnation point moves closer to �1 Ori C, thebow shock is expected to become more and more open. In-stead, the three arcs with stagnation points closer to �1 Ori Cshow a roughly circular shape, with R0 ’ R90.
The intrinsic limitations of the algebraic solution of Cantoet al. (1996) based on the thin shell approximation cannot ex-plain this anomaly. Garcıa-Arredondo et al. (2001) have shownthat, despite the simplifying assumption of stationary flow andmomentum conservation, the analytic treatment nicely matchestheir detailed hydrodynamic simulation. A possible explanationfor the disagreement may better be provided by the detailedmorphology of the arcs. The LV 3 arc, in particular, is clearlyasymmetric with respect to the direction to �1 Ori C. It becomesnarrower and brighter to the south in the direction of SC 3, witha secondary maximum evident to the northeast at ’90� fromthe �1 Ori C direction. The asymmetry indicates that otherdynamical effects not accounted for by the standard models aretaking place. A relative motion of LV 3 relative to �1 Ori Cwould break the cylindrical symmetry assumed by simple wind-wind models. A rather modest proper motion, on the order of afew kilometers per second, would be enough to add a significanttangential component to the speed of the photoevaporated flow,which is on the order of the sound speed in a typical ionized gas,cs ’ 10 km s�1. Other dynamical effects such as the interactionwith the collimated mass outflows produced by the central LVstars may also locally affect the morphology and surface bright-ness of the arcs, leading to inaccurate estimates of the openingangle.
The bright arcs of the Ney-Allen Nebula are peculiar alsofrom another point of view. Let us compare the six brightness
ORION NEBULA IN MID-INFRARED 1551No. 3, 2005
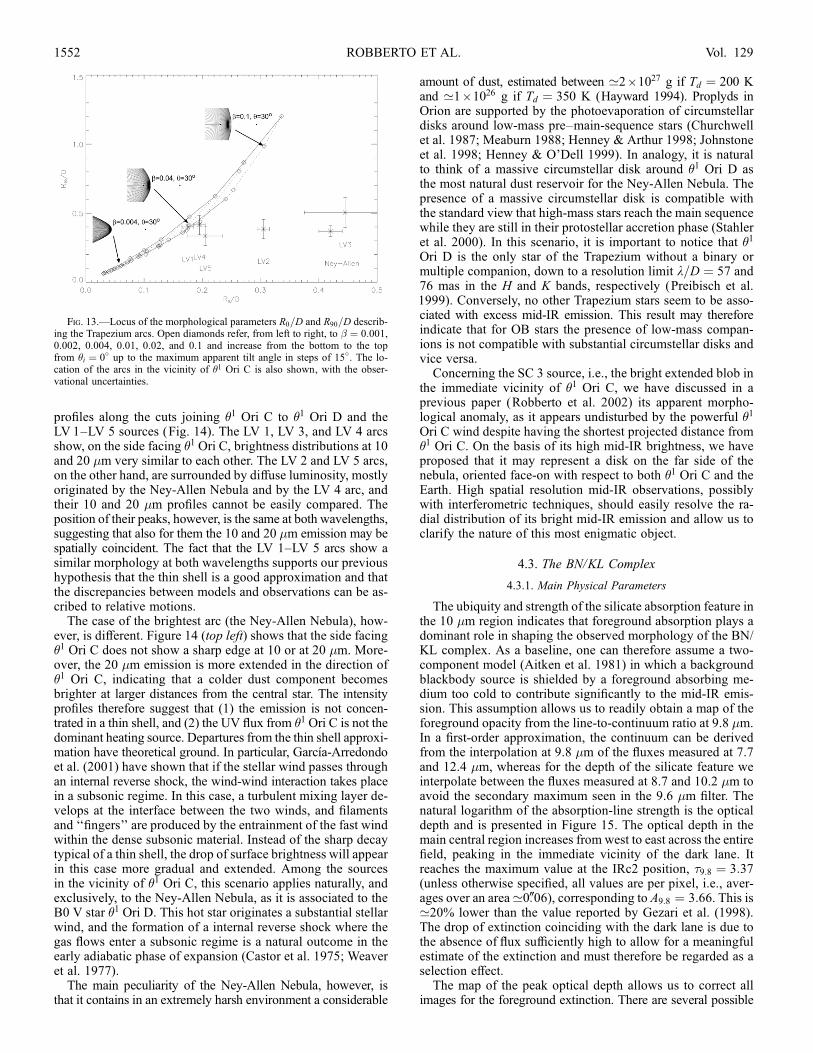
profiles along the cuts joining �1 Ori C to �1 Ori D and theLV 1–LV 5 sources (Fig. 14). The LV 1, LV 3, and LV 4 arcsshow, on the side facing �1 Ori C, brightness distributions at 10and 20 �m very similar to each other. The LV 2 and LV 5 arcs,on the other hand, are surrounded by diffuse luminosity, mostlyoriginated by the Ney-Allen Nebula and by the LV 4 arc, andtheir 10 and 20 �m profiles cannot be easily compared. Theposition of their peaks, however, is the same at both wavelengths,suggesting that also for them the 10 and 20 �m emission may bespatially coincident. The fact that the LV 1–LV 5 arcs show asimilar morphology at both wavelengths supports our previoushypothesis that the thin shell is a good approximation and thatthe discrepancies between models and observations can be as-cribed to relative motions.
The case of the brightest arc (the Ney-Allen Nebula), how-ever, is different. Figure 14 (top left) shows that the side facing�1 Ori C does not show a sharp edge at 10 or at 20 �m. More-over, the 20 �m emission is more extended in the direction of�1 Ori C, indicating that a colder dust component becomesbrighter at larger distances from the central star. The intensityprofiles therefore suggest that (1) the emission is not concen-trated in a thin shell, and (2) the UV flux from �1 Ori C is not thedominant heating source. Departures from the thin shell approxi-mation have theoretical ground. In particular, Garcıa-Arredondoet al. (2001) have shown that if the stellar wind passes throughan internal reverse shock, the wind-wind interaction takes placein a subsonic regime. In this case, a turbulent mixing layer de-velops at the interface between the two winds, and filamentsand ‘‘fingers’’ are produced by the entrainment of the fast windwithin the dense subsonic material. Instead of the sharp decaytypical of a thin shell, the drop of surface brightness will appearin this case more gradual and extended. Among the sourcesin the vicinity of �1 Ori C, this scenario applies naturally, andexclusively, to the Ney-Allen Nebula, as it is associated to theB0 V star �1 Ori D. This hot star originates a substantial stellarwind, and the formation of a internal reverse shock where thegas flows enter a subsonic regime is a natural outcome in theearly adiabatic phase of expansion (Castor et al. 1975; Weaveret al. 1977).
The main peculiarity of the Ney-Allen Nebula, however, isthat it contains in an extremely harsh environment a considerable
amount of dust, estimated between ’2 ; 1027 g if Td ¼ 200 Kand ’1 ; 1026 g if Td ¼ 350 K (Hayward 1994). Proplyds inOrion are supported by the photoevaporation of circumstellardisks around low-mass pre–main-sequence stars (Churchwellet al. 1987; Meaburn 1988; Henney & Arthur 1998; Johnstoneet al. 1998; Henney & O’Dell 1999). In analogy, it is naturalto think of a massive circumstellar disk around �1 Ori D asthe most natural dust reservoir for the Ney-Allen Nebula. Thepresence of a massive circumstellar disk is compatible withthe standard view that high-mass stars reach the main sequencewhile they are still in their protostellar accretion phase (Stahleret al. 2000). In this scenario, it is important to notice that �1
Ori D is the only star of the Trapezium without a binary ormultiple companion, down to a resolution limit k=D ¼ 57 and76 mas in the H and K bands, respectively (Preibisch et al.1999). Conversely, no other Trapezium stars seem to be asso-ciated with excess mid-IR emission. This result may thereforeindicate that for OB stars the presence of low-mass compan-ions is not compatible with substantial circumstellar disks andvice versa.Concerning the SC 3 source, i.e., the bright extended blob in
the immediate vicinity of �1 Ori C, we have discussed in aprevious paper (Robberto et al. 2002) its apparent morpho-logical anomaly, as it appears undisturbed by the powerful �1
Ori C wind despite having the shortest projected distance from�1 Ori C. On the basis of its high mid-IR brightness, we haveproposed that it may represent a disk on the far side of thenebula, oriented face-on with respect to both �1 Ori C and theEarth. High spatial resolution mid-IR observations, possiblywith interferometric techniques, should easily resolve the ra-dial distribution of its bright mid-IR emission and allow us toclarify the nature of this most enigmatic object.
4.3. The BN/KL Complex
4.3.1. Main Physical Parameters
The ubiquity and strength of the silicate absorption feature inthe 10 �m region indicates that foreground absorption plays adominant role in shaping the observed morphology of the BN/KL complex. As a baseline, one can therefore assume a two-component model (Aitken et al. 1981) in which a backgroundblackbody source is shielded by a foreground absorbing me-dium too cold to contribute significantly to the mid-IR emis-sion. This assumption allows us to readily obtain a map of theforeground opacity from the line-to-continuum ratio at 9.8 �m.In a first-order approximation, the continuum can be derivedfrom the interpolation at 9.8 �m of the fluxes measured at 7.7and 12.4 �m, whereas for the depth of the silicate feature weinterpolate between the fluxes measured at 8.7 and 10.2 �m toavoid the secondary maximum seen in the 9.6 �m filter. Thenatural logarithm of the absorption-line strength is the opticaldepth and is presented in Figure 15. The optical depth in themain central region increases from west to east across the entirefield, peaking in the immediate vicinity of the dark lane. Itreaches the maximum value at the IRc2 position, �9:8 ¼ 3:37(unless otherwise specified, all values are per pixel, i.e., aver-ages over an area’0B06), corresponding to A9:8 ¼ 3:66. This is’20% lower than the value reported by Gezari et al. (1998).The drop of extinction coinciding with the dark lane is due tothe absence of flux sufficiently high to allow for a meaningfulestimate of the extinction and must therefore be regarded as aselection effect.The map of the peak optical depth allows us to correct all
images for the foreground extinction. There are several possible
Fig. 13.—Locus of the morphological parameters R0=D and R90=D describ-ing the Trapezium arcs. Open diamonds refer, from left to right, to � ¼ 0:001,0.002, 0.004, 0.01, 0.02, and 0.1 and increase from the bottom to the topfrom �i ¼ 0� up to the maximum apparent tilt angle in steps of 15�. The lo-cation of the arcs in the vicinity of �1 Ori C is also shown, with the obser-vational uncertainties.
ROBBERTO ET AL.1552 Vol. 129
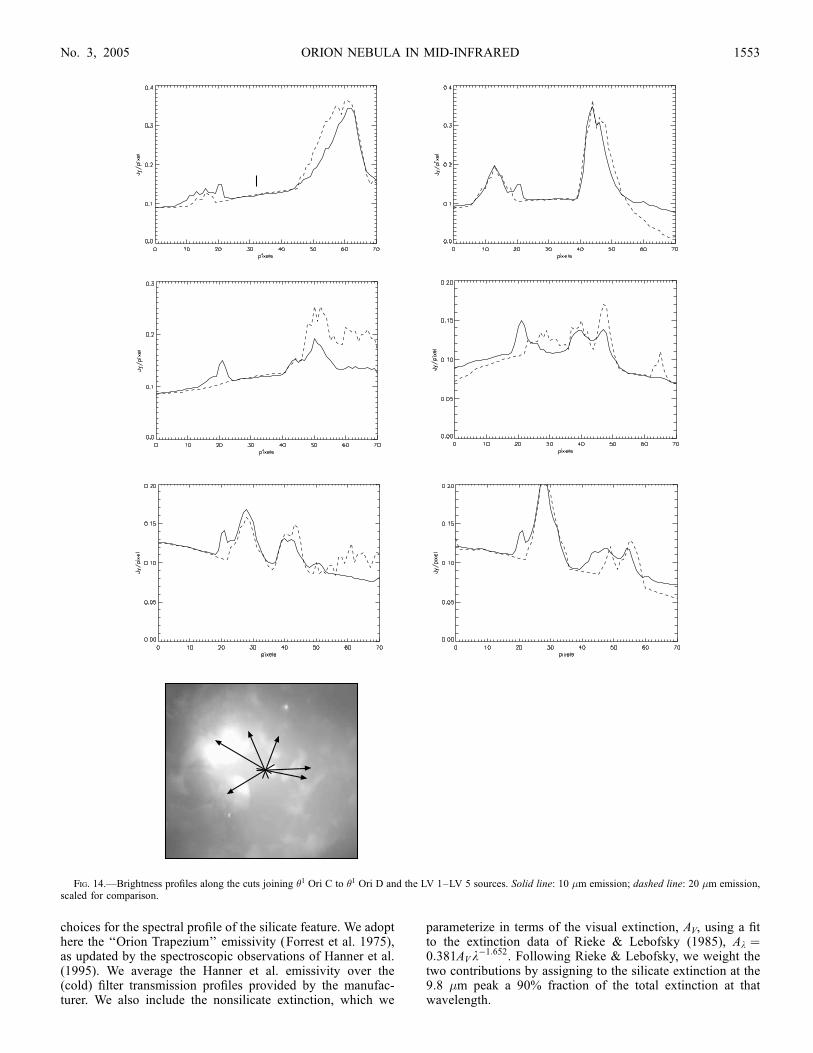
choices for the spectral profile of the silicate feature. We adopthere the ‘‘Orion Trapezium’’ emissivity (Forrest et al. 1975),as updated by the spectroscopic observations of Hanner et al.(1995). We average the Hanner et al. emissivity over the(cold) filter transmission profiles provided by the manufac-turer. We also include the nonsilicate extinction, which we
parameterize in terms of the visual extinction, AV, using a fitto the extinction data of Rieke & Lebofsky (1985), Ak ¼0:381AVk
�1:652. Following Rieke & Lebofsky, we weight thetwo contributions by assigning to the silicate extinction at the9.8 �m peak a 90% fraction of the total extinction at thatwavelength.
Fig. 14.—Brightness profiles along the cuts joining �1 Ori C to �1 Ori D and the LV 1–LV 5 sources. Solid line: 10 �m emission; dashed line: 20 �m emission,scaled for comparison.
ORION NEBULA IN MID-INFRARED 1553No. 3, 2005

The morphology of the BN/KL complex after extinctioncorrection for all six silicate filters is shown in Figure 16. Asexpected, the changes with respect to the unreddened images(Fig. 7) are stronger where the silicate absorption feature ismore prominent. In particular, at 9.8 and 10.2 �m, the IRc2 ob-ject recovers its rank of second brightest source at all wave-lengths after the BN peak. In Figure 17, we zoom in on theIRc2 region, comparing for all six silicate filters the morphol-ogy before and after extinction correction. The most strikingresult is the appearance of a point source just to the south of theIRc2 peak. It was visible in the raw 7.7 �m images, but nowbecomes evident also in the dereddened 9.6 and 10.2 �m im-ages. Its position is coincident with knot IRc2-A of Dougadoset al. (1993) and lies ’0B5 north of radio source I of Menten &Reid (1995), which remains undetected. The fact that in thedereddened images the mid-IR peak is visible at 7.7 �m, in-visible at 8.7 �m, and visible again in the dereddened 9.6 and10.2 �m images may be due to a combination of imperfect ex-tinction correction, intrinsic silicate emission, and loss of res-olution at the longest wavelengths.
From the dereddened images, we derive the distribution ofthe 10 �m color temperature of the underlying emission byfitting, pixel by pixel, a blackbody curve to all six silicate fil-ters. The result is shown in Figure 18. The temperature acrossthe BN/KL complex typically ranges between 180 and 300 K,with maxima at the BN peak with Tcol ’ 1000 K and at theIRc2 position with Tcol ’ 420 K. The BN temperature is cer-tainly overestimated. Since BN is unresolved and our imagesare diffraction-limited, the encircled energy decreases with wave-length. The dilution of flux over a larger number of pixels causesan apparent increase of the color temperature at the peak. Con-cerning IRc2, the warm dust appears mostly elongated in thenortheastern-southwestern direction, i.e., in a direction parallelto the dark lane, and peaks ’0B5 to the southeast of source I.This effect is shown in Figure 18, in which we superpose thecontours of the dereddened 7.7 �m image at 1.5 and 3.0 Jyarcsec�2 flux levels.
The bolometric luminosity can finally be estimated from theL ¼ �T 4
col(4�R2) relation, where R is the radius corresponding
to one resolution element (0B26 ’ 120 AU at the distance ofthe Orion Nebula). We do not show its spatial distribution,which is very similar to Figure 18 with an even more promi-nent role of IRc2 and BN.In Table 5, we list the values of the three parameters we have
derived—optical depth at 9.6 �m, color temperature in the7.7–12.4 �m band, and total luminosity—for the sources withphotometry presented in Table 4. The values of �9.6 and Tcolare averages over a circular aperture of 1 arcsec2 area, whereasthe luminosity, L, is integrated over the same area. Table 5 alsoreports the temperatures and luminosities derived from thedereddened 10 and 20 �m broadband filters, having assumedat 20 �m the interstellar extinction law of Mathis (1990). Thecolor temperature between these two wavelengths (125–140 K)is typically 80 K lower than that derived from the silicate filters(200–230 K). The discrepancies of up to a factor of 10 in theestimated luminosities reflect these differences.The elementary technique we have used so far, based on a
crude estimate of the extinction, still provides maps of thespatial variations that are quite robust, since the data have beentaken all at the same time and calibration errors are systematic.In the next section we discuss a more refined model to inves-tigate further the characteristics of the mid-IR emission of theBN/KL complex.
4.3.2. Silicate Absorption Feature
The two-component model has been successfully used in thepast to model the 10 �m spectrum of the main BN peak (Aitkenet al. 1981, 1985). Figure 19 compares our broadband pho-tometry of BN calculated over a synthetic aperture of 5B2 di-ameter with the spectrophotometric data of Aitken et al. (1985)and the synthetic photometry of Gezari et al. (1998). The agree-ment between different data sets is good, considering that thebroadband values have not been color-corrected and the differ-ences in aperture diameter between different authors. The solidand dotted lines represent the locus of a blackbody curve at Tcolbefore and after reddening by an optical depth �9.8 to fit ourphotometry. We use the Trapezium emissivity of Hanner et al.(1995) with the additional k�1.65 continuum discussed above.The best fit to our data has Tcol ¼ 373 K and �9:8 ¼ 1:37, witha filling factor FF ¼ 5:41 ; 10�4 to normalize the absolute fluxlevels. From the filling factor, we derive a photospheric ra-dius RBN ¼ 27:2 AU at 450 pc, and the resulting luminosity isLBN ¼ 4�R2
BN(�T4col) ¼ 600 L�. For comparison, Aitken et al.
(1981) derive Tcol ¼ 336 K and �9:8 ¼ 1:54, whereas the totalluminosity of BN is LBN ’ (1 2) ; 104 L� (Scoville et al.1983).
It is known that, besides the BN peak, the two-component fitdoes not account for the detailed shape of the 10 �m spectrumof the other compact sources of the BN/KL complex (Aitkenet al. 1985). The 8–13 �m absorption feature appears to changeacross the complex, both in depth and in shape (Aitken et al.1981). These variations reflect different physical conditions inthe absorbing medium. Downes et al. (1981) and Werner et al.(1983) first indicated that most of the IRc sources discovered inthe BN/KL complex are not self-luminous, but rather extendedclumps of diffuse emission. Genzel & Stutzki (1989) indicatedthat the BN/KL complex is dominated by the radiative trans-port of IR radiation in a highly nonuniform medium. A furthercomplication may arise from the fact that at shorter wave-lengths scattering becomes important. Werner et al. (1983)were the first to report that at 4.8 �m the BN/KL complex ispredominantly a reflection nebula, but since the albedo of as-tronomical silicates drops by 2 orders of magnitude between
Fig. 15.—Map of the optical depth of the BN/KL complex at 9.6 �m.
ROBBERTO ET AL.1554 Vol. 129

4.5 and 8 �m (Draine 1985), one can still assume that scat-tering is negligible at mid-IR wavelengths. In this case, thebasic two-component model can be modified to account for thefollowing effects:
1. The background emission is normally optically thin. Onlyfor a few sources, like BN and IRc2, can the background emis-
sion be represented by a stellar photosphere multiplied by aproper filling factor.
2. The presence of foreground absorbing medium (as in thetwo-component model).
3. A third component, optically thin, needed to account forsilicate emission at 9.6 �m.
Fig. 16.—Same as Fig. 7, but after reddening correction.
ORION NEBULA IN MID-INFRARED 1555No. 3, 2005
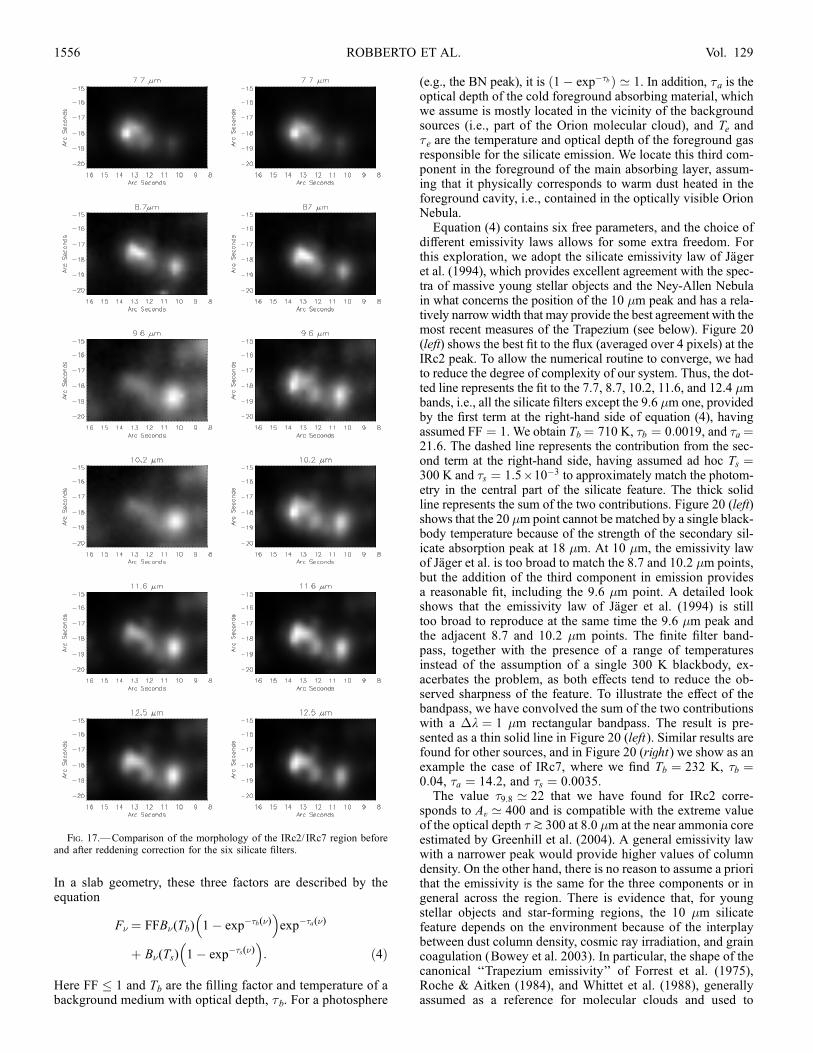
In a slab geometry, these three factors are described by theequation
F� ¼ FFB�(Tb) 1� exp��b(�)� �
exp��a(�)
þ B�(Ts) 1� exp��s(�)� �
: ð4Þ
Here FF 1 and Tb are the filling factor and temperature of abackground medium with optical depth, �b. For a photosphere
(e.g., the BN peak), it is 1� exp��bð Þ ’ 1. In addition, �a is theoptical depth of the cold foreground absorbing material, whichwe assume is mostly located in the vicinity of the backgroundsources (i.e., part of the Orion molecular cloud), and Te and�e are the temperature and optical depth of the foreground gasresponsible for the silicate emission. We locate this third com-ponent in the foreground of the main absorbing layer, assum-ing that it physically corresponds to warm dust heated in theforeground cavity, i.e., contained in the optically visible OrionNebula.Equation (4) contains six free parameters, and the choice of
different emissivity laws allows for some extra freedom. Forthis exploration, we adopt the silicate emissivity law of Jageret al. (1994), which provides excellent agreement with the spec-tra of massive young stellar objects and the Ney-Allen Nebulain what concerns the position of the 10 �m peak and has a rela-tively narrowwidth that may provide the best agreement with themost recent measures of the Trapezium (see below). Figure 20(left) shows the best fit to the flux (averaged over 4 pixels) at theIRc2 peak. To allow the numerical routine to converge, we hadto reduce the degree of complexity of our system. Thus, the dot-ted line represents the fit to the 7.7, 8.7, 10.2, 11.6, and 12.4 �mbands, i.e., all the silicate filters except the 9.6 �m one, providedby the first term at the right-hand side of equation (4), havingassumed FF ¼ 1. We obtain Tb ¼ 710 K, �b ¼ 0:0019, and �a ¼21:6. The dashed line represents the contribution from the sec-ond term at the right-hand side, having assumed ad hoc Ts ¼300 K and �s ¼ 1:5 ; 10�3 to approximately match the photom-etry in the central part of the silicate feature. The thick solidline represents the sum of the two contributions. Figure 20 (left)shows that the 20 �m point cannot be matched by a single black-body temperature because of the strength of the secondary sil-icate absorption peak at 18 �m. At 10 �m, the emissivity lawof Jager et al. is too broad to match the 8.7 and 10.2 �m points,but the addition of the third component in emission providesa reasonable fit, including the 9.6 �m point. A detailed lookshows that the emissivity law of Jager et al. (1994) is stilltoo broad to reproduce at the same time the 9.6 �m peak andthe adjacent 8.7 and 10.2 �m points. The finite filter band-pass, together with the presence of a range of temperaturesinstead of the assumption of a single 300 K blackbody, ex-acerbates the problem, as both effects tend to reduce the ob-served sharpness of the feature. To illustrate the effect of thebandpass, we have convolved the sum of the two contributionswith a �k ¼ 1 �m rectangular bandpass. The result is pre-sented as a thin solid line in Figure 20 (left). Similar results arefound for other sources, and in Figure 20 (right) we show as anexample the case of IRc7, where we find Tb ¼ 232 K, �b ¼0:04, �a ¼ 14:2, and �s ¼ 0:0035.The value �9:8 ’ 22 that we have found for IRc2 corre-
sponds to Av ’ 400 and is compatible with the extreme valueof the optical depth � k300 at 8.0 �m at the near ammonia coreestimated by Greenhill et al. (2004). A general emissivity lawwith a narrower peak would provide higher values of columndensity. On the other hand, there is no reason to assume a priorithat the emissivity is the same for the three components or ingeneral across the region. There is evidence that, for youngstellar objects and star-forming regions, the 10 �m silicatefeature depends on the environment because of the interplaybetween dust column density, cosmic ray irradiation, and graincoagulation (Bowey et al. 2003). In particular, the shape of thecanonical ‘‘Trapezium emissivity’’ of Forrest et al. (1975),Roche & Aitken (1984), and Whittet et al. (1988), generallyassumed as a reference for molecular clouds and used to
Fig. 17.—Comparison of the morphology of the IRc2/ IRc7 region beforeand after reddening correction for the six silicate filters.
ROBBERTO ET AL.1556 Vol. 129
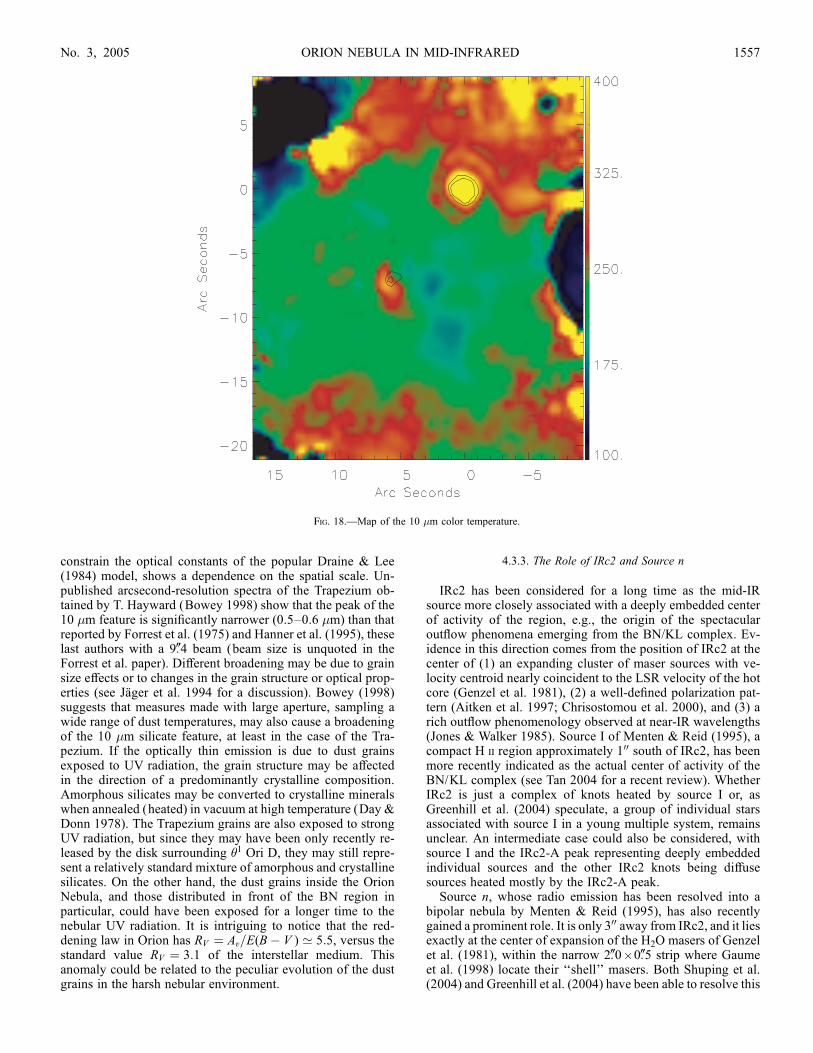
constrain the optical constants of the popular Draine & Lee(1984) model, shows a dependence on the spatial scale. Un-published arcsecond-resolution spectra of the Trapezium ob-tained by T. Hayward (Bowey 1998) show that the peak of the10 �m feature is significantly narrower (0.5–0.6 �m) than thatreported by Forrest et al. (1975) and Hanner et al. (1995), theselast authors with a 9B4 beam (beam size is unquoted in theForrest et al. paper). Different broadening may be due to grainsize effects or to changes in the grain structure or optical prop-erties (see Jager et al. 1994 for a discussion). Bowey (1998)suggests that measures made with large aperture, sampling awide range of dust temperatures, may also cause a broadeningof the 10 �m silicate feature, at least in the case of the Tra-pezium. If the optically thin emission is due to dust grainsexposed to UV radiation, the grain structure may be affectedin the direction of a predominantly crystalline composition.Amorphous silicates may be converted to crystalline mineralswhen annealed (heated) in vacuum at high temperature (Day &Donn 1978). The Trapezium grains are also exposed to strongUV radiation, but since they may have been only recently re-leased by the disk surrounding �1 Ori D, they may still repre-sent a relatively standard mixture of amorphous and crystallinesilicates. On the other hand, the dust grains inside the OrionNebula, and those distributed in front of the BN region inparticular, could have been exposed for a longer time to thenebular UV radiation. It is intriguing to notice that the red-dening law in Orion has RV ¼ Av=E(B� V ) ’ 5:5, versus thestandard value RV ¼ 3:1 of the interstellar medium. Thisanomaly could be related to the peculiar evolution of the dustgrains in the harsh nebular environment.
4.3.3. The Role of IRc2 and Source n
IRc2 has been considered for a long time as the mid-IRsource more closely associated with a deeply embedded centerof activity of the region, e.g., the origin of the spectacularoutflow phenomena emerging from the BN/KL complex. Ev-idence in this direction comes from the position of IRc2 at thecenter of (1) an expanding cluster of maser sources with ve-locity centroid nearly coincident to the LSR velocity of the hotcore (Genzel et al. 1981), (2) a well-defined polarization pat-tern (Aitken et al. 1997; Chrisostomou et al. 2000), and (3) arich outflow phenomenology observed at near-IR wavelengths(Jones & Walker 1985). Source I of Menten & Reid (1995), acompact H ii region approximately 100 south of IRc2, has beenmore recently indicated as the actual center of activity of theBN/KL complex (see Tan 2004 for a recent review). WhetherIRc2 is just a complex of knots heated by source I or, asGreenhill et al. (2004) speculate, a group of individual starsassociated with source I in a young multiple system, remainsunclear. An intermediate case could also be considered, withsource I and the IRc2-A peak representing deeply embeddedindividual sources and the other IRc2 knots being diffusesources heated mostly by the IRc2-A peak.
Source n, whose radio emission has been resolved into abipolar nebula by Menten & Reid (1995), has also recentlygained a prominent role. It is only 300 away from IRc2, and it liesexactly at the center of expansion of the H2O masers of Genzelet al. (1981), within the narrow 2B0 ; 0B5 strip where Gaumeet al. (1998) locate their ‘‘shell’’ masers. Both Shuping et al.(2004) and Greenhill et al. (2004) have been able to resolve this
Fig. 18.—Map of the 10 �m color temperature.
ORION NEBULA IN MID-INFRARED 1557No. 3, 2005

source at 10 �m with Keck. It appears slightly elongated in adirection perpendicular to the axis of the bipolar radio source.Shuping et al. (2004) suggest that source n lies at the center of abipolar cavity excavated by the same outflow responsible forthe reachmaser phenomenology. The presence of a compact H ii
region clearly suggests that this is a young early-type star.Greenhill et al. (2004) estimate a luminosity L � 2000 L� (mid-B type), but also note that the recent detection of hard X-rayemission is unusual for early-type stars.
Gezari et al. (1998) have used mid-IR photometric datasimilar to ours to downplay the role of IRc2 versus source n asthe dominant energy source of the region. In particular, Gezariet al. (1998) estimate for IRc2 a total luminosity L ’ 103 L�,approximately 2 orders of magnitude lower than the previousestimates (e.g., Downes et al. 1981; Wynn-Williams et al.1984). One may question the reliability of a technique thatprovides values different by orders of magnitudes in front of arather modest gain in spatial resolution. In fact, these estimatesmust always be taken with great caution. First, we have seen inthe previous paragraphs that different analysis techniques maylead to very different values for the optical depth at 9.8 �m(�9:8 ¼ 3:37 vs. �a ¼ 21:6), even if both use the same data set(in our particular case, both neglect the 9.6 �m point). It is also
known that the commonly used relation, L ¼ 4�R2�T4, whereR and T are the source radius and temperature and representsthe dust emissivity, may lead to a significant underestimate ofthe bolometric luminosity if one assumes the IR color tem-perature as the blackbody temperature of the source (Panagia1975). A more subtle effect may also be present, since the samerelation also assumes that the size of the underlying photo-sphere does not change with wavelength. In the case of IRc2,however, if the absorbing medium is clumpy or in generalinhomogeneous, an unresolved source may have a filling factorthat increases with wavelength as the foreground absorbingmaterial becomes more and more transparent. The underlyingsource will then appear redder, and the estimated luminositywill be lower because of the strong dependence on the colortemperature. In particular, a value AV ¼ 60 mag corresponds toA9:7 ’ 3:4 mag at 9.7 �m and to A20 ¼ 1:3 mag at 20 �m, usingthe Bessell & Brett (1988) IR reddening law. Thus, IRc2 canbe nearly optically thick at 10 �m and nearly optically thinat 20 �m. In these conditions, the mid-IR morphology is de-termined by a complex combination of thermal emission andvariations of foreground extinction. Further multiwavelengthobservations will need to be coupled with three-dimensionalradiative transfer models to disentangle each contribution.
TABLE 5
Physical Parameters of the IRc Sources in the BN/KL Complex
7.7–12.4 �m 10–20 �m
Source Name �9.6
Tcol(K)
L
(L�)
Tcol(K)
L
(L�)
BN.................................... 0.51 490 9.21 ; 105 296 7.98 ; 104
BN SW arc....................... 0.33 288 8.48 ; 104 176 8.39 ; 103
IR n .................................. 1.30 227 2.41 ; 104 149 4.37 ; 103
IRc2 A+B......................... 2.91 308 1.14 ; 105 164 6.27 ; 103
IRc2 C.............................. 2.53 258 4.49 ; 104 153 4.70 ; 103
IRc2 D.............................. 2.36 219 2.11 ; 104 160 5.68 ; 103
IRc2 E .............................. 1.94 208 1.63 ; 104 148 4.06 ; 103
IRc3 N.............................. 1.11 204 1.46 ; 104 127 2.27 ; 103
IRc3 S .............................. 1.18 209 1.61 ; 104 128 2.35 ; 103
IRc4.................................. 1.53 184 9.55 ; 103 138 3.12 ; 103
IRc5.................................. 1.32 206 1.53 ; 104 126 2.15 ; 103
IRc6.................................. 1.30 210 1.62 ; 104 133 2.69 ; 103
IRc6 N.............................. 0.87 223 2.09 ; 104 133 2.72 ; 103
IRc6 E .............................. 1.48 206 1.52 ; 104 134 2.75 ; 103
IRc7.................................. 2.02 198 1.14 ; 104 148 4.17 ; 103
IRc8.................................. 0.79 225 2.16 ; 104 119 1.69 ; 103
IRc11................................ 1.73 215 1.87 ; 104 144 3.69 ; 103
IRc12................................ 1.79 258 3.93 ; 104 140 3.34 ; 103
IRc13................................ 0.84 233 2.49 ; 104 118 1.66 ; 103
IRc14................................ 0.95 223 2.11 ; 104 124 2.03 ; 103
IRc15................................ 1.00 222 2.06 ; 104 130 2.41 ; 103
IRc16 N............................ 1.06 238 2.70 ; 104 128 2.32 ; 103
IRc16 S ............................ 1.11 227 2.25 ; 104 136 2.97 ; 103
IRc16 W........................... 0.86 233 2.47 ; 104 140 3.38 ; 103
IRc17................................ 0.65 247 3.16 ; 104 122 1.89 ; 103
IRc19................................ 1.02 303 7.30 ; 104 131 2.48 ; 103
IRc20................................ 1.33 214 1.75 ; 104 126 2.18 ; 103
IRc21................................ 1.63 221 2.03 ; 104 134 2.74 ; 103
IRc22................................ 1.05 229 2.36 ; 104 126 2.15 ; 103
IRc23................................ 1.21 239 2.80 ; 104 126 2.12 ; 103
Knot 1 .............................. 0.81 240 2.83 ; 104 115 1.48 ; 103
Knot 2 .............................. 0.84 246 3.12 ; 104 114 1.43 ; 103
Knot 3 .............................. 0.85 245 3.06 ; 104 115 1.50 ; 103
BN SW............................. 0.77 234 2.53 ; 104 140 3.30 ; 103
MAX 69........................... . . . 297 6.79 ; 104 128 2.36 ; 103
ROBBERTO ET AL.1558 Vol. 129

4.4. OMC-1 South
The OMC-1 South region is characterized by the rich phe-nomenology typically associated with massive star formation:warm gas (Ziurys et al. 1981), large dust column densities(Keene et al. 1982), H2O masers (Gaume et al. 1998), mo-lecular outflows (Schmid-Burgk et al. 1990; Rodrıguez-Francoet al. 1999a), and several optical jets and Herbig-Haro (HH)objects (Bally et al. 2000). With nine mid-IR sources in a lessthan 10 ; 10 field (Fig. 11), this is a rather dense area, and thescale of the outflows, up to a projected distance of ’10000 ¼0:21 pc in the case of HH 203/204, often makes it difficult to un-ambiguously associate each optical outflow with a well-defineddriving source. We have already mentioned the correspondencebetween the reddest 3.5 �m sources, TPSC 1 and TPSC 2 ofLada et al. (2000), and MAX 61 and MAX 64, respectively. Asystem of outflows that includes HH 529 and HH 269, andpossibly HH 528, appears to depart from an ‘‘optical outflowsource’’ (named OOS by O’Dell & Doi 2003a) coincident,within the error ellipse, with both sources. Based on their
proper motions, O’Dell & Doi (2003a, 2003b) estimate for theOOS coordinates R:A:(J2000) ¼ 5h35m14:s56, decl:(J2000) ¼�5
�2305400, within �300 from the position of MAX 61 and
MAX 64.6 MAX 61, which is radio source 144-351 of Zapataet al. (2004), is the most viable candidate, since our images(Fig. 4) show two elongated filaments immediately to the eastand west of MAX 61 with the same orientation as the HH 529and HH 269 outflows. These are most probably the jets emergingfrom the source, with the mid-IR emission due to entrained duston their outside, along with gas. Doi et al. (2004) combine propermotions with new radial velocities of the outflows to determinethat the optical jets originate from a source lying only about0.02 pc within the PDR. Their relations between proper mo-tion, radial velocities, and the mid-IR emission would providea self-consistent picture of this activity center, except thatboth systems of HH objects appear blueshifted and breakingthrough the ionization front, a rather unusual circumstance thatmay indicate a more complex scenario. A curvature of the out-flow toward our line of sight could result from the interactionof the jet with some stellar wind, originated, e.g., from theTrapezium stars or from the nebular ionization front. This is thehypothesis of Smith et al. (2004). It is clear that if the jetdirection can be deflected by wind interaction, the identifica-tion of candidate outflow sources on the basis of proper motionand jet /counterjet alignment becomes more uncertain. In fact,Smith et al. (2004) cast doubts about the association of HH 269with HH 529 and rather suggest that HH 269 is the counterlobeof the HH 203/204 pair, with significant deflection with respectto both the plane of the sky and our vantage point.
Concerning the other prominent optical outflows, both Zapataet al. (2004) and Smith et al. (2004) argue that HH 202 is asso-ciated with HH 528 rather than HH 203/204, as suggested byRosado et al. (2001). Zapata et al. (2004) suggest that this systemoriginates from their radio source 143-353. At this position, wedetect an extended knot of 10 �m emission shown to be saturatedin Figure 4 and not included in our list of 177 point sources.Smith et al. (2004) suggest a different scenario, with the HH 202
Fig. 19.—Silicate spectrum of BN. Diamonds: this paper; plus signs:spectrophotometry of Aitken et al. (1985); asterisks: broadband data of Gezariet al. (1998). The solid line refers to a blackbody curve at Tcol ¼ 373 K. Thedotted line joins the blackbody points corresponding to our effective wave-lengths after extinction correction with optical depth �9:8 ¼ 1:37.
Fig. 20.—Fit to the mid-IR photometry of IRc2 (left) and IRc7 (right) on the basis of eq. (4). Dotted line: First term on the right side of eq. (4), relative to thebackground source and foreground extinction. Dashed line: Second term on the right side of eq. (4), relative to the optically thin emission of 300 K dust. Thick solidline: Sum of the two contributions. Thin solid line: Sum of the two contributions convolved with a 1 �m rectangular bandpass to reproduce the effect of finitebandwidth. Error bars represent the zero-point errors quoted in x 2.2.3.
6 Zapata et al. (2004) base their comparison with the present paper on apreliminary version of the manuscript. In this final version their sources MAX58 and MAX 60 are now listed as MAX 61 and MAX 64.
ORION NEBULA IN MID-INFRARED 1559No. 3, 2005
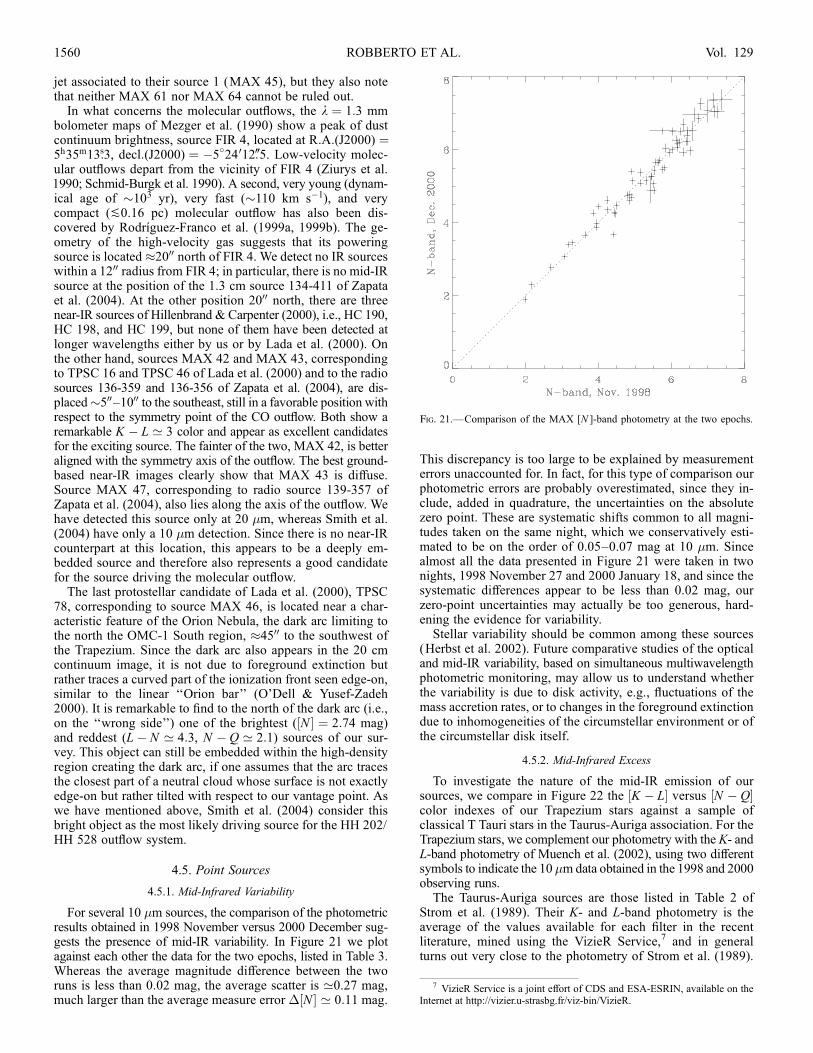
jet associated to their source 1 (MAX 45), but they also notethat neither MAX 61 nor MAX 64 cannot be ruled out.
In what concerns the molecular outflows, the k ¼ 1:3 mmbolometer maps of Mezger et al. (1990) show a peak of dustcontinuum brightness, source FIR 4, located at R:A:(J2000) ¼5h35m13:s3, decl:(J2000) ¼ �5
�24012B5. Low-velocity molec-
ular outflows depart from the vicinity of FIR 4 (Ziurys et al.1990; Schmid-Burgk et al. 1990). A second, very young (dynam-ical age of �103 yr), very fast (�110 km s�1), and verycompact (P0.16 pc) molecular outflow has also been dis-covered by Rodrıguez-Franco et al. (1999a, 1999b). The ge-ometry of the high-velocity gas suggests that its poweringsource is located �2000 north of FIR 4. We detect no IR sourceswithin a 1200 radius from FIR 4; in particular, there is no mid-IRsource at the position of the 1.3 cm source 134-411 of Zapataet al. (2004). At the other position 2000 north, there are threenear-IR sources of Hillenbrand & Carpenter (2000), i.e., HC 190,HC 198, and HC 199, but none of them have been detected atlonger wavelengths either by us or by Lada et al. (2000). Onthe other hand, sources MAX 42 and MAX 43, correspondingto TPSC 16 and TPSC 46 of Lada et al. (2000) and to the radiosources 136-359 and 136-356 of Zapata et al. (2004), are dis-placed�500–1000 to the southeast, still in a favorable position withrespect to the symmetry point of the CO outflow. Both show aremarkable K � L ’ 3 color and appear as excellent candidatesfor the exciting source. The fainter of the two, MAX 42, is betteraligned with the symmetry axis of the outflow. The best ground-based near-IR images clearly show that MAX 43 is diffuse.Source MAX 47, corresponding to radio source 139-357 ofZapata et al. (2004), also lies along the axis of the outflow. Wehave detected this source only at 20 �m, whereas Smith et al.(2004) have only a 10 �m detection. Since there is no near-IRcounterpart at this location, this appears to be a deeply em-bedded source and therefore also represents a good candidatefor the source driving the molecular outflow.
The last protostellar candidate of Lada et al. (2000), TPSC78, corresponding to source MAX 46, is located near a char-acteristic feature of the Orion Nebula, the dark arc limiting tothe north the OMC-1 South region, �4500 to the southwest ofthe Trapezium. Since the dark arc also appears in the 20 cmcontinuum image, it is not due to foreground extinction butrather traces a curved part of the ionization front seen edge-on,similar to the linear ‘‘Orion bar’’ (O’Dell & Yusef-Zadeh2000). It is remarkable to find to the north of the dark arc (i.e.,on the ‘‘wrong side’’) one of the brightest (½N � ¼ 2:74 mag)and reddest (L� N ’ 4:3, N � Q ’ 2:1) sources of our sur-vey. This object can still be embedded within the high-densityregion creating the dark arc, if one assumes that the arc tracesthe closest part of a neutral cloud whose surface is not exactlyedge-on but rather tilted with respect to our vantage point. Aswe have mentioned above, Smith et al. (2004) consider thisbright object as the most likely driving source for the HH 202/HH 528 outflow system.
4.5. Point Sources
4.5.1. Mid-Infrared Variability
For several 10 �m sources, the comparison of the photometricresults obtained in 1998 November versus 2000 December sug-gests the presence of mid-IR variability. In Figure 21 we plotagainst each other the data for the two epochs, listed in Table 3.Whereas the average magnitude difference between the tworuns is less than 0.02 mag, the average scatter is ’0.27 mag,much larger than the average measure error �½N � ’ 0:11 mag.
This discrepancy is too large to be explained by measurementerrors unaccounted for. In fact, for this type of comparison ourphotometric errors are probably overestimated, since they in-clude, added in quadrature, the uncertainties on the absolutezero point. These are systematic shifts common to all magni-tudes taken on the same night, which we conservatively esti-mated to be on the order of 0.05–0.07 mag at 10 �m. Sincealmost all the data presented in Figure 21 were taken in twonights, 1998 November 27 and 2000 January 18, and since thesystematic differences appear to be less than 0.02 mag, ourzero-point uncertainties may actually be too generous, hard-ening the evidence for variability.Stellar variability should be common among these sources
(Herbst et al. 2002). Future comparative studies of the opticaland mid-IR variability, based on simultaneous multiwavelengthphotometric monitoring, may allow us to understand whetherthe variability is due to disk activity, e.g., fluctuations of themass accretion rates, or to changes in the foreground extinctiondue to inhomogeneities of the circumstellar environment or ofthe circumstellar disk itself.
4.5.2. Mid-Infrared Excess
To investigate the nature of the mid-IR emission of oursources, we compare in Figure 22 the ½K � L� versus ½N � Q�color indexes of our Trapezium stars against a sample ofclassical T Tauri stars in the Taurus-Auriga association. For theTrapezium stars, we complement our photometry with the K- andL-band photometry of Muench et al. (2002), using two differentsymbols to indicate the 10 �m data obtained in the 1998 and 2000observing runs.The Taurus-Auriga sources are those listed in Table 2 of
Strom et al. (1989). Their K- and L-band photometry is theaverage of the values available for each filter in the recentliterature, mined using the VizieR Service,7 and in generalturns out very close to the photometry of Strom et al. (1989).
Fig. 21.—Comparison of the MAX [N ]-band photometry at the two epochs.
7 VizieR Service is a joint effort of CDS and ESA-ESRIN, available on theInternet at http://vizier.u-strasbg.fr/viz-bin/VizieR.
ROBBERTO ET AL.1560 Vol. 129

The 10 and 20 �m photometry is derived from the IRASphotometry at 12 and 25 �m in the following way. The IRASPSC2 fluxes are quoted at the effective wavelengths assumingan input energy distribution constant per log �, i.e., �F� ¼constant. This is also the shape of the typical ‘‘flat’’ spec-tral energy distribution (SED) of circumstellar disks aroundT Tauri stars. We therefore assume the IRAS fluxes to be color-corrected and adjust their values only to account for the dif-ference in effective wavelength between the filters. From the�F� ¼ constant condition, we derive m(10) ¼ m(12)þ 0:516and m(20) ¼ m(25)þ 0:694 using the zero-magnitude fluxesreported in x 2 of this paper and in the IRAS PSC2 manual. Wehave visually inspected each SED plotting, together with all theIR data available in the literature and our interpolated 10 and20 �m points. Whereas our points are always in excellentagreement with the overall shape of the SED (admittedly con-strained by the IRAS points), most of the 10 and 20 �m ground-based data are old and suspiciously far from the best-fit line.
Figure 22 clearly shows that there is a systematic differ-ence between the Orion and the Taurus-Auriga samples, as theOrion stars have an ½N � Q� excess between 3 and 5 mag,whereas for Taurus-Auriga the ½N � Q� index ranges between 1and 3 mag. In addition, the ½K � L� excesses appear on averagehigher for Orion, although for both samples the majority ofstars have ½K � L� in the range 0.7–1.5 mag. We also show in
Figure 22 five stars without L-band photometry but well de-tected at shorter wavelengths, to which we have assigned½K � L� ¼ 0. For these sources as well the ½N � Q� index ap-pears higher than that of the stars in Taurus-Auriga.
Extinction cannot explain these effects, either in terms ofintensity or reddening. In Figure 22 we have indicated with anarrow the reddening corresponding to Av ¼ 10 mag of ex-tinction. Hillenbrand (1997) suggests that the mean extinctionfor the optically visible population of the Orion Nebula clusteris AV P 2:5 mag, with few optical stars having AV k 5 mag. Forthe IR sample, the mean extinction is approximately 3 timeshigher, but only a small fraction of sources have AV k 15 mag(Hillenbrand & Hartmann 1998).
Calvet et al. (1992) have calculated the IR colors of accretingdisks around classical T Tauri stars assuming a variety of stellarand disk parameters. Each one of their models is represented inFigure 22 as a solid line, as different orientation angles are takeninto account. The Calvet et al. (1992) predictions fall in generalwithin the region of the observed T Tauri star colors. In par-ticular, the models with the highest ½N � Q�k 2 have in com-mon a higher value of , the index of the power law describingthe increase of the disk height with the distance from the centralstar. Large disk flaring angles could therefore explain the ex-treme ½N � Q� colors of our sources.
In a previous paper (Robberto et al. 2002), we have exploredthe continuum SED of circumstellar disks embedded within anH ii region like Orion. We predicted that the extra energy inputfrom the ionizing stars and from the nebular environment raisesthe disk temperature and causes an increase of the disk flaringangle. An inflated disk will also intercept a larger fraction ofthe flux emitted by its own central star. In the vicinity of �1 OriC, the neutral flow produced by disk photoevaporation origi-nates a neutral envelope bordered by a ionization front, the‘‘proplyd’’ phenomenon (O’Dell et al. 1993; O’Dell & Wen1994). Together with the disk, the dusty envelope also con-tributes to the mid-IR emission. Our models show that there isin general a strong enhancement of the mid-IR emission dueboth to the higher disk temperature and the presence of thephotoevaporated envelope. The UV-heated dust produces acharacteristic far-IR peak of emission at 30–60 �m. In Fig-ure 22 we show as a dotted line the locus of the colors resultingfrom our model, assuming the limiting case of a disk facingboth the ionizing star (for simplicity �1 Ori C is considered theonly ionizing source) and the Earth at various distances from�1 Ori C. The ½N � Q� colors predicted by this model nicelymatch those of the Orion sample, supporting the hypothesisthat the UV radiation is ultimately responsible for the strongenhancement of 20 �m emission.
In Robberto et al. (2002), we have shown that the IR SEDsof proplyds depend on a number of factors, both physical, suchas the distance from the ionizing star, the size of the envelope,the inner disk radius, the temperature of the central star, and thedust composition, and geometrical, such as the tilt angle ofthe disk with respect to the ionizing star and to the Earth. Theprojection factors in particular have a dramatic impact on theobserved SED, since disk surfaces at the same distance from�1 Ori C can be exposed to very different UV fluxes and appearfrom the Earth under all possible angles, showing either thefront or the back side. The 30–60 �m peak stands as the mainobservational characteristic of these systems. Depending onthe dust temperature and grain size, IR color indexes that donot include the 20 �m band, such as ½K � N � or ½L� N �, mayremain unaffected by a mid-IR peak too cold to produce strongexcess at 10 �m. For the main group of sources detected only at
Fig. 22.—Mid-IR color-color plot for the Orion and Taurus-Auriga sources.The K- and L-band data for Orion are from Muench et al. (2002). The crossesand plus signs refer to the MAX 10 �m data taken in 1998 and 2000, re-spectively. Filled circles are for the Taurus data set. Solid lines represent thecolor of the Calvet et al. (1992) flaring disk models. The diamonds and therelative dotted line represent the model of Robberto et al. (2004) for a photo-evaporated disk in an H ii region oriented face-on with respect to both theionizing star and the observer. Each diamond refers to a different distance fromthe ionizing star; from top to bottom: 3000, 6000, 9000, 12000, and 15000, corre-sponding to 0.065, 0.13, 0.20, 0.26, and 0.33 pc, respectively, at the assumeddistance d ¼ 450 pc of the Orion Nebula.
ORION NEBULA IN MID-INFRARED 1561No. 3, 2005

10 �m, it is necessary to analyze in detail each individualsource to constrain the disk properties. This analysis will bepresented in a second paper and will include the result of ourdeep 10 �m survey of selected fields in Orion.
5. CONCLUSION
Using a new restoration method developed for this project,we have obtained the first wide-field and diffraction-limited 10and 20 �m images of the core of the Orion Nebula. The imagesconfirm that the morphology of the Orion Nebula at mid-IRwavelengths is dominated by the BN/KL complex and by theNey-Allen Nebula. At lower signal levels, the Orion Nebulashows a filamentary structure that traces the walls of the H ii
region. A remarkable group of arclike structures is detected�10 to the south of the Trapezium. We analyze the structure ofthe Ney-Allen Nebula in the framework of analytic wind-windinteraction models, finding evidence for a complex kinematicalstatus at the center of the cluster. The B0.5 V star �1 Ori D,associated with the brightest mid-IR structure of the Trapeziumregion, is probably surrounded by a photoevaporated circum-stellar disk. The fact that, among the main four Trapeziumstars, this star is the only one without a binary companionsuggests that stellar multiplicity and massive circumstellardisks are mutually exclusive in the Trapezium. We detect in theOMC-1 South region three point sources that can be associatedwith the mass-loss activity detected at millimeter wavelengths.Finally, we list the position and photometry of 177 pointsources, the large majority of which have been detected for the
first time in the mid-IR. Twenty-two of them lack counterpartsat shorter wavelengths and are therefore candidates for deeplyembedded protostars. The comparison of photometric dataobtained at two different epochs reveals that source variabilityat 10 �m is present up to a level of �1 mag on a timescale of�2 yr. We compare the mid-IR color-color diagram for oursources in Orion and a similar data set in the Taurus associa-tion, finding indications for large mid-IR excess, especiallyat 20 �m, and discuss this finding in the framework of theRobberto et al. (2002) model.We have also presented narrowband images of the BN/KL
complex taken in the standard silicate filter set. The BN/KLcomplex is resolved into multiple and extended features. Inparticular, we resolve a point source in correspondence of theIRc2-A knot. We derive the extinction and temperature mapson the basis of the simple ‘‘two-component’’ model for the IRemission and discuss the shape of the silicate absorption fea-ture and possible scenarios for dust evolution in the H ii region.
The authors are indebted to the MPIA and UKIRT staff fortheir support with the MAX operations. The contribution ofM. Cohen to the MAX calibration is acknowledged. We thankBob O’Dell for several useful comments and in particular forinsights on the interpretation of the OMC-1 South region.Comments from an anonymous referee also greatly contributedto improve the original manuscript. S. G. P.’s visit at STScI wassupported by the STScI 2002 Summer Student Program.
REFERENCES
Aitken, D. K., Bailey, J. A., Roche, P. F., & Hough, J. M. 1985, MNRAS, 215,815
Aitken, D. K., Roche, P. F., Spenser, P. M., & Jones, B. 1981, MNRAS, 195,921
Aitken, D. K., Smith, C. H., Moore, T. J. T., Roche, P. F., Fujiyoshi, T., &Wright, C. M. 1997, MNRAS, 286, 85
Bally, J., O’Dell, C. R., & McCaughrean, M. J. 2000, AJ, 119, 2919Bally, J., Sutherland, R. S., Devine, D., & Johnstone, D. 1998, AJ, 116, 293Becklin, E. E., & Neugebauer, G. 1967, ApJ, 147, 799Bertero, M., & Boccacci, P. 1998, Introduction to Inverse Problems in Imaging(Bristol: IoP Publishing)
Bertero, M., Boccacci, P., Di Benedetto, F., & Robberto, M. 1999, InverseProblems, 15, 345
Bertero, M., Boccacci, P., & Robberto, M. 1998, Proc. SPIE, 3354, 877———. 2000, PASP, 112, 1121Bessell, M. S., & Brett, J. M. 1988, PASP, 100, 1134Bowey, J. E. 1998, Ph.D. thesis, Univ. Central LancashireBowey, J. E., Adamson, A. J., & Yates, J. A. 2003, MNRAS, 340, 1173Calvet, N., Magris, G. C., Patino, A., & D’Alessio, P. 1992, Rev. Mex. AA, 24,27
Canto, J., Raga, A. C., & Wilkin, F. P. 1996, ApJ, 469, 729Castor, J., McCray, R., & Weaver, R. 1975, ApJ, 200, L107Chelli, A., Perrier, C., & Lena, P. 1984, ApJ, 280, 163Chrisostomou, A., Gledhill, T. M., Menard, F., Hough, J. H., Tamura, M., &Bailey, J. 2000, MNRAS, 312, 103
Churchwell, E., Felli, M., Wood, D. O. S., & Massi, M. 1987, ApJ, 321,516
Day, K. L., & Donnn, B. D. 1978, ApJ, 222, L45Doi, T., O’Dell, C. R., & Haritgan, P. 2004, AJ, 127, 3456Dougados, C., Lena, P., Ridgway, S. T., Christou, J. C., & Probst, R. G. 1993,ApJ, 406, 112
Downes, D., Genzel, R., Becklin, E. E., & Wynn-Williams, C. G. 1981, ApJ,244, 869
Draine, B. T. 1985, ApJS, 57, 587Draine, B. T., & Lee, H. M. 1984, ApJ, 285, 89Forrest, W. J., Gillett, F. C., & Stein, W. A. 1975, ApJ, 195, 423Garcıa-Arredondo, F., Henney, W. J., & Arthur, S. J. 2001, ApJ, 561, 830Gaume, R. A., Wilson, T. L., Vrba, F. J., Johnston, K. J., & Schmid-Burgk, J.1998, ApJ, 493, 940
Genzel, R., Reid, M. J., Moran, J. M., & Downes, D. 1981, ApJ, 244, 884Genzel, R., & Stutzki, J. 1989, ARA&A, 27, 41
Gezari, D. Y., Backman, D. E., & Wener, M. D. 1998, ApJ, 509, 283Greenhill, L. J., Gezari, D. Y., Danchi, W. C., Najita, J., Monnier, J. D., &Tuthill, P. G. 2004, ApJ, 605, L57
Hanner, M. S., Brooke, T. Y., & Tokunaga, A. T. 1995, ApJ, 438, 250Hawarden, T., et al. 1999, Proc. SPIE, 3785, 82Hayward, T. L. 1994, ApJ, 429, 726Hayward, T. L., Houck, J. R., & Miles, J. W. 1994, ApJ, 433, 157Henney, W., & Arthur, S. J. 1998, AJ, 116, 322Henney, W., & O’Dell, C. R. 1999, AJ, 118, 2350Henney, W. J., O’Dell, C. R., Meaburn, J., Garrington, S. T., & Lopez, J. A.2002, ApJ, 566, 315
Herbst, W., Bailer-Jones, C. A. L., Mundt, R., Meisenheimer, K., &Wackermann,R. 2002, A&A, 396, 513
Hillenbrand, L. A. 1997, AJ, 113, 1733Hillenbrand, L. A., & Carpenter, J. M. 2000, ApJ, 540, 236Hillenbrand, L. A., & Hartmann, L. 1998, ApJ, 492, 540Jager, C., Mutschke, H., Begemann, B., Dorschner, J., & Henning, T. 1994,A&A, 292, 641
Johnston, K. J., Migenes, V., & Norris, R. P. 1989, ApJ, 341, 847Johnstone, D., Hollenbach, D., & Bally, J. 1998, ApJ, 499, 758Jones, B. F., & Walker, M. F. 1985, AJ, 90, 1320Keene, J., Hildebrand, R. H., & Whitcomb, S. E. 1982, ApJ, 252, L11Kleinmann, D. E., & Low, F. J. 1967, ApJ, 149, L1Lada, C. J., & Lada, E. A. 2003, ARA&A, 41, 57Lada, C. J., Muench, A. A., Haisch, K. E., Jr., Lada, E. A., Alves, J. F.,Tollestrup, E. V., & Willner, S. P. 2000, AJ, 120, 3162
Laques, P., & Vidal, J.-L. 1979, A&A, 73, 97Lonsdale, C. J., Becklin, E. E., Lee, T. J., & Stewart, J. M. 1982, AJ, 87, 1819Lucas, P. W., & Roche, P. F. 2000, MNRAS, 314, 858Luhman, K. L., Rieke, G. H., Young, E. T., Cotera, A. S., Chen, H., Rieke, M. J.,Schneider, G., & Thompson, R. I. 2000, ApJ, 540, 1016
Mathis, J. S. 1990, ARA&A, 28, 37McCaughrean, M., & Gezari, D. 1991, in ASP Conf. Ser. 14, Astrophysics withInfrared Arrays, ed. R. Elston (San Francisco: ASP), 301
McCaughrean, M. J., Rayner, J., Zinnecker, H., & Stauffer, J. 1996, in Disksand Outflows around Young Stars, ed. S. Beckwith, J. Staude, A. Quetz, &A. Natta (Berlin: Springer), 33
McCaughrean, M. J., & Stauffer, J. R. 1994, AJ, 108, 1382McCullough, P. R., Fugate, R. Q., Christou, J. C., Ellerbroek, B. L., Higgins,C. H., Spinhirne, J. M., Cleis, R. A., & Moroney, J. F. 1995, ApJ, 438, 394
Meaburn, J. 1988, MNRAS, 233, 791
ROBBERTO ET AL.1562 Vol. 129

Menten, K. M., & Reid, M. J. 1995, ApJ, 445, L157Mezger, P. G., Wink, J. E., & Zylka, R. 1990, A&A, 228, 95Muench, A. A., Lada, E. A., Lada, C. J., & Alves, J. 2002, ApJ, 573, 366Ney, E. P., & Allen, D. A. 1969, ApJ, 155, L193O’Dell, C. R. 2001a, ARA&A, 39, 99———. 2001b, PASP, 113, 29O’Dell, C. R., & Doi, T. 2003a, AJ, 125, 277———. 2003b, AJ, 125, 2753O’Dell, C. R., & Wen, Z. 1994, ApJ, 436, 194O’Dell, C. R., Wen, Z., & Hu, X. 1993, ApJ, 410, 696O’Dell, C. R., & Wong, K. 1996, AJ, 111, 846O’Dell, C. R., & Yusef-Zadeh, F. 2000, AJ, 120, 382Panagia, N. 1975, A&A, 42, 139Preibisch, T., Balega, Y., Hofmann, K., Weigelt, G., & Zinnecker, H. 1999,NewA, 4, 531
Prosser, C. F., Stauffer, J. R., Hartmann, L., Soderblom, D. R., Jones, B. F.,Werner, M. S., & McCaughrean, M. J. 1994, ApJ, 421, 517
Rieke, G. H., & Lebofsky, M. J. 1985, ApJ, 288, 618Rieke, G. H., Low, F. J., & Kleinmann, D. E. 1973, ApJ, 186, L7Rinehart, S. A., Hayward, T. L., & Houck, J. R. 1998, ApJ, 503, 415Robberto, M., Beckwith, S. V. W., & Panagia, N. 2002, ApJ, 578, 897Robberto, M., & Herbst, T. M. 1998, Proc. SPIE, 3354, 711Robberto, M., Song, J., Mora Carrillo, G., Beckwith, S. V. W., Makidon, R. B.,& Panagia, N. 2004, ApJ, 606, 952
Roche, F. P., & Aitken, D. K. 1984, MNRAS, 208, 481Rodrıguez-Franco, A., Martın-Pintado, J., & Wilson, T. L. 1999a, A&A, 344,L57
———. 1999b, A&A, 351, 1103Rosado, M., de la Fuente, E., Arias, L., Raga, A., & Le Coarer, E. 2001, AJ,122, 1928
Schmid-Burgk, J., Gusten, R., Mauersberger, R., Schulz, A., & Wilson, T. L.1990, ApJ, 362, L25
Scoville, N., Kleinmann, S. G., Hall, D. N. B., & Ridgway, S. T. 1983, ApJ,275, 201
Shuping, R. Y., Morris, M., & Bally, J. 2004, AJ, 128, 363Sloan, G. C., Hayward, T. L., Bregman, J. D., & Allamandola, L. J. 1996,BAAS, 28, 1417
Smith, N., Bally, J., Shuping, R. Y., Morris, M., & Hayward, T. L. 2004, ApJ,610, L117
Stahler, S. W., Palla, F., & Ho, P. T. P. 2000, in Protostars and Planets IV, ed. V.Mannings, A. P. Boss, & S. S. Russell (Tucson: Univ. Arizona Press), 327
Strom, K. M., Strom, S. E., Edwards, S., Cabrit, S., & Skrutskie, M. F. 1989,AJ, 97, 1451
Tan, J. C. 2004, in ASP Conf. Ser. 323, Star Formation in the InterstellarMedium, ed. D. Johnstone, F. C. Adams, D. N. C. Lin, D. A. Neufeld, &E. C. Ostriker (San Francisco: ASP), 249
Varosi, F., & Gezari, D. Y. 1993, in ASP Conf. Ser. 52, Astronomical DataAnalysis Software and Systems II, ed. R. J. Hanisch, R. J. V. Brissenden, &J. Barnes (San Francisco: ASP), 393
Weaver, R., McCray, R., Castor, J., Shapiro, P., & Moore, R. 1977, ApJ, 218,377
Werner, M. W., Dinerstein, H. L., & Capps, R. W. 1983, ApJ, 265, L13Whittet, D. C. B., Bode, M. F., Longmore, A. J., Adamson, A. J., McFadzean,A. D., Aitken, D. K., & Roche, P. F. 1988, MNRAS, 233, 321
Wilson, T. L., Gaume, R. A., Gensheimer, P., & Johnston, K. J. 2000, ApJ, 538,665
Wynn-Williams, C. G., Genzel, R., Becklin, E. E., & Downes, D. 1984, ApJ,281, 172
Zapata, L. A., Rodrıguez, L. F., Kurtz, S. E., O’Dell, C. R., & Ho, P. T. P. 2004,ApJ, 610, L121
Ziurys, L. M., Martin, R. N., Pauls, T. A., & Wilson, T. L. 1981, A&A, 104,288
Ziurys, L. M., Wilson, T. L., & Mauersberger, R. 1990, ApJ, 356, L25
ORION NEBULA IN MID-INFRARED 1563No. 3, 2005


![Scattered Nebular Lightin theExtended Orion Nebula · 2018-10-27 · arXiv:0909.0538v1 [astro-ph.GA] 2 Sep 2009 Scattered Nebular Lightin theExtended Orion Nebula 1 C. R. O’Dell](https://static.fdocuments.in/doc/165x107/5f92bc6e796fc824033aa576/scattered-nebular-lightin-theextended-orion-nebula-2018-10-27-arxiv09090538v1.jpg)