THE ORIFICE PLATE DISCHARGE COEFFICIENT EQUATION - THE … · 2019-03-20 · THE ORIFICE PLATE...
23
• • • • THE ORIFICE PLATE DISCHARGE COEFFICIENT EQUATION - THE EQUATION FOR ISO 5167-1 M J Reader-Harris and J A Sattary National Engineering Laboratory, East Kilbride, Glasgow SUMMARY This report describes the final work undertaken to achieve the equation which is being balloted in ISOrrC 30/SC 2 for inclusion in ISO 5167-1. It is described as the Agreed Equation since it has the support of the ISOrrC 28 delegation. It includes a description of the work done to check that a change in the expansibility equation would not have a significant effect on discharge coefficient equations fitted to the database.
Transcript of THE ORIFICE PLATE DISCHARGE COEFFICIENT EQUATION - THE … · 2019-03-20 · THE ORIFICE PLATE...

•
•
•
•
THE ORIFICE PLATE DISCHARGE COEFFICIENT EQUATION -THE EQUATION FOR ISO 5167-1
M J Reader-Harris and J A Sattary
National Engineering Laboratory, East Kilbride, Glasgow
SUMMARY
This report describes the final work undertaken to achieve the equation which is being
balloted in ISOrrC 30/SC 2 for inclusion in ISO 5167-1. It is described as the Agreed
Equation since it has the support of the ISOrrC 28 delegation. It includes a description of the
work done to check that a change in the expansibility equation would not have a significant
effect on discharge coefficient equations fitted to the database.

I
• CONTENTS
NOTATION 2
I INTRODUCTION 3
2 THE DATABASE : :..:: - :: : : :" : :..... 4
3 THE AGREED EQUATION 4
• 3.1 The Tapping Terms 43.2 The Small Pipe Diameter Term 53.3 The Coo and Slope Terms 53.4 The Complete Equation 6
4 QUALITY OF FIT 7
5 COMPARISON BETWEEN EQUATIONS ON THE BASIS OFDEVIATIONS 7
6 THE EFFECT OF THE EXPANSIBILITY EQUATION 7
• 7 CONCLUSIONS 10
ACKNOWLEDGEMENTS 10
REFERENCES 10
LIST OF TABLES 12
LIST OF FIGURES 12
•
Downstream tapping term •
NOTATION •A Function of orifice Reynolds number (see equation (3))
C Orifice discharge coefficient
C, Orifice discharge coefficient using corner tappings
C, Dependence of C; on Reynolds number
Coo C, for infinite Reynolds number forD ~ 71.12 nun (2.8 inch)
ACD Small pipe diameter term
AC~p Upstream tapping term
D Pipe diameter
d Orifice diameter
L I Quotient of the distance of the upstream tapping from the upstream face of theplate and the pipe diameter
L2' Quotient of the distance of the downstream tapping from the downstream face ofthe plate and the pipe diameter
Quotient of the distance of the downstream tapping from the downstream face ofthe plate and the dam height (as in equation (3)) •ReD Pipe Reynolds number
s Standard deviation of the data in the database about an equation
~ Diameter ratio
1:] Expansibility referred to upstream conditions
•2

•
•
•
•
1 INTRODUCTION.-
Although the orifice plate is the recognized flowmeter for the measurement of natural gas andlight hydrocarbon liquids, the orifice discharge coefficient equation in use in the internationalstandard ISO 5167-1: 1991 (I) is based on data collected more than 50 years ago. Moreover,for many years the United States and Europe have used different equations, a discrepancywith serious consequences for the oil and gas industry since many companies aremultinational. Europe uses the Stolz Equation in ISO 5167-1: 1991 which was previously inISO 5167: 1980. The United States used the Buckingham Equation''" until the Reader-Harris/Gallagher (RG) Equation (see Reference 3 and below) was adopted in 1990.
The Buckingham equation is based on the data collected by Beitler in the early 1930s at theOhio State University Engineering Experimental Station(4). Stoli5) used 303 points from theOhio State University data together with a table of flow coefficients from ISOIR 541(6). TheISOIR 541 table was established by the German VDI and is based on original data of Wittewhich are no longer available.
To resolve discrepancies between equations data on orifice plate discharge coefficients werecollected in Europe and the United States over more than ten years in order to provide a newdatabase from which an improved discharge coefficient equation could be obtained whichwould receive international acceptance.
In November 1988 a joint meeting of API (American Petroleum Institute) and EEC flowmeasurement experts in New Orleans accepted an equation derived by NEL (7). At that timethe database contained II 346 points, collected in pipes whose diameters ranged from 50 to250 mm (2 to 10 inch); 600 mm (24 inch) data were being collected but had not yet beenincluded in the database. 600 mm data have since been collected in gas and in water andextend the database both in pipe diameter and in Reynolds number.
The data which were least well fitted by the equation presented at New Orleans were the50 mm data, and following the meeting the American standard API 2530 was revised toinclude the Reader-Harris/Gallagher (RG) Equation based on the NEL equation accepted atNew Orleans with an additional term proposed by Gallagher for pipes whose diameter liesbelow 71.12 mm (2.8 inch). Since there was no physical explanation for the additional termfor small pipe diameter, additional data were collected in 50 mm pipe in water and oil andincluded in the database. Measurements by NEL of the edge radius of the plates used inEuropean tests showed that orifices whose diameter is less than 50 mm tend to have edgeradii outside those permitted by ISO 5167-1. An equation was therefore derived whichincluded an additional term for small orifice diameter rather than one for small pipe diameter,and it was put forward in a report to EC BCR numbered PRI4(B). It is also described inpapers at the North Sea Flow Measurement Workshop in 1992(9)and in Flow Measurementand Instrurnentation(IO).
However, neither this equation nor the attempt at compromise put forward at a meeting ofISOITC 30 in Paris in 1993 were acceptable to the ISOITC 28 delegation. It was consideredby the ISOITC 28 delegation that the PRI4 Equation gave an insufficiently good fit to thedata collected in 75 mm (3-inch) pipes, and their need was for an equation which was of thesame form as the RG Equation in API MPMS 14.3: 1990(J) for ReD ~ 4000; only the
3

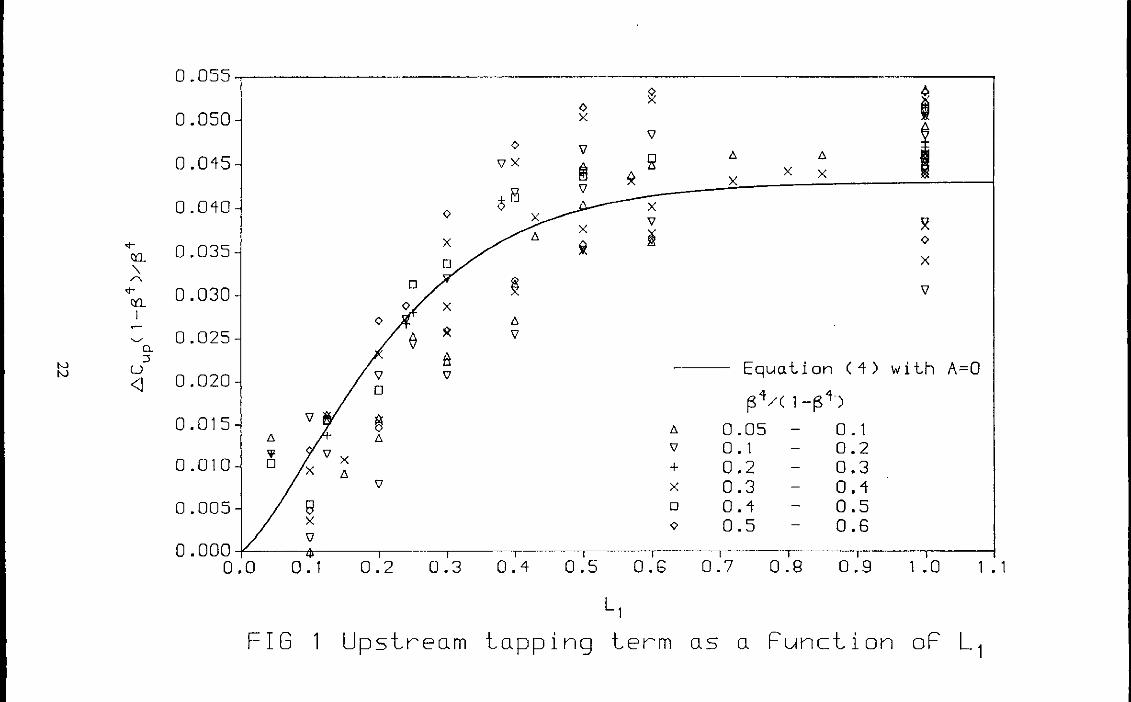
For high Reynolds numbers the tapping terms are identical in form to those obtained inderiving the PRI4 Equation based on the enlarged database. Therefore, the coefficients CJ, Cz,
C4, and C5 and the exponents]; (i=1,4), in the tapping terms for high Reynolds number aretaken to be the same as those in the PR14 Equation(s,\O),except that it was found that theoverall fit to the database was improved by making C2 = 0.08 instead of 0.09. (The upstreamtapping term for high Reynolds number is plotted in Figure 1 on the same basis as inReferences 8, <) and 10.) Moreover, when the tapping terms for lower Reynolds numbers forthe PR14 Equation were derived it was found that the dependence of the sum ofthe tapping •
constants and exponents might be changed to give the best fit to the final database. •Moreover, measurements by SwRl of the orifice edge radius for the orifice.plates used in50 mm pipe were smaller than those made by NEL. Since one of the principal objectives ofthe last fourteen years of work was to obtain a common equation for use worldwide, anequation of the form of the RG Equation has been derived and is presented here. It is beingbaLlotted in ISOIIC 30/SC 2 for inclusion in ISO 5167-1. It is described here as the AgreedEquation since it has the support of the ISOITC 28 Delegation. Given the definition that s isthe standard deviation of the data in the database about an equation, the value of s for theAgreed Equation is very similar to the value of s for the PRI4 Equation.
2 THE DATABASE
In addition to the database used for deriving the PRI4 orifice plate discharge coefficientequation in 1992 an additional 146 points have been added: these are from SwRl, Texas'{";their inclusion makes essentially no difference to the final fitted equation.
3 THE AGREED EQUATION •As stated in the Introduction the Agreed Equation had to be of the same form as that of theRG Equation for Re D ~ 4000 with only the constants and exponents changed.
3.1 The Tapping Terms
The form of the upstream and downstream tapping terms, ACup and ACdown, in the RGequation (and also in the NEL equation for New Orleans described in Reference 7) is asfollows:
(1)
and
(2) •where
A = (1900013)°.8 and M; = 2L,Rev 1- ~
(3)
4

•
•
•
•
terms on ReD for ReD~ 4000 could be expressed by making ll.Cup alone a function of ReD.When determining the values of C3 and C6 to give the best fit of the form of the completeAgreed Equation to the database it was found that to permit a non-zero value of C6 gives anegligible reduction in the standard deviation of the data about the equation. With C6 = 0 thebest-fit value of C3 was 0.11. So that a good fit for the complete database (including data forReD < 4000) should still be obtained it is necessary to include an additional term in ll.Cdown
for ReD5. 3700 identical to that in the PR14 Equation. Therefore, the final tapping terms aregiven by
ll.Cup= (O;043+0.080e-.'·OL,- O.l23e-7L,)(l-O.lIA)Jt..1- ~
(4)
and
, '1.1 JJll.Cdo~ =-0.031(M, -0.8M, ){1+8max(loglO(37001 ReD)'O.O)}~ (5)
3.2 The Small Pipe Diameter Term
Instead of a small orifice diameter term the RG Equation uses a small pipe diameter term,ll.CD,of the following form:
ll.CD= ~ (II, - ~)max( h, - D I 25.4,0.0). (D : mm) (6)
The form of this term has no known physical basis (although the requirement for the termmay be due to the edge radius of the orifice plates used in the 50 mm pipes), but the termgives a good fit to the database: C was larger in 50 mm pipes than in larger pipes even withcomer and D and DI2 tappings. Since there are essentially only discrete values of D in thedatabase h3 cannot be determined: following the RG Equation the value of h3 was taken to be2.8 inch (71.12 mm), 0.1 inch (2.54 mm) smaller than the internal diameter for 3-inchschedule 80 pipe. The quality of fit to the complete database improves as h2 reduces to 0.75,the smallest value which ensures that this term does not become negative over the permissiblerange of use. If (h2 - ~) were replaced by max(h2 - ~, 0) then the best fit is obtained with h2equal to 0.7, but the improvement in fit is very small and the equation significantly differentfrom the RG Equation and also more complicated. With h2 = 0.75 hi was determined byfitting the complete database and is equal to 0.011. Therefore, the small pipe diameter term isgiven by
ll.CD= 0.Dl1(0.75 - ~ )max(2.8 - D I 25.4,0.0). (D (7)mm)
3.3 The C. and Slope Terms
The C. and slope terms are of exactly the same form in the RG and in the PRI4 Equationsand so in the Agreed Equation are of the following form:
C; +C, =al +a2~'\ +a3~'" +bl(l06~1 ReD)"'
+(b, + b3A)~ "max ltl O" I ReD)"' ,gl - g,(RelJ 1I06)}(8)
5

C = Oj961 +0.0261/32 - 0.216/38
+0.000521(10613 / Re D)O.7
+(0.0188+ 0.0063A)/33.5max{(106 / ReD)O.3, 22.7-4700(ReD / 106)}4
+(0.043+0.080e-IOLI-O.l23e-7LI)(I-O.llA)~ (10)1-/3
, 'II I 3-0.031(M2 - 0.8M2· ){1 + 8max(loglo(3700/ ReD),O.O)}/3 .
•
The exponents used for the PRI4 Equation were used for the final equation with the •exception that m) was taken to be 2 since this value is used in the RG Equation and gives abetter fit to the complete database. With ml' m2, I, nl and n2 given by 2, 8, 3.5, 0.7 and 0.3,respectively, the tapping terms given in equations (4) and (5) and the small pipe diameterterm given in equation (7) the optimum values of the constants in equation (8) weredetermined and the following equation obtained:
C~+ C, = 05961 + 0.0261132- 0.216/38
+0.000521(10613 / ReD )07 (9)
+(0.0188 + 0.0063A)/33S max'[Il O"!ReDt\22:7 - 4700(ReD / 106)}
3.4 The Complete Equation
Therefore, the complete orifice plate discharge coefficient equation is as follows:
+0.011(0.75- /3)max(2.8 - D / 25.4,0.0). (D : mm)
For ReD L 4000 this equation can be written as follows:
For D ~71.12 mm (2.8 inch)
C = 05961 + 0.0261132 - 0.216/38
+0.000521(106/3 f ReD)o.7 + (0.0188 + 0.0063A)/33.5(1 06 / ReD)O.34
+(0.043 + 0.080e-IOLI - 0.123e-7LI )(1- O.lIA)~1-/3
•(lla)
Where D < 71.12 mm (2.8 inch) the following term should be added to equation (I I a):
+0.011(0.75 - /3)(2.8 - ~).25.4
(D : rnm) (II b)
Equation (II), comprising equation (11 a) with the additional term (II b), is the AgreedEquation. •
6

7
.,
• The notation ofISO 5167-1 has been used with the following additions:
(19000~)O.8 ,2~
A = and M2 = --.ReD I-~
4 QUALITY OF FIT
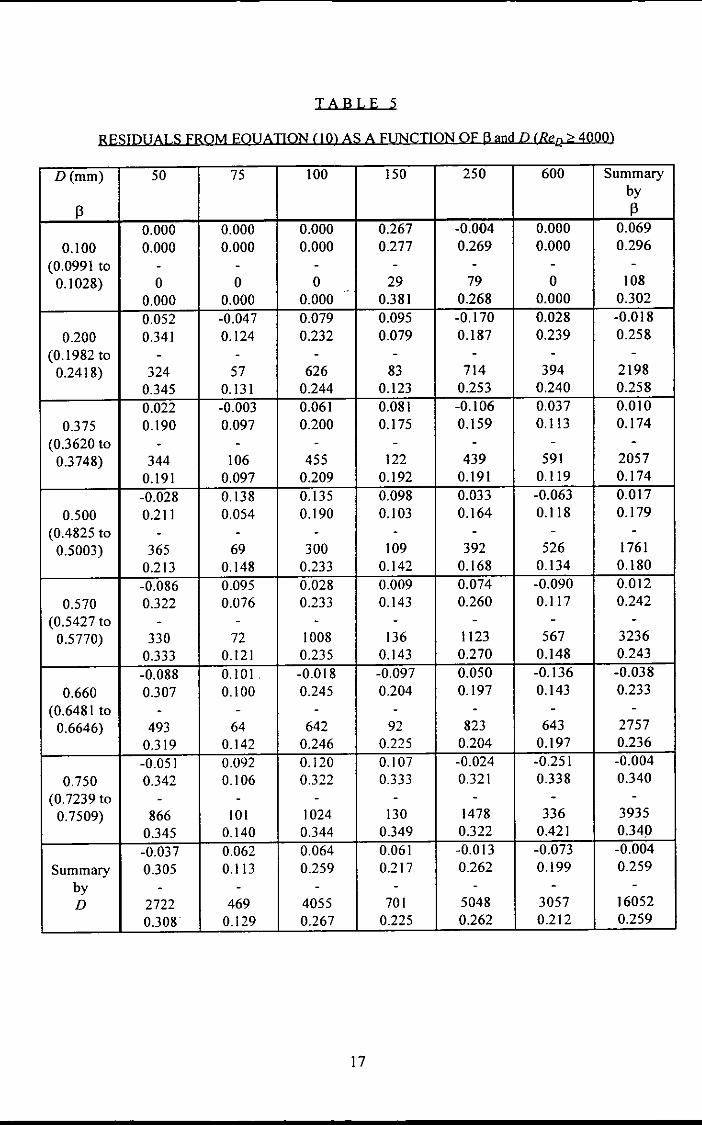
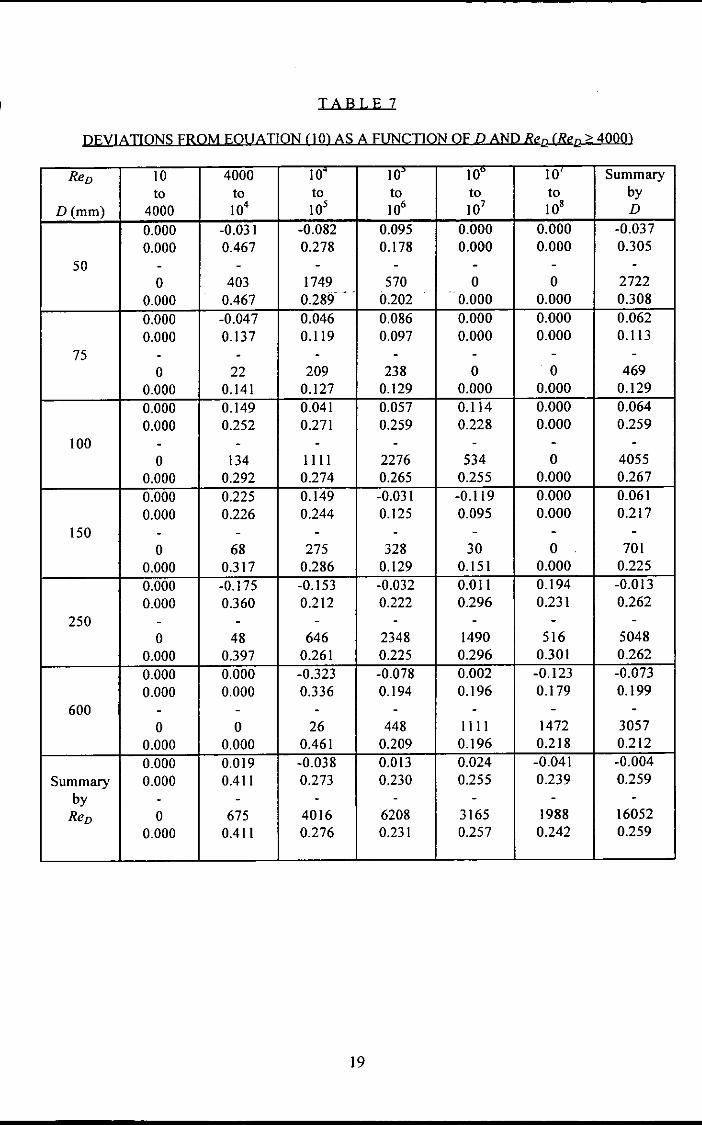
The quality of the fit of equation (10) to the database is very good: the overall standarddeviation of the data for ReD 24000 about the equation is 0.259 per cent; the mean deviationsof the data about the equation as a function of'~, D, ReD and pair of tappings used and ofpairs of these independent variables are both small and well-balanced.
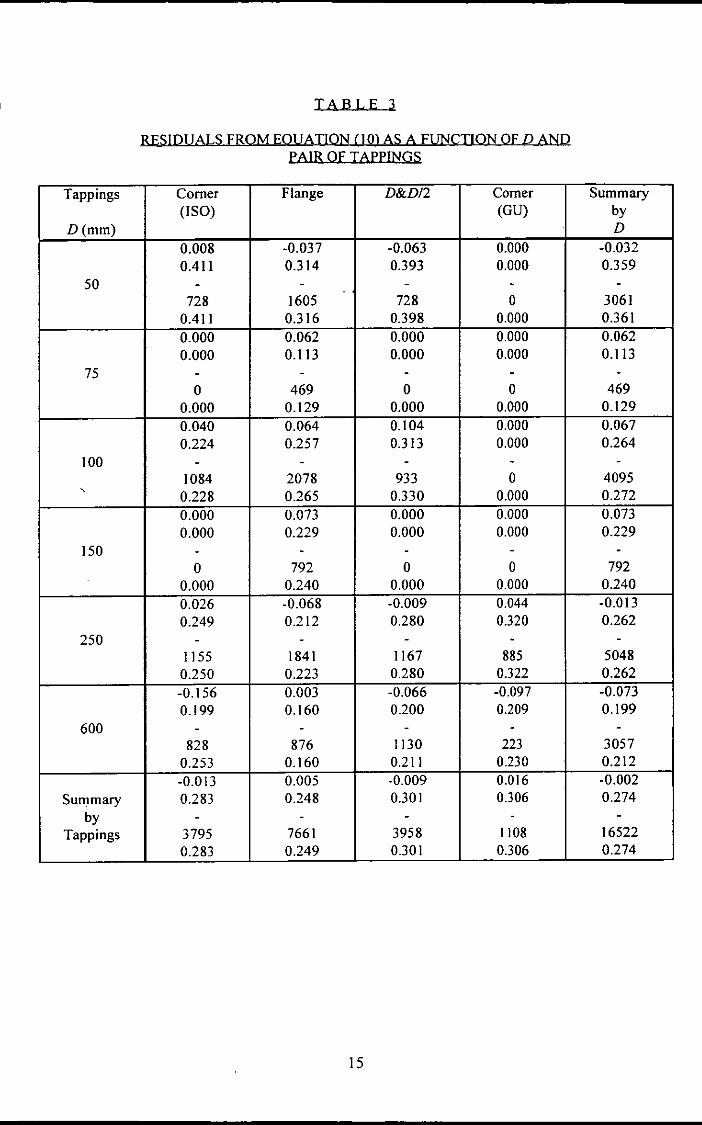
•The quality of fit is quantified in Tables I to 8. Table I gives a description of the meaning ofthe different lines in Tables 2 to 8. These tables give the deviations of the data in thedatabase about the equation as a function of B,D, ReD and pair of tappings used and certaincombinations of these. The range of values of ~ corresponding to each nominal value of ~ isgiven in Table 2. The tappings described as Comer (GU) are tappings in the comers whichwere designed by Gasunie and are simpler to make than those in ISO 5167-1. They aredescribed in Reference 12. The database used is the complete EEC/API database as describedexcept that data with ReD < 4000 were excluded in Tables 5 to 8.
5 COMPARISON BETWEEN EQUATIONS ON THE BASISOF DEVIATIONS
•
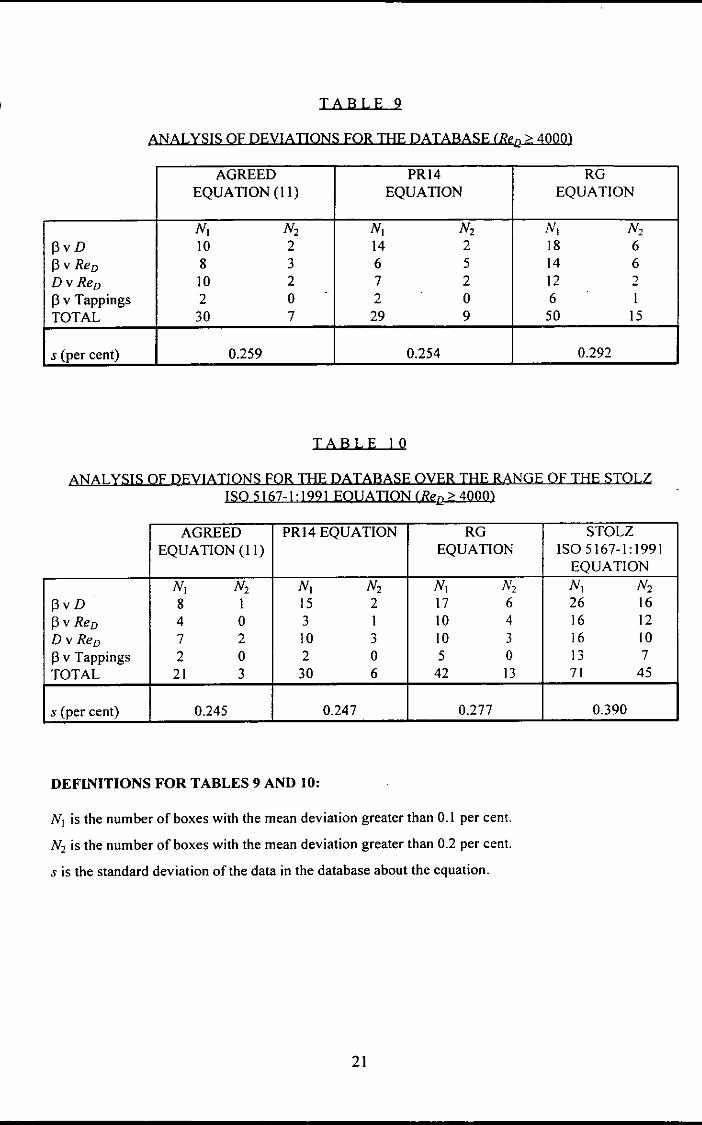
A direct comparison between equation (II) and the RG and PRI4 Equations for ReD 24000is given here. To do this the data in Table 5 (and similar tables of deviations on the basis ofD and ~ for the other equations) were analysed: the number of boxes (ranges of D and ~) overwhich an equation gave a mean deviation greater than 0.1 per cent was counted and is givenin Table 9; the number of boxes for which the mean deviation was greater than 0.2 per centwas also counted and is given in Table 9. A similar count was undertaken for Tables 6 - 8and the results are also given in Table 9. These figures provide a measure of possible bias inan equation. The standard deviation of the data about each equation is also given as ameasure of the quality of fit. The quality of fit for the Agreed Equation is similar to that ofthe PR 14 Equation. They are both better than the RG Equation.
Since the Stolz Equation in ISO 5167-1: 1991 is applicable over a more limited range ofvalues of ReD and ~ than the three equations previously considered, the standard deviationand the number of boxes with mean deviations greater than 0.1 or 0.2 per cent are given inTable 10 for all four equations over the range of applicability of the Stolz ISO 5167-1: 1991Equation. The need for an improved equation even over the limited range of ReD and ~ isobvious.
6 THE EFFECT OF THE EXPANSIBILITY EQUATION
•Since doubt has been expressed regarding the accuracy of the expansibility equation used fororifice plates in ISO 5167-11 (see Kinghorn'{" and Seidl(14)) it has been suggested that thenew discharge coefficient equation given in equation (10) and others based on the samedatabase may have been significantly affected by errors in the discharge coefficient data

•
caused by errors in the expansibility, El> since the value of £} given in Section 8.3.2.2 ofISO •5167-1: I 991 was used in the computation of discharge coefficient.
In order to test this theory, for each point of the database the value of discharge coefficientwhich would have been obtained if an alternative equation for E} had been used wascalculated and the equation refitted. If the value of discharge coefficient given in the databaseis termed C" based on the expansibility given by the equation in Section 8.3.2.2 ofISO 5167" 1: 1991, E} I> then CN' the value of discharge coefficient based on an alternativevalue of expansibility, &},N, is given by
(12)
where4 !lp
&11 =1-(0.41+0.35~ )-., KJ1)
(13)
Where the value of I:IJ is given in the database it is possible to calculate K using the values of~, Sp and p} and then to calculate E},N' Where &}J is not given in the database it is necessary,in the first instance, to estimate what value of K might have been used on tile basis of otherdata; if it were shown to be the case that the discharge coefficient equation fitted to CN
differed significantly from that fitted to C1 it would be necessary to obtain better values for K.
•The only sets of gas data for which &}l was not provided in the database were those fromSwRl and Ruhrgas. For SwRI the downstream expansion factor.Fj, (see Reference 3) wasprovided but not &l.l' So for SwRI and Ruhrgas values for x of 1.41 and 1.32, respectively,were used: 1.41 is appropriate for nitrogen; 1.32 is a typical value for natural gas.
Three alternative equations for &} N were used: they were as follows:
(14)
•4 Sp1:) N 2 = 1-(0.352+0.433~ )-,
, , KjJI(15)
and4 D.p
&)N3=1-(0.357+0.557~ )-., , KjJI
(16)
I:} N} and E} N 2 were taken from equations (9) (rounded as in the conclusions of the paper) and(10) ofKinghorn(13) and I:} N3 was taken from equation (8) (the recommended equation) ofSeidl(14). ' ,
8
CrJ = 0.59615 + 0.0260913 2 - 0.2167513' + 0.0005216(10'13 I ReD)'7
+(0.01874+ 0.00607IA)13'5 max{(10' I ReD)", 22.7 -4700(ReD 1I0')}
+0.01101(0.75-13 )max(2.8 - DI 25.4,0.0). (D:mm) (21)
• Calculating CN.i on the basis of El.N.i for ;=1,3 and using the tapping terms given in equations(4) and (5), the sum of the C_, C,and /';CD terms, CI:, was refitted as follows:
C, = C; + C, + /';CD = al +a2132 +a,13'
+MIO'13 I ReD)" +(b2 +b,A)13'·5 max {(I0' I ReD)'.3, 22.7 -4700(ReD 11O')} (17)
+h(0.75-13 )max(2.8- DI 25.4,0.0). (D:mm)
In each case the standard deviation of the data in the database about the equation, s, thenumber of points which are shifted by more than 0.2 per cent, N., and the largest magnitudeof shift, SM, were calculated. The results were as foHows:
•C'.N.I = 0.59590 + 0.02638132 - 0.2179413' + 0.0005288(10'13 I ReD)"
+(0.01904 + 0.005864A)13'5 max{(IO' I ReD)o" 22.7 - 4700(ReD 1I0')}
+0.01135(0.75 -13 )max(2.8 - D I 25.4,0.0). (D:mm) (18)
SN.I = 0.0016775; N,.I = 191; SM.I = 0.98 per cent.
C, N 2 = 0.59591 + 0.02645132 - 0.2177813' + 0.0005286(10'13 I ReDt'+(0.01895 + 0.005894A)13 Jj max {(I0' I ReD)°.3,22.7 - 4700(ReD 1I0')}
+0.01133(0.75-13 )max(2.8 - DI25.4,0.0). (D:mm) (19)
SN.2 =0.0016768; NS•2 =177; SM.2 =0.85 percent.
C,.N., = 0.59592 + 0.02662132 - 0.2174013' + 0.0005281(10'13 I ReD)"
+(0.01876 + 0.005965A)f3 Jj max{(IO' I ReD)'" 22.7 - 4700(ReD 1I0')}
+0.01129(0.75-13 )max(2.8 - DI 25.4,0.0). (D:mm) (20)
• SN.' = 0.0016784; Ns.' = 139; SM., = 0.76 per cent.
Since small differences between equations were being investigated the constants for CI: withthe same number of decimal places as for CI:.N.iare also required where EI.I was used:
SI = 0.0016747.
The constants in equations (7) and (9) have been rounded and then rebalanced to ensure thatthere is no mean deviation between equation and database.•
9

It can be seen that the differences in s and thus inoverall quality of fit are very small but that •6,,/ gives the best result. Moreover the coefficients in equations (18) - (21) are very similar.The largest value of SMfor equations (18) - (20) occurs for equation (18); however, even inthis case the largest magnitude of difference between the equation and equation (21) is0.04 per cent for any values of B, D and ReD except at the very lowest end of the Reynoldsnumber range (below 4000). Therefore the choice of the expansibility equation has very littleeffect on the discharge coefficient equation and there is no problem inputting equation (11)in ISO 5167-1. However, the choice of expansibility equation has a significant effect both onsome individual data points in the database and when it is used in the field, and it is importantthat the best equation is obtained.
7 CONCLUSIONSThe derivation of the Agreed discharge coefficient equation which is being ballotted inISOIfC 30/SC 2 for inclusion in ISO 5167-1 has been described; it has been shown thatpossible changes to the expansibility equation would have only a small effect on thedischarge coefficient equation. Deviations of the data in the database from the Agreed •equation have been tabulated and a comparison made with deviations from the PRI4, RG andStolz ISO 5167-1: 1991 equations.
I INTERNATIONAL ORGANIZATION FOR STANDARDIZATION. Measurementof fluid flow by means of pressure differential devices - Part 1: Orifice plates, nozzlesand Venturi tubes inserted in circular cross-section conduits running full.ISO 5167-1. Geneva: International Organization for Standardization, 1991.
•
ACKNOWLEDGEMENTSThe work described in this paper was carried out as part of the Flow Programme, under thesponsorship of the DTl's National Measurement System Policy Unit.
This paper is published by permission of the Director and General Manager, NEL.
REFERENCES
2 AMERICAN NATIONAL STANDARDS INSTITUTE. Orifice metering of naturalgas. ANSI!API 2530-1975. New York: American National Standards Institute, 1975.
3 AMERICAN PETROLEUM INSTITUTE. Manual of Petroleum MeasurementStandards, Chapter 14 - Natural Gas Fluids Measurement, Section 3 - Concentric,Square-Edged Orifice Meters, Part 1 - General Equations and Uncertainty Guidelines.MPMS Chapter 14, Section 3, Part 1, 3rd Edition. Washington DC: AmericanPetroleum Institute, 1990.
4 BEITLER, SR. The flow of water through orifices. Bulletin 89. Columbus, Ohio:Ohio State University Engineering Experimental Station, 1935. •
10
•
•
•
•
5 STOLZ, 1. A universal equation for the calculation of discharge coefficients of orificeplates. In Flow Measurement of Fluids, H. H. Dijstelbergen and E. A. Spencer (eds),pp 519-534. North Holland Publishing Company, 1978.
6 INTERNATIONAL ORGANIZATION FOR STANDARDIZATION. Measurementof fluid flow by means of orifice plates and nozzles. ISOIR 541. Geneva:International Organisation for Standardisation, 1967.
7 READER-HARRIS, M. J. and SATTARY, 1. A. The orifice plate dischargecoefficient equation. Flow Measurement and Instrumentation, I, 67-76, 1990.
8 READER-HARRIS, M. J., SATTARY, J. A. and SPEARMAN, E. P. The orificeplate discharge coefficient equation. Progress Report No PRI4: EUECI17 (EEC005).East Kilbride, Glasgow: National Engineering Laboratory Executive Agency, 1992.
9 READER-HARRIS, M. J., SATTARY, J. A., and SPEARMAN, E. P. The orificeplate discharge coefficient equation - further work. In Proc. of North Sea FlowMeasurement Workshop, Peebles, ppr 1.1, Oct 1992. East Kilbride, Glasgow:National Engineering Laboratory Executive Agency.
10 READER-HARRIS, M. J., SATTARY, 1. A., and SPEARMAN, E. P. The orificeplate discharge coefficient equation - further work. Flow Measurement andInstrumentation, Vol 6, pp 101-114, 1995.
11 MORROW, T. B. and PARK, J. T. Baseline conditions for orifice meter calibration.Report GRl-92/0097. Chicago, Illinois: Gas Research Institute, 1992 (as amended byErrata, 1993).
12 HOBBS, J. M., SATTARY, J. A. and MAXWELL, A. D. Experimental data for thedetermination of 250 mm orifice meter discharge coefficients under differentinstallation conditions (European programme). Report EUR 10980. Brussels,Belgium: Commission of the European Communities, 1987.
13 KINGHORN, F. C. The expansibility correction for orifice plates: EEC data. InProc. Flow Measurement in the mid 80s, Paper 5.2. East Kilbride, Glasgow: NationalEngineering Laboratory, 1986.
14 SEIDL, W. The orifice expansion correction for a 50mrn line size at various diameterratios. In Proc. 3rd Int. Symp. on Fluid Flow Measurement, San Antonio, Texas,1995.
11
•
LIST OF TABLES •1 General information about the analysis of deviations in Tables 2 to 8
2 Residuals from Equation (10) as a function of 13 and D
3 Residuals from Equation (10) as a function of D and pair oftappings
4 Residuals from Equation (10) as a function of 13 and Re D
5 Residuals from Equation (10) as a function of 13 and D (ReD:::: 4000)
6 Residuals from Equation (10) as a function of p and ReD (ReD:::: 4000)
7 Residuals from Equation (10) as a function of D and ReD (Rev ~ 4000)
8 Residuals from Equation (10) as a function of p and pair of tappings (Rev:::: 4000) •9 Analysis of deviations for the database (Rev:::: 4000)
10 Analysis of deviations for the database over the range of the Stolz ISO 5167-1: 1991Equation (Rev ~ 4000).
LIST OF FIGURES
I Upstream tapping term as a function of LI.
•12
13
.
• TABLE I
GENERAL INFORMATION ABOUT THE ANALYSIS OF DEVIATIONSIN TABLES 2 TO 8
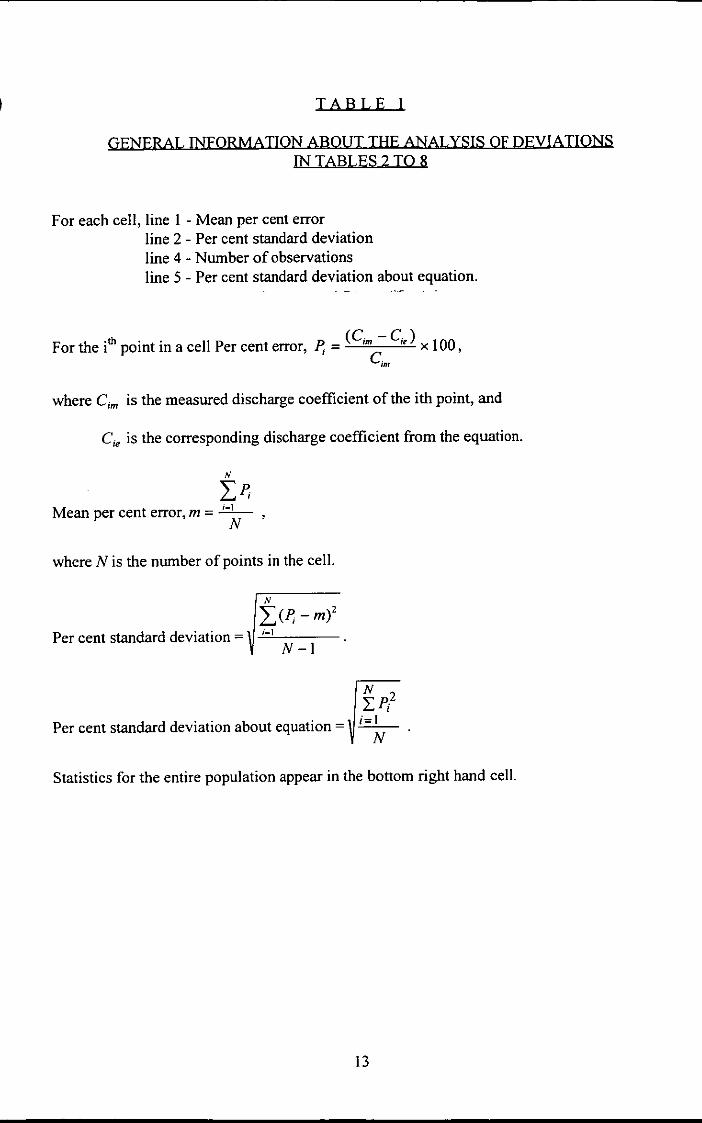
For each cell, line I - Mean per cent errorline 2 - Per cent standard deviationline 4 - Number of observationsline 5 - Per cent standard deviation about equation.
th·th .. II P (C - C )For e 1 point mace Per cent error, ,= ,no " X 100,c:• where e,m is the measured discharge coefficient of the ith point, and
Cie is the corresponding discharge coefficient from the equation.
NIp,Mean per cent error, rn = ~ ,
N
where N is the number of points in the cell.
N
I(p, - rn)2Per cent standard deviation = 11-"-0'-' _
~ N-I
• 2
Per cent standard deviation about equation = .
Statistics for the entire population appear in the bottom right hand cell.
•
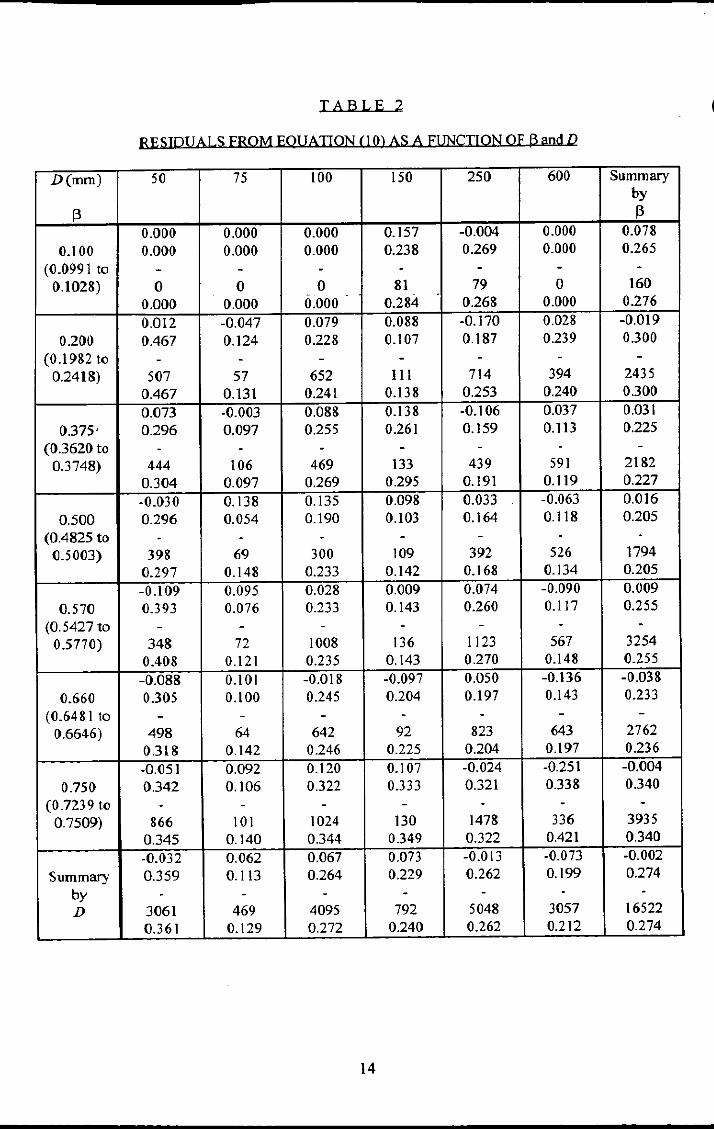
TABLE 2
RESIOU ALS FROM EOUATION () 0) AS A FIJNCTION OF 6 and D
D(mm) 50 75 100 150 250 600 Summaryby
13 130.000 0.000 0.000 0.157 -0.004 0.000 0.Q78
0.100 0.000 0.000 0.000 0.238 0.269 0.000 0.265(0.0991 to - - - - - - -. 0.1028) 0 0 0 81 79 0 160
0.000 0.000 0.000 0.284 0.268 0.000 0.2760.012 -0.047 0.079 0.088 -0.170 0.028 -0.019
0.200 0.467 0.124 0.228 0.107 0.187 0.239 0.300(0.1982 to - - - - - - -0.241&) 507 57 652 111 714 394 2435
0.467 0.131 0.241 0.138 0.253 0.240 0.3000.073 -0.003 0.088 0.138 -0.106 0.037 0.031
0.375' 0.296 0.097 0.255 0.261 0.159 0.113 0.225(0.3620 to · - - - - . -0.3748) 444 106 469 133 439 591 2182
0.304 0.097 0.269 0.295 0.191 0.119 0.227·0.030 0.138 0.135 0.098 0.033 -0.063 0.016
0.500 0.296 0.054 0.190 0.103 0.164 0.118 0.205(0.4825 to · - - - - . .0.5003) 398 69 300 109 392 526 1794
0.297 0.148 0.233 0.142 0.168 0.134 0.205-0.1 09 0.095 0.Q28 0.009 0.074 -0.090 0.009
0.570 0.393 0.076 0.233 0.143 0.260 0.117 0.255(0.5427 to - - - . - - -0.5770) 348 72 1008 136 1123 567 3254
0.408 0.121 0.235 0.143 0.270 0.148 0.255-0.088 0.101 -0.018 -0.097 0.050 -0.\36 -0.038
0.660 0.305 0.100 0.245 0.204 0.197 0.143 0.233(0.6481 to - - - - - - -0.6646) 498 64 642 92 823 643 2762
0.318 0.142 0.246 0.225 0.204 0.197 0.236-0.051 0.092 0.120 0.107 -0.024 -0.251 -0.004
0.750 0.342 0.106 0.322 0.333 0.321 0.338 0.340(0.7239 to · - - - . - -0.7509) 866 101 1024 130 1478 336 3935
0.345 0.140 0.344 0.349 0.322 0.421 0.340·0.032 0.062 0.067 0.073 -0.013 -0.073 -0.002
Summary 0.359 0.113 0.264 0.229 0.262 0.199 0.274by · - - - - . .D 3061 469 4095 792 5048 3057 16522
0.361 0.129 0.272 0.240 0.262 0.212 0.274
14
•
•
•
•
•
•
•
•
TABLE 3
RESIDUALS FROM EOUATION (10) AS A FUNCTION OF D ANPPAIR OF TAPPINGS
Tappings Corner Flange D&D/2 Corner Summary(ISO) (GU) by
D(mm) D0.008 -0.037 -0.063 0.000 -0.0320.411 0.314 0.393 0.000 0.359
50 - - - - -728 1605 728 0 30610.411 0.316 0.398 0.000 0.3610.000 0.062 0.000 0.000 0.0620.000 0.113 0.000 0.000 0.113
75 - - - - -0 469 0 0 469
0.000 0.129 0.000 0.000 0.1290.040 0.064 0.104 0.000 0.0670.224 0.257 0.313 0.000 0.264
100 - - - - -1084 2078 933 0 4095
-,0.228 0.265 0.330 0.000 0.2720.000 0.073 0.000 0.000 0.0730.000 0.229 0.000 0.000 0.229
150 - - - - -0 792 0 0 792
0.000 0.240 0.000 0.000 0.2400.026 -0.068 -0.009 0.044 -0.0130.249 0.212 0.280 0.320 0.262
250 - - - - -1155 1841 1167 885 50480.250 0.223 0.280 0.322 0.262-0.156 0.003 -0.066 -0.097 -0.0730.199 0.160 0.200 0.209 0.199
600 - - - - -828 876 1130 223 30570.253 0.160 0.211 0.230 0.212-0.013 0.005 -0.009 0.016 -0.002
Summary 0.283 0.248 0.301 0.306 0.274by - - - - -
Tappings 3795 7661 3958 1108 165220.283 0.249 0.301 0.306 0.274
15
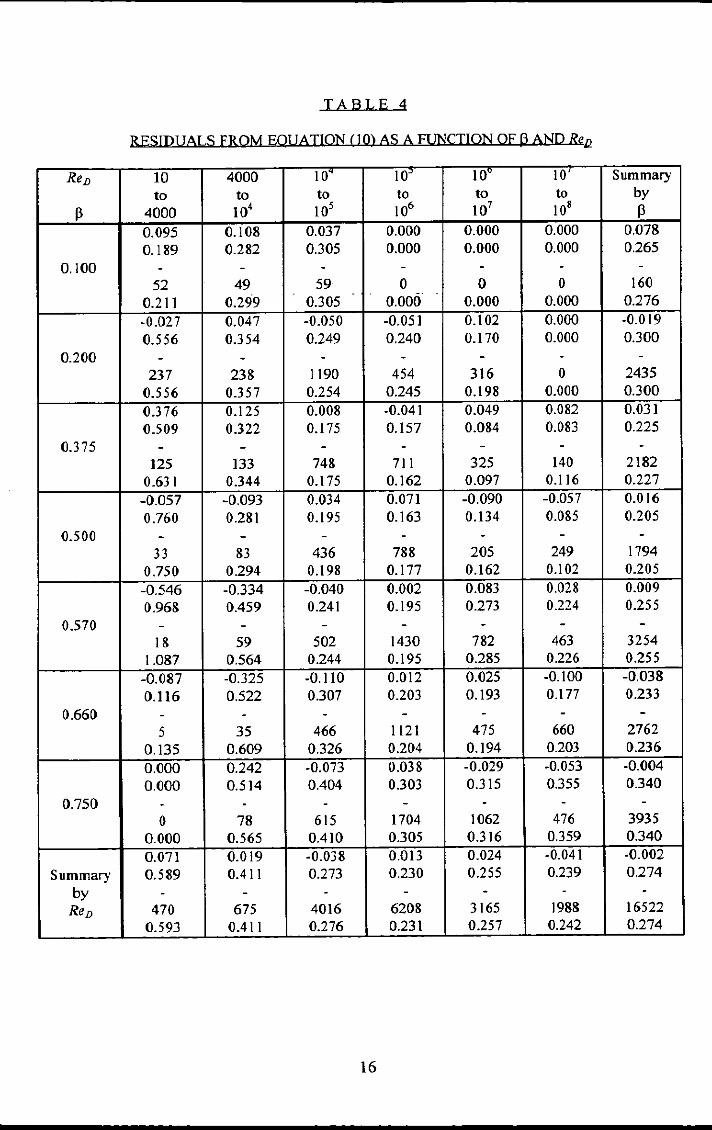
TABLE 4
RESIDUALS FROM EOUATION (]O) AS A FUNCTION OF 13 AND ReQ
ReD 10 4000 \0 W 10 10 Summary
to to to to to to by
13 4000 104 105 106 107 108 130.095 0.108 0.037 0.000 0.000 0.000 Om80.1119 0.2112 0.305 0.000 0.000 0.000 0.265
0.100 - - - - - - -52 49 59 0 0 0 160
0.211 0.299 0.305 0.000 0.000 0.000 0.276-0.027 0.047 -0.050 -0.051 0.102 0.000 -0.0190.556 0.354 0.249 0.240 0.170 0.000 0.300
0.200 - - - - - - -237 238 1190 454 316 0 24350.556 0.357 0.254 0.245 0.198 0.000 0.3000.376 0.125 0.008 -0.041 0.049 0.082 0.0310.509 0.322 0.175 0.157 0.084 0.083 0.225
0.375 - - - - - - -125 133 748 711 325 140 21820.631 0.344 0.175 0.162 0.097 0.116 0.227-0.057 -0.093 0.034 0.071 -0.090 -0.057 0.0160.760 0.281 0.195 0.163 0.134 0.085 0.205
0.500 - - - - - - -33 83 436 788 205 249 1794
0.750 0.294 0.198 0.177 0.162 0.102 0.205-0.546 -0.334 -0.040 0.002 0.083 0.028 0.0090.968 0.459 0.241 0.195 0.273 0.224 0.255
0.570 - - - - - - -18 59 502 1430 782 463 3254
1.087 0.564 0.244 0.195 0.285 0.226 0.255-0.087 -0.325 -0.110 0.012 0.025 -0.100 -0.0380.116 0.522 0.307 0.203 0.193 0.177 0.233
0.660 - - - - - - -5 35 466 1121 475 660 2762
0.135 0.609 0.326 0.204 0.194 0.203 0.2360.000 0.242 -0.073 0.038 -0.029 -0.053 -0.0040.000 0.514 0.404 0.303 0.315 0.355 0.340
0.750 - - - - - - -0 78 615 1704 1062 476 3935
0.000 0.565 0.410 0.305 0.316 0.359 0.3400.071 0.019 -0.038 0.013 0.024 -0.041 -0.002
Summary 0.5119 0.411 0.273 0.230 0.255 0.239 0.274by - - - - - - -ReD 470 675 4016 6208 3165 1988 16522
0.593 0.411 0.276 0.231 0.257 0.242 0.274
16
•
•
•
•
•
•
•
•
TABLE 5
RESIDUALS FROM EOUATION () 0) AS A FUNCTION OF P and 0 (Ren> 4000)
o (mm) 50 75 100 150 250 600 Summaryby
J3 J30.000 0.000 0.000 0.267 -0.004 0.000 0.069
0.100 0.000 0.000 0.000 0.277 0.269 0.000 0.296(0.0991 to - - - - - - -0.\028) 0 0 0 29 79 0 108
"
0.000 0.000 0.000 0.381 0.268 0.000 0.3020.052 -0.047 0.079 0.095 -0.170 0.Q28 -0.018
0.200 0.341 0.124 0.232 0.079 0.187 0.239 0.258(0.1982 to - - - - - - -0.2418) 324 57 626 83 714 394 2198
0.345 0.131 0.244 0.123 0.253 0.240 0.2580.022 -0.003 0.061 0.081 -0.\06 0.037 0.010
0.375 0.190 0.097 0.200 0.175 0.159 0.1 \3 0.174(0.3620 to - - - - - - -0.3748) 344 106 455 122 439 591 2057
0.191 0.097 0.209 0.192 0.191 0.119 0.174-0.028 0.138 0.\35 0.098 0.033 -0.063 0.017
0.500 0.211 0.054 0.190 0.103 0.164 0.118 0.179(0.4825 to - - - - - - -0.5003) 365 69 300 \09 392 526 1761
0.213 0.148 0.233 0.142 0.168 0.\34 0.180-0.086 0.095 0.028 0.009 0.074 -0.090 0.012
0.570 0.322 0.076 0.233 0.143 0.260 0.117 0.242(0.5427 to - - - - - - -0.5770) 330 72 1008 136 1123 567 3236
0.333 0.121 0.235 0.143 0.270 0.148 0.243-0.088 0.101 . -0.018 -0.097 0.050 -0.136 -0.038
0.660 0.307 0.100 0.245 0.204 0.197 0.143 0.233(0.6481 to - - - - - - -0.6646) 493 64 642 92 823 643 2757
0.319 0.142 0.246 0.225 0.204 0.197 0.236-0.051 0.092 0.120 0.107 -0.024 -0.251 -0.004
0.750 0.342 0.106 0.322 0.333 0.321 0.338 0.340(0.7239 to - - - - - - -0.7509) 866 101 1024 130 1478 336 3935
0.345 0.140 0.344 0.349 0.322 0.421 0.340-0.037 0.062 0.064 0.061 -0.013 -0.073 -0.004
Summary 0.305 0.113 0.259 0.217 0.262 0.199 0.259by - - - - - - -D 2722 469 4055 701 5048 3057 16052
0.308 0.129 0.267 0.225 0.262 0.212 0.259
17
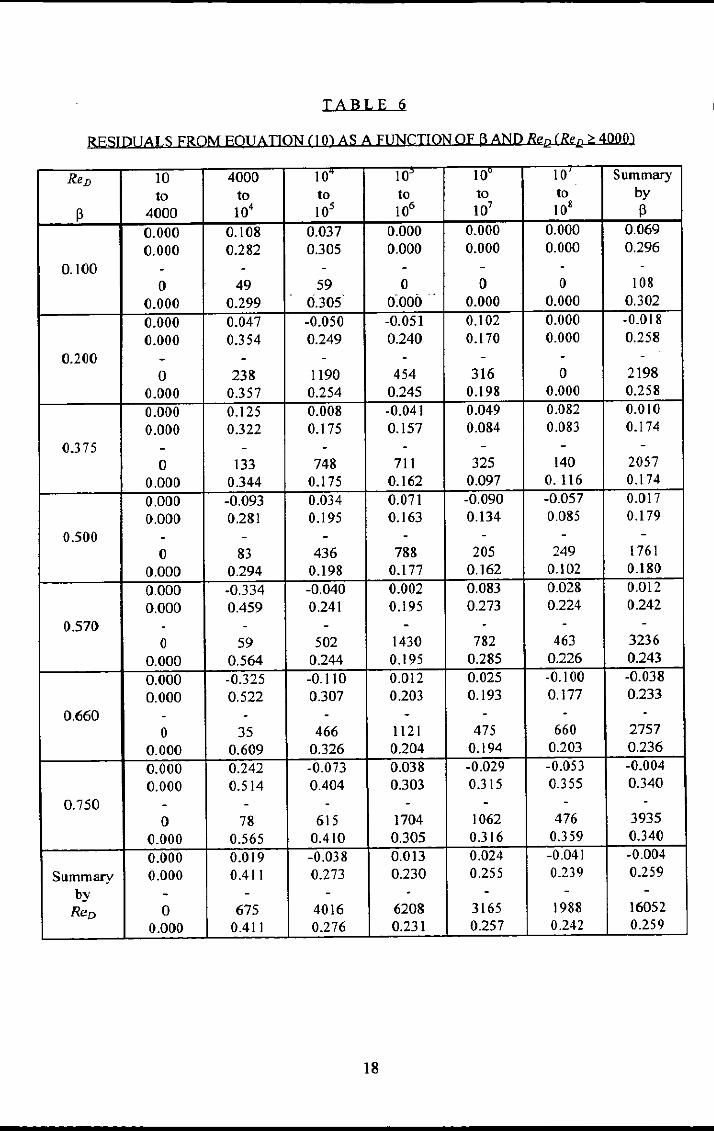
TABLE 6
RESIDlJALS FRQM EQUATION (] 0) AS A FUNCTION OF (3 AND R",~~ > 4000)
Ref) 10 4000 10 IcY IOU 10 Summaryto to to to to to by
13 4000 104 105 106 107 108 130.000 0.108 0.037 0.000 0.000 0.000 0.0690.000 0.282 0.305 0.000 0.000 0.000 0.296
0.100 - - - - - - -0 49 59 0 0 0 108
0_000 0_299 0.305 O~OOO.
0.000 0.000 0.3020_000 0.047 -0.050 -0.051 0.102 0.000 -0.0180.000 0.354 0.249 0.240 0.170 0.000 0.258
0.200 - - - - - - -0 238 1190 454 316 0 2198
0_000 0.357 0.254 0.245 0.198 0.000 0.258
0.000 0.125 0.008 -0.041 0.049 0.082 0.0100.000 0.322 0.175 0.157 0.084 0.083 0.174
0.3 75 - - - - - - -0 133 748 711 325 140 2057
0.000 0.344 0.175 0.162 0.097 0.116 0.174
0.000 -0.093 0.034 0.071 -0.090 -0.057 0.0170.000 0.281 0.195 0.163 0.134 0.085 0.179
0.500 - - - - - - -0 83 436 788 205 249 1761
0.000 0.294 0.198 0.177 0.162 0.102 0.180
0.000 -0.334 -0.040 0.002 0.083 0.028 0.0120.000 0.459 0.241 0.195 0.273 0.224 0.242
0.570 - - - - - - -0 59 502 1430 782 463 3236
0.000 0.564 0.244 0.195 0.285 0.226 0.243
0.000 -0.325 -0.110 0.012 0.Q25 -0.100 -0.0380.000 0.522 0.307 0.203 0.193 0.177 0.233
0.660 - - - - - - -0 35 466 1121 475 660 2757
0.000 0.609 0.326 0.204 0.194 0.203 0.236
0.000 0.242 -0.073 0.Q38 -0.029 -0.053 -0.0040.000 0.514 0.404 0.303 0.315 0.355 0.340
0.750 - - - - - - -0 78 615 1704 1062 476 3935
0.000 0.565 0.410 0.305 0.316 0.359 0.340
0.000 0.019 -0.038 0.013 0.024 -0.041 -0.004
Summary 0.000 0.411 0.273 0.230 0.255 0.239 0.259
by - - - - - - -ReD 0 675 4016 6208 3165 1988 16052
0.000 0.411 0.276 0.231 0.257 0.242 0.259
18
•
•
•
•
•
•
•
•
TABLE7
DEYIATIONS FROM EOUATION (IOl AS A FUNCTION OF D AND ReIJ.i&12 > 4000)
ReD 10 4000 10 10' 10 10 Summaryto to to to to to by
D(mm) 4000 10' lOS 106 107 \08 D0.000 -0.031 -0.082 0.095 0.000 0.000 -0.0370.000 0.467 0.278 0.178 0.000 0.000 0.305
50 - - - - - - -0 403 1749 570 0 0 2722
0.000 0.467 0.289- .
0.202..0.000 0.000 0.308
0.000 -0.047 0.046 0.086 0.000 0.000 0.0620.000 0.137 0.119 0.097 0.000 0.000 0.113
75 - - - - - - -0 22 209 238 0 0 469
0.000 0.141 0.127 0.129 0.000 0.000 0.1290.000 0.149 0.041 0.057 0.114 0.000 0.0640.000 0.252 0.271 0.259 0.228 0.000 0.259
\00 - - - - - - -0 134 IIII 2276 534 0 4055
0.000 0.292 0.274 0.265 0.255 0.000 0.2670.000 0.225 0.149 -0.031 -0.119 0.000 0.0610.000 0.226 0.244 0.125 0.095 0.000 0.217
150 - - - - - - -0 68 275 328 30 0 701
0.000 0.317 0.286 0.129 0.151 0.000 0.2250.000 -0.175 -0.153 -0.032 O.Q\I 0.194 -0.0130.000 0.360 0.212 0.222 0.296 0.231 0.262
250 - - - - - - -0 48 646 2348 1490 516 5048
0.000 0.397 0.261 0.225 0.296 0.301 0.2620.000 0.000 -0.323 -0.078 0.002 -0.123 -0.0730.000 0.000 0.336 0.194 0.196 0.179 0.199
600 - - - - - - -0 0 26 448 I III 1472 3057
0.000 0.000 0.461 0.209 0.196 0.218 0.2120.000 0.019 -0.038 0.013 0.024 -0.041 -0.004
Summary 0.000 0.411 0.273 0.230 0.255 0.239 0.259by - - - - - - -ReD 0 675 4016 6208 3165 1988 16052
0.000 0.411 0.276 0.231 0.257 0.242 0.259
19
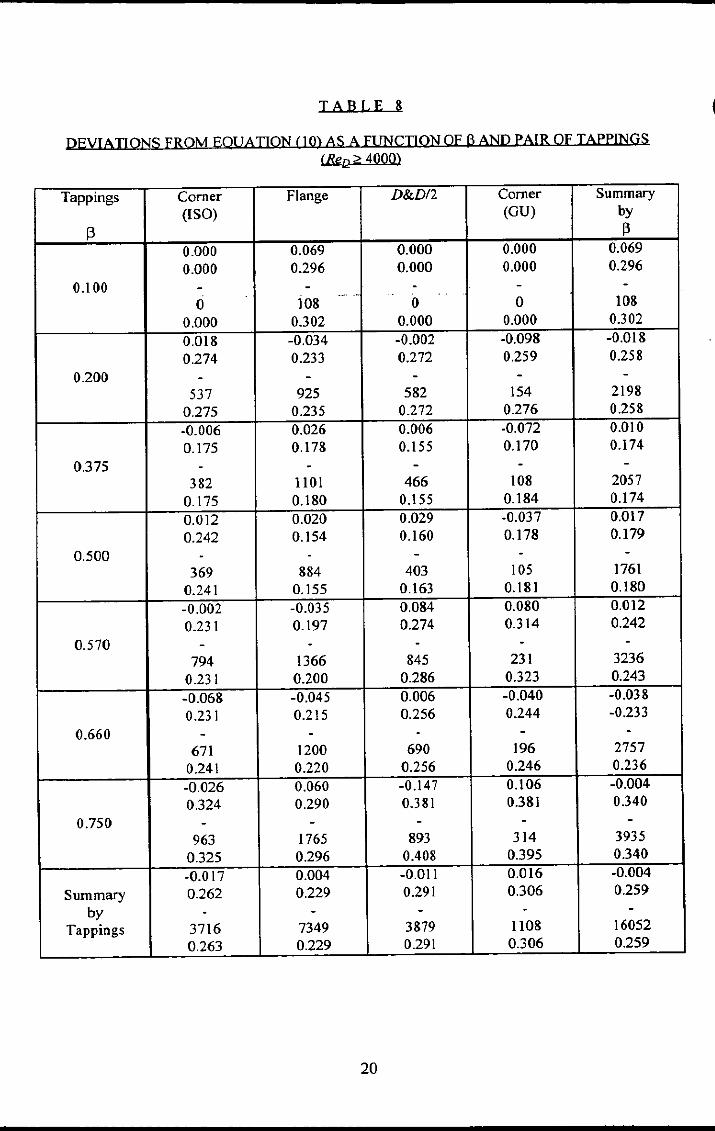
TABLE 8
DEVIATIONS FROM EQ{lATIQN (10) AS A FUNCTION OF PAND PAIR OF TAPPlNGS(~>4000)
Tappings Corner Flange D&D/2 Corner Summary(ISO) (GU) by
13 i30.000 0.069 0.000 0.000 0.0690.000 0.296 0.000 0.000 0.296
0.100 - - - - -108
-_.. -0 0 0 108
0.000 0.302 0.000 0.000 0.3020.Ql8 -0.034 -0.002 -0.098 -0.0180.274 0.233 0.272 0.259 0.258
0.200 - - - - -537 925 582 154 21980.275 0.235 0.272 0.276 0.258-0.006 0.026 0.006 -0.072 0.0100.175 0.178 0.155 0.170 0.174
0.375 - - - - -382 llOI 466 108 20570.175 0.180 0.155 0.184 0.1740.012 0.020 0.029 -0.037 0.0170.242 0.154 0.160 0.178 0.179
0.500 - - - - -369 884 403 105 17610.241 0.155 0.163 0.181 0.180-0.002 -0.035 0.084 0.080 0.0120.231 0.197 0.274 0.314 0.242
0.570 - - - - -794 1366 845 231 32360.231 0.200 0.286 0.323 0.243-0.068 -0.045 0.006 -0.040 -0.0380.231 0.215 0.256 0.244 -0.233
0.660 - - - - -671 1200 690 196 27570.241 0.220 0.256 0.246 0.236-0.026 0.060 -0.147 0.106 -0.0040.324 0.290 0.381 0.381 0.340
0.750 - - - - -963 1765 893 314 39350.325 0.296 0.408 0.395 0.340-0.017 0.004 -0.011 0.016 -0.004
Summary 0.262 0.229 0.291 0.306 0.259by - - - - -
Tappings 3716 7349 3879 nos 160520.263 0.229 0.291 0.306 0.259
20
•
•
•
•
•
•
•
TABLE 9
ANALYSIS OF DEYIATIONS FOR THE DATABASE (Ren > 4000)
AGREED PRI4 RGEQUATION (II) EQUATION EQUATION
N, N2 N, N2 N, NoJ3v D 10 2 14 2 18 6J3v ReD 8 3 6 5 14 6DvReD 10 2 7 2 12 2J3v Tappings 2 0 - 2 0 6 ITOTAL 30 7 29 9 50 15
s (per cent) 0.259 0.254 0.292
TABLE 10
ANALYSIS OF DEYIATIONS FOR THE DATABASE OYER THE RANGE OF THE STOLZISO 5 I67- I· I991 EOlJATION (Ren > 400Q)
AGREED PRI4 EQUATION RG STOLZEQUATION (11) EQUATION ISO 5167-1:1991
EQUATIONN, N2 N, N2 N, No N, N2
J3v D 8 I 15 2 17 6 26 16J3v ReD 4 0 3 I 10 4 16 12DvReD 7 2 10 3 10 3 16 10J3v Tappings 2 0 2 0 5 0 13 7TOTAL 21 3 30 6 42 13 71 45
s (per cent) 0.245 0.247 0.277 0.390
DEFINITIONS FOR TABLES 9 AND 10:
N, is the number of boxes with the mean deviation greater than O. I per cent.
N2 is the number of boxes with the mean deviation greater than 0.2 per cent.
s is the standard deviation of the data in the database about the equation.
21
• • • •