
The Optimal Energy Mix in Power Generation€¦ · The Optimal Energy Mix in Power Generation and...
47
Transcript of The Optimal Energy Mix in Power Generation€¦ · The Optimal Energy Mix in Power Generation and...

The Optimal Energy Mix in Power Generation
and the Contribution from Natural Gas in
Reducing Carbon Emissions to 2030 and Beyond
Carlo Carraro*, Massimo Tavoni**, Thomas Longden** and Giacomo Marangoni**
Abstract
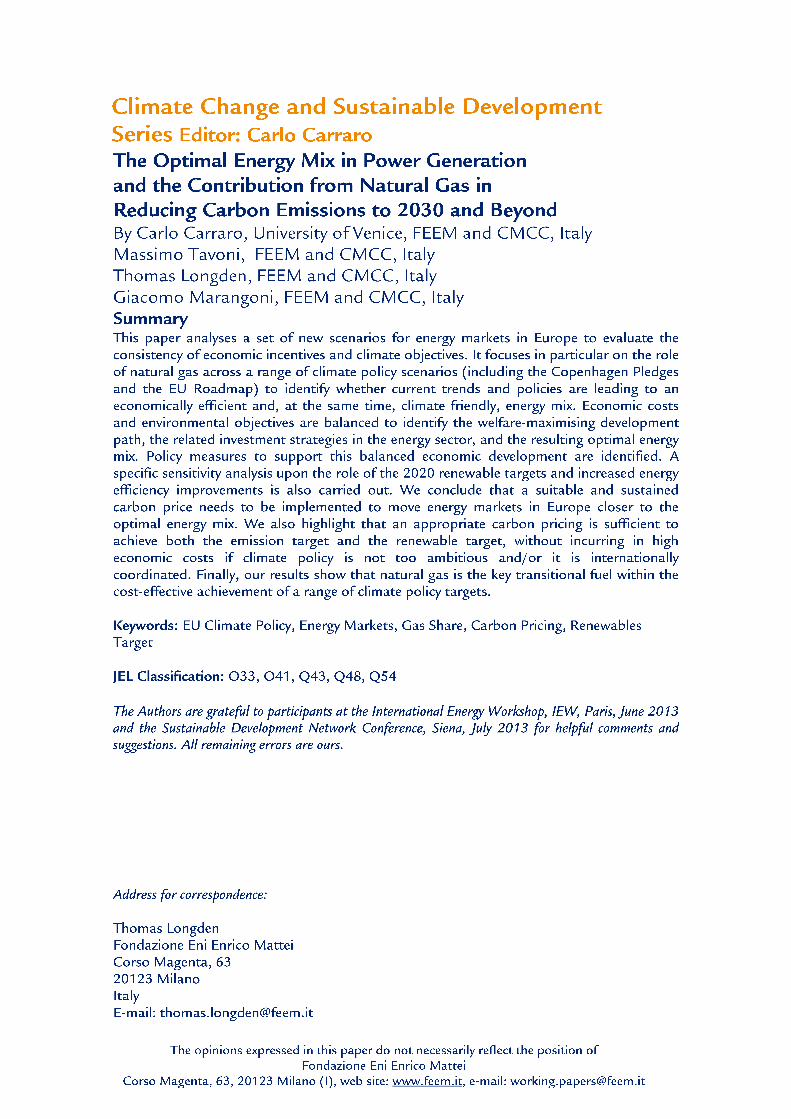
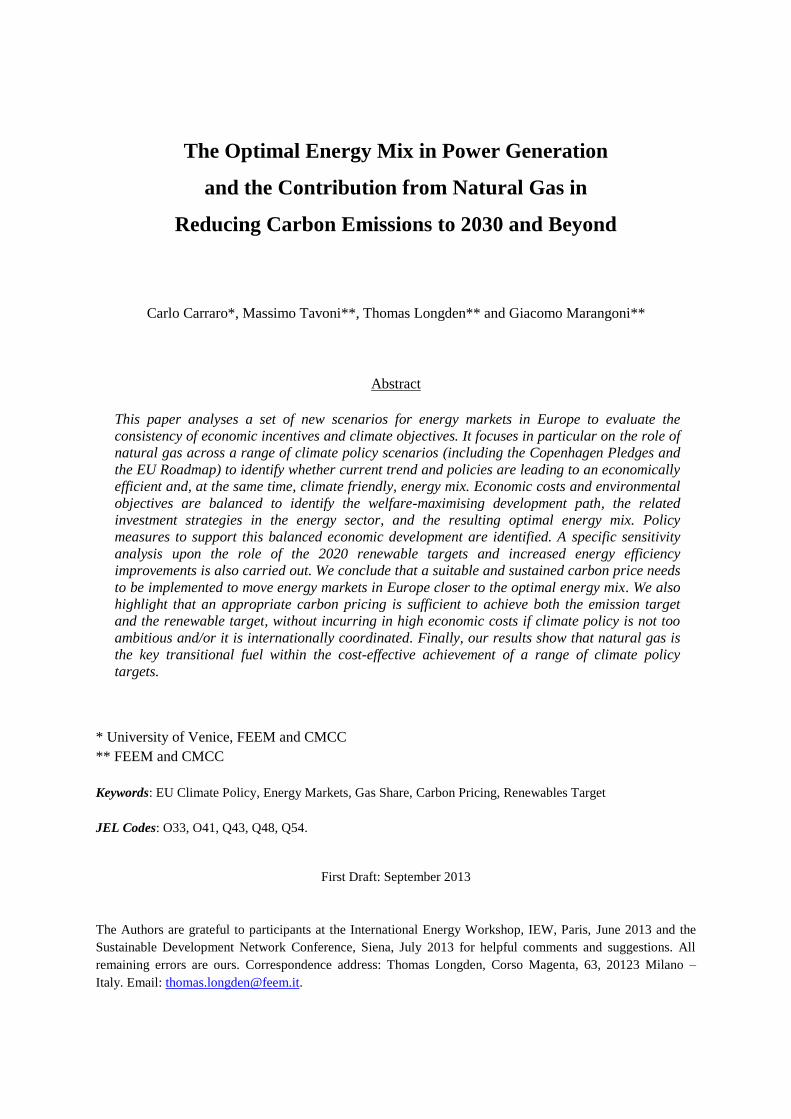
This paper analyses a set of new scenarios for energy markets in Europe to evaluate the
consistency of economic incentives and climate objectives. It focuses in particular on the role of
natural gas across a range of climate policy scenarios (including the Copenhagen Pledges and
the EU Roadmap) to identify whether current trend and policies are leading to an economically
efficient and, at the same time, climate friendly, energy mix. Economic costs and environmental
objectives are balanced to identify the welfare-maximising development path, the related
investment strategies in the energy sector, and the resulting optimal energy mix. Policy
measures to support this balanced economic development are identified. A specific sensitivity
analysis upon the role of the 2020 renewable targets and increased energy efficiency
improvements is also carried out. We conclude that a suitable and sustained carbon price needs
to be implemented to move energy markets in Europe closer to the optimal energy mix. We also
highlight that an appropriate carbon pricing is sufficient to achieve both the emission target
and the renewable target, without incurring in high economic costs if climate policy is not too
ambitious and/or it is internationally coordinated. Finally, our results show that natural gas is
the key transitional fuel within the cost-effective achievement of a range of climate policy
targets.
* University of Venice, FEEM and CMCC
** FEEM and CMCC
Keywords: EU Climate Policy, Energy Markets, Gas Share, Carbon Pricing, Renewables Target
JEL Codes: O33, O41, Q43, Q48, Q54.
First Draft: September 2013
The Authors are grateful to participants at the International Energy Workshop, IEW, Paris, June 2013 and the
Sustainable Development Network Conference, Siena, July 2013 for helpful comments and suggestions. All
remaining errors are ours. Correspondence address: Thomas Longden, Corso Magenta, 63, 20123 Milano –
Italy. Email: [email protected].

- 1 -
Section 1 – Introduction
The dynamics of energy markets in Europe are currently experiencing a paradoxical transition. On the
one hand, a revival of coal imports and a reduction of gas consumption, with an associated negative
impact upon greenhouse gas (GHG) emissions in some major European economies, have been
observed in the past two years. On the other hand, the European Commission and most Member
Countries are concerned about future climate change and have committed themselves in adopting
actions to reduce GHG emissions in 2020 and beyond.
More specifically, gross inland consumption for 2012 shows a decline in natural gas consumption of
14%, a decline in oil consumption of 11% and an increase in coal consumption of 8% with respect to
2010 (Eurostat, 2013). In 2011, natural gas in the EU recorded its largest decline on record, a decrease
of 9.9%, which has been identified as being driven by a weak economy, high gas prices compared to
the U.S., warm weather and continued growth in renewable power generation (BP Statistical Review,
2012). But, no doubt, the explanation also lies in the incorrect policy mix adopted in the EU: excess
subsidies on renewables and, partly as a consequence, a low level of carbon prices also played a
relevant role (we will show in this study the close relationship between subsidies on renewables and
carbon prices).
The European Commission itself has acknowledged the increased use of coal as a key issue for
Europe, with increased CO2 emissions being an increasing concern. The European Commission
contribution to the European Council of 22 May 2013, titled ‘Energy challenges and policy’ notes that
“EU consumption and imports of coal (hard coal and lignite) have increased by, respectively, 2% and
almost 9% over the first 11 months of 2012, relative to the same period in 2011” (European
Commission, 2013: 2). Policies to promote the transition towards a sustainable energy system –
which are likely to favor natural gas, at least in the short and medium term – have not materialized to
the extent expected only a few years ago. The role of natural gas as a transitional fuel within a joint
Climate and Energy framework is an important issue and this was highlighted within the EU Energy

- 2 -
Roadmap 2050, which noted that the scenarios utilized within the Roadmap “are rather conservative
with respect to the role of gas ... economic advantages of gas today provide reasonable certainty of
returns to investors, as well as low risks and therefore incentives to invest in gas-fired power stations”
(European Commission, 2011).
Hence, there is a need to conduct additional analysis on the role of natural gas within a joint Climate
and Energy framework in Europe. Most importantly, there is scope for identifying cost effective
policies which can alleviate the aforementioned paradox. The European Union cannot achieve its
ambitious climate targets without relying heavily on gas rather than coal as a primary energy source.
Therefore, appropriate measures need to be implemented to move energy markets in Europe closer to
the optimal energy mix (where optimality obviously includes the internalization of the climate
externality). In addition, gas is likely to play a relevant role in the optimal energy mix for at least four
decades (as shown within the analysis below).
To address these issues, this paper focuses on three climate-related policy scenarios with two
additional policy assumptions (two possible policy variations). In doing so, it reviews the role of
natural gas within climate efforts which include the Copenhagen Pledges and the EU Roadmap – with
specific sensitivity analysis upon the role of the 2020 renewable targets and increased energy
efficiency improvements.
It should be noted that a range of studies have focused on the impact of climate targets upon Europe,
e.g. refer to Böhringer et al. (2009), Blesi et al. (2010), Boeters and Koornneef (2011), Capros et al.
(2012) and Bosello et al. (2013). However, this is the first study to specifically focus on the role of
natural gas across different climate policy scenarios. Our focus on natural gas is due to the above
statement within the Energy Roadmap 2050, the current debate concerning the additional sources of
gas, and the potential role of gas as a transitional fuel within the shift towards a low carbon energy
future as it provides a flexible power source which can counter the intermittency of renewables. While
gas has been acknowledged to remain in the European primary energy mix within the long term
- 3 -
(Knopf et al., 2013), the extent to which natural gas plays a role has not been given sufficient
attention.
This paper focuses upon the implications of different policy architectures for the optimal energy mix
in Europe, and more broadly for the European economy. The analysis has been conducted using the
WITCH (World Induced Technical Change Hybrid Model) integrated assessment model, a widely
used model in the global assessment of climate and energy policies. Within the model, the main
macroeconomic variables are represented through a top-down inter-temporal optimal growth
economic framework. This is combined with a bottom-up compact modeling of the energy sector,
which details energy production and provides the energy input for the economic module and the
resulting emission input for the climate module. Further information about the model is available at
the website www.witchmodel.org or can be sourced from Bosetti, Massetti et al. (2007), as well as in
Bosetti, Carraro et al. (2006) and Bosetti, De Cian et al. (2009).
Underlying a review of the European energy market which focuses on 2020 are the issues of the
impact of low economic growth and the influence of the renewable target. As a result, our scenarios
make different assumptions about the stringency of climate policy across the globe and also capture
real-world factors relevant to European policy such as sustained suppressed economic growth and
post Fukushima apprehension concerning the safety of nuclear power. Modern renewables (such as
solar and wind) are now becoming competitive due to the existing targets and incentives that the EU
has put in place. The recent expansion of renewables has been forecast to continue, with UBS
Investment Research (2013) predicting that up to 18% of electricity demand could be replaced by self-
produced solar power in Germany, Italy and, eventually, Spain. Indeed, the same report discusses
solar as being viable without subsidies within these same countries. Citi Research (2012) has also
concluded that “renewables will reach cost parity with conventional fuels (including gas) in many
parts of the world in the very near term” and that natural gas has a role to play as a transitional fuel
within the progression towards a lower carbon world, as well as assisting in the balancing of the
intermittency of renewables. Further reinforcing this point is a technical report by the National
Renewable Energy Laboratory which notes that due to different risk profiles, natural gas and

- 4 -
renewable energy investments can be considered complementary portfolio options. In addition, the
report notes that “the quick ramping ability of natural gas generators makes them ideal for
complementing variable renewable generation” (NREL, 2012: 30).
The paper is compiled of four sections. An introduction appears before this point, while three sections
follow. Section 2 provides a review of the WITCH model and an outline of the modelling framework
and scenarios utilized within the analysis. Section 3 focuses on the main results of the project within
three subsections, these being: - section 3.1 - which discusses the future of natural gas within Europe,
- section 3.2 - which focuses upon the implications of following a climate policy target consistent with
a 2°C Durban Action international agreement commencing in 2025, and - section 3.3 - which
investigates the impact of an expanded availability of gas within Europe using a range of price
sensitivity scenarios. Section 4 concludes with a discussion of the key findings of the paper.
As a prelude to the results of the paper, the conclusions have been separated into three key points. The
first is the importance of setting a suitable carbon price which ensures that the right incentives are
given to energy markets so that a consistent energy mix can be achieved, thus reducing the policy
costs of all climate policy targets reviewed within the analysis. The second point is that natural gas is
a key transitional fuel for a range of climate policy targets and therefore policy should be very in
careful in designing the right incentives to sustain gas consumption. And lastly, the importance of
avoiding distortive policy instruments, e.g. subsidies, is highlighted. For example, in the near term
(2020), the renewable target has been found to reduce carbon prices by about 10 $/tCO2, with clear
negative impacts on incentives to adopt more energy efficient business strategies and to invest in
climate-friendly technologies and production processes. What this study shows is that a correct carbon
pricing can sustain gas consumption at while transitioning coal out of the power generation mix
without damaging the development of renewables, even without subsidies. The policy mix inducing
the welfare-maximising energy mix does not require subsidies on renewables and is therefore
beneficial also for EU countries’ public budgets.

- 5 -
Section 2 – WITCH, the Modeling Framework and the Scenario
Description
WITCH is a dynamic optimal growth general equilibrium model with a detailed (“bottom-up”)
representation of the energy sector. Within the class of hybrid (both “top-down” and “bottom-up”)
models, the top-down component consists of an inter-temporal optimal growth model in which the
energy input of the aggregate production function has been integrated into a bottom-up representation
of the energy sector. The top down component ensures a fully intertemporal allocation of investments,
including those in the energy sector. The bottom up component guarantees an appropriate
representation of substitution processes between different fuels. This framework is then utilized to
model carbon mitigation options for the main greenhouse gases.
2.1 The model
A global model, WITCH is divided into 13 macro-regions, including Western and Eastern Europe
which together are the main region focused upon within this paper (denoted as Europe throughout).
The base year for calibration is 2005 and all monetary values are in constant 2005 USD. Amongst the
distinguishing features of the model are the multiple channels of interactions between regions which
include: technological spillovers, exhaustible common resources (coal, natural gas and uranium),
trade of emission permits/credits, and the trade of oil, gas and coal. Environmental externalities in the
form of climate damages can be activated within the model; however this analysis is conducted on the
basis of a cost-effectiveness analysis of differing climate policies (namely, the study identifies the
optimal strategy to achieve a given GHG concentration target). Hence, climate damages (still largely
uncertain) are not accounted for within this study.
Optimization produces the optimal dynamic path of all endogenous variables (all kind of investments,
GDP, emissions, etc.) subject to imposed constraints such as the model’s structure, emission targets
and additional policy/technological assumptions. Accordingly, the WITCH model is a suitable tool for

- 6 -
an analysis of the optimal energy mix of power generation within Europe, where “optimal” is
equivalent to “welfare maximising”.
Let us stress that our results should not be interpreted as forecasts, or how energy markets will
develop in Europe, but rather how energy markets should evolve, were their dynamics consistent with
the climate targets set out by the European Commission. It is precisely in this “normative” analysis
that gas plays a crucial rule. And this is why the model indicates that policies need to be designed to
reconcile the present contradictory reality with the “ideal” situation for the European Commission and
Member Countries.
The energy sector representation in WITCH is an aggregate of electric and non-electric energy sub-
sectors with six fuels and over seven technologies for electricity generation. The electric sub-sector
includes representations of oil, gas, coal, renewables (including biomass, off-shore/on-shore wind and
PV/CSP solar) and nuclear power supply. With a range of fuels and energy types within the energy
sector, the WITCH model uses a Constant Elasticity of Substitution (CES) function to aggregate the
various forms of energy in a non-linear manner. This method of aggregation is common amongst
economic models to ensure less than infinite substitution across factors. Within this framework,
moving away from an established energy mix costs more than it would in a least cost minimization
framework. Amongst the motives for the implementation of a CES function are econometric studies
focusing on inter-fuel substitution which find an inelastic relationship between energy consumption
and own/cross energy prices. The CES function allows for contemporaneous investments in different
technologies which are consistent with base-year calibrated factor shares and the given elasticity of
substitution framework. Hence the base year installed power generation capacity is calibrated for the
year 2005 and this calibration influences the speed with which these technologies can be substituted
with each other – refer to Bosetti, Massetti et al. (2007) for further details.
Within this analysis, the relationship between intermittent renewable and the other types of power
generation is important. We account for the flexibility of natural gas and the intermittency of wind
and solar with the implementation of the flexibility coefficients detailed within Sullivan et al. (2013).

- 7 -
Hence, the fraction of generation that is considered to be flexible for natural gas within WITCH is 0.5,
while wind and solar require some additional flexible generation from another technology to account
for intermittency. Wind requires an external fraction of 0.08 to satisfy changes and uncertainty in
load, while solar requires 0.05. This in turn reflects the comparative advantage of natural gas to
balance the intermittency of renewables as coal has a flexibility parameter of 0.15, although electricity
storage would have a flexibility parameter of 1. In addition to the consideration of the energy system’s
ability to balance the intermittency of renewables, notably large shares are consistent with an
additional need for storage devices. Accordingly, the need for storage of back up capacity and
curtailment when the intermittent renewable share is relatively high is consistent with an additional
penalty cost which has been imposed on top of the flexibility coefficients. The penalty cost is imposed
within WITCH as a non linear function of the share of intermittent renewables within the power mix.
Note that the calibration of this function has been based upon Hoogwijk et al. (2007). Indeed, DG
Energy (2013) notes that “when these levels of 25% and above are reached, intermittent (renewable
energy) RES need to be curtailed during the low consumption periods in order to avoid grid
perturbation (frequency, voltage, reactive power) and grid congestion, unless the RES excess can be
stored” (DG Energy, 2013: 5).
Upon discussing the future role and challenges of energy storage, DG ENER (2013) also makes the
point that while storage may be considered an established technology; a sizable 99% of the current
global large scale electricity storage capacity utilizes Pumped Hydro Storage systems. This working
paper created by the European Commission’s own Directorate-General for Energy also points out that
demand for storage can also be covered by natural gas storage. In addition, natural gas is discussed as
being an important fuel for electricity production as “natural gas power plants have a very high
efficiency (above 60% for the best available technology), a very high flexibility and low CO2
emissions (replacing an old coal fired power plant by a natural gas fired power plant reduces the CO2
emissions per kWh up to 80%)” (DG ENER, 2013: 2). The same paper mentions that utilities are
tending to rely on combined-cycle gas turbine systems as a range of factors have reduced the
economic competiveness of pumped hydro storage. The factors mentioned include: - increased

- 8 -
efficiency and reduced costs of flexible combined-cycle and simple-cycle natural gas turbines, -
increased interconnection of the grid at the EU-level, and - decreased gas prices (DG ENER, 2013).
Technological, market or regulatory issues and a holistic approach across borders are the main
challenges for energy storage highlighted within DG ENER (2013). Within section 3.2 we further
discuss the issue of storage and curtailment upon comparing the WITCH results to those of the
PRIMES model. Differences in the results are partly related to the expansion of hydrogen as a means
of storage of intermittent renewable power. The importance of a technological breakthrough in the
production of hydrogen within the scenarios which accompany the EU 2050 Roadmap (produced by
the PRIMES model) is highlighted by approximately 66% of net installed capacity in 2050 being
sourced from renewables, with 80% of this capacity being from an intermittent source.
2.2 The scenarios
With a focus on the importance of climate policy for natural gas in Europe we have developed a range
of scenarios which capture a realistic representation of the current conditions under which policy
makers are operating. As part of this we have implemented the scenarios introduced below with
underlying assumptions regarding economic growth and the expansion of nuclear power. For
example, stagnant economic growth in Europe until 2020 is implemented by lowering labor
productivity and within the baseline this results in a growth rate of approximately 0.4% per year for
Europe between 2010 and 2020, increasing to be approximately 1.5% per year after 2020. Table 1
presents the population and GDP assumptions that are implemented within the baseline scenario,
which is designated as the No Policy scenario within Table 2.
A gradual reduction of nuclear power in Western Europe is also implemented across all scenarios to
reflect the post-Fukushima apprehension towards the technology. Within the baseline, this results in
an 8% reduction in nuclear power generation in comparison to 2010 levels at the European level for
2020, increasing to a 14% reduction in 2030.

- 9 -
Table 1. Baseline Demographic and Economic Estimations
2010 2015 2020 2025 2030 2035 2040 2045 2050
Population
(Billions)
0.513 0.520 0.525 0.528 0.530 0.530 0.530 0.528 0.526
GDP
(Trillion 2005 USD MER)
15.17 15.67 16.15 17.39 18.86 20.33 21.96 23.67 25.52
GDP per Capita
(2005 USD per person)
29,546 30,146 30,775 32,921 35,577 38,314 41,443 44,790 48,503
Table 2 reviews the full matrix of scenarios implemented within this analysis with two major
dimensions being that of ‘climate policy stringency’ (i.e. No Policy, Moderate Policy, Stepped Up
Policy and 2°C Policy) and a range of ‘additional policy assumptions’ (i.e. Base, No Renewable
Target and High Energy Efficiency). Table 2 also provides the naming convention applied within the
analysis and the next few paragraphs will provide descriptions of these scenarios based on the two
dimensions specified.
Table 2. Policy Scenarios – Climate Policy, Renewable Target and Energy Efficiency
a. Base b. NoRenewable Target
c. High Energy Efficiency
Energy Intensity
Energy Demand
1. No Policy NoPol
2. Moderate Policy Pledge Pledge/NoRET Pledge/HEE_I Pledge/HEE_D
3. Stepped upPolicy
Pledge+ Pledge+/NoRET Pledge+/HEE_I Pledge+/HEE_D
4. 2°C Policy 2Deg 2Deg/NoRET 2Deg/HEE_I 2Deg/HEE_D

- 10 -
Climate policy stringency is reviewed across four different scenarios. The No Policy (No Pol)
scenario is a comparative counterfactual state of the world in which no climate policy is implemented
(not even in 2020) in any country in the world. As our focus is on Europe, the counterfactual nature of
this scenario is clear as it does not include any of the existing policies which have already been
implemented (such as the 2020 renewable and emissions target) and the main use of this scenario will
be in providing a benchmark for the calculation of policy costs, including the costs of the 2020
renewable target.
The Moderate Policy (Pledge) scenario is a case where there is fragmented moderate action on climate
and includes region specific policy objectives based on the Copenhagen Pledges. These region
specific policy objectives include: - 2020 emission reduction targets, - technology specific policies
(e.g. expansion of renewable and/or nuclear), and – post-2020 carbon intensity targets. Within the
Moderate Policy scenario regions can trade carbon offsets internationally (for example, through a
Clean Development Mechanism type of project or via a linkage of the ETS to other regions), however
this is limited to be equivalent to 20% of abatement as at least 80% of emission reductions have to be
conducted domestically. For Europe, this scenario includes the legislated 2020 targets (specifically
emissions, renewables and energy efficiency) and a post 2020 extrapolation of the climate policies,
with a 2030 and 2050 target of 25% and 45% emissions reductions with respect to 2005. Note that the
Appendix contains an extended discussion of the specification of the policy scenarios with extensive
detail for the major regions considered.
The Stepped up Policy (Pledge+) scenario replicates much of the settings of the Moderate Policy
scenario, except that the level of ambition is stepped up in 2020 and beyond within all regions. For
Europe, this results in a tightening of the supply of emission carbon offsets up to and including 2020
(or equivalently, this can be interpreted as having raised the ambition of emissions reductions in 2020
to 30% wrt to 1990). For 2030 and 2050, emission reductions would be 37% and 60% wrt 2005
respectively.

- 11 -
The 2°C Policy (2 Deg) scenario moves away from the fragmented representation of climate policy
and captures a situation where the Durban Action Platform delivers a binding international climate
treaty entering into force in 2025 with the aim of maintaining global temperature increase below 2C
with sufficiently high probability. It is important to remark that since the model has a global scope,
each policy scenario has a detailed formulation for all the native regions of the model (13 regions),
and not just for Europe. The extent of regional climate policy effort is harmonized and based in the
short term on national and international pledges. Full details of these policies for a set of major
economies are reported in the Appendix of this paper.
The additional policy assumptions (the second dimension of the matrix) are then imposed on top of
the implementation of the level of climate policy stringency with the Base case being the standard
representation of policy. Note that for Europe, this means that the Base case includes the legislated
2020 targets (specifically emissions, renewables and energy efficiency) in all scenarios, except for
NoPol. The first additional policy assumption that is implemented is the No Renewable Target (No
RET) where the 20% renewable target (as a share of final energy) in Europe for the year 2020 and
beyond is not activated. This allows disentangling the impact of the renewable target upon Europe –
its cost for the EU in particular - in comparison to the alternative cases.
The second additional policy assumption is a case where Europe pursues energy efficiency policies in
2020 and beyond. This in turn stimulates High Energy Efficiency (HEE) where demand stays
relatively flat between 2010 and 2050. The implementation of the HEE scenario has been separated
into two potential options for policy design and implementation. The first of which is an energy
intensity (HEE_I) based policy where technical change improves energy efficiency. The second is
where the policy is imposed as a target on energy demand (HEE_D) and can be achieved by reducing
energy demand, rather than through energy intensity. As will be discussed within section 3.1, the
distinction is important with respect to policy design and policy costs, but is irrelevant with respect to
the energy mix. Thus, the distinction will be retained only when presenting carbon prices and policy
costs.
- 12 -
Section 3 – Main Results
Having briefly summarized the range of scenarios and assumptions that have been implemented
within the analysis, the discussion within section 3 moves on to the scenario results with a focus on
the role of natural gas within Europe (section 3.1), a review of how the fragmented policies differ in
comparison to an international effort to achieve a 2°C Durban Action policy (section 3.2) and an
analysis of different availability/prices of natural gas (section 3.3).
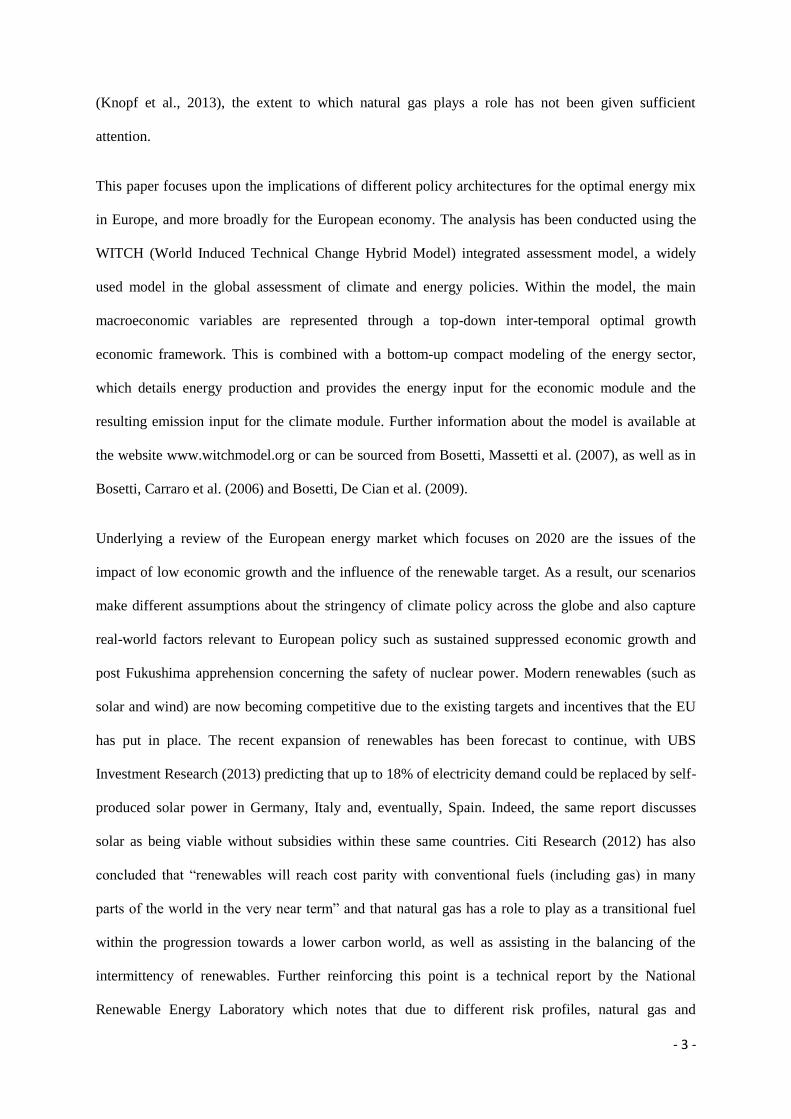
Before focusing upon Europe, it is also important to briefly review the overall climate policy
framework that is being employed within other regions as part of the same scenarios. Figure 1 reviews
the impact of the climate policy stringency scenarios upon global greenhouse gas emissions between
2010 and 2050. The Pledge and Pledge+ policies lead to a peak of global emissions by 2050 and 2040
respectively (and decline thereafter), whereas the 2Deg policy corresponds with global action which
moves this peak forward to 2020 with immediate reductions corresponding with the international
agreement implemented in 2025. The graph highlights the growing global gap in emissions between
the case in which no action on climate is undertaken (NoPol) and the different climate policy
scenarios. If emissions continued to grow unabated, in line with historical trends, the effects of
climate change would be potentially significant, with a global increase in temperature increase by the
end of the century estimated around a mean of 4 C. On the other hand, the 3 policies analyzed in the
paper have the potential to reduce the temperature increase, depending on the stringency of emission
reductions.
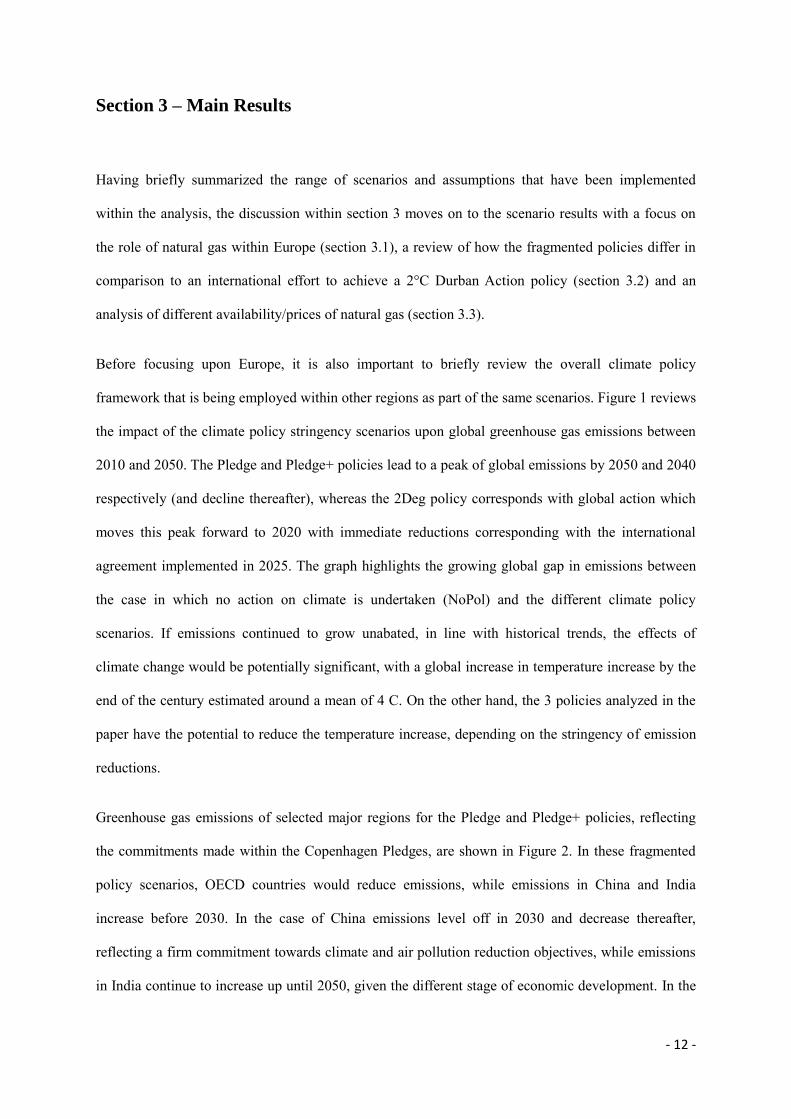
Greenhouse gas emissions of selected major regions for the Pledge and Pledge+ policies, reflecting
the commitments made within the Copenhagen Pledges, are shown in Figure 2. In these fragmented
policy scenarios, OECD countries would reduce emissions, while emissions in China and India
increase before 2030. In the case of China emissions level off in 2030 and decrease thereafter,
reflecting a firm commitment towards climate and air pollution reduction objectives, while emissions
in India continue to increase up until 2050, given the different stage of economic development. In the
- 13 -
case of China, CO2 emissions in 2010 were 22.7% of the global total and peak at 30.1% in the pledge
case in 2030, decreasing to 26.7% in 2050. This is in comparison to 31.5% of global emissions in
2030 and 30.8% in 2050 within the no policy scenario.
Figure 1. Global Greenhouse Gases by scenario
Figure 2. Greenhouse Gases by selected major region - Pledge and Pledge+
- 14 -
As Europe has a special focus within the paper and can be classified as a front runner on climate
action, we will now pay attention to the level of action by Europe across the scenarios presented in
Figure 2. CO2 emissions associated to Europe were 12.1% of the global total in 2010 and under the
Pledge scenario this would decrease to 6.6% in 2050 (in comparison to 8.7% in the no policy
baseline). In terms of abatement, in 2050 Europe would be responsible for 13.6% of global emission
reductions in the Pledge scenario, which decreases to 11.6% in Pledge+ and 8.4% with a unilateral
focus on achieving 2Deg. Note that the percentage of emissions/abatement differs based on the level
of commitment by regions outside Europe and the overall worldwide emissions total – refer to the
discussion surrounding Figure 3 for specific details on the amount of abatement that Europe conducts
with respect to 2010 levels.
3.1 – Implications for Europe
As noted within the introduction, the role of the power generation mix and especially gas within
Europe is of interest for a range of reasons. These being: - the specific acknowledgement of a
conservative representation of the role of gas within the scenarios utilized within the EU Energy
Roadmap 2020, - the current debate about the impact of additional sources of gas, shale gas in
particular, and - the role of gas as a transitional fuel that can also provide a flexible power source to
counter the intermittency of renewables.
Before reviewing the role of natural gas, it is important to evaluate the climate policy stringency
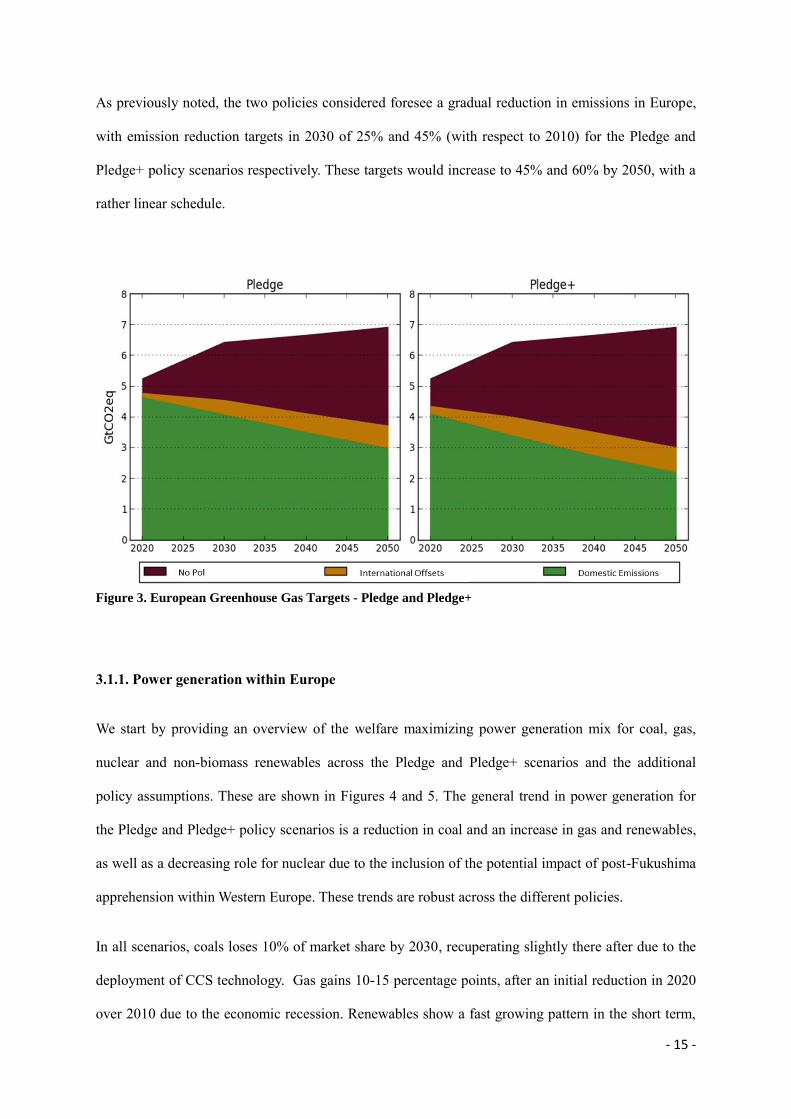
targets for Europe. Figure 3 reviews the European greenhouse gas targets for the Pledge and Pledge+
scenarios with a comparison between emissions with respect to the NoPol case. Note that Figure 3
makes a distinction between the allowance allocation of emissions and the total amount of emissions
that occur within Europe, once international carbon offsets have been accounted for. As already
implemented today, Europe is allowed to fulfill a fraction of its domestic emissions reductions targets
by buying a certain amount of emission permits outside the region, most notably in the developing
countries where abatement opportunities are cheaper.
- 15 -
As previously noted, the two policies considered foresee a gradual reduction in emissions in Europe,
with emission reduction targets in 2030 of 25% and 45% (with respect to 2010) for the Pledge and
Pledge+ policy scenarios respectively. These targets would increase to 45% and 60% by 2050, with a
rather linear schedule.
Figure 3. European Greenhouse Gas Targets - Pledge and Pledge+
3.1.1. Power generation within Europe
We start by providing an overview of the welfare maximizing power generation mix for coal, gas,
nuclear and non-biomass renewables across the Pledge and Pledge+ scenarios and the additional
policy assumptions. These are shown in Figures 4 and 5. The general trend in power generation for
the Pledge and Pledge+ policy scenarios is a reduction in coal and an increase in gas and renewables,
as well as a decreasing role for nuclear due to the inclusion of the potential impact of post-Fukushima
apprehension within Western Europe. These trends are robust across the different policies.
In all scenarios, coals loses 10% of market share by 2030, recuperating slightly there after due to the
deployment of CCS technology. Gas gains 10-15 percentage points, after an initial reduction in 2020
over 2010 due to the economic recession. Renewables show a fast growing pattern in the short term,

- 16 -
spurred to a large extent by existing incentives, but also a long term saturation, due to increase system
integration costs.
Figure 4. Power generation shares by fuel – Full range of Pledge scenarios, from 2010 to 2050.
Figure 5. Power generation shares by fuel – Full range of Pledge+ scenarios, from 2010 to 2050
Specifically, the power generation shares for Europe within Pledge in 2020 are 21% for coal, 16% for
natural gas, 37% for non-biomass renewable and 21% for nuclear, in comparison to shares of 25%,
17%, 27% and 25% in 2015. The removal of the renewable target for 2020 results in power generation
- 17 -
shares for Europe within Pledge/NoRET in 2020 of 24% for coal, 18% for natural gas, 29% for non-
biomass renewable and 24% for nuclear, with an additional 5% decrease in total electricity demand.
In the case of Pledge+, the power generation shares for Europe in 2020 are 16% for coal, 15% for
natural gas, 39% for non-biomass renewable and 23% for nuclear, in comparison to shares of 25%,
17%, 27% and 25% in 2015. The removal of the renewable target for 2020 results in power generation
shares for Europe within Pledge+/NoRET in 2020 of 18% for coal, 19% for natural gas, 32% for non-
biomass renewable and 26% for nuclear, as well as a 6% decrease in total electricity demand.
Underlying a review of Europe which focuses on 2020, as done above, are the issues of low economic
growth and the impact of the renewable target. Figure 4 and Figure 5 show indeed that natural gas
within Pledge and Pledge+ is expected to slightly decline in 2020 wrt 2010 and this is related to the
slow demand growth in total electricity. However, the impact of the renewable target is notable with
no contraction in the share of natural gas occurring within the NoRET cases.
Irrespective of the impact of the renewable target, after 2020 both the Pledge and Pledge+ climate
policies induce gas to increase significantly and coal to continue decreasing (until it is somewhat
revived when coupled to CCS by mid century). Figure 6 provides the changes in natural gas from
electricity in terms of the level of production. The chart indicates that natural gas would eventually
increase its contribution to the power mix in a significant way, with an expected generation by mid
century of 1000-1200 TWH, which roughly corresponds to a doubling from today’s levels.
The exact timing of the increase in the use of gas depends on assumptions about the economic
recovery and the set of policies in place after 2020. As evident from Figure 6, the impact of the
renewable target upon the amount of gas within power generation is visible only in 2020. The impact
of the renewable target in 2020 vanishes after that due to an increased role played by renewable
energy sources in the long term across all of the additional policy assumptions due to the level of
carbon prices in the market. On the other hand, strong post 2020 legislation on energy efficiency is
shown to have a sizeable impact on the prospects of natural gas, as a result of lower electricity
demand due to increased savings.

- 18 -
Figure 6. Natural gas electricity – level of power generation
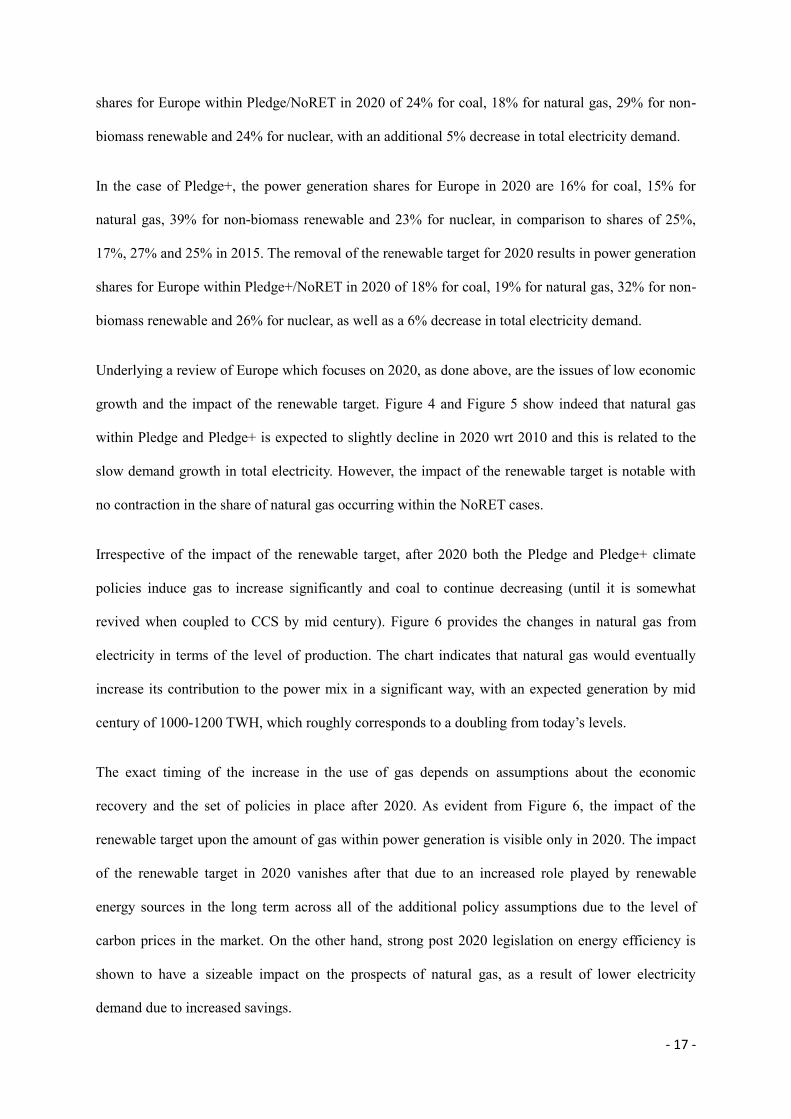
Underlying the results that have been discussed within this section are changes in the investments
related to providing the capacity for the power generation options reviewed. Focusing on the Pledge
and Pledge/NoRET scenarios within Figure 7 allows for a focus on the impact of the renewable target
on investments across coal, natural gas and modern renewables.
The chart shows two contrasting trends for coal and gas on one side, and renewables on the other.
Investments in both coal and gas are expected to grow over time, in the range of 100-300 USD
Billions per decade, but only after the post 2020 economic recovery. Despite its decreasing role in the
power mix, investments in coal remain substantial, due to the higher overnight capital costs of coal
power, and the fact that after 2030 the majority of coal is equipped with Carbon Capture and Storage
(CCS) technology. Indeed, for coal to remain in the optimal energy mix, and still enable the
achievement of emissions consistent with Copenhagen Pledges, coal needs to be equipped with CCS
after 2030. As a comparison, natural gas is also coupled with CCS, however this occurs after 2040
within the Pledge scenario. Despite providing a much larger electricity share, investments in gas are
smaller, due to the low overnight capital costs assumed for CCGT technologies.
- 19 -
For renewables, investments on the other hand slightly decrease after 2020, due to the improved
economics of renewables, as well as a saturation of their contribution due to the already highlighted
system integration constraints. In 2020, policies supporting renewables increase investments by about
50%. Between 2010 and 2030, the Pledge scenario corresponds with investments in modern
renewables being 55% of total investments related to the supply of electricity. In terms of capacity,
this equates to 65% of new power capacity between 2015 and 2030. Note that projections completed
by Bloomberg New Energy Finance forecast that renewables will account for between 69% and 74%
of new power capacity added between 2012 and 2030 at the global level. (BNEF, 2013)
Figure 7. Decadal investments across key power generators
3.1.2 Carbon Market and Policy Costs
We now turn to the economic implications of the economic, energy and climate scenarios analyzed
within this paper. We begin by looking at an important indicator, namely the carbon prices which
emerge from the EU carbon market, see Figure 8. The chart highlights the expected fact that carbon
prices grow in the stringency of the emissions reduction target, both over time (by about 5$/tCO2
each year) and across the policies (with Pledge+ adding 10-15$/tCO2 to the Pledge case).

- 20 -
Carbon prices in 2020 for the cases where the renewable target is implemented are 9-14 $/tCO2 in the
Pledge policy and 22-28 $/tCO2 in the Pledge+ policy scenario, depending on the impact of high
energy efficiency. However, the carbon price without the renewable target imposed would be 22
$/tCO2 in Pledge/NoRET and 38 $/tCO2 in the Pledge+/NoRET. This indicates that the renewable
target suppresses carbon prices in 2020 by approximately 10 $/tCO2. The importance of the
differences in carbon prices lies in the need to provide clear incentives to energy markets – indeed, a
stable and long-term signal which increases over time would prevent the recent expansion of coal
within Europe which was noted within the introduction.
Figure 8. Carbon prices – Full range of Pledge and Pledge+ scenarios
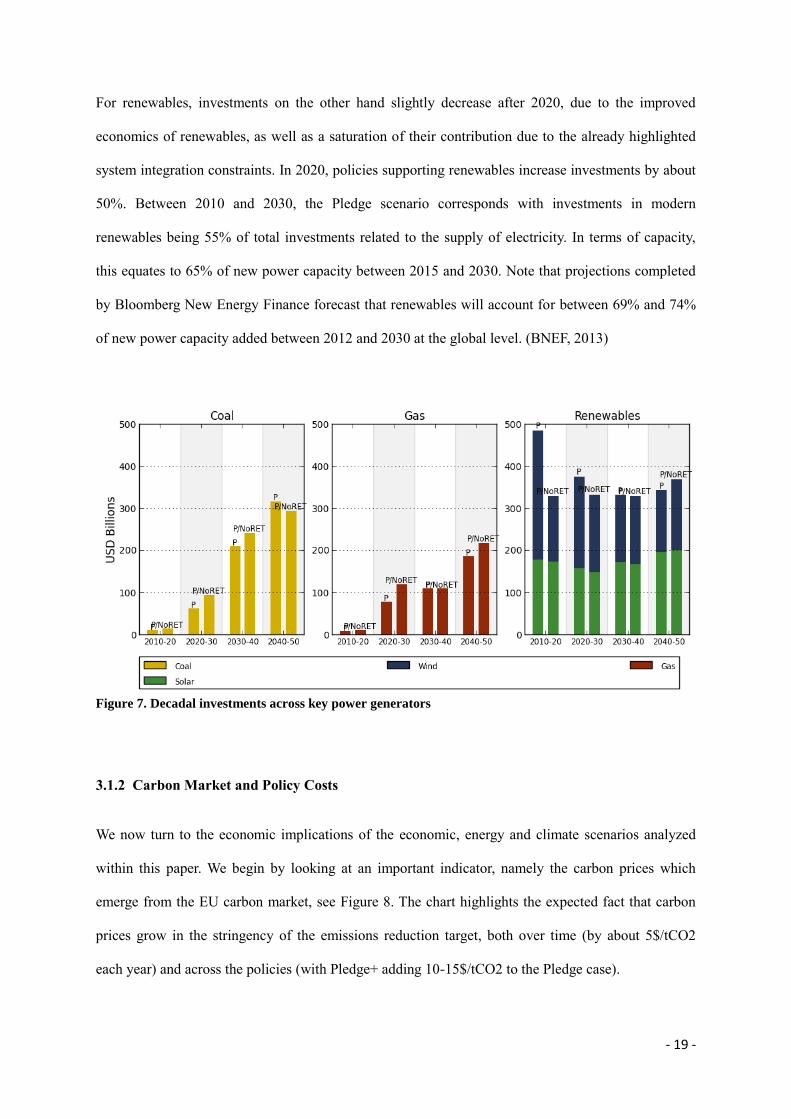
In addition, if full auctioned, the sales of permits has the potential to generate significant fiscal
revenues, which are important at times of consolidation of public debt. We estimate that public
revenues with Pledge and Pledge+ are associated with potential revenues of 65 to 166 Billion USD,
and exceed 200 USD Billions after 2030 (refer to Figure 9). In 2020, the renewable target would
reduce revenues by almost 40 Billion USD irrespective of whether Pledge or Pledge+ is followed.
This highlights that subsidies and/or incentives for modern renewables, in addition to being costly,
also reduce the revenues from issuing emission permits.
- 21 -
Figure 9. Fiscal revenues from the carbon market
Figure 8 and Figure 9 also review the carbon prices and permit revenue associated with two different
approaches to implementing the same energy efficiency improvements – that being either through
energy intensity improvements with technical change (HEE_I) or energy demand reductions
(HEE_D). Between these two scenarios the differing impact of the imposition of the energy efficiency
improvements are highlighted with energy intensity improvements through technical change reducing
the burden of emission reductions which occur within the economy and hence have a downward
impact upon the amount of carbon offsets which are sourced by Europe from abroad.
Carbon prices are imperfect indicators of macro-economic costs, as a result we assess these costs –as
measured by GDP losses- separately in Figure 10 and 11. Policy costs in the Pledge scenario are
found to be in the order of 0.5% GDP loss in 2020, growing to 1.5% by the mid century. The
renewable target is responsible for a considerable fraction of short term costs, more than doubling
2020 policy costs; however these converge over time once the impact of the 2020 renewable target
disappears. The Pledge+ policy induces moderately higher costs – 0.6% and 0.3% for the base case
and NoRET respectively. Note that upon adjusting their analysis for an economic recession, Bosello et
al. (2013) find a similar level of policy costs for a scenario similar to Pledge using the ICES model

- 22 -
(another integrated assessment model developed and used at CMCC), with a policy cost of 0.5% for
the EU when implementing its energy and climate policy unilaterally.
Figure 10. Policy costs in comparison to the no policy scenario – Selection of Pledge and Pledge+
scenarios
Figure 11. Policy costs in comparison to the no policy scenario – Focus on High Energy Efficiency (HEE)
Pledge and Pledge+ scenarios
Figure 11 also reviews policy costs associated with the two different approaches to implementing the
same energy efficiency improvements – that being either through energy intensity improvements
(HEE_I) or energy demand reductions (HEE_D). In 2020, the difference in policy cost is limited as

- 23 -
the difference in energy demand with respect to the baseline is small due to the assumption of
suppressed economic growth. However, over time the level of electricity demand within both of these
scenarios is notable (20% lower in 2050) with policy costs between HEE_I and HEE_D differing by
approximately 1.5% of GDP. Indeed, the changes over time show that the costs of the HEE scenarios
crucially depend on policy design and implementation. If the energy efficiency target is designed as
energy intensity improvements and implemented as increased technological change, then costs are
lower than in the other scenarios.
However, if the energy efficiency target is designed as a target on energy demand reduction (as done
in the EU Energy Efficiency Directive), then costs and the demand for offsets are notably higher. In
reality, the response to a target would likely be made up of a mixture of energy efficiency
improvements and reduced energy demand, however the policy costs shown within Figure 11
highlight the importance of providing an incentive for a mixed response to a given target. Whether the
current European target within the Energy Directive is based on energy demand is suitable will be
contingent on the response of industry and consumers, rather than being driven by policy design.
3.2 – 2°C Durban Action policy
Having reviewed the role of natural gas within Europe for two fragmented policy scenarios, the
analysis now turns to how these scenarios differ to a situation where the Durban Action Platform
delivers a binding international climate treaty entering into force in 2025 with the aim of ensuring that
the 2100 global temperature increase is below 2°C with sufficiently high probability.
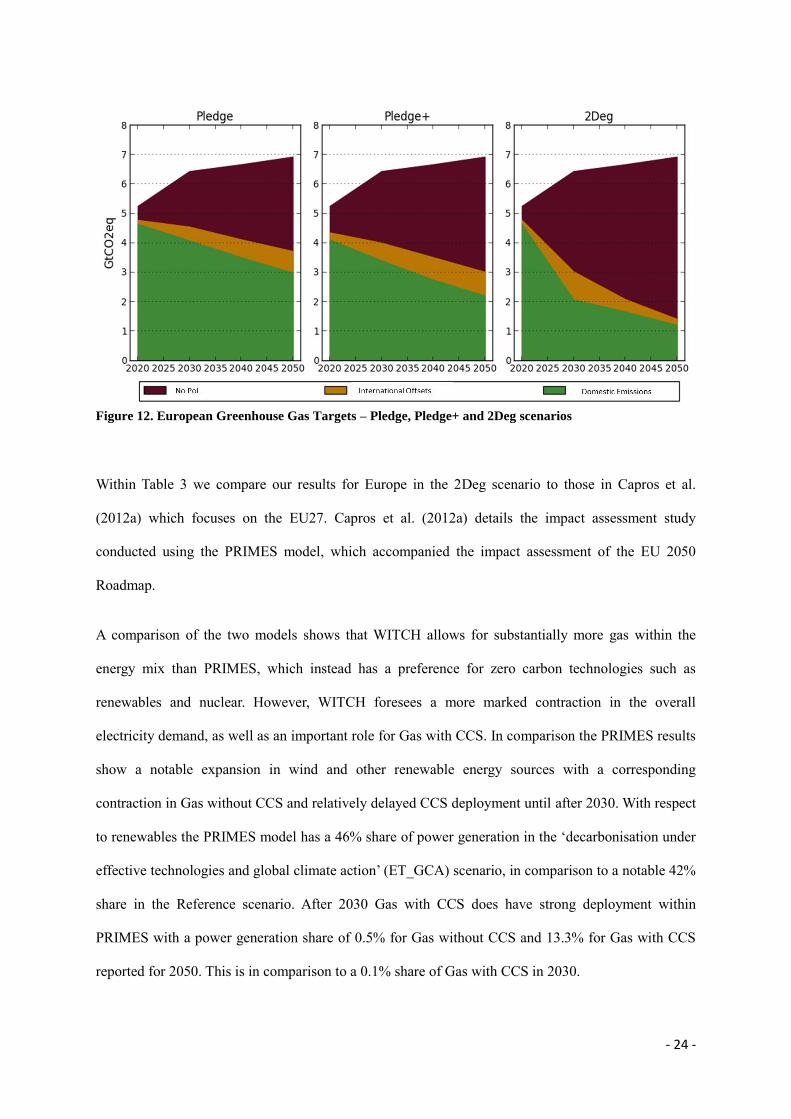
Figure 12 updates the European Greenhouse Gas targets for the Pledge, Pledge+ scenarios, including
also the case of 2Deg. Under the 2Deg policy, emissions in Europe would need to be cut significantly
more than in the Pledge and Pledge+ policies, by 60% in 2030 and 80% in 2050. This result is
consistent with the emission reductions specified within the EU 2050 Roadmap.
- 24 -
Figure 12. European Greenhouse Gas Targets – Pledge, Pledge+ and 2Deg scenarios
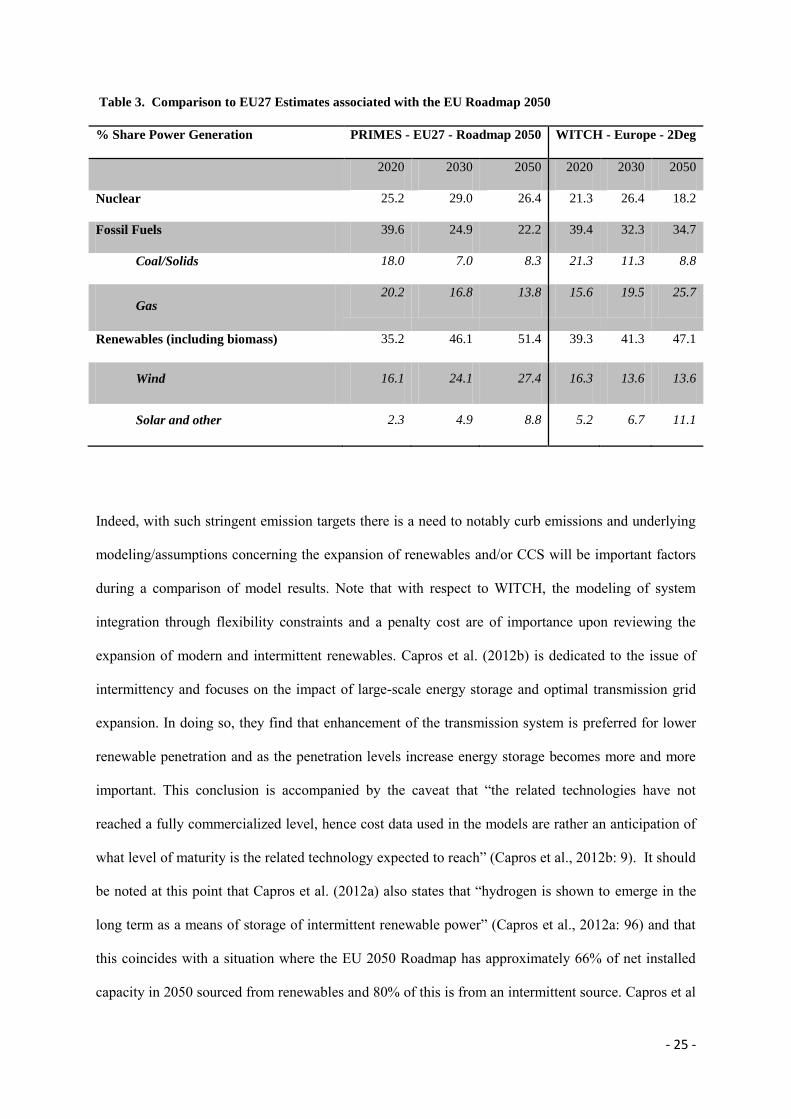
Within Table 3 we compare our results for Europe in the 2Deg scenario to those in Capros et al.
(2012a) which focuses on the EU27. Capros et al. (2012a) details the impact assessment study
conducted using the PRIMES model, which accompanied the impact assessment of the EU 2050
Roadmap.
A comparison of the two models shows that WITCH allows for substantially more gas within the
energy mix than PRIMES, which instead has a preference for zero carbon technologies such as
renewables and nuclear. However, WITCH foresees a more marked contraction in the overall
electricity demand, as well as an important role for Gas with CCS. In comparison the PRIMES results
show a notable expansion in wind and other renewable energy sources with a corresponding
contraction in Gas without CCS and relatively delayed CCS deployment until after 2030. With respect
to renewables the PRIMES model has a 46% share of power generation in the ‘decarbonisation under
effective technologies and global climate action’ (ET_GCA) scenario, in comparison to a notable 42%
share in the Reference scenario. After 2030 Gas with CCS does have strong deployment within
PRIMES with a power generation share of 0.5% for Gas without CCS and 13.3% for Gas with CCS
reported for 2050. This is in comparison to a 0.1% share of Gas with CCS in 2030.
- 25 -
Table 3. Comparison to EU27 Estimates associated with the EU Roadmap 2050
% Share Power Generation PRIMES - EU27 - Roadmap 2050 WITCH - Europe - 2Deg
2020 2030 2050 2020 2030 2050
Nuclear 25.2 29.0 26.4 21.3 26.4 18.2
Fossil Fuels 39.6 24.9 22.2 39.4 32.3 34.7
Coal/Solids 18.0 7.0 8.3 21.3 11.3 8.8
Gas 20.2 16.8 13.8 15.6 19.5 25.7
Renewables (including biomass) 35.2 46.1 51.4 39.3 41.3 47.1
Wind 16.1 24.1 27.4 16.3 13.6 13.6
Solar and other 2.3 4.9 8.8 5.2 6.7 11.1
Indeed, with such stringent emission targets there is a need to notably curb emissions and underlying
modeling/assumptions concerning the expansion of renewables and/or CCS will be important factors
during a comparison of model results. Note that with respect to WITCH, the modeling of system
integration through flexibility constraints and a penalty cost are of importance upon reviewing the
expansion of modern and intermittent renewables. Capros et al. (2012b) is dedicated to the issue of
intermittency and focuses on the impact of large-scale energy storage and optimal transmission grid
expansion. In doing so, they find that enhancement of the transmission system is preferred for lower
renewable penetration and as the penetration levels increase energy storage becomes more and more
important. This conclusion is accompanied by the caveat that “the related technologies have not
reached a fully commercialized level, hence cost data used in the models are rather an anticipation of
what level of maturity is the related technology expected to reach” (Capros et al., 2012b: 9). It should
be noted at this point that Capros et al. (2012a) also states that “hydrogen is shown to emerge in the
long term as a means of storage of intermittent renewable power” (Capros et al., 2012a: 96) and that
this coincides with a situation where the EU 2050 Roadmap has approximately 66% of net installed
capacity in 2050 sourced from renewables and 80% of this is from an intermittent source. Capros et al

- 26 -
(2012a) also notes that in order “to avoid curtailment of RES the model develops endogenously hydro
pumping and hydrogen, the latter being used for mixing with natural gas” (Capros et al., 2012a: 88).
Indeed, the introduction of hydrogen production from excess electricity is a crucial feature of the
PRIMES model with respect to intermittent renewables and has a direct impact upon the demand for
natural gas.
Having discussed the EU 2050 Roadmap scenarios from the PRIMES model, we now return to an
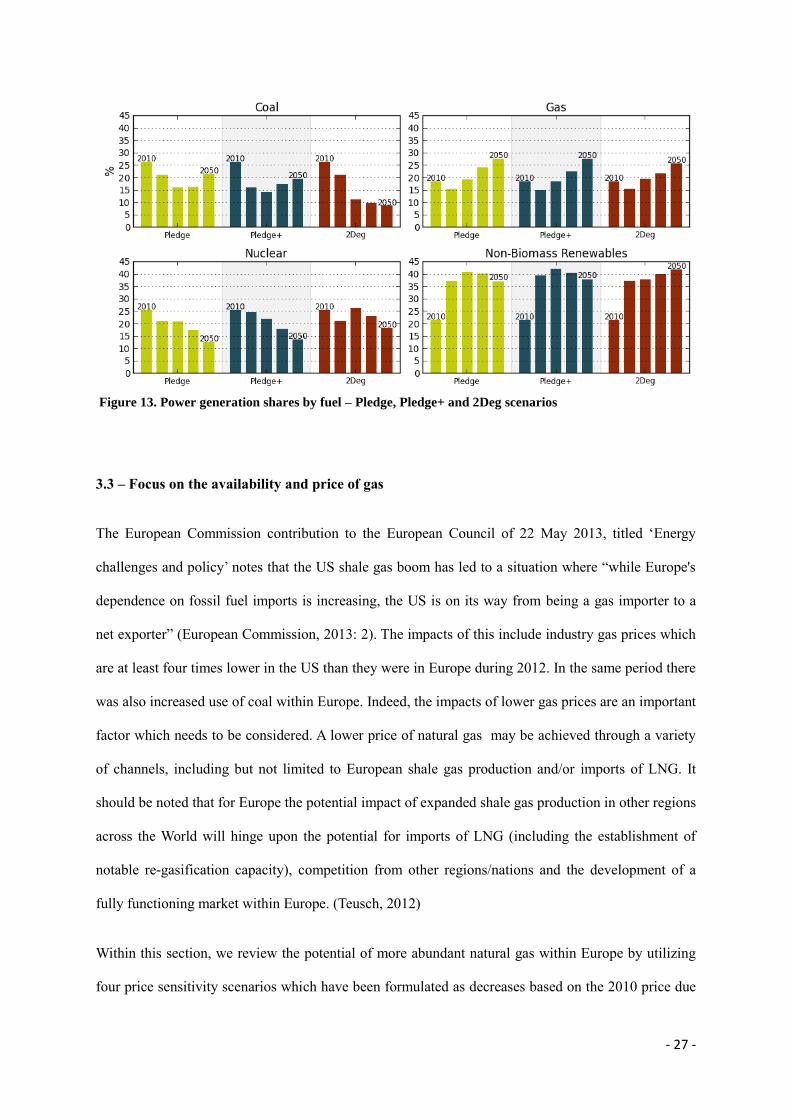
analysis of the results for a 2Deg policy. The power generation shares for Europe are shown within
Figure 13. In 2030, the power generation shares are 11% for coal, 19% for natural gas, 38% for non-
biomass renewable and 26% for nuclear, in comparison to Pledge shares of 16%, 19%, 41% and 21%,
respectively. Natural gas maintains a similar (albeit slightly lower) share in the power mix than in the
moderate and stepped up policies (i.e. Pledge and Pledge+). Underlying these numbers are strong
energy efficiency improvements with 2Deg in 2030 having a 10% reduction of total electricity
demand in comparison to the Pledge case which is almost equivalent to the high energy efficiency
scenarios reviewed within the fragmented policies. The strength of the reduction in energy demand
results in the spike for nuclear within Figure 13 in 2030 as the capacity of nuclear has been fixed to
reflect a partial phase out nuclear of within Western Europe.
Having reviewed gas as a percentage share, we now review the amount of natural gas based electricity
in terms of TWh across the 2Deg additional policy scenarios and show that increased demand for gas
wrt 2010 tends to occur in all but the HEE scenario and when the renewable target has an impact (i.e.
2020 within 2Deg, but not within 2Deg/NoRET). In comparison to the Pledge and Pledge+ cases
there is a lower demand for natural gas with the 2050 amount in 2Deg being 976 TWh in comparison
to 1276 TWh in Pledge and 1245 TWh in Pledge+. However, this is in line with only a slight
difference in the power generation share and is driven by the reduced electricity demand. Policy costs
within the 2Deg scenario are significant irrespective of global action and in 2050 costs are over three
times larger than in the other policies considered (6.27% in comparison to 1.47% in Pledge and 1.85%
in Pledge+).
- 27 -
Figure 13. Power generation shares by fuel – Pledge, Pledge+ and 2Deg scenarios
3.3 – Focus on the availability and price of gas
The European Commission contribution to the European Council of 22 May 2013, titled ‘Energy
challenges and policy’ notes that the US shale gas boom has led to a situation where “while Europe's
dependence on fossil fuel imports is increasing, the US is on its way from being a gas importer to a
net exporter” (European Commission, 2013: 2). The impacts of this include industry gas prices which
are at least four times lower in the US than they were in Europe during 2012. In the same period there
was also increased use of coal within Europe. Indeed, the impacts of lower gas prices are an important
factor which needs to be considered. A lower price of natural gas may be achieved through a variety
of channels, including but not limited to European shale gas production and/or imports of LNG. It
should be noted that for Europe the potential impact of expanded shale gas production in other regions
across the World will hinge upon the potential for imports of LNG (including the establishment of
notable re-gasification capacity), competition from other regions/nations and the development of a
fully functioning market within Europe. (Teusch, 2012)
Within this section, we review the potential of more abundant natural gas within Europe by utilizing
four price sensitivity scenarios which have been formulated as decreases based on the 2010 price due
- 28 -
to additional supply. Before focusing upon the price sensitivity scenarios, it should be acknowledged
that these price levels are not directly related to certain levels of increased shale gas production or the
expansion of LNG imports. Nonetheless, the changes of prices analyzed in this section could be
consistent with expanded supply of natural gas induced by more shale gas in Europe or LNG imports.
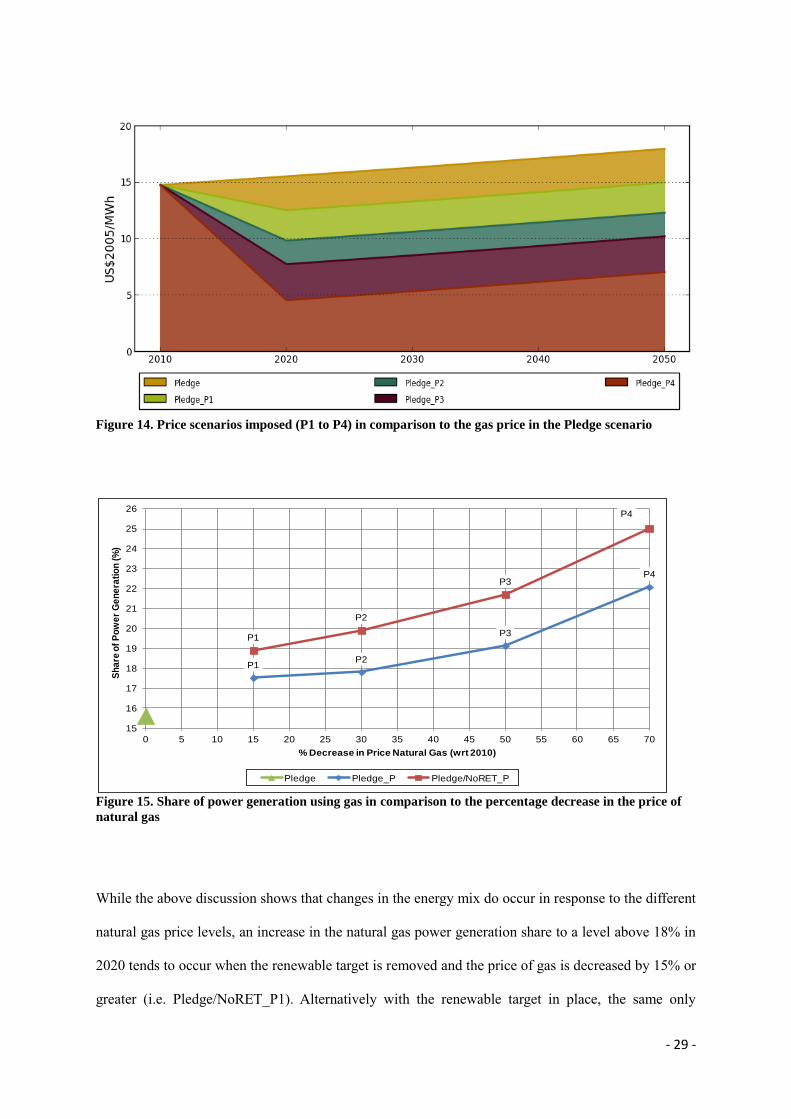
Figure 14 presents the four price scenarios which have been implemented within the Pledge and
Pledge+ scenarios to reflect more abundant gas within Europe. These price/gas abundance scenarios
are composed of a decrease in the price of primary gas supply of approximately 15% (P1), 30% (P2),
50% (P3) and 70% (P4) in 2020, with respect to the 2010 level. In all cases where the lower
price/more abundant gas is applied, the gas contraction seen in the Pledge scenario disappears
irrespective of continued suppressed demand from low economic growth and the renewable target
being in place.
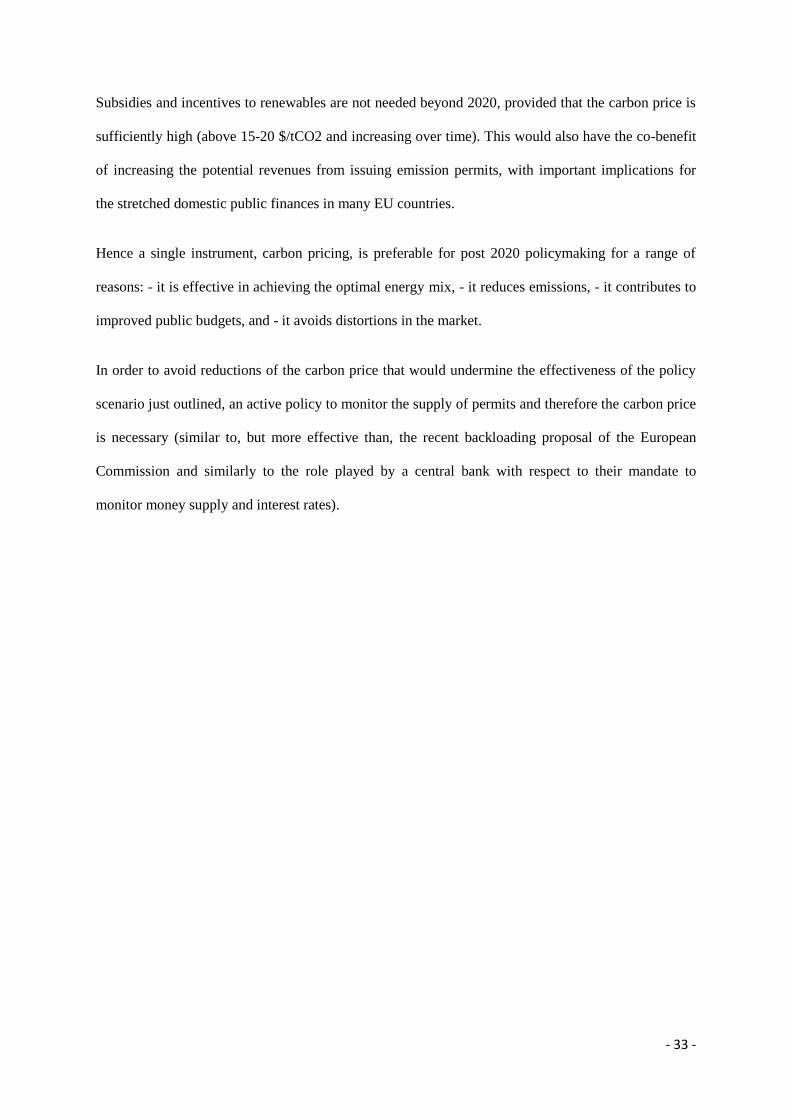
With respect to the Pledge scenario without the price changed, Pledge_P1 has an increased utilization
of gas of 12.55% (75 TWh) in 2020. Figure 15 presents this percentage change as the actual power
generation share achieved by natural gas – approximately 17.5% in 2020 in comparison to 15.6%
when there was no change in the price. Price levels P2, P3 and P4 are associated with natural gas
power generation shares of 17.8%, 19.1% and 22.1%, respectively. As expected, removing the
renewable target results in larger increases in natural gas and results in Pledge/NoRET_P1 having an
increase in generation of 13.73% (81 TWh) or the achievement of a 19% power generation share. A
policy consistent with the Pledge+ scenario shows similar natural gas power generation shares in
comparison to the Pledge case with 17.7% (P1), 18.8% (P2), 19.1% (P3) and 21.6% (P4). The
removal of the renewable target makes a sizable difference, with Pledge+/NoRET_P1 associated with
a power generation share of 20.3%, increasing to 20.7% (P2), 22.0% (P3) and 24.7% (P4).
Focusing on the lowest price change, a decrease in the price of gas by 15% with respect to 2010,
results in a change in power generation share of approximately 1.4-2.6 percentage points when the
renewable target is removed (depending on whether the policy focused upon is Pledge or Pledge+).
- 29 -
Figure 14. Price scenarios imposed (P1 to P4) in comparison to the gas price in the Pledge scenario
Figure 15. Share of power generation using gas in comparison to the percentage decrease in the price of
natural gas
While the above discussion shows that changes in the energy mix do occur in response to the different
natural gas price levels, an increase in the natural gas power generation share to a level above 18% in
2020 tends to occur when the renewable target is removed and the price of gas is decreased by 15% or
greater (i.e. Pledge/NoRET_P1). Alternatively with the renewable target in place, the same only
P1P2
P3
P4
P1
P2
P3
P4
15
16
17
18
19
20
21
22
23
24
25
26
0 5 10 15 20 25 30 35 40 45 50 55 60 65 70
Sh
are
of
Po
we
r G
en
era
tio
n (
%)
% Decrease in Price Natural Gas (wrt 2010)
Pledge Pledge_P Pledge/NoRET_P

- 30 -
occurs when the price of gas has decreased by almost 50% (i.e. Pledge_P3), hence the impact of the
renewable target on the potential expansion of natural gas is shown to be significant.
Section 4 – Conclusions
This paper has used WITCH, an integrated assessment energy-economic model to assess a range of
energy and climate policy scenarios, as a way to pin down the prospects for natural gas within the
welfare-maximising energy mix in Europe for the next four decades. In doing so, it reviewed the role
of natural gas within climate efforts, which include the Copenhagen Pledges and the EU Roadmap –
with specific sensitivity analysis upon the role of the 2020 renewable targets and increased energy
efficiency improvements.
Section 3.1 reviewed the implications for Europe by focusing on power generation shares and policy
costs across a range of scenarios which were defined with section 2. Section 3.2 then focused on the
achievement of a 2°C Durban Action policy with our results compared to those conducted using the
PRIMES model, which accompanied the impact assessment of the EU 2050 Roadmap. Section 3.3
closed the analysis with a focus on the potential of more abundant natural gas within Europe and
utilized four price sensitivity scenarios which have been formulated as decreases based on the 2010
price due to additional supply.
Having conducted this analysis we can now summarize the large body of results into three key points.
The first is the importance of setting a suitable and sustained carbon price which ensures that the right
incentives are given to energy markets so that the welfare-maximising energy mix can be achieved.
This would also reduce the policy costs related to all of the climate policy targets reviewed within the
analysis. The second point is that natural gas is very likely to be the key transitional fuel within the
cost-effective achievement of a range of climate policy targets. And lastly, the importance of avoiding
distortive policy instruments, e.g. subsidies, is highlighted. The next three sub-sections provide further
detail on these points with respect to the analysis conducted within section 3.

- 31 -
4.1 Setting the right carbon price
Even a moderate and fragmented climate policy is sufficient to provide the appropriate incentives for
re-aligning energy markets dynamics with climate objectives. This would require a carbon price of
above 15 $/tCO2 which grows to 60-70 $/tCO2 over time. This can be achieved at moderate
economic cost by a 2030 emission reduction target in the range of 25%-35%, and a 2050 target of 40-
60% (all relative to 2005).
The 2050 Energy Roadmap (reduction targets of 60% in 2030 and 80% in 2050 which are consistent
with a global objective of 2°C in 2100) would have a significantly higher economic impact (much
higher GDP losses) than the fragmented carbon policy scenarios identified as Pledge and Pledge+,
even with global action consistent with the Durban Action Platform. In light of the current levels of
international effort and emission abatement within key economies, much more international
coordination and/or carbon market integration worldwide is needed for emission targets to be both
cost effective and in line with the results for the 2Deg scenario.1 Our results show indeed that costs for
Europe in the 2Deg scenarios would be too high in the absence of a fully coordinated global policy.
In relation to providing appropriate incentives for energy markets via a carbon price, it is important to
note that modern renewables, such as solar and wind, are becoming competitive due to the existing
targets and incentives. Modern renewables would continue to play an important role after 2020 as
long as carbon prices are sufficiently high (e.g. 20-50$/tCO2) and this will occur even without
additional incentives or subsidies.
Energy efficiency regulation could play an important role by reducing overall electricity demand:
however, the policy design will matter with a notable impact in terms of policy costs, depending on
whether it is implemented through improved intensity or reduced demand. Indeed, if the energy
efficiency target is designed as a target on energy demand reduction (as done in the EU Energy
Efficiency Directive), then costs and the demand for offsets are notably higher.
1 Let us recall that a global carbon market would achieve the same outcomes in terms of emissions and costs as a
fully and globally coordinated policy.

- 32 -
4.2 Gas as a transition technology
Due to slow growth in demand and the growing role of renewables which has been induced by the EU
target and related incentives/subsidies, natural gas use in power generation is expected to slightly
decline until 2020 (unless important changes in gas supply related to share gas production occur). The
impact of the renewable target is notable, with no contraction in the share of natural gas occurring
within the target is removed (the NoRET cases).
Irrespective of a decrease in the share of natural gas until 2020 due to the renewable target, the share
of natural gas rises after 2020 and an increase in gas is consistent with the cost-effective achievement
of a range of climate targets – refer to the discussion surrounding Figure 6 for further details. In other
words, although natural gas‘s share falls through 2020, it will rise after 2020 if climate targets are to
be met cost-effectively.
After 2020, both the Pledge and Pledge+ climate policies would induce an increase in gas
consumption, while the use of coal decreases. After 2020, increases in gas consumption and a phase
out of coal would be enhanced by promoting climate policies which sustain carbon prices above
15$/tCO2 and up to 50-70$/tCO2 in the following decades.
Gas demand would increase after 2020 in all simulated policy scenarios, including the 2Deg scenario
through linkages to CCS. The growth of renewables is likely to slow down after 2020 due to
limitations of system integration. This will enhance the role of gas as a transition fuel. However, to
achieve the 2°C target a further development of renewables is required, even at high costs, which
explains the high policy cost of the 2Deg scenario.
4.3 Policy instrument mix
Carbon prices in 2020 should be in the range of 10-15 $/tCO2 for standard policies, and 20-30 $/tCO2
if the supply of permits is tightened. The renewable target has been found to deflate the carbon price
by about 10 $/tCO2, with negative consequences on climate friendly investments, business strategies
and public revenues.
- 33 -
Subsidies and incentives to renewables are not needed beyond 2020, provided that the carbon price is
sufficiently high (above 15-20 $/tCO2 and increasing over time). This would also have the co-benefit
of increasing the potential revenues from issuing emission permits, with important implications for
the stretched domestic public finances in many EU countries.
Hence a single instrument, carbon pricing, is preferable for post 2020 policymaking for a range of
reasons: - it is effective in achieving the optimal energy mix, - it reduces emissions, - it contributes to
improved public budgets, and - it avoids distortions in the market.
In order to avoid reductions of the carbon price that would undermine the effectiveness of the policy
scenario just outlined, an active policy to monitor the supply of permits and therefore the carbon price
is necessary (similar to, but more effective than, the recent backloading proposal of the European
Commission and similarly to the role played by a central bank with respect to their mandate to
monitor money supply and interest rates).

- 34 -
References
Blesi, M., T. Kober, D. Bruchof and R. Kuder, (2010) “Effects of climate and energy policy related
measures and targets on the future structure of the European energy system in 2020 and beyond.”
Energy Policy, Vol. 38, No. 10: 6278-6292.
Böhringer, C., T. Rutherford, and R. Tol, (2009). “The EU 20/20/2020 targets: An overview of the
EMF22 assessment.” Energy Economics, 31: S268-S273.
Bosello, F., L. Campagnolo, C. Carraro, F. Eboli, R. Parrado, and E. Portale, (2013).
“Macroeconomic Impacts of the EU 30% GHG Mitigation Target”, FEEM Working Paper No.
28.2013, CMCC Research Paper No. 0173.
Bosetti, V., C. Carraro, M. Galeotti, E. Massetti and M. Tavoni, (2006). “WITCH: A World Induced
Technical Change Hybrid Model.” The Energy Journal, Special Issue on Hybrid Modelling of
Energy-Environment Policies: Reconciling Bottom-up and Top-down, 13-38.
Bosetti, V., E. De Cian, A. Sgobbi and M. Tavoni (2009). “The 2008 WITCH Model: New Model
Features and Baseline.” Fondazione Eni Enrico Mattei, mimeo.
Bosetti, V., Massetti, E. and Tavoni, M. (2007). “The WITCH model: Structure, Baseline and
Solutions.” FEEM Working Paper 10-2007.
Capros, P., N. Tasios, A. De Vita, L. Mantzos, and L. Paroussos (2012a) “Transformations of the
energy system in the context of the decarbonisation of the EU economy in the time horizon to 2050”,
European Energy System Models, Vol. 1, No. 2: 85-96.
Capros, P., N. Tasios, and A. Marinakis (2012b) "Very high penetration of Renewable Energy
Sources to the European Electricity System in the context of model-based analysis of an energy
roadmap towards a low carbon EU economy by 2050." 9th International Conference on the European
Energy Market, IEEE, 2012.
Citi Research (2012) “Shale & renewables: a symbiotic relationship.” (Accessed on June 4, 2013
from:
https://ir.citi.com/586mD+JRxPXd2OOZC6jt0ZhijqcxXiPTw4Ha0Q9dAjUW0gFnCIUTTA==)
DG Energy (2013) “The future role and challenges of Energy Storage”. (Accessed on July 29, 2013
from: http://ec.europa.eu/energy/infrastructure/doc/energy-storage/2013/energy_storage.pdf)
European Commission (2011) “Energy Roadmap 2050.” (Accessed on June 4, 2013 from:
http://ec.europa.eu/energy/energy2020/roadmap/doc/com_2011_8852_en.pdf)
European Commission (2013) “Energy challenges and policy – Commission contribution to the
European Council of 22 May 2013”. (Accessed on July 29, 2013 from:
http://ec.europa.eu/europe2020/pdf/energy2_en.pdf)
Eurostat (2013) Supply, transformation - solid fuels (hard coal) - monthly data [nrg_101m], Supply,
transformation - oil - monthly data [nrg_102m], and Supply - gas - monthly data [nrg_103m].
(Accessed on June 18, 2013)

- 35 -
Hoogwijk, M., D. van Vuuren, B. de Vries, and W. Turkenburg (2007) “Exploring the impact on cost
and electricity production of high penetration levels of intermittent electricity in OECD Europe and
the USA, results for wind energy”, Energy, 32: 1381-1402.
Knopf, B., Y. Chen, E. De Cian, H. Förster, A. Kanudia, I. Karkatsouli, I. Keppo, T. Koljonen, K.
Schumacher, D. van Vuuren (2013) “Beyond 2020 – Strategies and costs for transforming the
European energy system”, Climate Change Economics (Submitted).
National Renewable Energy Laboratory (2012) “Opportunities for Synergy Between Natural Gas and
Renewable Energy in the Electric Power and Transportation Sectors” Technical Report NREL/TP-
6A50-56324.
Sullivan, P., V. Krey and K. Riahi (2013) “Impacts of considering electric sector variability and
reliability in the MESSAGE model.”, Energy Strategy Reviews, 1: 157-163.
Teusch, J. (2012) “Shale Gas and the EU Internal Gas Market: Beyond the hype and hysteria”. CEPS
Working Document, No. 369.
UBS Investment Research (2013) “The unsubsidised solar revolution.”
- 36 -
Appendix
Specification of policy scenarios
This Appendix reviews the policy specific specifications of the climate policy scenarios utilised
within this paper.
The definition of policies in the moderate and stepped up scenarios are in line with the AMPERE
(http://ampere-project.eu/web/) and LIMITS (http://www.feem-project.net/limits/) projects, funded by
the European Commission under the 7th framework programme.
For some countries, the carbon intensity or emissions reductions targets represent the lower end of
their Copenhagen pledges. For other countries, plausibility considerations lead to the specification of
emissions reductions targets that are weaker than their Copenhagen pledges. In cases where
Copenhagen pledges appeared to be ambitious (mostly developing country emissions reductions
relative to baseline), the level of stringency was halved. For the U.S., the 2020 reduction target was
taken from an assessment of the impact of existing US regulations2. Country targets were extrapolated
to larger regions under the assumption that neighboring countries follow the regional leaders.
Moderate Policy
Fragmented moderate action on climate, with region specific policy objectives based on 2020
emission reduction targets, technology specific policies (e.g. renewables, nuclear) and post 2020
carbon intensity targets.
Regions can trade carbon offsets internationally (e.g. CDM type of project), but at most 20% of
abatement can be attained on the market, and 80% has to be done domestically. For Europe, this
entails the legislated 2020 targets (emissions, renewables and efficiency), and a post 2020
extrapolation of the climate policies, with a 2030 and 2050 target of 25% and 45% emissions
reductions with respect to 2005 respectively.
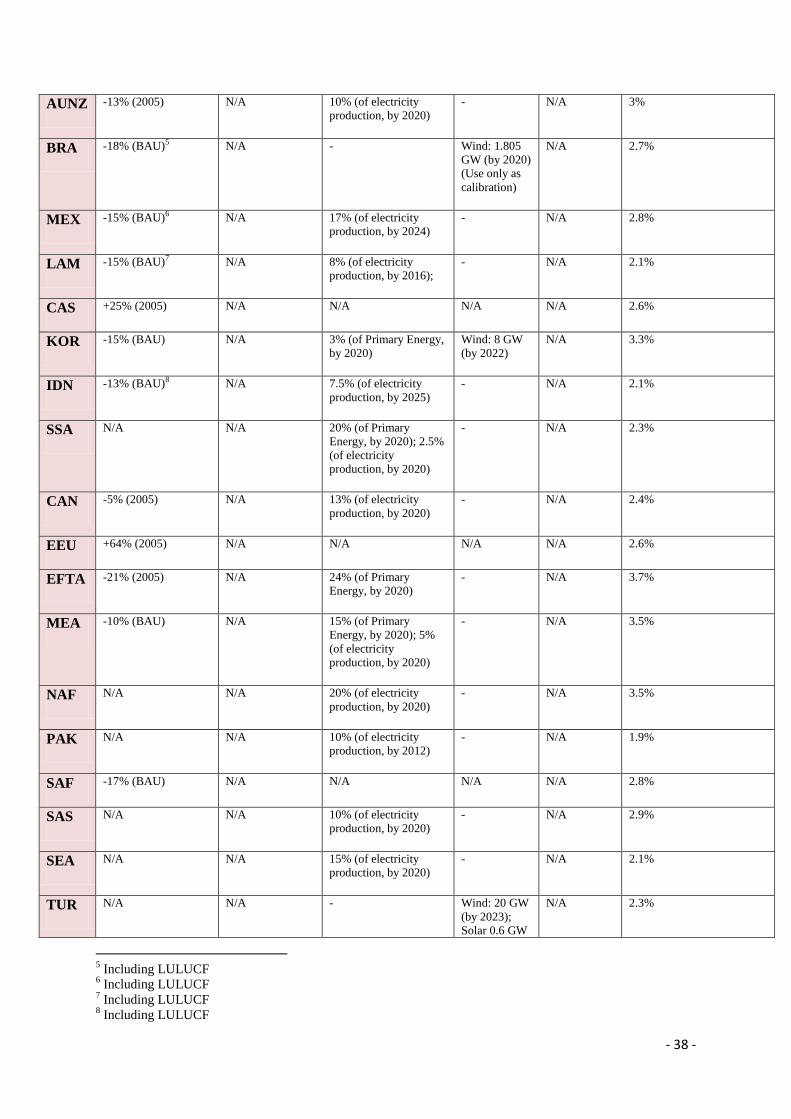
Full details of emission targets and specific capacity settings for key regions are provided in the table
below.
2 Source: N. Bianco, F. Litz, Reducing Greenhouse Gas Emissions in the United States Using Existing Federal
Authorities and State Action, Report World Resources Institute, 2010.

- 37 -
Region Across the board
GHG emissions
reductions target
in 2020
(relative to 20053 or
no policy baseline
(BAU) as specified
in brackets; use
your model baseline
in the latter case;
excl. LULUCF if
not indicated
differently)
Carbon
intensity
reductions
(relative to
2005. Intensity
improvements
measured
relative to GDP
PPP scenario.)
Modern Renewable
share (incl. hydro,
excl. non-
commercialized
biomass)
(Reference quantity
PE, FE, or electricity
in brackets. Targets
formulated in terms
of PE shares of
renewable energy are
calculated using the
substitution method.)
Installed
renewable
energy
capacity
(Capacity
targets are
minimum
levels; target
year in
brackets)
Installed
nuclear
power
capacity
(Capacity
targets are
minimum
levels; target
year in
brackets)
Average GHG
emissions intensity
improvements after
2020
(% / year; Kyoto GHG
equivalent emissions
excluding LULUCF.
Intensity improvements
measured relative to GDP
PPP scenario.)
EU27 -15% (2005) N/A 20% (of Final Energy,
by 2020)
Also the Energy
Efficiency target of
20% reduction in
primary energy
consumption by 2020
- A gradual
reduction in
nuclear
capacity
(from 120GW
to 100GW in
2030, 70GW
in 2050)
Emissions reduction targets
of 25% in 2030 and 45% in
2050 wrt to 2005
(compatible with GHG
emission intensity
improvement of about 3%
per year)
CHN N/A -40% 15% (of Primary
Energy, by 2020)
Wind: 100
GW (grid
connected,
5GW off
shore); Solar
PV: 10GW;
Hydro: 270
GW (all by
2015)
41 GW
(2020)
3.3%
IND N/A -20% - Wind: 20
GW; Solar: 10
GW; Small
hydro: 3.25
GW,
Biopower:
3.75 GW (all
by 2022)
20 GW
(2020)
3.3%
JPN -11% (2005) N/A - Wind: 5 GW;
Solar: 28 GW
(all by 2020)
N/A 2.2%
USA -5% (2005) N/A 13% (of electricity
production, by 2020);
- N/A 2.5%
RUS +27% (2005)4 N/A 2.5% (of electricity
production, by 2015);
4.5% (of electricity
production, by 2020)
- 34 GW
(2030)
2.6%
3 Source GHG emissions: European Commission, Joint Research Centre (JRC)/PBL Netherlands Environmental
Assessment Agency. Emission Database for Global Atmospheric Research (EDGAR), release version 4.2.
http://edgar.jrc.ec.europe.eu, 2011 4 Including LULUCF
- 38 -
AUNZ -13% (2005) N/A 10% (of electricity
production, by 2020)
- N/A 3%
BRA -18% (BAU)5 N/A - Wind: 1.805
GW (by 2020)
(Use only as
calibration)
N/A 2.7%
MEX -15% (BAU)6 N/A 17% (of electricity
production, by 2024)
- N/A 2.8%
LAM -15% (BAU)7 N/A 8% (of electricity
production, by 2016);
- N/A 2.1%
CAS +25% (2005) N/A N/A N/A N/A 2.6%
KOR -15% (BAU) N/A 3% (of Primary Energy,
by 2020)
Wind: 8 GW
(by 2022)
N/A 3.3%
IDN -13% (BAU)8 N/A 7.5% (of electricity
production, by 2025)
- N/A 2.1%
SSA N/A N/A 20% (of Primary
Energy, by 2020); 2.5%
(of electricity
production, by 2020)
- N/A 2.3%
CAN -5% (2005) N/A 13% (of electricity
production, by 2020)
- N/A 2.4%
EEU +64% (2005) N/A N/A N/A N/A 2.6%
EFTA -21% (2005) N/A 24% (of Primary
Energy, by 2020)
- N/A 3.7%
MEA -10% (BAU) N/A 15% (of Primary
Energy, by 2020); 5%
(of electricity
production, by 2020)
- N/A 3.5%
NAF N/A N/A 20% (of electricity
production, by 2020)
- N/A 3.5%
PAK N/A N/A 10% (of electricity
production, by 2012)
- N/A 1.9%
SAF -17% (BAU) N/A N/A N/A N/A 2.8%
SAS N/A N/A 10% (of electricity
production, by 2020)
- N/A 2.9%
SEA N/A N/A 15% (of electricity
production, by 2020)
- N/A 2.1%
TUR N/A N/A - Wind: 20 GW
(by 2023);
Solar 0.6 GW
N/A 2.3%
5 Including LULUCF
6 Including LULUCF
7 Including LULUCF
8 Including LULUCF

- 39 -
(by 2013);
Geothermal0.
6 GW (by
2013)
Stepped up Policy
Level of policy ambition is stepped up in 2020 and beyond across all regions.
For Europe, this means tightening the supply of emission permits to 2020 (or equivalently, raising the
ambition of emissions reductions in 2020 to 30% wrt to 1990). For 2030 and 2050, this implies
emission reductions would be 37% and 60% wrt 2005 respectively.
Full details of emission targets and specific capacity settings for key regions are provided in the table
below.
Region Across the board
GHG emissions
reductions target
in 2020
(relative to 20059 or
no policy baseline
(BAU) as specified
in brackets; use
your model baseline
in the latter case;
excl. LULUCF if
not indicated
differently)
Carbon
intensity
reductions
(relative to
2005. Intensity
improvements
measured
relative to GDP
PPP scenario.)
Modern Renewable
share (incl. hydro,
excl. non-
commercialized
biomass)
(Reference quantity
PE, FE, or electricity
in brackets. Targets
formulated in terms
of PE shares of
renewable energy are
calculated using the
substitution method.)
Installed
renewable
energy
capacity
(Capacity
targets are
minimum
levels; target
year in
brackets)
Installed
nuclear
power
capacity
(Capacity
targets are
minimum
levels; target
year in
brackets)
Average GHG
emissions intensity
improvements after
2020
(% / year; Kyoto GHG
equivalent emissions
excluding LULUCF.
Intensity improvements
measured relative to GDP
PPP scenario.)
EU27 -25% (2005) N/A 20% (of Final Energy,
by 2020).
Also the Energy
Efficiency target of
20% reduction in
primary energy
consumption by 2020
- A gradual
reduction in
nuclear
capacity
(from 120GW
to 100GW in
2030, 70GW
in 2050)
Emissions reduction targets
of 37% in 2030 and 60% in
2050 wrt to 2005
(compatible with GHG
emission intensity
improvement of about 3.6%
per year)
CHN N/A -45% 25% ( by 2020) Wind: 300
GW. Solar
80 GW
(2020)
3.9%
9 Source GHG emissions: European Commission, Joint Research Centre (JRC)/PBL Netherlands Environmental
Assessment Agency. Emission Database for Global Atmospheric Research (EDGAR), release version 4.2.
http://edgar.jrc.ec.europe.eu, 2011
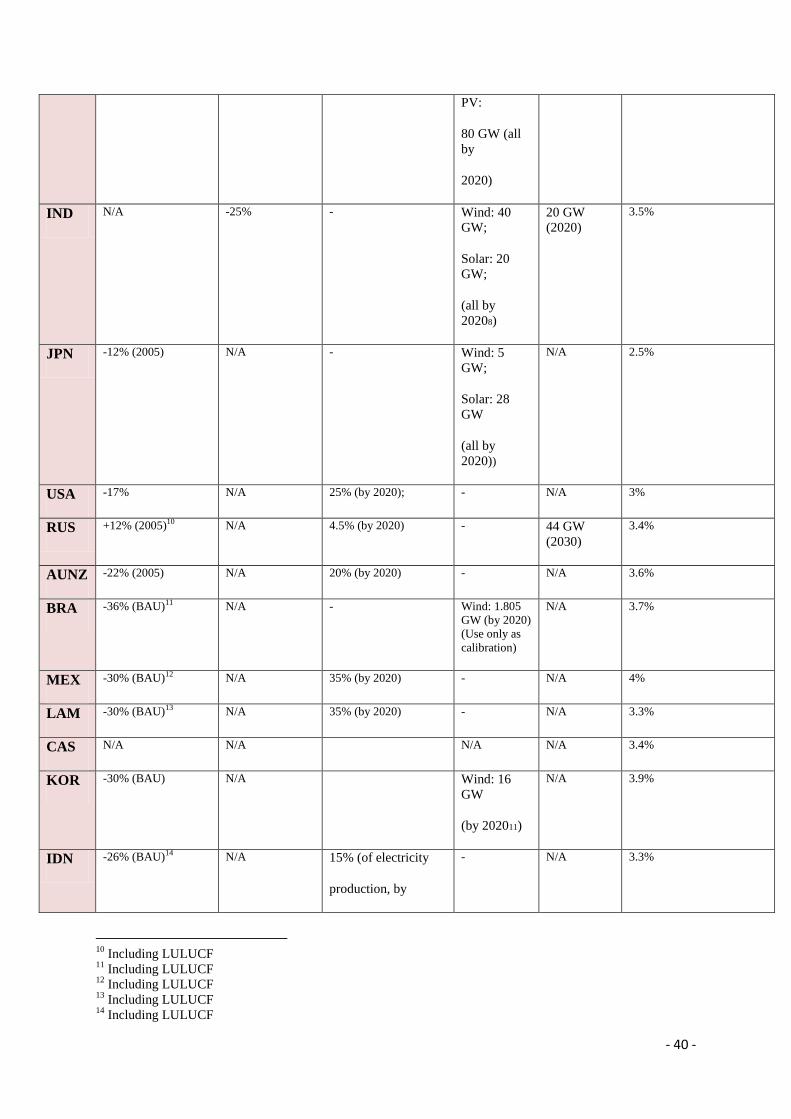
- 40 -
PV:
80 GW (all
by
2020)
IND N/A -25% - Wind: 40
GW;
Solar: 20
GW;
(all by
20208)
20 GW
(2020)
3.5%
JPN -12% (2005) N/A - Wind: 5
GW;
Solar: 28
GW
(all by
2020))
N/A 2.5%
USA -17% N/A 25% (by 2020); - N/A 3%
RUS +12% (2005)10 N/A 4.5% (by 2020) - 44 GW
(2030)
3.4%
AUNZ -22% (2005) N/A 20% (by 2020) - N/A 3.6%
BRA -36% (BAU)11 N/A - Wind: 1.805
GW (by 2020)
(Use only as
calibration)
N/A 3.7%
MEX -30% (BAU)12 N/A 35% (by 2020) - N/A 4%
LAM -30% (BAU)13 N/A 35% (by 2020) - N/A 3.3%
CAS N/A N/A N/A N/A 3.4%
KOR -30% (BAU) N/A Wind: 16
GW
(by 202011)
N/A 3.9%
IDN -26% (BAU)14 N/A 15% (of electricity
production, by
- N/A 3.3%
10
Including LULUCF 11
Including LULUCF 12
Including LULUCF 13
Including LULUCF 14
Including LULUCF
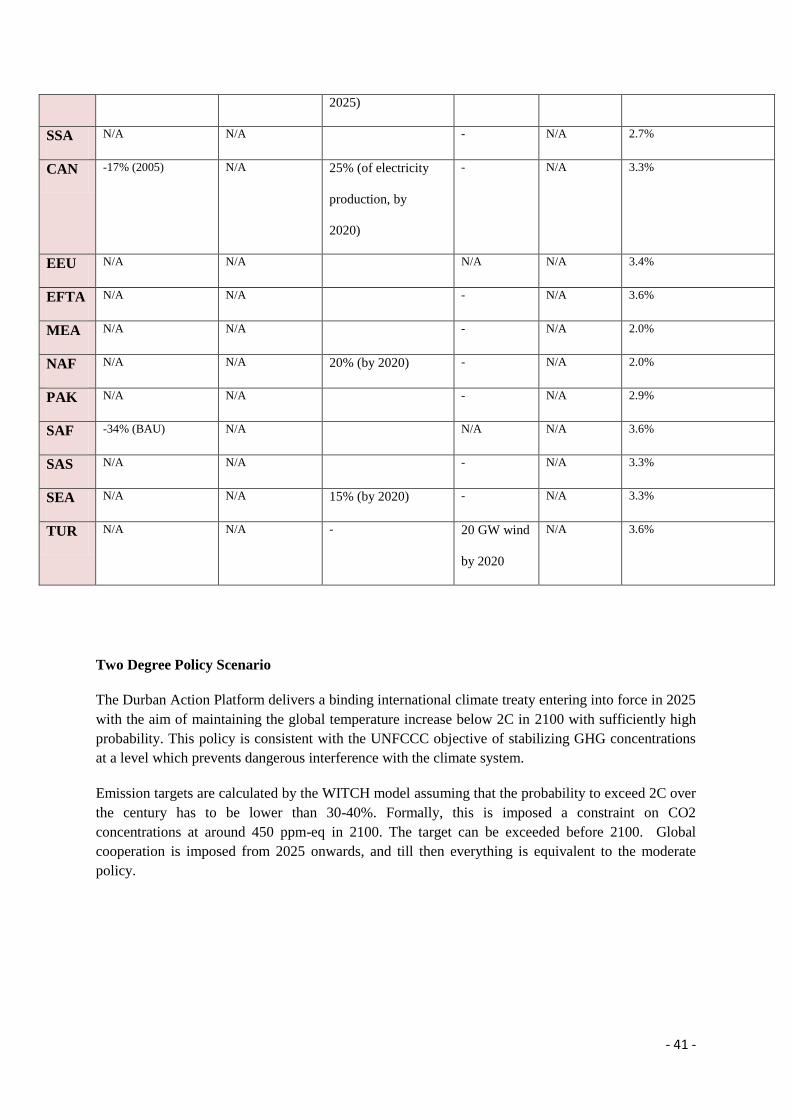
- 41 -
2025)
SSA N/A N/A - N/A 2.7%
CAN -17% (2005) N/A 25% (of electricity
production, by
2020)
- N/A 3.3%
EEU N/A N/A N/A N/A 3.4%
EFTA N/A N/A - N/A 3.6%
MEA N/A N/A - N/A 2.0%
NAF N/A N/A 20% (by 2020) - N/A 2.0%
PAK N/A N/A - N/A 2.9%
SAF -34% (BAU) N/A N/A N/A 3.6%
SAS N/A N/A - N/A 3.3%
SEA N/A N/A 15% (by 2020) - N/A 3.3%
TUR N/A N/A - 20 GW wind
by 2020
N/A 3.6%
Two Degree Policy Scenario
The Durban Action Platform delivers a binding international climate treaty entering into force in 2025
with the aim of maintaining the global temperature increase below 2C in 2100 with sufficiently high
probability. This policy is consistent with the UNFCCC objective of stabilizing GHG concentrations
at a level which prevents dangerous interference with the climate system.
Emission targets are calculated by the WITCH model assuming that the probability to exceed 2C over
the century has to be lower than 30-40%. Formally, this is imposed a constraint on CO2
concentrations at around 450 ppm-eq in 2100. The target can be exceeded before 2100. Global
cooperation is imposed from 2025 onwards, and till then everything is equivalent to the moderate
policy.