The Oil Sands: Canada’s World Scale Hydrocarbon...
26
The Oil Sands: Canada’s World Scale Hydrocarbon Resource April 25, 2012 1 The Oil Sands: Canada’s World Scale Hydrocarbon Resource Calgary PMAC Professional Speaker Series Dinner Event Alberta Institute Purchasing Management Association of Canada 12-1 Photo Source: Syncrude Canada Limited April 25, 2012 Calgary, Alberta Bob Dunbar Strategy West Inc. Presentation Outline Reserves and Historical Production Bitumen Production and Upgrading Markets and Market Access Challenges and Industry Outlook 2 Industry Outlook Economic Impacts and the Supply Chain Conclusions Photo Source: Syncrude Canada Ltd.
-
Upload
hoangnguyet -
Category
Documents
-
view
220 -
download
0
Transcript of The Oil Sands: Canada’s World Scale Hydrocarbon...
The Oil Sands: Canada’s World Scale Hydrocarbon Resource April 25, 2012
1
The Oil Sands: Canada’s World Scale Hydrocarbon Resource
Calgary PMAC Professional Speaker Series Dinner Event
Alberta Institute Purchasing Management Association of Canada
12-1
Photo Source: Syncrude Canada Limited
April 25, 2012Calgary, Alberta
Bob DunbarStrategy West Inc.
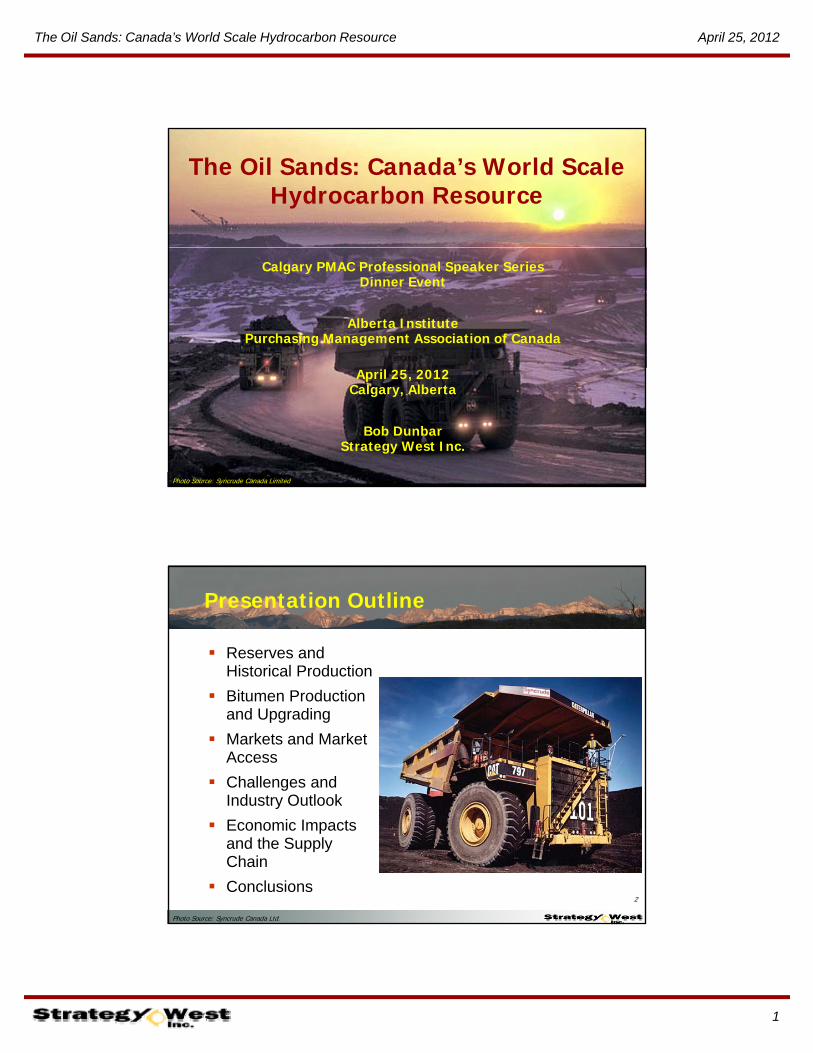
Presentation Outline
Reserves and Historical Production
Bitumen Production and Upgrading
Markets and Market Access
Challenges and Industry Outlook
2
Industry Outlook
Economic Impacts and the Supply Chain
Conclusions
Photo Source: Syncrude Canada Ltd.
The Oil Sands: Canada’s World Scale Hydrocarbon Resource April 25, 2012
2
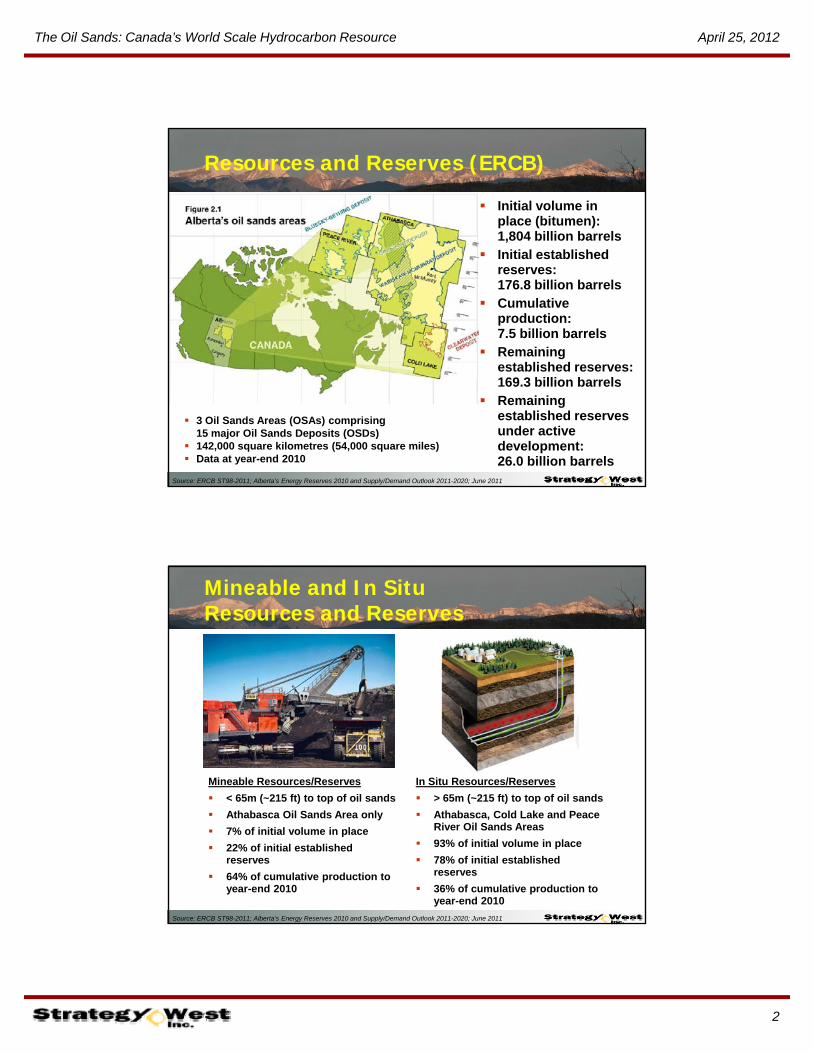
Resources and Reserves (ERCB)
Initial volume in place (bitumen): 1,804 billion barrels
Initial established reserves: 176.8 billion barrels
Cumulative production:7.5 billion barrels
Remaining established reserves:established reserves: 169.3 billion barrels
Remaining established reserves under active development: 26.0 billion barrels
3 Oil Sands Areas (OSAs) comprising 15 major Oil Sands Deposits (OSDs)
142,000 square kilometres (54,000 square miles) Data at year-end 2010
Source: ERCB ST98-2011; Alberta’s Energy Reserves 2010 and Supply/Demand Outlook 2011-2020; June 2011
Mineable and In SituResources and Reserves
Mineable Resources/Reserves
< 65m (~215 ft) to top of oil sands
In Situ Resources/Reserves
> 65m (~215 ft) to top of oil sands
Athabasca Oil Sands Area only
7% of initial volume in place
22% of initial established reserves
64% of cumulative production to year-end 2010
Athabasca, Cold Lake and Peace River Oil Sands Areas
93% of initial volume in place
78% of initial established reserves
36% of cumulative production to year-end 2010
Source: ERCB ST98-2011; Alberta’s Energy Reserves 2010 and Supply/Demand Outlook 2011-2020; June 2011
The Oil Sands: Canada’s World Scale Hydrocarbon Resource April 25, 2012
3
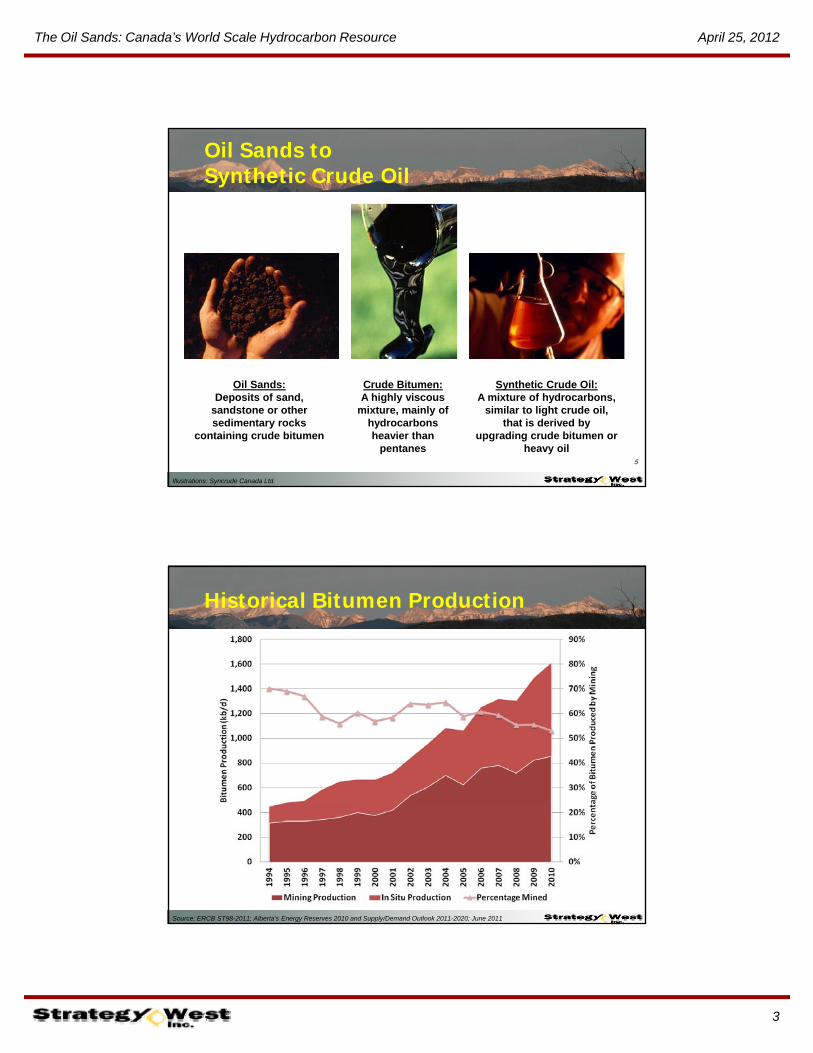
Oil Sands to Synthetic Crude Oil
5
Oil Sands:Deposits of sand,
sandstone or other sedimentary rocks
containing crude bitumen
Synthetic Crude Oil:A mixture of hydrocarbons,
similar to light crude oil, that is derived by
upgrading crude bitumen or heavy oil
Crude Bitumen:A highly viscous
mixture, mainly of hydrocarbons heavier than
pentanes
Illustrations: Syncrude Canada Ltd.
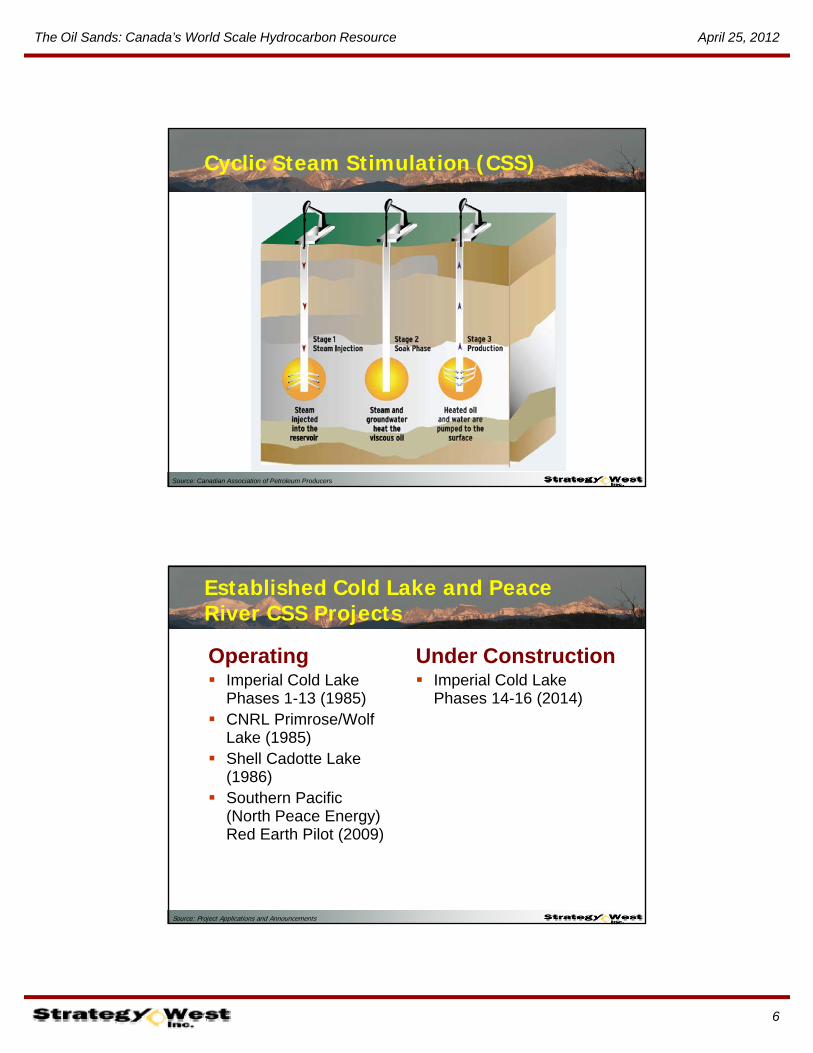
Historical Bitumen Production
Source: ERCB ST98-2011; Alberta’s Energy Reserves 2010 and Supply/Demand Outlook 2011-2020; June 2011

The Oil Sands: Canada’s World Scale Hydrocarbon Resource April 25, 2012
4
Historical Oil Sands Supply
Source: ERCB ST98-2011; Alberta’s Energy Reserves 2010 and Supply/Demand Outlook 2011-2020; June 2011
Historical Oil Sands Industry Expenditures
Source: Canadian Association of Petroleum Producers

The Oil Sands: Canada’s World Scale Hydrocarbon Resource April 25, 2012
5
In Situ Recovery
Primary Recovery Secondary Recovery
T ti R Tertiary Recovery• Steam Injection Cyclic Steam Stimulation
(CSS) Steam Assisted Gravity
Drainage (SAGD)• In Situ Combustion Toe-to-Heel Air Injection
(THAI)(THAI)• Solvent Injection VAPEX N-Solv
• Hybrid (Steam/Solvent & Steam/Gas) Processes
• Electric Heating9
In Situ Recovery: Dealing with Viscosity
10
Sources: Enerplus; Syncrude Canada Limited
The Oil Sands: Canada’s World Scale Hydrocarbon Resource April 25, 2012
6
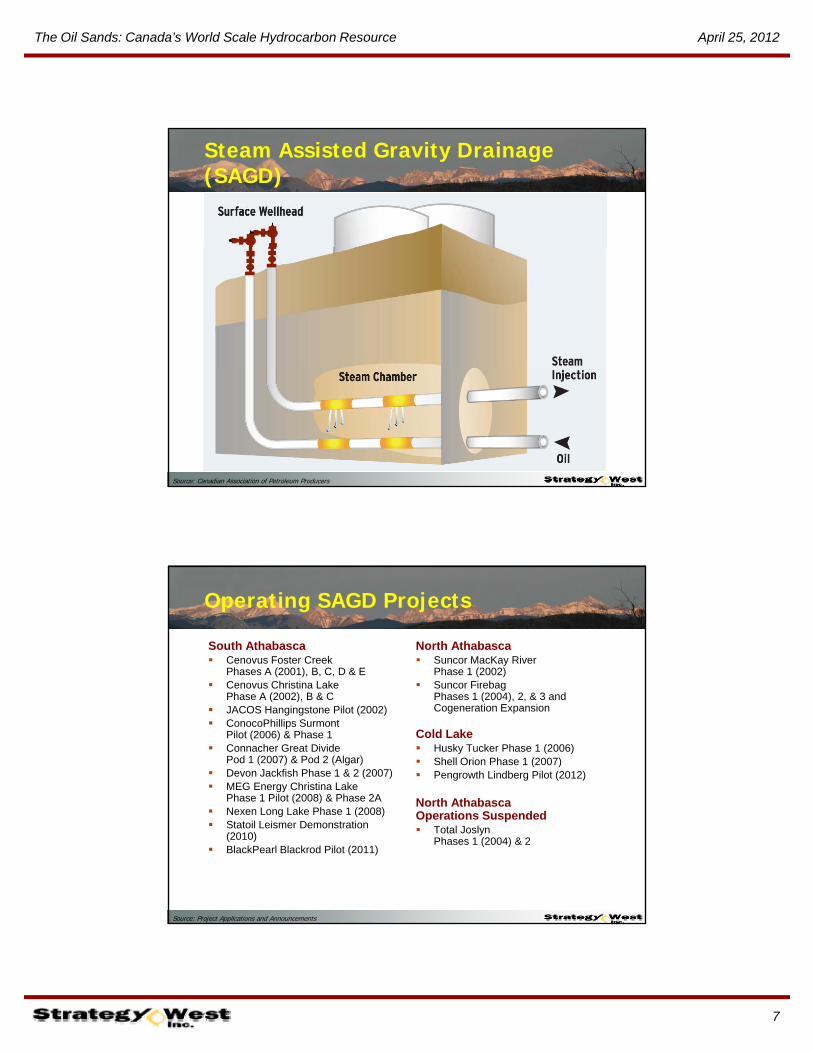
Cyclic Steam Stimulation (CSS)
Source: Canadian Association of Petroleum Producers
Established Cold Lake and Peace River CSS Projects
Operating Imperial Cold Lake
Under Construction Imperial Cold LakeImperial Cold Lake
Phases 1-13 (1985) CNRL Primrose/Wolf
Lake (1985) Shell Cadotte Lake
(1986) Southern Pacific
Imperial Cold Lake Phases 14-16 (2014)
(North Peace Energy) Red Earth Pilot (2009)
Source: Project Applications and Announcements
The Oil Sands: Canada’s World Scale Hydrocarbon Resource April 25, 2012
7
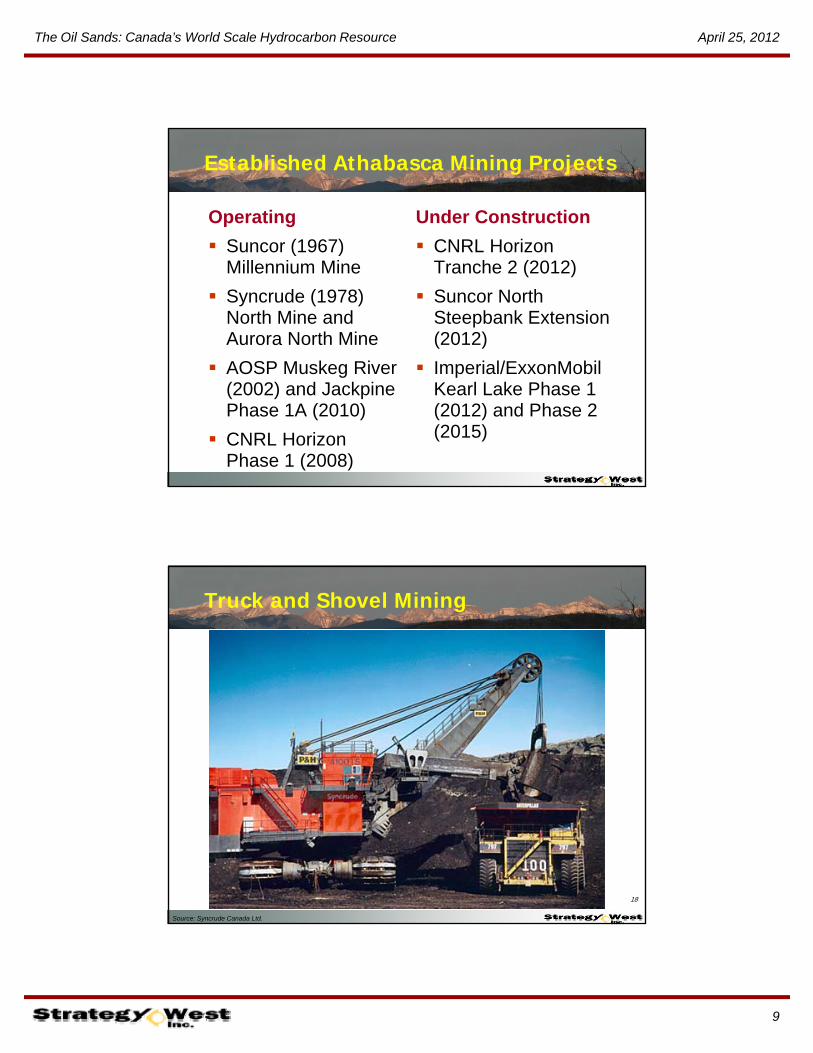
Steam Assisted Gravity Drainage (SAGD)
Source: Canadian Association of Petroleum Producers
Operating SAGD Projects
South Athabasca Cenovus Foster Creek
Phases A (2001), B, C, D & E Cenovus Christina Lake
North Athabasca Suncor MacKay River
Phase 1 (2002) Suncor Firebag Cenovus Christina Lake
Phase A (2002), B & C JACOS Hangingstone Pilot (2002) ConocoPhillips Surmont
Pilot (2006) & Phase 1 Connacher Great Divide
Pod 1 (2007) & Pod 2 (Algar) Devon Jackfish Phase 1 & 2 (2007) MEG Energy Christina Lake
Phase 1 Pilot (2008) & Phase 2A
Suncor Firebag Phases 1 (2004), 2, & 3 and Cogeneration Expansion
Cold Lake Husky Tucker Phase 1 (2006) Shell Orion Phase 1 (2007) Pengrowth Lindberg Pilot (2012)
North Athabasca Nexen Long Lake Phase 1 (2008) Statoil Leismer Demonstration
(2010) BlackPearl Blackrod Pilot (2011)
North AthabascaOperations Suspended Total Joslyn
Phases 1 (2004) & 2
Source: Project Applications and Announcements

The Oil Sands: Canada’s World Scale Hydrocarbon Resource April 25, 2012
8
SAGD Projects under Construction
South Athabasca Cenovus Christina Lake
Phase D (2012)
North Athabasca Southern Pacific STP McKay
Phase 1 (2012) CNRL Kirby South (2013) Grizzly Algar Lake Phase 1
(2013) MEG Energy Christina Lake
Phase 2B (2013) Cenovus Foster Creek Phase F
(2014) Harvest Black Gold Phase 1
(2014)
Suncor Firebag Phase 4 (2013)
Husky Sunrise Phase 1 (2014)
Cold Lake None
(2014) ConocoPhillips Surmont
Phase 2 (2015) Devon Jackfish Phase 3 (2015) Laricina Germain Phase 1
(2015)
Source: Project Applications and Announcements
Surface Mining & Bitumen Extraction
Surface Oil Sands BitumenSurfaceMining
Oil SandsTransport
BitumenExtraction
16
The Oil Sands: Canada’s World Scale Hydrocarbon Resource April 25, 2012
9
Established Athabasca Mining Projects
Operating
Suncor (1967)
Under Construction
CNRL Horizon Suncor (1967) Millennium Mine
Syncrude (1978) North Mine and Aurora North Mine
AOSP Muskeg River
CNRL Horizon Tranche 2 (2012)
Suncor North Steepbank Extension (2012)
Imperial/ExxonMobil AOSP Muskeg River (2002) and Jackpine Phase 1A (2010)
CNRL Horizon Phase 1 (2008)
Imperial/ExxonMobil Kearl Lake Phase 1 (2012) and Phase 2 (2015)
Truck and Shovel Mining
18
Source: Syncrude Canada Ltd.
The Oil Sands: Canada’s World Scale Hydrocarbon Resource April 25, 2012
10
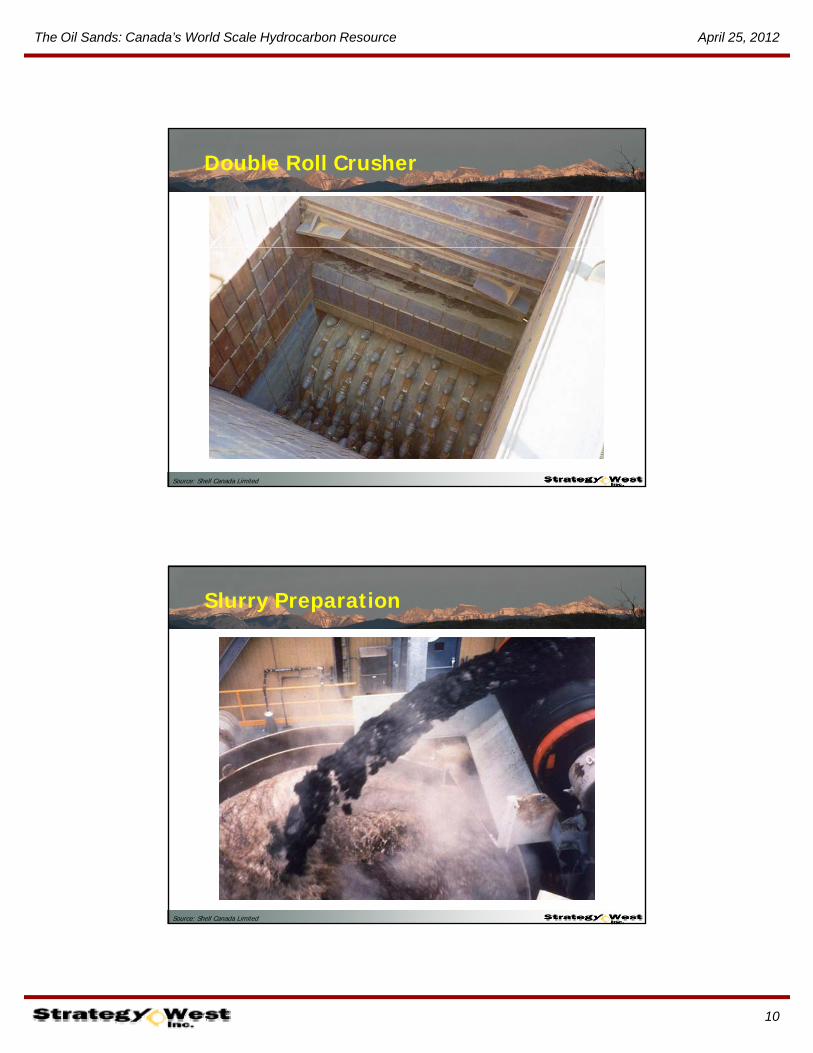
Double Roll Crusher
Source: Shell Canada Limited
Slurry Preparation
Source: Shell Canada Limited
The Oil Sands: Canada’s World Scale Hydrocarbon Resource April 25, 2012
11
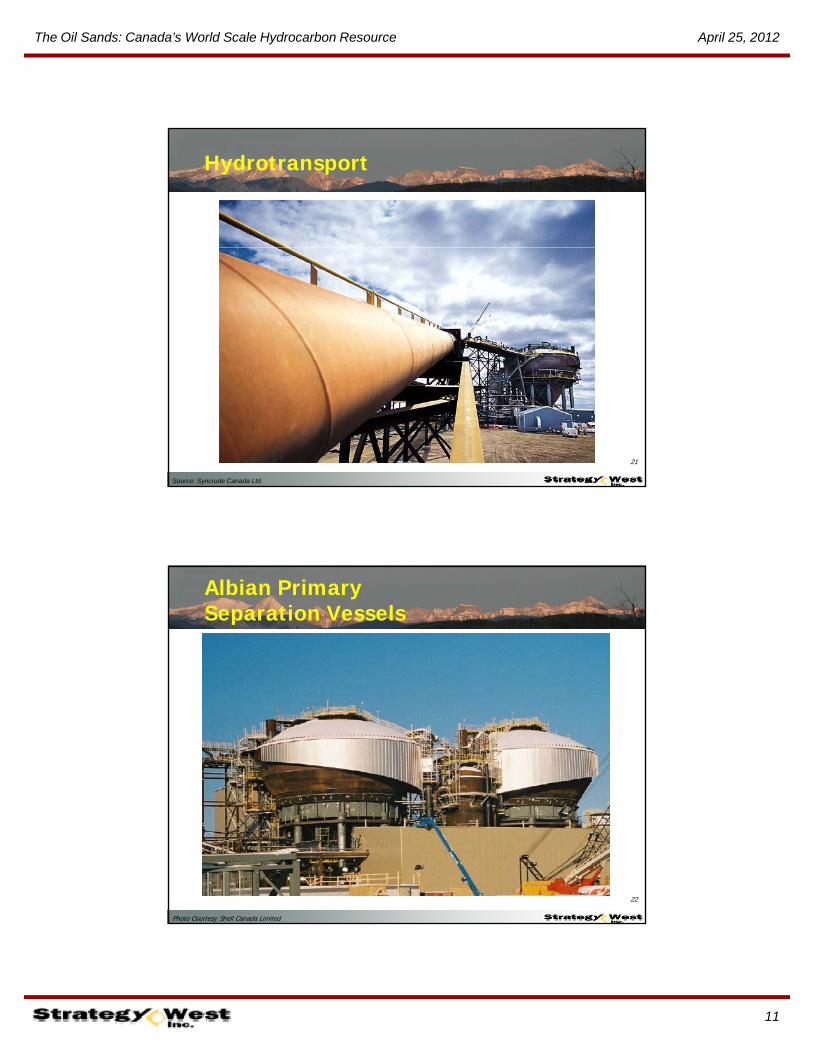
Hydrotransport
21
Source: Syncrude Canada Ltd.
Albian Primary Separation Vessels
22
Photo Courtesy Shell Canada Limited

The Oil Sands: Canada’s World Scale Hydrocarbon Resource April 25, 2012
12
Tailings Disposal
Tailings are an aqueous waste product of the bitumen extraction processT ili t i Tailings contain:• Unrecovered bitumen• Sand, silts and clays• Residual solvents and
chemicals from bitumen extraction
Fluid fine tailings are difficult to consolidate
Alberta’s inventory of fluid Alberta s inventory of fluid fine tailings that require long term containment is now 840 106 m3
Tailings ponds today are approximately 170 km2
Source: Pembina Institute; Alberta Energy Resources Conservation Board
Segregation of Tailings Within a Tailings Pond
In tailings ponds, segregation occurs with the heaviest material, sand, settling to the bottom of the pond. The water will rise to the top of the pond and be recycled back to the extraction process. Within the pond, several y p p ,layers will start to form. Thin fine tailings (TFT) will start to form almost immediately. TFT is a combination of fines and water less than 30% solids. TFT will consolidate and within approximately a three-year period and will start to form mature fine tailings (MFT).
Source: Suncor Energy Inc.
The Oil Sands: Canada’s World Scale Hydrocarbon Resource April 25, 2012
13
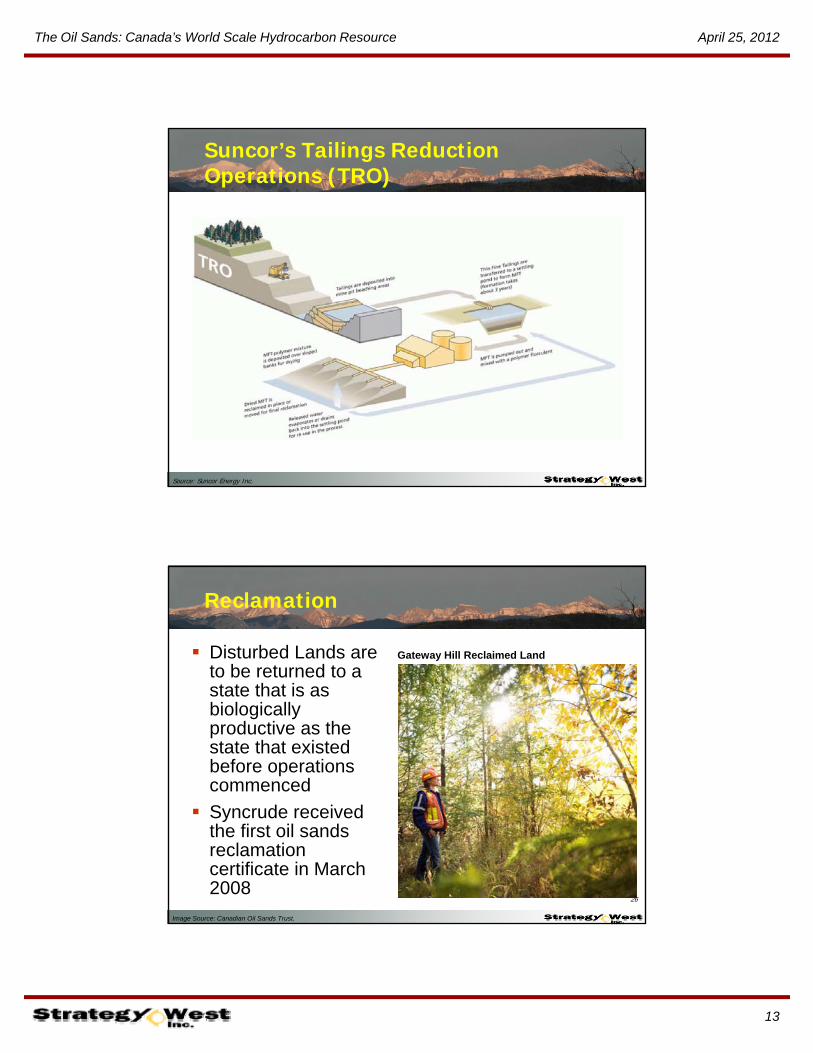
Suncor’s Tailings Reduction Operations (TRO)
Source: Suncor Energy Inc.
Reclamation
Disturbed Lands are to be returned to a t t th t i
Gateway Hill Reclaimed Land
state that is as biologically productive as the state that existed before operations commenced
S
26
Image Source: Canadian Oil Sands Trust.
Syncrude received the first oil sands reclamation certificate in March 2008
The Oil Sands: Canada’s World Scale Hydrocarbon Resource April 25, 2012
14
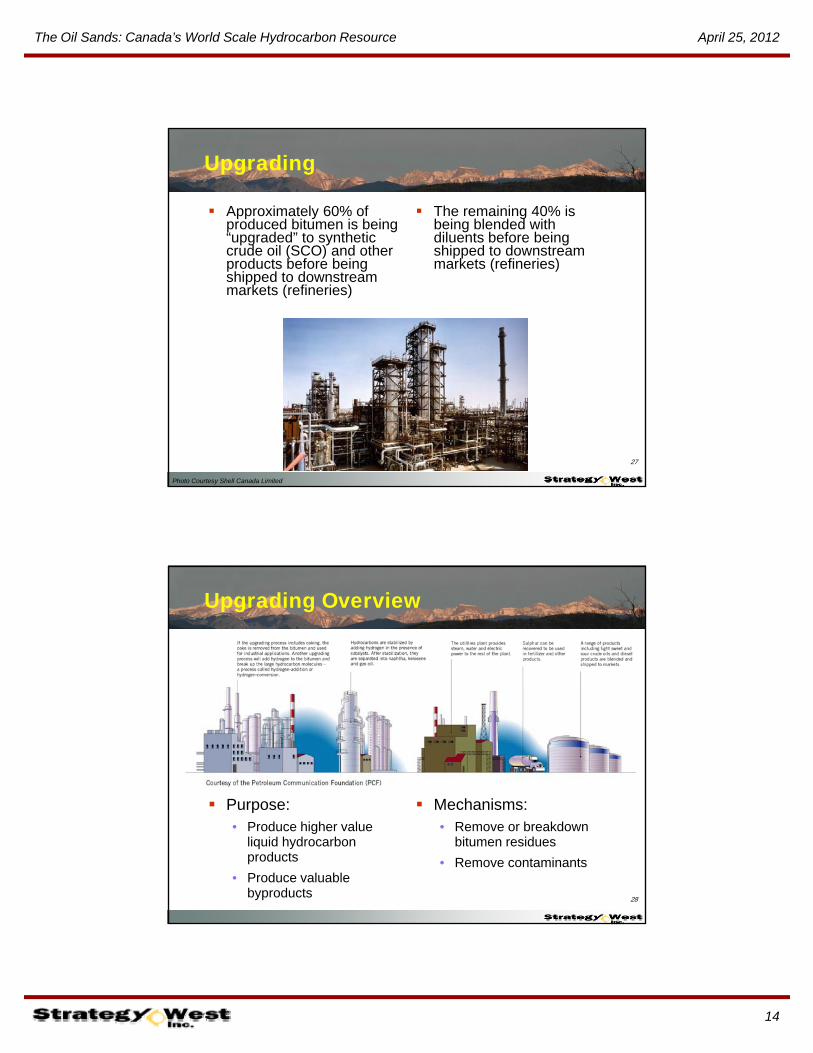
Upgrading
Approximately 60% of produced bitumen is being “upgraded” to synthetic
d il (SCO) d th
The remaining 40% is being blended with diluents before being hi d t d tcrude oil (SCO) and other
products before being shipped to downstream markets (refineries)
shipped to downstream markets (refineries)
Photo Courtesy Shell Canada Limited
27
Upgrading Overview
Purpose: Mechanisms:
28
Purpose:• Produce higher value
liquid hydrocarbon products
• Produce valuable byproducts
Mechanisms:• Remove or breakdown
bitumen residues
• Remove contaminants
The Oil Sands: Canada’s World Scale Hydrocarbon Resource April 25, 2012
15
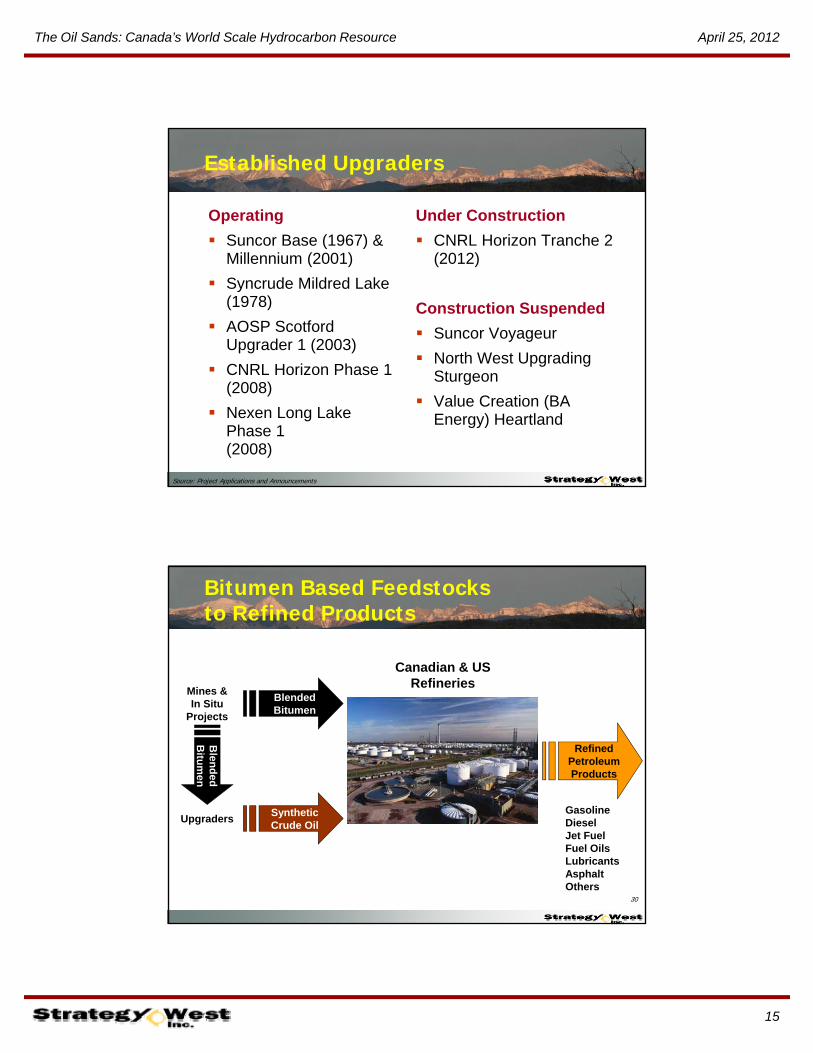
Established Upgraders
Operating
Suncor Base (1967) &
Under Construction
CNRL Horizon Tranche 2 ( )Millennium (2001)
Syncrude Mildred Lake (1978)
AOSP Scotford Upgrader 1 (2003)
CNRL Horizon Phase 1
(2012)
Construction Suspended
Suncor Voyageur
North West Upgrading CNRL Horizon Phase 1
(2008)
Nexen Long Lake Phase 1 (2008)
Sturgeon
Value Creation (BA Energy) Heartland
Source: Project Applications and Announcements
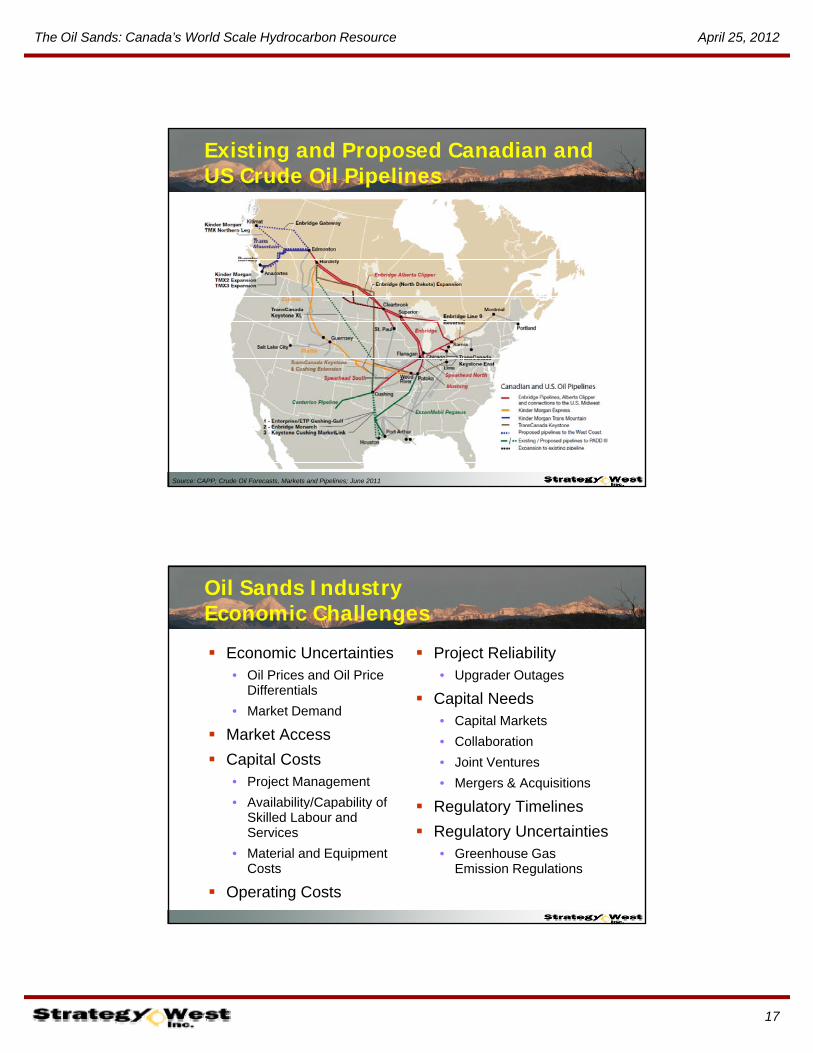
Bitumen Based Feedstocks to Refined Products
Canadian & USRefineries
Refined Petroleum Products
Mines &In Situ
Projects
Blen
ded
B
itum
en
Blended Bitumen
Refineries
30
GasolineDieselJet FuelFuel OilsLubricantsAsphaltOthers
Synthetic Crude Oil
Upgraders

The Oil Sands: Canada’s World Scale Hydrocarbon Resource April 25, 2012
16
Oil Sands Industry Value Chain and Supply Chain Management
Exploration Bitumen Production Upgrading Transportation Refining Distribution
and Marketing
Source: Strategy West Inc.; PMAC
Market Demand for Western Canadian Crude Oil
Source: CAPP; Crude Oil Forecasts, Markets and Pipelines; June 2011
The Oil Sands: Canada’s World Scale Hydrocarbon Resource April 25, 2012
17
Existing and Proposed Canadian and US Crude Oil Pipelines
Source: CAPP; Crude Oil Forecasts, Markets and Pipelines; June 2011
Economic Uncertainties• Oil Prices and Oil Price
ff
Oil Sands Industry Economic Challenges
Project Reliability• Upgrader Outages
Differentials
• Market Demand
Market Access
Capital Costs• Project Management
• Availability/Capability of
Capital Needs• Capital Markets
• Collaboration
• Joint Ventures
• Mergers & Acquisitions
Regulatory TimelinesAvailability/Capability of Skilled Labour and Services
• Material and Equipment Costs
Operating Costs
Regulatory Timelines
Regulatory Uncertainties• Greenhouse Gas
Emission Regulations

The Oil Sands: Canada’s World Scale Hydrocarbon Resource April 25, 2012
18
Oil Sands Industry Societal Challenges
Public Image
Public Services
First Nations
Employee Health Public Services• Health
• Education
• Other
Public Infrastructure
Employee Health and Safety
Regulatory Agencies• Staffing
• Workload• Road
• Water & Sewer
• Rail
• Other
• Workload
• Funding
Air Emissions• Greenhouse Gases
Impacts on Land• Flora and Fauna
Oil Sands Industry Environmental Challenges
Greenhouse Gases
• Criteria Air Contaminants (SOx, NOx, PM, VOCs, CO, NH3)
Solid Wastes
Flora and Fauna
Impacts on Surface Waterways
Water Use• Consumption
R l• Tailings
• Other Solid Wastes
Liquid Wastes
• Recycle
Reclamation and Abandonment
Cumulative Effects

The Oil Sands: Canada’s World Scale Hydrocarbon Resource April 25, 2012
19
Oil Sands GHG Emissions
In 2010, Canada’s oil sands industry emitted 46 Mt of GHGs accounting for:• 30% of Canadian oil and gas sector GHG emissions
• 6.6% of total Canadian GHG emissions
• 0.1% of total global GHG emissions
Source: Environment Canada
GHG Emissions – Wells to Wheels
Source: Alberta Energy Research Institute/Jacobs Consultancy; June 2009
The Oil Sands: Canada’s World Scale Hydrocarbon Resource April 25, 2012
20
Oil Sands Industry Outlooks
The ERCB and CAPP release comprehensive oil sands industry outlooks in June of each year • They may be downloaded at www.strategywest.com
Other organizations (NEB, IHS CERA, CERI, IEA, EIA) release industry outlooks periodically
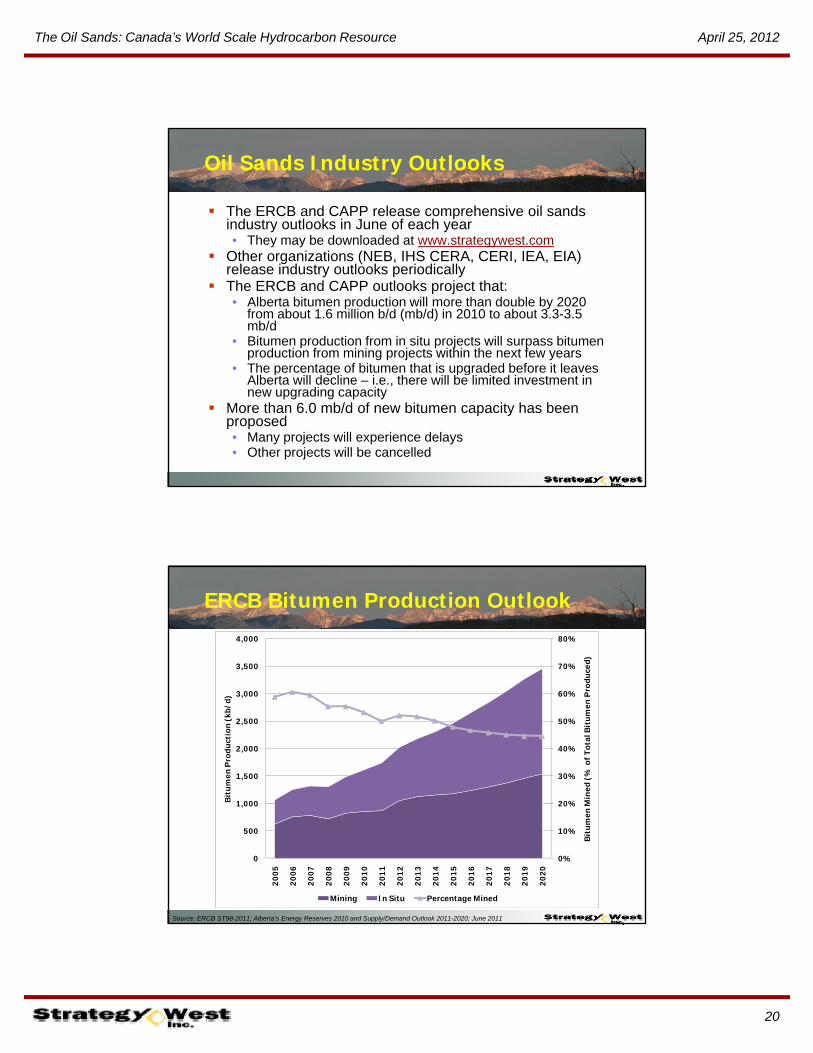
The ERCB and CAPP outlooks project that:• Alberta bitumen production will more than double by 2020
from about 1.6 million b/d (mb/d) in 2010 to about 3.3-3.5 mb/d
• Bitumen production from in situ projects will surpass bitumen production from mining projects within the next few years
• The percentage of bitumen that is upgraded before it leaves• The percentage of bitumen that is upgraded before it leaves Alberta will decline – i.e., there will be limited investment in new upgrading capacity
More than 6.0 mb/d of new bitumen capacity has been proposed• Many projects will experience delays• Other projects will be cancelled
ERCB Bitumen Production Outlook
70%
80%
3,500
4,000
oduc
ed)
20%
30%
40%
50%
60%
1 000
1,500
2,000
2,500
3,000
Min
ed (
% o
f Tot
al B
itum
en P
ro
Bit
umen
Pro
duct
ion
(kb/
d)
0%
10%
20%
0
500
1,000
2005
2006
2007
2008
2009
2010
2011
2012
2013
2014
2015
2016
2017
2018
2019
2020
Bit
umen
M
Mining In Situ Percentage Mined
Source: ERCB ST98-2011; Alberta’s Energy Reserves 2010 and Supply/Demand Outlook 2011-2020; June 2011
The Oil Sands: Canada’s World Scale Hydrocarbon Resource April 25, 2012
21
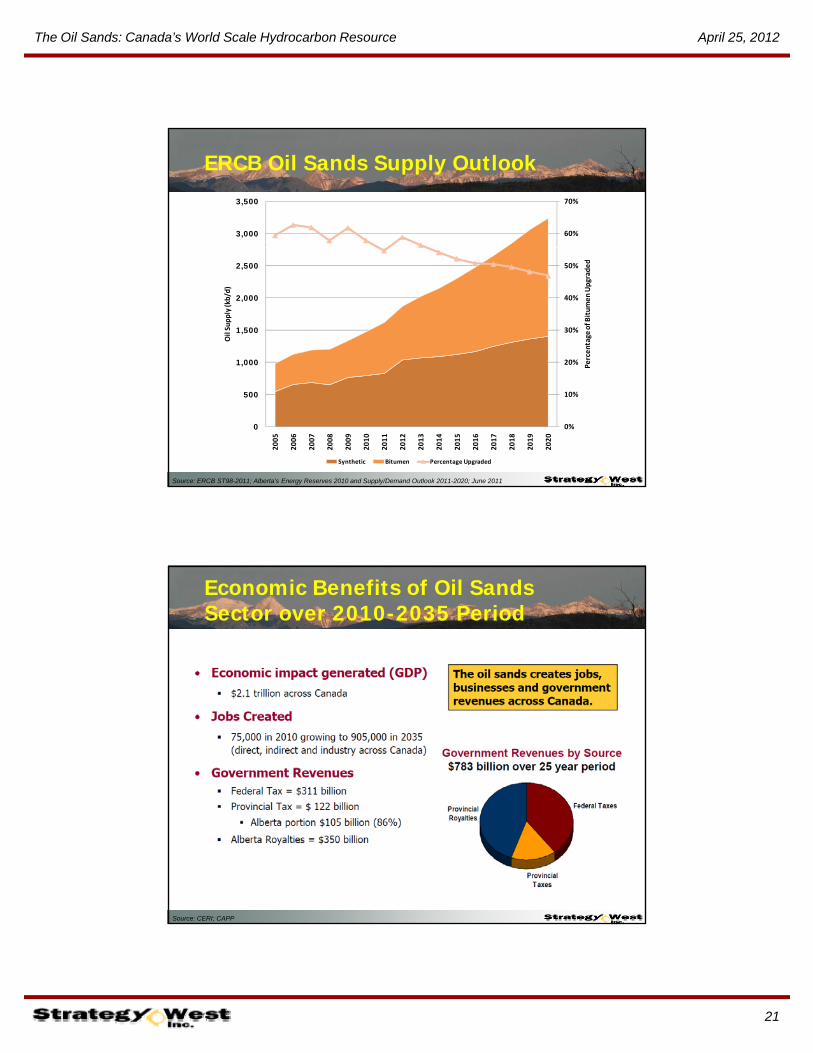
ERCB Oil Sands Supply Outlook
60%
70%
3,000
3,500
20%
30%
40%
50%
1,000
1,500
2,000
2,500
Percentage of B
itumen Upgraded
Oil Supply (kb/d)
0%
10%
0
500
2005
2006
2007
2008
2009
2010
2011
2012
2013
2014
2015
2016
2017
2018
2019
2020
P
Synthetic Bitumen Percentage Upgraded
Source: ERCB ST98-2011; Alberta’s Energy Reserves 2010 and Supply/Demand Outlook 2011-2020; June 2011
Economic Benefits of Oil Sands Sector over 2010-2035 Period
Source: CERI; CAPP
The Oil Sands: Canada’s World Scale Hydrocarbon Resource April 25, 2012
22
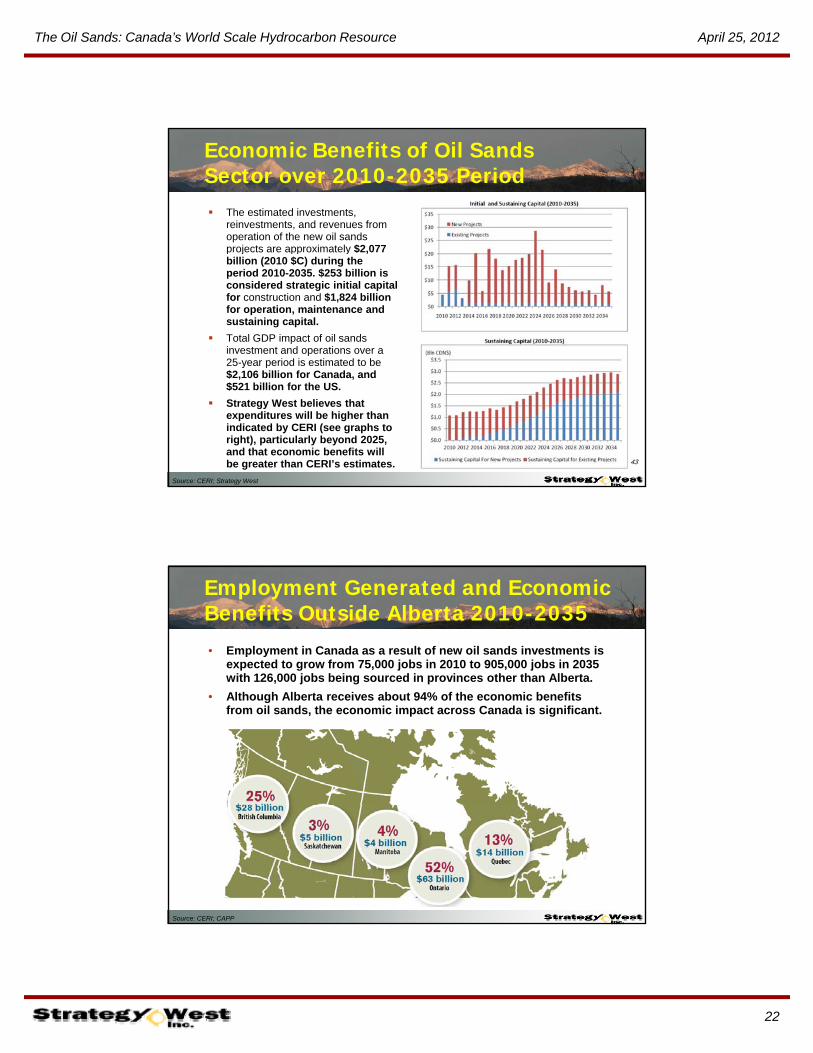
Economic Benefits of Oil Sands Sector over 2010-2035 Period The estimated investments,
reinvestments, and revenues from operation of the new oil sands projects are approximately $2 077projects are approximately $2,077 billion (2010 $C) during the period 2010-2035. $253 billion is considered strategic initial capital for construction and $1,824 billion for operation, maintenance and sustaining capital.
Total GDP impact of oil sands investment and operations over a 25‐year period is estimated to be y p$2,106 billion for Canada, and $521 billion for the US.
Strategy West believes that expenditures will be higher than indicated by CERI (see graphs to right), particularly beyond 2025, and that economic benefits will be greater than CERI’s estimates. 43
Source: CERI; Strategy West
Employment Generated and Economic Benefits Outside Alberta 2010-2035 • Employment in Canada as a result of new oil sands investments is
expected to grow from 75,000 jobs in 2010 to 905,000 jobs in 2035 with 126,000 jobs being sourced in provinces other than Alberta.
• Although Alberta receives about 94% of the economic benefits from oil sands, the economic impact across Canada is significant.
Source: CERI; CAPP
The Oil Sands: Canada’s World Scale Hydrocarbon Resource April 25, 2012
23
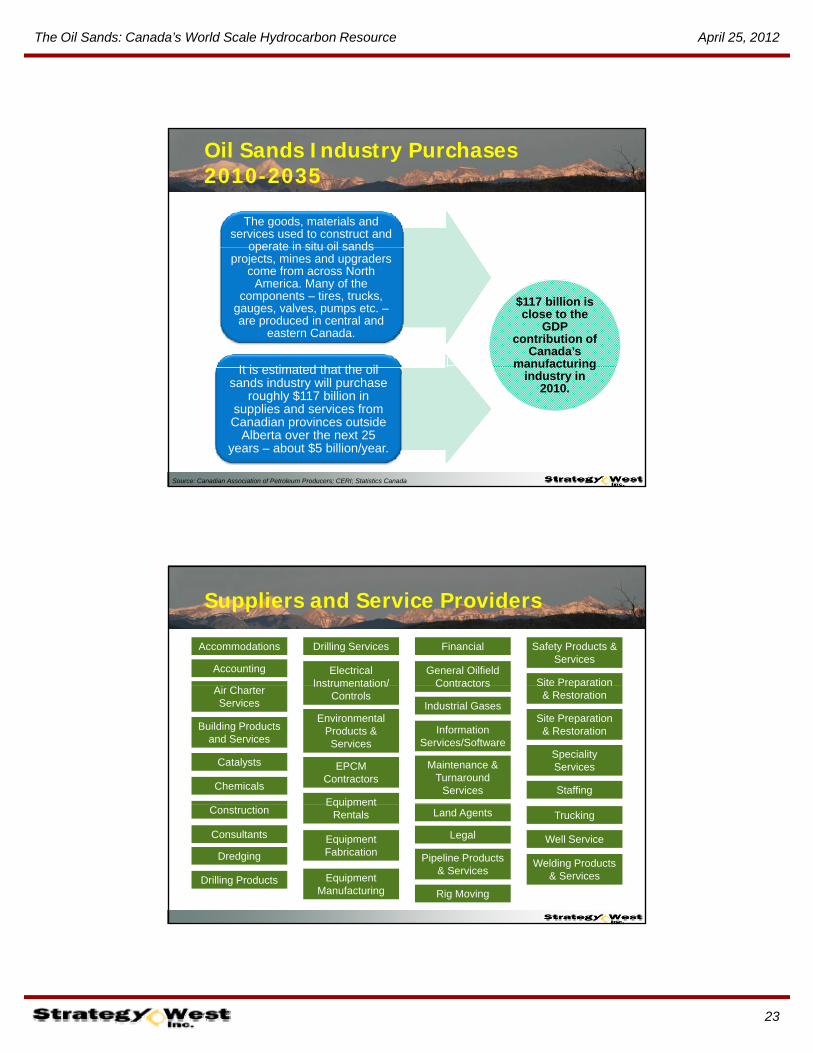
Oil Sands Industry Purchases 2010-2035
The goods, materials and services used to construct and
operate in situ oil sandsoperate in situ oil sands projects, mines and upgraders
come from across North America. Many of the
components – tires, trucks, gauges, valves, pumps etc. –are produced in central and
eastern Canada.
It is estimated that the oil
$117 billion is close to the
GDP contribution of
Canada’s manufacturing
Source: Canadian Association of Petroleum Producers; CERI; Statistics Canada
It is estimated that the oil sands industry will purchase
roughly $117 billion in supplies and services from Canadian provinces outside
Alberta over the next 25 years – about $5 billion/year.
manufacturing industry in
2010.
Suppliers and Service Providers
Accommodations
General Oilfield Contractors
Drilling Services
Electrical Instrumentation/
Financial Safety Products & Services
Accounting Site Preparation
Air Charter Services
Building Products and Services
Contractors Instrumentation/ Controls
Environmental Products & Services
Site Preparation & Restoration
Speciality Services
Equipment
Information Services/Software
Chemicals
Catalysts
Industrial Gases
EPCM Contractors
Site Preparation & Restoration
Maintenance & Turnaround
Services Staffing
Construction
Consultants
Drilling Products
Equipment Fabrication
Land Agents
Legal
Equipment Manufacturing
Welding Products & Services
Pipeline Products & Services
Rig Moving
Equipment Rentals Trucking
Well Service
Dredging

The Oil Sands: Canada’s World Scale Hydrocarbon Resource April 25, 2012
24
Maximizing Free Cash Flow/Value Creation
RevenueProducts Produced• Products Produced
• Prices Realized• Production Rates• Reliability/On-stream Factor
Expenditures• Capital• Operating• Working Capital/Timing• Royalties and Taxes• Abandonment and Reclamation
Value Creation Levers
Outside our Control Within our Control
Revenue Product Prices
Products Produced
Production Rates
Reliability
C it l
Expenditures
Royalty and Tax Regulations
Abandonment & Reclamation
Requirements
Capital Expenditures
Operating Expenditures
Working Capital/Timing
The Oil Sands: Canada’s World Scale Hydrocarbon Resource April 25, 2012
25
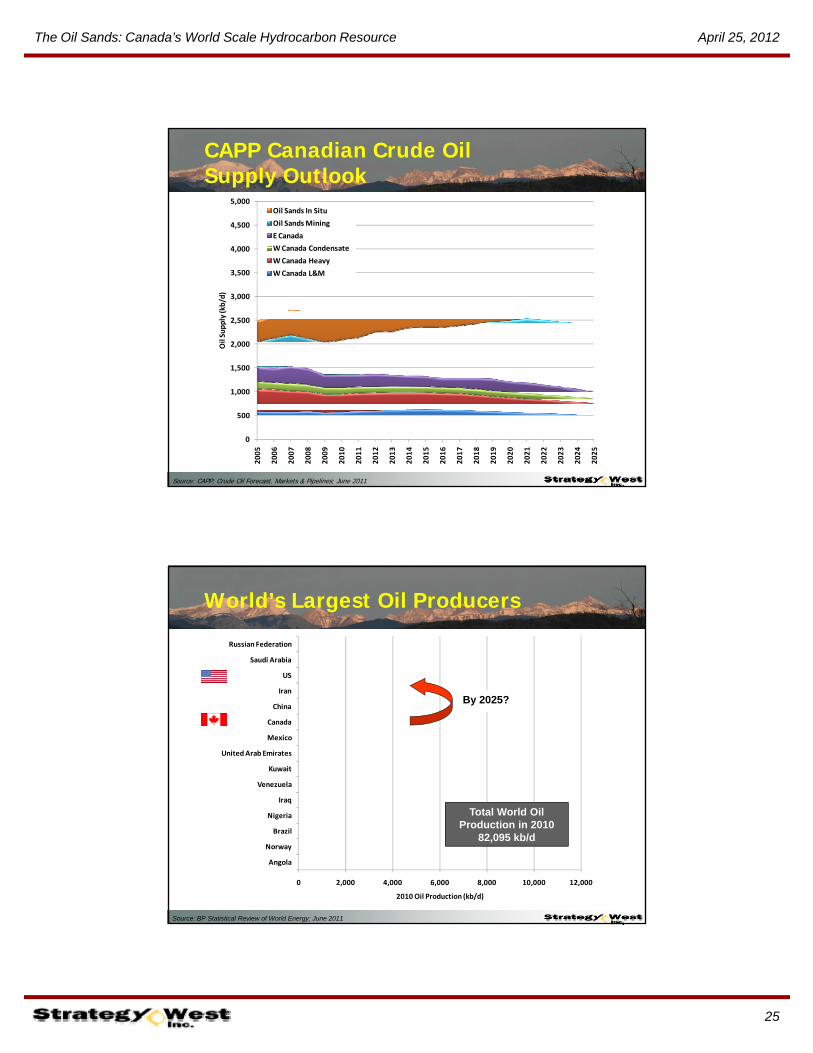
CAPP Canadian Crude Oil Supply Outlook
4 000
4,500
5,000Oil Sands In Situ
Oil Sands Mining
E Canada
WCanada Condensate
1 500
2,000
2,500
3,000
3,500
4,000
Oil Supply (kb/d)
W Canada Condensate
W Canada Heavy
W Canada L&M
Source: CAPP; Crude Oil Forecast, Markets & Pipelines; June 2011
0
500
1,000
1,500
2005
2006
2007
2008
2009
2010
2011
2012
2013
2014
2015
2016
2017
2018
2019
2020
2021
2022
2023
2024
2025
US
Saudi Arabia
Russian Federation
World’s Largest Oil Producers
Iraq
Venezuela
Kuwait
United Arab Emirates
Mexico
Canada
China
IranBy 2025?
0 2,000 4,000 6,000 8,000 10,000 12,000
Angola
Norway
Brazil
Nigeria
2010 Oil Production (kb/d)
Source: BP Statistical Review of World Energy; June 2011
Total World Oil Production in 2010
82,095 kb/d

The Oil Sands: Canada’s World Scale Hydrocarbon Resource April 25, 2012
26
Conclusions
Canada’s oil sands deposits are among the world’s largest hydrocarbon accumulations.
The oil sands industry is well established and The oil sands industry is well established and making a significant contribution to global oil supply.
The 2008/2009 financial crisis caused project deferrals and cancellations.
Industry growth has resumed; the growth rate will depend on oil prices and how industry and
dd h h ll hp p y
government address the many challenges the industry faces.
The industry is expected to add more than $2 trillion of economic benefits to the Canadian economy over the 2010-2035 period.
Thank You
Please visit t t t f il
Questions?
52
www.strategywest.com for oil sands project lists and other detailed oil sands industry
information