The NSE- the case for a buy-and-hold strategy for equity investors
18
- 1 - ゥ 2010 PK Mwangi Global Consulting Introduction This study aimed to establish, using data over three different annualised time periods between 2007 and 2009, whether an actively managed portfolio (following either a value strategy or a momentum strategy) would outperform a passive buy-and-hold strategy based on a benchmark index (the NSE-20) on the Nairobi Stock Exchange (NSE). A list of stocks from both the Nairobi Stock Exchange MIMS (large caps and mid-caps) and the AIMS (small caps) that had either outperformed or underperformed the benchmark index (the NSE-20) in all three periods was drawn up. The results revealed that stocks that either outperformed or underperformed the NSE-20 were diverse across size, sector and investment style. The research also went on to derive fundamental data- PE ratios as well as book-to-market values - BV/MV ratios 1 for the list of stocks that had either underperformed or outperformed the benchmark index for all three periods. These revealed that a value strategy that would have picked stocks on the basis of high BV/MV ratios and low PE ratios would have been unable to outperform the benchmark index. These findings were in line with anecdotal evidence on value investing where superior returns of value stocks are normalised when adjusted for risk. The case is even stronger when agency costs of delegated investment management are considered. (Chan and Lakonishok, 2004). 1 The BM/MV ratio helps establish whether a particular stock is under- or overvalued.
-
Upload
patrick-kiragu-mwangi-ba-bsc-ma-acsi -
Category
Investor Relations
-
view
47 -
download
2
Transcript of The NSE- the case for a buy-and-hold strategy for equity investors

- 1 - © 2010 PK Mwangi Global Consulting
IntroductionThis study aimed to establish, using data over three different annualised time periods between 2007 and
2009, whether an actively managed portfolio (following either a value strategy or a momentum strategy)
would outperform a passive buy-and-hold strategy based on a benchmark index (the NSE-20) on the
Nairobi Stock Exchange (NSE).
A list of stocks from both the Nairobi Stock Exchange MIMS (large caps and mid-caps) and the AIMS
(small caps) that had either outperformed or underperformed the benchmark index (the NSE-20) in all
three periods was drawn up. The results revealed that stocks that either outperformed or underperformed
the NSE-20 were diverse across size, sector and investment style.
The research also went on to derive fundamental data- PE ratios as well as book-to-market values -
BV/MV ratios1 for the list of stocks that had either underperformed or outperformed the benchmark index
for all three periods. These revealed that a value strategy that would have picked stocks on the basis of
high BV/MV ratios and low PE ratios would have been unable to outperform the benchmark index. These
findings were in line with anecdotal evidence on value investing where superior returns of value stocks
are normalised when adjusted for risk. The case is even stronger when agency costs of delegated
investment management are considered. (Chan and Lakonishok, 2004).
1 The BM/MV ratio helps establish whether a particular stock is under- or overvalued.

- 2 - © 2010 PK Mwangi Global Consulting
Additionally, on the basis of the evidence gathered, a momentum strategy2 involving picking stocks on
the basis of high PE ratios would also have been unable to outperform the benchmark index during the
periods under consideration.
To outperform the benchmark index, the fund manager or private investor would have had to select stocks
across sector and size (involving time and research and hence considerable cost) as well as constantly
vary his investment style in order to pick winners.
Data presentationTable 1: Stock performance over three different annualised periods
Sectorreclassification
% change(21/10/07 -20/10/08)
% change(1/2/08 -31/1/09)
% change(11/6/09 -10/6/10)
STOCKMIMS Agriculture
Kakuzi Ltd. Agriculture -15 -21 194Commercial and
ServicesCar & General Ltd. Automobile -10 -20 48Nation Media
Group Ltd. *Media -55 -52
9TPS (Serena) Ltd. Leisure &
Hotels-25 -18
65Finance and
InvestmentCFC Stanbic Bank
Ltd.Banks -43 -53
16Housing Finance
Ltd.Financials -39 -59
29Standard Chartered
Bank Ltd. *-12 -20
59Equity Bank Ltd. * Banks 54 19 66Olympia Capital
Holdings LtdFinancials -39 -33
-4Industrial and
AlliedAthi River Mining
Ltd. *Building &
Construction10 -7
56Bamburi Cement
Ltd. *Building &
Construction-4 -21
67E.A. Cables Ltd. * Industrials -32 -41 -8Crown Berger (K)
Ltd.Industrials -38 -46
21
2 The argument here is that well-performing stocks will continue to perform well into the future since they represent firms withpositive long-term forecasts of sales, strong resultant cash flows and non-financial information. Thus analysts continue torecommend such firms exhibiting strong recent performance. In addition, in inefficient frontier markets like the NSE short-runpositive serial correlations tend to induce the spiral of price movements in a particular direction. (Morrin et al., 2002)

- 3 - © 2010 PK Mwangi Global Consulting
KenGen Ltd. * Utilities -37 -44 21
STOCKAIMSExpress Ltd.** Transport -39 -49 -4Kapchorua Tea Co.Ltd.**
Agriculture -17 -24112
INDEXNSE All-share index -22 -23 40NSE-20 index -27 -32 44
Source: Bloomberg, 2010; myStocks!, 2010; NSE, 2010
*Large cap stocks and constituents of the NSE-20 index
** Small cap stocks
Figures in bold italic represent the performances of stocks that outperformed the NSE-20 index in the
respective periods.
In all three periods the following stocks outperformed the benchmark index- the NSE-20 index
Athi River Mining Ltd.* (Building & Construction)
Bamburi Cement Ltd.* (Building & Construction)
Car & General Ltd. (Automobiles)
Equity Bank Ltd.* (Banks)
Kakuzi Ltd.(Agriculture)
Kapchorua Tea Co. Ltd.** (Agriculture)
Standard Chartered Bank Ltd.* (Banks)
TPS (Serena) Ltd. (Leisure & Hotels)
In all three periods the following stocks underperformed the benchmark index- the NSE-20 index.
CFC Stanbic Bank Ltd. (Banks)
Crown Berger (K) Ltd. (Industrials)
E.A Cables Ltd.* (Industrials)
Express Kenya Ltd.** (Transport)
Housing Finance Ltd. (Financials)
KenGen Ltd.* (Utilities)
Nation Media Group Ltd.* (Media)
Olympia Capital Holdings Ltd. (Financials)
* Large cap companies
** Small cap companies
- 4 - © 2010 PK Mwangi Global Consulting
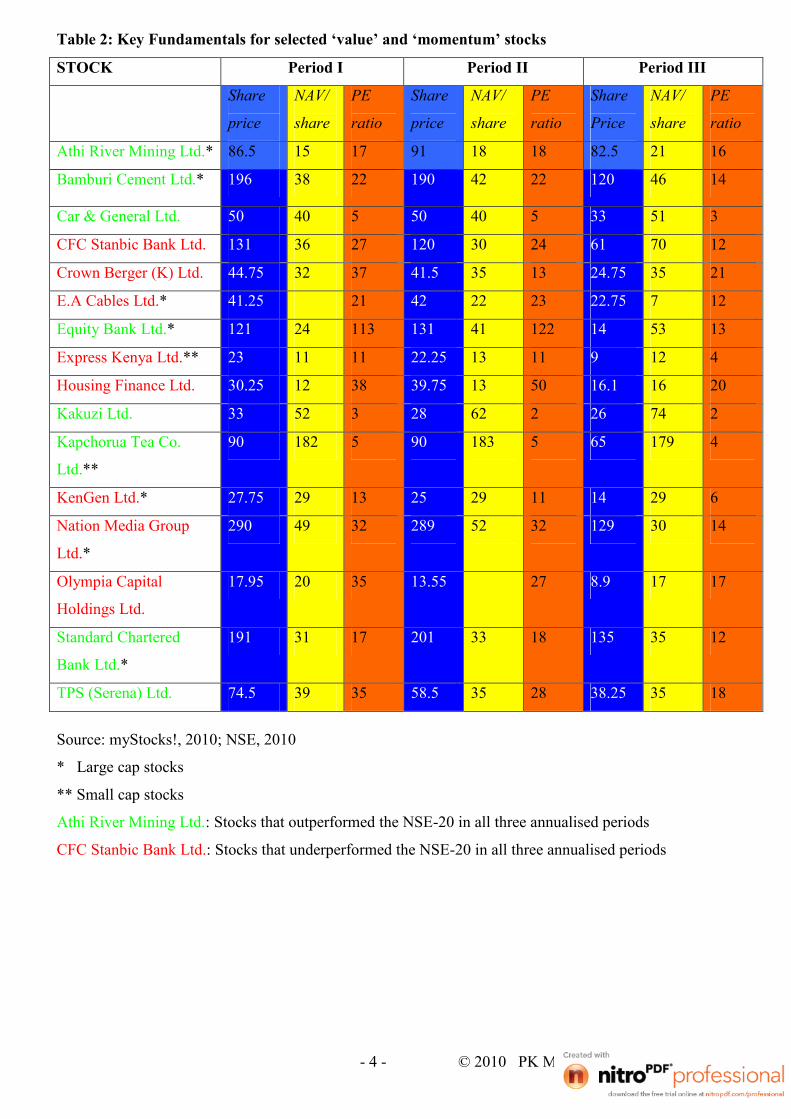
Table 2: Key Fundamentals for selected ‘value’ and ‘momentum’ stocks
STOCK Period I Period II Period III
Share
price
NAV/
share
PE
ratio
Share
price
NAV/
share
PE
ratio
Share
Price
NAV/
share
PE
ratio
Athi River Mining Ltd.* 86.5 15 17 91 18 18 82.5 21 16
Bamburi Cement Ltd.* 196 38 22 190 42 22 120 46 14
Car & General Ltd. 50 40 5 50 40 5 33 51 3
CFC Stanbic Bank Ltd. 131 36 27 120 30 24 61 70 12
Crown Berger (K) Ltd. 44.75 32 37 41.5 35 13 24.75 35 21
E.A Cables Ltd.* 41.25 21 42 22 23 22.75 7 12
Equity Bank Ltd.* 121 24 113 131 41 122 14 53 13
Express Kenya Ltd.** 23 11 11 22.25 13 11 9 12 4
Housing Finance Ltd. 30.25 12 38 39.75 13 50 16.1 16 20
Kakuzi Ltd. 33 52 3 28 62 2 26 74 2
Kapchorua Tea Co.
Ltd.**
90 182 5 90 183 5 65 179 4
KenGen Ltd.* 27.75 29 13 25 29 11 14 29 6
Nation Media Group
Ltd.*
290 49 32 289 52 32 129 30 14
Olympia Capital
Holdings Ltd.
17.95 20 35 13.55 27 8.9 17 17
Standard Chartered
Bank Ltd.*
191 31 17 201 33 18 135 35 12
TPS (Serena) Ltd. 74.5 39 35 58.5 35 28 38.25 35 18
Source: myStocks!, 2010; NSE, 2010
* Large cap stocks
** Small cap stocks
Athi River Mining Ltd.: Stocks that outperformed the NSE-20 in all three annualised periods
CFC Stanbic Bank Ltd.: Stocks that underperformed the NSE-20 in all three annualised periods

- 5 - © 2010 PK Mwangi Global Consulting
Table 3: Performance of selected ‘value’ stocks*
STOCK Period I
(BV/MV)
Performance Period II
(BV/MV)
Performance Period III
(BM/MV)
Performance
Car &
General Ltd. 1.5 48%
CFC Stanbic
Bank 1.1 16%
Crown Berger
(K) Ltd. 1.4 21%
Equity Bank
Ltd. 3.8 66%
Express
Kenya Ltd. 1.3 -4%
Housing
Finance 1 29%
Kakuzi Ltd.
1.6 -15% 2.2 -21% 2.8 194%
Kapchorua
Tea Co. Ltd. 2.0 -17% 2.0 -24% 2.8 112%
KenGen
1.1 -37% 1.2 -44% 2.1 21%
Olympia
Capital
Holdings Lt.
1.1 -39% 1.9 -4%
INDEX
NSE All-
share index
-22% -23% 40%
NSE-20 index -27% -32% 44%
Source: Bloomberg, 2010; myStocks!, 2010; The Financial Times Ltd., 2010
* Only book-to-market values equal to or above 1 are shown.
Figures in bold represent the performances of value stocks that outperformed the NSE-20 in the
respective periods.
Although CFC Stanbic Bank Ltd., Crown Berger (K) Ltd., Express Kenya Ltd., Housing Finance Ltd.,
KenGen and Olympia Capital Holdings Ltd. showed positive BV/MV ratios in at least one period they all

- 6 - © 2010 PK Mwangi Global Consulting
underperformed the NSE-20 index in all three periods. A value strategy in these periods would have been
unable to outperform the benchmark index. Only Kakuzi Ltd. and Kapchorua Tea Company Ltd. showed
positive BV/MV for the three periods and were able to outperform the NSE-20 in all of them. Both these
firms are in the Agriculture sector.
Rea Vipingo Ltd. and Sasini Tea & Coffee Ltd. (both large caps) are also in the Agriculture sector but
both underperformed the NSE-20 index in at least two of the three periods. Both firms trade in tea as
Kakuzi Ltd. and Kapchorua Tea. This supports the posit that a successful trading strategy would have had
to select stocks across size as well as discriminate between strong and weak companies within sector.
Table 4: Performance of selected ‘momentum’ stocks*
STOCK Period I
(PE ratio)
Performance Period II
(PE ratio)
Performance Period III
(PE ratio)
Performance
Crown Berger
Kenya Ltd. 37 -38%
Equity Bank
Ltd. 113 54% 122 19%
Housing
Finance Ltd. 38 -39% 50 -59%
Nation Media
Group Ltd. 32 -55% 32 -52%
Olympia
Capital
Holdings Ltd.
35 -39%
TPS (Serena)
Ltd. 35 -25%
INDEX
NSE All-
share index
-22% -23% 40%
NSE-20 index -27% -32% 44%
Source: Bloomberg, 2010; myStocks!, 2010
*Only PE ratios above 30 are shown
Figures in bold represent the performances of stocks that outperformed the NSE-20 in the respective
periods.

- 7 - © 2010 PK Mwangi Global Consulting
Of the stocks that outperformed the benchmark index in all three periods, only Bamburi Cement Ltd.,
Equity Bank Ltd. and TPS (Serena) Ltd. showed PE ratios of above 20 but only in two of the three
periods (see Table 2). Despite showing very high PE ratios in periods I and II3, Housing Finance Ltd. and
Nation Media Group Ltd. underperformed the NSE-20 index in all three periods.
Crown Berger Kenya Ltd. and Olympia Capital Holdings Ltd. also showed high PE ratios in period I but
underperformed the benchmark index in all three periods. Despite low PE ratios averaging 4, 2 and 5
respectively in the three periods, Car & General Ltd., Kakuzi Ltd. and Kapchorua Tea Company Ltd.
outperformed the benchmark index in all three periods (see Table 1). Thus a momentum strategy
involving picking ‘glamour’ stocks with high PE ratios would have been unable to outperform the NSE-
20 index in the three periods covered.
From the observed data, a strategy to outperform a buy-and-hold strategy (based on the NSE-20 index)
would have had to select stocks across sector and size4. Also such a strategy would have had to, ex-ante,
discriminate between eventual strong and weak companies. In picking strong companies a strategy to
outperform the benchmark index would have had to discriminate between companies within sector
especially in the Banks, Financials and Agriculture sectors where some outperformed the benchmark
index while others under-performed it5. And even among the strong companies6 not all were able to
outperform the benchmark index.
Analysis and InterpretationRisk-return premia
Value investors seek to benefit by purchasing undervalued stocks and selling these once the prices move
towards their intrinsic values. Momentum investors, for their part, expect recent stock price trends to
continue and favour growth stocks- those which exhibit continued price increases whether or not the
increases are justified by firm fundamentals.
The inability of the value investor to outperform the benchmark index stems from the fact that value
stocks when adjusted for risk reveal at best average returns. Beta values for small caps like Kapchorua
Tea may be exceedingly high meaning that their real return measured by the Treynor ratio (see below) is
low or average.
3 The PE ratio for Housing Finance Ltd. was as high as 50 in period II4 Kakuzi Ltd. - a large cap stock and Kapchorua Tea Ltd. - a small cap both outperformed the NSE-20 index in all threeperiods. From Table 1 stocks that outperformed the NSE-20 index in all three periods were diversified across sector.5 While Equity Bank Ltd. and Standard Chartered Bank Ltd. outperformed the NSE-20 index in all three periods, CFC StanbicBank Ltd., Housing Finance Ltd. and Olympia Capital Holdings Ltd. underperformed the same index in all three periods.6 Despite improving year-on-year top-line and bottom-line figures during the three periods and having significant marketshares, KenGen and Nation Media Group Ltd. underperformed the NSE-20 index in all three periods.
- 8 - © 2010 PK Mwangi Global Consulting
Thus to get a true picture of the real return of stocks included in a value-seeking actively managed
portfolio, the risk associated with the individual stock must be taken into account especially with regard
to the small cap stocks which carry considerable risk. An additional risk premia for these particular stocks
would have to be added.
However, on occasion, the actions of investors who collectively respond to price movements in a similar
manner (or adopt a similar investment style) may still lead to pricing bubbles or excessive underpricing,
pricing anomalies that may lead to abnormal returns for the value investor, even after adjusting for risk.
(Morrin et al.; 2002)
Mean reversion
The ability of momentum stocks to outperform the benchmark index is confined by negative serial
correlation of returns for holding periods of between three and five years. Mean reversion has the ability
to return stock values to their mean or intrinsic values over time thereby halting correlative price
movements in a particular direction7. Thus past winners become future losers and past losers become
future winners.
Furthermore, active investors make their purchases or sales well into a rally or decline thereby missing
the opportunity to maximise their return by buying cheap before the market peaks8 or minimising total
loss by selling the stock or making portfolio reallocations before the market troughs. (Chan et al., 1996)
When bubbles develop they correct overtime thereby limiting the gains of a momentum investor.
However, bubbles usually overcorrect so that the market is selling well below fair value thereby
presenting value investors with a buying opportunity. However, mean reversion and the actions of
arbitrageurs halt excessive movements to the downside thereby limiting the benefits to the value investor.
Equity portfolio diversification
Diversification has the potential to reduce volatility without sacrificing risk-adjusted returns. Thus where
increased returns can only be achieved by increasing the level of risk undertaken, a diversified portfolio
(as exemplified in a wide-ranging benchmark index like the NSE-20) provides increased or at least
similar returns without increasing the level of risk undertaken. However these allocations across different
equities should be selective taking into consideration strong fundamentals and technical analysis.
7 Such moments are akin to a market peak or market trough8 In an over-rated market correct timing can prove very rewarding if after investing in ‘multiples’ stocks the investor pulls outof the market before the prices head south
- 9 - © 2010 PK Mwangi Global Consulting
Critically, portfolio diversification should not be seen solely from the view-point of numbers (number of
stocks held or percentage of holdings in the top 10) but rather from the view-point of combining assets
that have very little correlation with one another9. In that way, when one area is suffering e.g. Banks or
Industrials another might hold up a little better e.g. Building & Construction10. However, cyclical stocks
may be seen to all suffer at the same time and hence a fund that owns many non-correlated stocks might
still be volatile where it makes big sector, style or market-cap bets.
Herd mentality
Following a spate of good or bad news investor irrationality leads to an overreaction either to the upside
or downside respectively. This is accentuated by a herd-like mentality which influences stock valuations
beyond their fundamental or intrinsic values thereby creating an ideal buying or selling opportunity. Both
value and momentum investors see this as a window of opportunity to trade and outperform the
benchmark index.
However, for both value and momentum investors, the question is that of timing. When is it time to buy
oversold stocks or sell overrated stocks? For value investors, the question is what valuations represent the
best buying opportunity11. In the case of momentum investors the pitfall of chasing ‘hot’ stocks is that
these may have reached peak values making it difficult for performance-chasing investors to gain much if
at all. Poor timing can thus have unintended consequences.
Behavioural risk
Apart from the transaction costs of an actively managed portfolio, there is also behavioural risk which
may lead to badly timed decisions. Market corrections, in particular, are unpredictable in timing, duration
and even magnitude and hence any attempt to benefit from such corrections requires precise timing and a
bit of luck. Returns of an actively managed portfolio must reflect this behavioural (timing) risk.
Momentum investors may enter into investments that showed good returns but any subsequent volatility
may lead to disastrous results. Thus active portfolio management may prove high-risk due to the tendency
to time purchase or sale points wrongly. Additionally, momentum investors’ greater confidence levels
(based on their reliance on past performance) may make them more susceptible to ‘knowledge
miscalibration’- the mismatch between decision confidence and decision accuracy. (Morrin et al., 2002)
9 It is quite apparent from looking at the NSE-20 index that this is a wide-encompassing index involving a cross-section ofstocks across different sectors.10 In the three periods studied while Banks and Industrials showed mixed and poor returns respectively, returns by Building &Construction were pretty impressive (see Table 1).11 Buying stocks before the market has bottomed may reduce potential gains.
- 10 - © 2010 PK Mwangi Global Consulting
Selling only when there are big deviations in the portfolio mix versus targets12or selling part of the
investment (rather than the entire stock(s) at once) may mitigate the risk of poor timing. The secret lies in
avoiding the instinct of thinking there is this only one critical event or opportunity since this may cause
one to make a bad decision. Alternatively a buy-and-hold strategy may be sought to minimise this
behavioural or timing risk.
Lack of timely information and analyst attention
Large blue-chip companies receive a lot of investor and analyst scrutiny making it near impossible for
price anomalies to develop. This is especially so in rapid information dissemination/assimilation
environments13.
Conversely and especially in frontier markets like the NSE, small-cap firms rarely produce timely
reports14 of their accounts and receive few analyst forecasts or recommendations. As a result the
identification of value here is only achieved at great cost involving research and investigative work. This
makes the process of identifying value small caps to outperform the benchmark index a difficult
proposition.15.
Volatility of small caps, however, may still offer great opportunities for those willing to take the time to
carefully study both the technical and fundamental aspects of stock and market movements. Technical
analysis, in particular, is important in determining ranges or trends in volatile markets.
Illiquidity
Illiquidity leads to large bid-ask spreads. Illiquidity in emerging markets is particularly caused by few
trading days, shorter trading hours and relatively low volumes traded and relatively few company
listings16. Furthermore, institutional investors who dominate frontier emerging markets like the NSE
adopt buy-and-hold strategies of usually the large cap stocks. (Adjasi & Biekpe, 2006; Prather-Kinsey,
2006)
12 Long-term strategic asset allocations or matching asset allocations to a pre-determined investment time horizon.13 These are also environments of high share volume transactions and high analyst activity and participating firms are highshare-turnover firms.14 Annual reports may be hard to come by and accounting treatments and disclosures may not conform to internationalstandards.15 While Kapchorua Tea Co. Ltd. outperformed the NSE-20 index during all three periods, Express Kenya Ltd. and WilliamsonTea Kenya Ltd. underperformed the index in at least two of the three periods. All these stocks are small cap stocks.16 For example, on 30th July 2010 the volumes of listed shares on the NYSE and LSE stood at 4,046,227,000 and1,137,071,711 respectively while those on the Nairobi Stock Exchange stood at a mere 23,076,900. While there are 3000listings on the LSE, only 55 companies are listed on the Nairobi Stock Exchange.

- 11 - © 2010 PK Mwangi Global Consulting
These factors combine to induce a forced buy-and-hold investment behaviour on investors as they are
unable to attain their desired sell prices. Such a buy-and-hold investment behaviour is typified by holding
a benchmark index like the NSE-20 index
Alpha and beta values
An active management strategy only makes sense if it can outperform a passive management strategy
after adjusting for risk. For an actively managed fund to outperform a passively managed fund e.g. an
index fund that tracks a benchmark index over time, its alpha must be less than that of a passively
managed portfolio. This also means that the value added (positive returns achieved or losses minimised)
by an actively managed portfolio must exceed that added by a passively managed portfolio on a risk-
adjusted basis as well as a cost basis. (Timmerman and Granger, 2004)
Composite portfolio performance measures like the Sharpe ratio and the Treynor ratio measure the level
of risk-adjusted portfolio returns relative to those of a benchmark portfolio. Thus:
Sharpe ratio (S) = (Return portfolio – Return risk free) / αportfolio
Other factors held constant the selection of a portfolio based on the benchmark index will reduce the
alpha denominator17 (αportfolio) thereby increasing the Sharpe ratio.
and
Treynor ratio (T) = (Returnportfolio - Returnriskfree) / βportfolio)
A portfolio built around the benchmark index (usually large stocks that are more representative of the
market) will show low volatility of returns and hence a low beta. Following on the equation above and
assuming other factors are held constant, a low portfolio beta (βportfolio) will lead to a higher Treynor ratio.
To achieve a similar Treynor ratio as the benchmark tracker fund, a riskier portfolio (for example one that
includes more high-risk small caps as in a value strategy) must yield a higher return.
Transaction and other costs
Active portfolio management aims to earn a risk-adjusted portfolio return that exceeds that on a passively
managed portfolio. The possibility of achieving this only comes at the expense of substantial transaction
17 Alpha is the difference between a portfolio’s expected risk-adjusted returns and its actual returns. It is the value that aportfolio manager adds, above and beyond a relevant index’s risk/reward profile. A portfolio that tracks the benchmark indexlike the NSE-20 comprises stocks that are most representative of the market since they are the largest companies by marketcapitalisation. Hence their beta values (volatility) are close to 1. Due to their low volatility there is little divergence betweentheir risk-adjusted returns and expected returns leading to a low alpha.

- 12 - © 2010 PK Mwangi Global Consulting
costs (including stamp duty), management and commission fees18, additional risk-taking involving small
cap stocks (and hence an added risk premium) as well as the added costs of studying both the technical
and fundamental aspects of particular stock and market movements. This reduces the likelihood of an
active management strategy outperforming a buy-and-hold strategy both in the short and long term.
(Damodaran, 2002)
Following Barber and Odean (2000), investors who traded frequently earn a lesser annualised return than
inactive investors mostly due to broker fees. Furthermore, regular reallocations under active management
(involving regular purchases of securities each of which incurs stamp duty) adds further to overall costs.
The converse is true of a passive buy-and-hold strategy.
Tax benefits
From a tax position a buy-and-hold strategy has better tax implications since unrealised capital gains are
not taxed and the tax point is usually a one-off payment every so many years as the investor liquidates his
assets. An active strategy, due to its higher rates of liquidation, has tax payable at every profit-taking
event.
Caveats
However, in arriving at the best investment strategy consideration has to be made of the investment time
horizon of any group of investors. Someone investing for the short-term (up to five years) should
generally stay away from equities (or other equity-linked securities) as they run the risk of getting back
less than they invest. For longer time horizons (five-year periods and beyond), equities do provide higher
potential returns.
Fundamental analysis is a broad concept and is not confined to merely accessing value (discount stocks)
through book-to-market valuations or accessing growth potential by merely deriving PE ratios. Other
factors that would need consideration include, but are not restricted to:
leverage ratios
cash generation and stability
dividend policy (increases in dividends or share buybacks)
18 Management fees increase with regard to an actively managed portfolio as opposed to a passively managed one. Beyondhaving to expend an incredible amount of effort to track equities on an hour-by-hour basis, active day traders have to contendwith trading commissions that can rack up quickly, dramatically eroding returns. Furthermore, there are other trading costs interms of the bid/ask spread, or the small spread between what buyers are bidding and sellers are asking at any moment.Although these more hidden costs are typically only a small fraction of the share price, they can add up to substantial amountsif incurred often enough. Also frequent traders tend not to be tax efficient, and paying more taxes can greatly diminish returns.
- 13 - © 2010 PK Mwangi Global Consulting
other financial guidance indicators
o firm costs (financial)
o capex
o interest rates
o depreciation and amortisation
o comparable sales
o tax liability/ rate
going concern issues
impending debt maturity
cost-cutting measures (operational)
contingency planning
effective management
long-established business
market share (growth)
good internal controls environment
adherence to corporate governance guidelines
relevance of business model in a fast-changing environment (competition, globalisation, etc)
broader market (macro-economic) indicators
o general trend of benchmark indices
o general trend of exports
o consumer confidence numbers
o business confidence numbers
o unemployment figures
industry/ sector analysis (trend- growth or decline or volatility)
company risk profile
o market risk
o liquidity risk
o credit risk
o exchange rate risk
o interest rate risk
o operational risk (internal to the business)
o compliance risk
tax issues
environmental issues
operational issues (e.g. health & safety regulations, food & health standards)
- 14 - © 2010 PK Mwangi Global Consulting
company law (director eligibility, financial statement disclosures, listing rules)
LimitationsThe study considered investment periods of upto a year ignoring returns that could be earned over longer
term horizons. In view of research evidence (Basu, 1977) that risk-adjusted returns on undervalued small
caps outperform those of their larger counterparts in the long-term, a different set of results would have
been seen had longer investment periods been considered.
In conducting a fundamental analysis of the quoted companies, only two factors were considered- the
book-to-market values and PE ratios. This narrow purview ignored other equally relevant variables like
dividend yield which is key in measuring the return over time and in determining the direction of investor
allocations. Wider market (macro-economic) factors especially the impact of the 2008 financial crisis
were also ignored. This latter may well have been a destabilising factor that influenced returns in a
particular direction.
‘Out-of-sample’ testing may have also reduced the robustness of the study in that different results would
have become apparent had a different era been considered. In particular, the severe market volatility
following the 2008 financial crisis represented abnormal circumstances which may not hold true in the
typical investment environment.
Critically, the lack of more up-to-date reporting in interim and/or quarterly reports may partly explain the
divergence between book values (NPV per share) and market values (market price per share) seen.
ConclusionsDespite the apparent limitations of this research on the case for a buy-and-hold strategy on the NSE, the
report uncovered the difficulties of adopting an active management strategy to achieve superior returns on
a typical illiquid frontier market. Although price anomalies exist in these markets, the cost of taking
advantage of these anomalies outways the derived benefit.
Investing in a benchmark index (tracker fund) of mostly large-cap stocks of long-established businesses
with strong sales and cash positions brings with it steady but not significantly high returns. Investing in a
portfolio of individually selected stocks – some of which carry significant risk requires great skill and
- 15 - © 2010 PK Mwangi Global Consulting
cost to pick out winners that will bring about an above-average return19. This is especially so in the equity
space where risk levels are higher than with other asset classes like fixed income securities and cash.
However, it’s not all bad news for those wishing to pursue a more involving active management strategy
as great buying opportunities and significant returns can be achieved for those ready to apply considerable
technical and fundamental analysis as well as having a portion of luck. Research has established that
under-valued small cap stocks outperform the wider market in the long-term even when adjusted for risk.
It may well be the management of agency costs that tips the scale in favour of an active management
strategy.
In the final analysis, however, this study has shown that for an active management strategy to outperform
the benchmark index- the NSE-20 it would have to select a diversified portfolio across size, sector and
involve a multi-faceted investment style. This would however come at considerable cost in time,
investigative work and risk analysis20 for the fund manager. For the retail investor, the transaction
(agency) costs of an active management strategy add to the unattractiveness of such a strategy. Both sets
of investors would benefit greatly by simply adopting a buy-and-hold strategy based on a benchmark
index like the NSE-20 index.
19 Where the NSE All-share index was used as the benchmark index rather than the NSE-20 index, none of the small caps wasable to outperform the NSE All-share index in all three periods. Kapchorua Tea in particular dropped out of the list of stocksthat outperformed the benchmark index in all three periods. This suggests that small cap stocks on average underperformed thelarge and mid-caps in the three periods further supporting the premise that small caps carry considerable risk and their returnsfall below average when adjusted for risk.20 Small caps in particular carry considerable risk. In addition to poor reporting most of these operate in the Agriculture sectorwhich is dogged by volatility in weather, world demand and prices for tea, coffee and other cash crops as well as a volatileexchange-rate regime all contributing to a risky environment for stock evaluation.
- 16 - © 2010 PK Mwangi Global Consulting
ReferencesAdjasi, C.K. and Biekpe, N.B. (2006) Stock market development and economic growth: the case ofselected African countries. African Development Review. 1, p.144-161
Athi River Mining Ltd. (2007) Audited Group Results 2006. Nairobi: Athi River Mining Ltd.
Athi River Mining Ltd. (2009) Audited Group Results for the year ended December 31 2008. Nairobi:Athi River Mining Ltd.
Bamburi Cement Ltd. (2007) 2006 Annual Report. Nairobi: Bamburi Cement Ltd.
Bamburi Cement Ltd. (2008) 2007 Annual Report. Nairobi: Bamburi Cement Ltd.
Bamburi Cement Ltd. (2009) 2008 Annual Report. Nairobi: Bamburi Cement Ltd.
Barber, B.M. and Odean, T. (2000) Trading is hazardous to your wealth: the common stock investmentperformance of individual investors. The Journal of Finance. 55(2), p.773-806
Basu, S. (1977) Investment performance of common stocks in relation to their price-earnings ratios: a testof the Efficient Market Hypothesis. The Journal of Finance. 32(3), p.663-682.
Bloomberg (2010) Market data: stocks [online] New York: Bloomberg. Available from:http://www.bloomberg.com/markets/index/html [accessed 20th July 2010].
Car & General Kenya Ltd. (2009) 2008 Annual Report. Nairobi: Car & General Kenya Ltd.
Car & General Kenya Ltd. (2008) 2007 Annual Report. Nairobi: Car & General Kenya Ltd.
Chan, L. K. and Lakonishok, J. (2004) Value and growth investing: review and update. FinancialAnalysts Journal. 60(1), p.71-86
Chan, L.K., Jegadeesh, N. and Lakonishok, J. (1996) Momentum strategies. The Journal of Finance.51(5), p.1681-1713
CFC Stanbic Bank Ltd. (2009) Annual Report 2008. Nairobi: CFC Stanbic Bank Ltd.
CFC Bank Ltd. (2007) Annual Report and Financial Statements 2006. Nairobi: CFC Bank Ltd.
Crown Berger Kenya Ltd. (2009) Annual Report and Financial Statements 2008. Nairobi: Crown BergerKenya Ltd.
- 17 - © 2010 PK Mwangi Global Consulting
Crown Berger Kenya Ltd. (2008) Annual Report and Financial Statements 2007. Nairobi: Crown BergerKenya Ltd.
Damodaran, A. (2002) Investment Valuation: Tools and techniques for determining the value of anyasset. 2nd ed. John Wiley and Sons
East African Cables Ltd. (2010) 2009 Annual Report and Financial statements. Nairobi: East AfricanCables Ltd.
Equity Bank Ltd. (2007) 2006 Annual Report and Financial Statements. Nairobi: Equity Bank Ltd.
Equity Bank Ltd. (2008) 2007 Annual Report and Financial Statements. Nairobi: Equity Bank Ltd.
Equity Bank Ltd. (2009) 2008 Annual Report and Financial Statements. Nairobi: Equity Bank Ltd.
Express Kenya Ltd. (2007) Annual report and Financial Statements 2006. Nairobi: Express Kenya Ltd.
Express Kenya Ltd. (2008) Audited results for the group for the year ended 31st December 2007.Nairobi: Express Kenya Ltd.
Express Kenya Ltd. (2010) 2009 Annual Report and Accounts. Nairobi: Express Kenya Ltd.
Housing Finance (2009) Annual Report and Financial Statements 2008. Nairobi: Housing Finance
Housing Finance (2008) Annual Report and Accounts 2007. Nairobi: Housing Finance
Kenya Electricity Generating Company Ltd. (2007) 2007 Annual Report. Nairobi: Kenya ElectricityGenerating Company Ltd.
Kenya Electricity Generating Company Ltd. (2008) 2008 Annual Report. Nairobi: Kenya ElectricityGenerating Company Ltd.
Kenya Electricity Generating Company Ltd. (2009) 2009 Annual Report. Nairobi: Kenya ElectricityGenerating Company Ltd.
Morrin, M., Jacoby, J., Johar, G.V., He, X., Kuss, A. and Mazursky, D. (2002) Taking stock ofstockbrokers: exploring momentum versus contrarian investor strategies and profiles. The Journal ofConsumer Research. 29(2), p.188-198
myStocks! (2010) Historic data. [online] Nairobi: myStocks! Available from: http://www.mystocks.co.ke[accessed 20th July 2010].
Nairobi Stock Exchange (2010) Market statistics. [online] Nairobi: Nairobi Stock Exchange. Availablefrom http://www.nse.co.ke [accessed 15th July 2010].
Nation Media Group Ltd. (2007) 2006 Annual Report and Financial Statements. Nairobi: Nation MediaGroup
Nation Media Group (2008) Annual Report and Financial Statements for the year ended 31 December2007. Nairobi: Nation Media Group
Nation Media Group (2009) Annual Report and Financial Statements for the year ended 31 December2008. Nairobi: Nation Media Group

- 18 - © 2010 PK Mwangi Global Consulting
Olympia Capital Holdings Ltd. (2010) Annual Report 2009. Nairobi: Olympia Capital Holdings Ltd.
Olympia Capital Holdings Ltd. (2007) Annual Report 2006. Nairobi: Olympia Capital Holdings Ltd.
Prather-Kinsey, J. (2006) Developing countries converging with developed country accounting standards:evidence from South Africa and Mexico. The International Journal of Accounting. 41(2), p.141-162Reuters Research Inc. (2010) Kapchorua Tea Company Ltd. New York. Reuters Research Inc.
Standard Chartered Bank Kenya Ltd. (2009) Annual Report and Accounts 2008. Nairobi: StandardChartered Bank Kenya Ltd.
Standard Chartered Bank Kenya Ltd. (2008) Annual Report and Accounts 2007. Nairobi: StandardChartered Bank Kenya Ltd.
Standard Chartered Bank Kenya Ltd. (2007) Annual Report and Accounts 2006. Nairobi: StandardChartered Bank Kenya Ltd.
The Financial Times Ltd. (2010) Market data [online] London: The Financial Times Ltd. Available from:http://www.markets.ft.com [accessed 22nd July 2010]
Timmerman, A. and Granger, C.W. (2004) Efficient Market Hypothesis and forecasting. InternationalJournal on Forecasting. 20, p.15-27
TPS Eastern Africa Ltd. (2009) Annual Report and Financial Statements 2008. Nairobi: TPS EasternAfrica Ltd.
TPS Eastern Africa Ltd. (2008) 2007 Annual Report and Accounts. Nairobi: TPS Eastern Africa Ltd.
TPS Eastern Africa Ltd. (2007) 2006 Annual Report. Nairobi: TPS Eastern Africa Ltd.