Download-manuals-hydrometeorology-data processing-15howtomakedataentryforclimaticdata

1
U.S.- Italy Research Workshop on theHydrometeorology, Impacts, and Management of Extreme Floods
Perugia (Italy), November 1995
THE NOVEMBER 1994 FLOOD EVENT ON THE PO RIVER:STRUCTURAL AND NON-STRUCTURAL MEASURES AGAINST INUNDATIONS
Enrico Marchi, Giorgio Roth, and Franco SiccardiIstituto di Idraulica
Universita di GenovaVia Montallegro 1, 16145 Genova
ITALY
Abstract. The Po River drains the largest morphological unit of the Italian territory. Rivertraining works started in the lower Po during the Roman Age and progressed upstream, first asdiscontinuous systems, then eventually connected to form two uninterrupted belts, which havereduced not only the overflow frequency, but also the storage capacity of the river floodplain.The result has been an increasing value of the flood peak quantile in the lower Po, which is thereach with the highest flooding risk. On the other side, the upstream catchment, where partialembankments have been built, recently experienced a flooding event, and requires some form ofprotection. A risk mitigation policy should take into account all the components of the riversystem and their connections. With this perspective, the development of traditional structuralprotection along the Po River has reached a critical stage; a further expansion of the existinglevee system would increase the down-stream risk. With regard to non-structural protection, theriver morphology and the past experience suggest that, based on rainfall and dischargemonitoring, early warnings of flood hazards in vulnerable communities may be feasible. Finally,to reduce the flooding risk in the lower Po, a reduction of the flood discharge entering this reachis necessary. This can be achieved by diverting the flood from the river immediately upstream ofthe lower Po, and allowing the inundation and the temporary storage of the diverted water in pre-designed large agricultural areas. Implementing such a policy will require a reliable floodwarning system and, above all, a sound regulatory authority.
1. HISTORICAL BACKGROUND
The Po River drains about 70,000 km2, which is a good portion of the 300,000 km2,which forms the continental area of the Italian peninsula. From a geological point of view, thePo valley was progressively formed from the ancient Sinus Padanus by deposition from the riversystem that drained the southern Apennine range and the west and north of the Alpine arch.These mountain chains, which mainly originated from the Tertiary Era corrugations, surround thealluvial plain of the Po River. The floodplain of the Po attained its maximum extent in theQuaternary Era, in which period all watercourses in northern Italy, as far as Dalmatia, weretributaries of the wide alluvial river from which the Po originated. The subsequent slow

2
processes of subsidence, and the progressive rise of the sea level due to the melting of the ice-cap, created the present shape of the Italian Peninsula.
The main differences between the current state of the Po River and that at the beginningof the Modern Age include a marked retreat of the shoreline in the proximity of the river mouthsand a broader extension of marshes and lagoons along the littoral zone of the northern Adriaticsea. In the Roman Age, the middle reach of the Po did not differ significantly from that of thepresent, the final reach running out into a swampy delta to the north of Ravenna with two maincourses, Primaro and Volano, flowing out of Ferrara.
1.1 THE PO RIVER VALLEY
The hydrographic basin of the Po River ends at Pontelagoscuro (Ferrara) covering an areaof about 70,000 km2. The drainage area on the left side figures 43,000 km2 of which 16,000 km2
are regulated by alpine lakes, and the drainage area on the right side figures 24,000 km2. Onlyabout one-third of the basin consists of plains. Figure 1 shows the surface drainage network ofthe Po River valley. It can be subdivided into four main areas as follows:
Figure 1. Surface drainage network of the Po River valley.
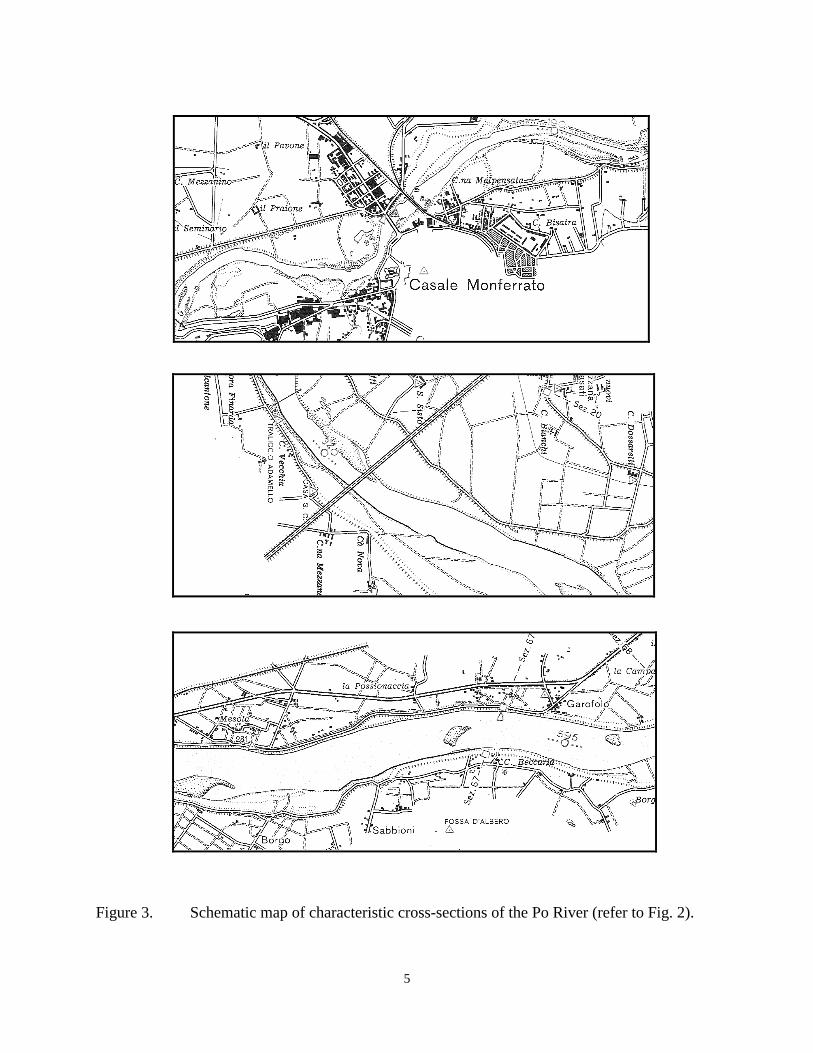
• The Upper Po: from its source to its confluence with the Ticino River (near Becca), it has anupstream drainage area of approximately 37,000 km2. The behavior of the river is torrent-likeand the floods are of varying character, whether Alpine or Apennine; they are partly containedwithin the original bed, which is provided with only partial embankments. A typical cross-section and plan view of the river in this reach are shown in Figs. 2a and 3a, respectively.
• The Middle Po: from the Ticino River confluence to the Mincio River confluence (Revere-
Ostiglia), with an upstream drainage area of 68,000 km2. The river course forms various widemeanders and remains within the main levees, which constitute two continuous systems at adistance ranging from 1 to 5 km (see Figs. 2b and 3b). There is a remarkable channel storage

3
capacity and flood values are almost unchanged along this stretch, in spite of the contributionsof various tributaries, some of which are regulated by the Alpine lakes.
• The Lower Po: from the Mincio River confluence to the beginning of the delta at Serravalle,with an upstream drainage area of 70,000 km2. The river is channeled between twocontinuous levees at a distance of 1 km (see Figs. 2c and 3c). This distance decreases in somelocations, such as Ostiglia and Pontelagoscuro, to about 400-500 m. In this reach, the Po isjoined only by the Panaro tributary from the right.
• The Po Delta: from Serravalle to the Adriatic sea. Of the five active branches, the most
efficient is the Pila branch, which carries nearly 60% of the Po total discharge to the sea. Therecent morphologic development of the delta has brought slight modifications in the dischargedistribution among the various branches.
1.2 BUILDING UP THE LEVEE SYSTEM
The Po River valley was developed for agricultural purposes well before the Romanconquest, by Etruscan and local pre-Roman populations. By this time the city of Spina, at themouth of the river, and the Etruscan settlements near Piacenza and Mantova, were alreadythriving, due to irrigated agriculture. The Roman Empire developed a number of cities along thePadania following the two major routes, Via Emilia and Via Romea. As reported by Columella(1977) in De Agricoltura, the engineering expertise of the Romans enable them to reclaimmarshes, clear the early forest, trained rivers, and divert water for drinking and irrigationpurposes. The decline of the Roman Empire led to the ruin of the social system all over theregion, and within a few centuries the hydraulic structures collapsed. Many settlementsdisappeared and the population declined dramatically. Rivers returned to wander, while lowlandmarshes and highland forests reclaimed the arable fields.
For centuries, the frequency of inundation and the instability of the riverbed prohibitedlarge urban settlements in the middle and lower Po. The first hydraulic works of the Roman Agewere gradually restored at the beginning of the second millennium with the formation ofindependent soil embankments to protect the populated areas. These rudimentary barrages werethe starting point of the huge undertakings, aiming at the regulation and stabilization of the river,which were gradually developed and expanded in the following centuries, and which werecompleted only in the 20-th century, building up a continuous chain all along the river.
1.3 VENICE LAGOON AND THE PO RIVER MOUTH
A significant change of the lower river reach occurred during the Middle Ages (1140),when the flood waters broke the banks near Ficarolo and displaced its mouth to the north. ThePrimaro branch was abandoned and instead became a drainage branch of the Reno River, whichpreviously had been a tributary of the Po River.
The tendency of the mouth of the Po to migrate towards the north-east remained evenafter the Ficarolo breakdown, causing the infill of the northern lagoon of the delta. At the end ofthe 1500, as the City of Venice realized that the sea outflow from the Polesine region could be

4
90
95
100
105
110
115
120
0 200 400 600 800 1000 1200
22
[m a.s.l.]
[m]
(a)
30
35
40
45
50
55
60
0 200 400 600 800 1000 1200
1
43 3
4
1
[m]
[m a.s.l.]
(b)
-10
-5
0
5
10
15
20
0 200 400 600 800 1000 1200
[m a.s.l.]
1 1
[m]
(c)
Figure 2. Characteristic cross sections of the Po river: (a) at 188 km from the source; (b) at341 km; and (c) at 593 km. The numbers in the figures refer to: 1-argine maestro(main levee); 2-argine semplice (unique levee); 3-argine di golena (inner levee); 4-golena (agricultural area to be temporary flooded).
5
Figure 3. Schematic map of characteristic cross-sections of the Po River (refer to Fig. 2).

6
obstructed by alluvial deposits, and, fearing the infilling of the port of Adige and the negativeimpacts on its lagoon caused by the muddy Padan waters, the City decided to undertake thoroughworks on the course of the Po. This lead to the diversion of the river mouth, through an artificialcut, into a new bed to the southeast of Sacca di Goro.
This intervention was carried out from 1598 to 1604 and is known as the “cut off of PortoViro”. The northern branch of the mouth was eliminated and, by cutting through the coastal sanddune, the Po was diverted to the east and southeast. This caused the concentration of the riverdelta mouths making it protruding with various lobes into the Adriatic Sea, mainly in the 17-thand 18-th centuries. This process began to stabilize a few decades ago, when the development ofa remarkable subsidence involved severe risks of inundation of large shore areas of the delta.
1.4 THE PO VALLEY AUTHORITY
The preservation of the Po valley environment and the sustainable development andmanagement of its resources required the centralization of the technical power into a uniquebasin authority. In 1806, under the pressure of new ideas introduced by the French revolution,Eugene Napoleon had set up a civil Magistrato for general works in the Po system. In 1906, thefirst Italian law related to the Po entrusted the State with the construction and maintenance of allprotection works along the river. The “Ufficio di Ispezione Superiore del Genio Civile per il Po”(High Inspection Authority for Civil Works on the Po) was created, and was based in Parma.
After the catastrophic flood of the Po River in 1951, which inundated about 1,000 km2 oflands around the delta, the idea of creating a central organization on the Po with more extendedpower was strongly advocated. Thus in 1956, the “Magistrato per il Po” was set up and based inParma, as a peripheral branch of the Ministry of Public Works. It is in charge of all the technicalactivities with regard to river training, regulation, and protection of nearby lowlands. Theauthority carries out investigations and general planning for hydraulic protection and settlementof the Po basin, authorizes water collection for irrigation and industrial uses, and manages theactivity of any other organization regarding the above mentioned works.
Two decades ago, Italy was divided into a number of Regions. The regional governmentshave, among other tasks, the responsibility for management and control of water and landresources. This innovation produced significant changes in the Magistrato per il Po with regardto agriculture, river navigation, and upland streams regulation works. Currently, six Regions arein control of the Po Valley. Recently, the Authority for the Po River Basin was established, andcharged with the responsibility for general planning and water management for the whole valley.The Magistrato is still in charge of flood protection and training the main river and its tributaries.
2. RAINFALL AND FLOOD PATTERNS
The total annual precipitation over the Po River basin ranges from 700 to 2,000 mm, withfrequent values of about 900-1,000 mm. Major floods are due to rainfall of long duration, ratherthan high intensity. For example, rainfall lasting five days exceeds 200 mm over most of thebasin. Data on the hydrology and hydrography of the Po basin can be retrieved from varioussources (see, e.g., Marchi, 1970; Piccoli, 1976; and Cati, 1981). The river regime, which isdominated by rainfall, is characterized by two flood periods, during June and November, and twolow water periods, during January and August.

7
The statistical analysis of flood peak discharges recorded at the Pontelagoscuro station isreliable only after 1918 because prior to that year the river flows have been affected bysignificant changes made along the river. The results obtained of flood frequency analysis areaffected by the choice of the model assumed to represent the data; however, some results areconfirmed by various modeling procedures. Two representative statistics of the annualmaximum discharges are:
• the discharge of 8,000 m3/s has a return period of 10 years;• a flood of 12,000 m3/s has a return period slightly exceeding 100 years.
A synthesis of extreme discharges of the Po River is presented in Table 1, as reported inthe study carried out by SIMPO (1984). The results of the statistical analysis of the data recordedfrom 1918 to the present are not in agreement with those of previous centuries, as pointed out inTable 2. It is clear that the Po River system has changed as a consequence of protection andregulation works on the tributaries and the main river, which caused to a shortage of floodexpansion areas (storage) in the upper and middle basin. From this point of view, an excess ofpassive protection in the upper Po may produce an increase of the flood discharge in the lowerreaches and the delta of the river. In fact, observations and measurements on the Po atPontelagoscuro (90 km from the Adriatic sea) show that the maximum floods have increasedcontinuously over the last hundred years.
Table 1. Discharge values for the Po River for different durations, D, andreturn periods, T.
Downstream of Q [m3s-1]D=355 [days]
Q [m3s-1]D=10 [days]
Qmax [m3s-1]T=20 [years]
Qmax [m3s-1]T=50 [years]
Ticino 320 2,500 9,800 12,000Adda 400 3,250 10,800 13,000Parma 450 3,400 10,400 12,500Mincio 550 3,700 9,700 11,500Delta origin 550 3,800 9,700 11,500
3. HYDRAULICS OF THE PO RIVER
3.1 MAIN LEVEES AND “GOLENA” EXPANSIONS
The traditional protection works along the Po River and the final reaches of its affluentsconsist of levees. These are earth embankments, the construction of which started back in theRoman era. The works have been mostly manual, usually not homogeneous and not interrelated.This huge undertaking concluded with the complete enclosure of the river bed in anuninterrupted embankment belt, completed at the beginning of the 20-th century. Its total lengthis 2,290 km with 1,420 km on the right bank and 870 km on the left.

8
Table 2. Data Recorded at Pontelagoscuro.
Century Date Hydr. height [m] Discharge [m3/s]XVIII from 1705 to 1799 - ≤ 7,000XIX 29.05.1810 2.62
15.10.1810 2.5316.05.1827 2.5402.10.1833 2.6808.11.1839 2.9607.11.1840 2.6423.10.1846 2.6003.11.1855 2.57 ≤ 8,00026.10.1857 3.0608.10.1868 3.0427.05.1872 2.5523.10.1872 3.3201.06.1879 3.1914.11.1886 2.8801.11.1889 2.76
XX 01.11.1907 3.18 7,88004.11.1914 2.69 6,50004.06.1917 3.72 8,90018.05.1926 3.70 8,85024.11.1926 3.47 8,55005.11.1928 3.67 8,77506.11.1937 3.24 7,74008.05.1949 3.10 7,33015.11.1951 4.80 12,00001.11.1953 3.10 7,40019.06.1957 3.04 7,20006.12.1959 2.58 7,70007.11.1966 2.58 7,36007.11.1968 2.63 7,90002.11.1976 2.93 8,20008.05.1977 2.61 7,08013.10.1977 3.07 7,950
In general, the main features of the levees on the Po are: a top width of 5 to 7 m, a river-side slope of 2:3 and land-side slope of 1:2. Usually, these massive embankments are built withlocally obtained earth, with a low coefficient of permeability. The efficiency of this protectiondepends on the duration of the flood; in fact, the seepage line rises progressively in theembankments and reaches a maximum level which depends on the height and duration of theflood wave (Marchi, 1961). Thus, water may pass through the levee and emerge on the land side(fontanazzo), leading to the danger of excessive saturation that may cause a subsidence of the
9
damming. Usually, the design of the levee profile is purely empirical and does not take intoaccount flood duration. A typical section of a main levee in the Po Delta is shown in Fig. 4.
According to a criterion codified at the end of the 19-th century, after any exceptionalflood, damaged levees have to be rebuilt or strengthened by increasing their height 0.8-1.0 mover the maximum water level. This procedure was followed for the reconstruction of leveesafter the disastrous flood of 1951, which caused the breakdown of the left levee upstream ofPontelagoscuro and the inundation of the Polesine region (see Fig. 5).
Bank protections against intense flow erosion processes in the upper Po and in themountain reaches of its affluents usually consist of natural or artificial stone revetments.
Protection works in the middle and lower Po should conform to the criteria of providing,along with some frictional resistance, some flexibility and lightness of protection materials, inorder to prevent their sinking into the bed. The traditional system of “buzzoni” -- cylinders 4 mlength and 0.45 m diameter formed by a stone core covered by willow fascines -- either dividedor joined, is still applied. However, due to the scarcity of vegetal material, they are oftenreplaced by iron gabions containing stone materials, or with stones laid over geotessil materials.
3.2 THE “GOLENA” STORAGE AND FLOOD REDUCTION
The features of floods on the Po River derive from the combination of several differentcontributions of its affluents, and from the storage capacity of the large “golena” storage systemin the middle Po, i.e., between the Ticino and Mincio confluences, which has a total storagecapacity exceeding 500 million m3.
The lower Po is not struck by exceptional floods unless the flood contributionsoriginating in the Alpine and Apennine affluents coincide in the middle Po. This is demonstratedby the flood data in Table 3. In 1945, 1956, 1957, 1962, and 1994 significant floods thatoriginated in the upper Po caused high water levels at the Ticino confluence (in Becca), butdownstream peak flows were reduced because the lack of contributions from Emilia. On theother hand, regarding the influence of the phase displacements, a comparison of the floods in1926 and those in 1958, 1959, 1960, and 1966 is telling. The maximum water discharges atBecca and at Piacenza were almost the same, but the first flood (1926) was considerably reducedbelow Piacenza, not only because of the breaching of several levees, but also because the floodsof the Emilian affluents had already subsided when the main flood of the Po arrived. On thecontrary, in 1958, 1959, 1960, and 1966, floods which were moderate at Becca progressivelyincreased due to the overlap of floods from the Lombardia and Emilia affluents, and thus becamedangerous for the delta.
The flood peaks of November 1951 exceeded all the levels previously observed in thereaches from the confluence of the Ticino to the sea. Because the Po River bed andembankments have not been changed or modified during the 20-th century through 1951, theycan not explain the exceptional characteristics of the 1951 flood. Therefore, it is argued that thedistribution, intensity, and duration of the rainfall, and the coincidence of the flood waves fromthe various affluents must have been the determining factors of such extraordinary flood. Themean rainfall intensity over the whole drainage basin was estimated to be 30.6 mm/day, while thetotal rainfall depth was 214 mm over 7 days. The resulting flood peak was the largest everrecorded on the Po River. In the lower Po, three different levee portions were overtopped by theflood water, over a total length of 736 m. Over 8,000 million m3 of water flowed out from theriver system, finally covering an area of about 1,000 km2 of the Polesine region (see Fig. 5).

10
Figure 4. Typical section of a main levee in the Po delta. Construction dates are indicated.
Figure 5. Historically flooded areas.
4. PREDICTING THE FLOOD FORMATION AND PROPAGATION
4.1 WEATHER PREDICTIONS
In the Mediterranean, the winter season sets in suddenly. As the summer eastwardextension of the Azores high pressure cell collapses, the western areas experience a suddenpressure drop in the early fall. This is accompanied by a marked increase in the probability of

11
Table 3. Historic flood peaks along the Po River.
Date Becca[m3s-1]
Piacenza[m3s-1]
Casalmaggiore[m3s-1]
Borgoforte[m3s-1]
Pontelagoscuro[m3s-1]
10.1907 10,100 9,205 10,220 9,536 7,88005.1917 10,100 12,000 10,220 10,270 8,90005.1926 11,700 12,000 9,695 9,200 9,78010.1928 -- 9,340 10,070 9,540 8,78010.1937 -- 6,200 7,420 6,840 7,74011.1945 8,800 8,800 -- 7,330 6,96004.1949 6,280 7,230 -- 6,550 7,33011.1951 11,250 12,800 12,100 11,800 12,00010.1953 4,180 4,870 -- 6,750 7,40004.1956 4,600 4,530 -- 5,130 5,13006.1957 5,850 6,400 6,980 7,100 7,20012.1958 3,320 3,900 -- 5,720 5,74012.1959 5,350 5,630 -- 7,610 7,77010.1960 4,800 5,150 -- 7,110 6,57011.1962 5,300 5,200 -- 5,040 4,82011.1966 3,260 4,030 -- 7,410 7,36011.1968 9,060 9,500 -- 7,940 7,90010.1976 7,000 -- 8,360 -- 8,32010.1977 -- 7,700 8,550 -- 7,940
10.1979 -- 6,400 7,440 -- 7,260
intense precipitation. These changes in the synoptic pattern are associated with the early invasionof polar cold fronts. Extreme rainfalls often result from the thermal effects induced by relativelyhigh sea surface temperatures during this season.
The prediction of such weather patterns is currently satisfactorily resolved over largespace and time scales by operational Global Circulation Models (GCMs) and Limited AreaModels (LAMs). Unfortunately, these models do not capture the sea surface temperatureanomalies over the long fetch from the northern African coastline to the European borders. Thisresults in frequent underestimation of the intensity and coverage of heavy precipitation patterns,although the occurrence of “average” events is fairly well predicted. The incursion of cold airmasses into the Mediterranean region leads to convective instabilities (Ramis et al., 1994) alongthe cold fronts that produce interactions between frontal and orographic enhancement. Theresulting space and time scales of heavy rainfall patterns are highly variable, depending on thestructure of the large scale circulation patterns and the local orographic features.
4.2 REMOTE SENSING OF EXTREME EVENTS
The recent development of methodologies for the interpretation, validation, andintegration of meteorological data, based on multisensor data, can change the perspective andutility of forecasts of extreme hydrological events (Roth et al., 1996). Multisensor data sources

12
of varying spatial and temporal scales are used toward this goal. They include synoptic weathermaps, polar and geostationary satellite observations, meteorological radar observations, andtelemetered rain gauge network information. These can be used in the estimation of rainfallintensity, storm areal coverage and its ground effects, and to facilitate extreme rainfall and floodforecasts, thereby providing early warnings of flood hazards to vulnerable communities.
The use of infrared imagery from geostationary meteorological satellites has beenreceiving increasing attention from the European scientific community since the initiation of theoperational mission of the ESA-Meteosat Program in the mid-1970s. Images are characterizedby low spatial resolution (7 x 5 km in mid-latitudes). However, the images are at a high temporalresolution (30 minutes) relative to the usual scale of evolution of meteorological processes at thesynoptic scale. Quasi real time acquisition and interpretation of data is possible using empiricalalgorithms. These allow translation of information about the radiance temperatures of the tops ofthe clouds - as recorded by the infrared sensor - into average rainfall intensities over large areas.These quantitative rainfall estimates are reliable only at larger spatial scales. As the informationabout cloud thickness is deduced from cloud top temperatures, the identification of precipitatingclouds may be complicated by the presence of thin high altitude entities such as anvil forms andcirrus clouds. Sequences of half-hourly images are suitable for cloud-tracking purposes, thus thehigh predictive content in the face of the overall characteristics of storm evolution can be fullyexploited. The cost of data acquisition is low, due to the stationary orbits, which permit the useof fixed data collection antennae.
Microwave sensors borne on polar-orbiting platforms provide images with lower spatialresolutions (15x15 km at best). Moreover, there is also low temporal resolution due to the loworbiting overpasses (twice daily over northern Italy).
Meteorological radar maps present the enhanced spatial resolutions (up to few hundredsof meters) and temporal resolutions (up to a few minutes) resolutions needed for floodforecasting applications. Real time acquisition and processing of data can be crucial in theissuing of meteorological warnings. Although radar accuracy in rainfall estimation depends onseveral factors such as, sensor calibration and the characteristics of both the rainfall event and themonitored area, recent multi-parametric radar techniques allow quite accurate rainfall estimates ifcombined with a rain gauge monitoring network for the calibration. Thus, radar-derivedprecipitation maps can provide initial inputs to space-time rainfall models that are based onstochastic approaches for the synthetic generation of possible rainfall fields. Unfortunately, radarcoverage of northern Italy is not complete, meteoradars with different characteristics cover theeastern portion of the area, while the western and southern portions are not radar-monitored.
For the above mentioned reasons, the sequence of disastrous flood events of recent yearsin northern Italy, and specifically the 1994 event, were only monitored and described byMeteosat images, numerical LAM predictions, and ground observations. Before entering into adescription of the 1994 event, a short review of the two kinds of typical synoptic structuresleading to flash flood events over Italy is necessary.
Figure 6 shows, in false colors, the general synoptic circulation typical of extreme eventsof the late Fall, as observed by the METEOSAT geosynchronous satellite in the near infraredwavelength. Taken at 06.00 UTC on 23 September 1992, it corresponds to the disastrousflooding event in the French Alpes Maritimes (Vaison la Roumaine) and in the Liguria region,where upstream rivers flooded areas ranging from a few tens to a few hundreds of km2. Deepblue depicts the (portion of) clouds with very high top elevations, under which very intense rainshowers are most probable; the size of this area is of the order of 100 km2 and it is advected

13
eastward with an average speed of 10-15 m/s. In its shadow, rain cells and macrocells of a fewkilometers in size develop, grow, and die with a time scale of about one hour, overlapping witheach other and convecting ice particles and graupels to the top of the troposphere. During thelifetime of a cell, this structure moves east by a few tens of kilometers, according to its advectionspeed: rain gauges in such conditions indicate showers whose duration do not exceed a few hoursbut whose rainfall depths exceed one fifth to one third of the total annual average precipitation.Rainfall depths measured by different rain gauges show a high correlation only for the timeperiod during which the shadow covers the gauge sites. It follows that the probability ofdeveloping high flood peaks is maximum for basins whose hydrologic response times are of thesame order of magnitude as the duration of the shadow. The space-time characteristics of such astorm - with a rapid eastward displacement and deep convective instability - are conducive toflash flooding in randomly selected elements of the population of small river basins which drain:the Mediterranean slopes of the Catalan range; the southern Pirineos; the French Cevennes andAlpes Maritimes; the Liguria slopes; and the Thirrenian side of the Central and South Apennineranges. Due to the small size of the catchments and the corresponding large number of elementsof the sample, the chance that a few inundation events will occur somewhere in the region, givena synoptic pattern circulation like the one depicted in Fig. 6, is very close to unity.
However, these kinds of events do not produce extreme floods in large rivers. In order tocause flooding in the Po River and its major tributaries, either the meteorological event mustpersist for a longer period or two or more similar synoptic patterns have to follow each otherwithin a time period of six days. The November 1994 event was an example of a “slowlyadvected” storm.
Figure 6. An example of a “quickly advected ”storm: the image from the ESA-Meteosatgeosyncronous satellite in the near infrared wavelength at 06.00 UTC on Sept.22nd 1992 corresponds to the flash-flood events in southern France (Vaucluse) andLiguria. The coldest and highest clouds are shown as dark gray blobs embeddedin the mesoscale circulation pattern: a larger blob covers the Alpes Maritimes anda smaller one is developing on the Apennine range in central Liguria. GiorgioBoni and Maurizio Conti are kindly acknowledged for the elaboration of theimage, according to procedures of the STORM Project (Roth et al., 1995).

14
5. THE 1994 FLOOD EVENT
5.1 METEOROLOGICAL CONDITIONS
As previously mentioned, a second flood-threatening synoptic pattern is possible overMediterranean Europe during the fall season. This is very similar to the one just described in Fig.6 but, due to the presence of an intense high-pressure system over the Carpathian area, itseastward advection speed is reduced. A typical example is shown in Fig. 7, where a sample ofthe mesoscale conditions prevailing from 16.00 UTC on 5th November to 03.00 UTC on 6th
November, 1994 is shown. This period corresponds to the disastrous flooding event in the upperPo catchment, as observed by the METEOSAT geosyncronous satellite in the thermal infraredwavelength. Upstream river basins flooded over areas ranging from 500 to more than 10,000km2 (Fig. 5). In these cases, the shadow corresponding to the maximum probability ofprecipitation remained steady over the same area: the space-time window in which rainfall depthshad high correlation enlarged, as shown in Figs. 8 and 9, and large flood peaks were observed inmedium- and large-size catchments. The randomness in the location of the rivers which willreach a critical status in a region plays a minor role in this second synoptic pattern. However,centers of more intense convection and more rapid advection are possible, as shown in Fig. 10,and can cause smaller basins to go to a critical flood stage. In the case of the 1994 event, a flashflood occurred during the night of November 5th in the Centa River, which drains 400 km2 on theThirrenian slopes of the Apennines and the medieval city of Albenga, on the Thirrenian coastwas disastrously flooded.
Figure 11 shows the general circulation over Europe the day prior to the beginning of theintense showers. By comparing the circulation pattern in Fig. 11 with the first image of thesequence of Fig. 7 it becomes evident that the advection velocity of the storm is quite low: in thenarrow corridor from northern Africa to Italy, a huge amount of vapor water content wasadvected toward the orographic enhancement by the Apennine and Alpine ranges.
5.2 RAINFALLS
Figure 8 shows the sequence of successive six-hour rainfall totals starting at November4th, 00.00 GMT, as predicted by a national Limited Area Model with 50x50 km grid-spacing.The model is administered by UCEA, the Central Agricultural Monitoring Office in Rome. Eachrun is initialized by the numerical predictions diffused the day before by the European MediumRange Weather Forecasting Center. The analysis of the images (courtesy of Professor C. Rattoof the Department of Physics of the University of Genova) shows the rainfall rapidly covering thewhole upstream basin, and intensifying during the second day, mainly in the south, near theLigurian border, and in the north-west, on the Alpine slopes. This predicted rainfall patternclearly matches the one shown in Fig. 9, which shows the sequence of observed six-hours rainfalltotals from a dense network of reporting rain gauges, and which covers the whole duration of theevent, from November 4th 00.00 UTC to November 6th 24.00 UTC. This data was manipulatedso as to reflect a similar space and time resolution to the numerical output. The results areinteresting: it is evident that the numerical rainfall predictions underestimate both the mean andthe space variance of the real process. This is mainly because the sea surface temperature, which

15
Figure 7. An example of a “slowly advected ”storm: the sequence of half hourly imagesfrom the ESA-Meteosat geosyncronous satellite in the near infrared wavelength,from 16.30 UTC on November 5th to 03.00 UTC on November 6th, covers the lastperiod of intense rainfall (see Fig.11). The deep gray blob remains steady overnorthwest Italy due to the proximity of the Carphian high, which is cloud free inthe image. Giorgio Boni and Maurizio Conti are kindly acknowledged for theelaboration of the image, according to procedures of the STORM Project (Roth etal., 1995).

16
Figure 7 (Continuation)
controls the incoming water vapor content, is not based on observations, but is introduced intothe GCM and LAM as a historical climatological value. However, despite this problem, thenumerical rainfall predictions correctly reproduce the major space and time features of the event.

17
Figure 8. Six hours rainfall depths predicted by the national LAM 50x50 km operated byUCEA. Courtesy of Prof. C. Ratto of the Meteo Center of the Dept. of Physics ofthe University of Genova. Ing. Giorgio Boni and Ing. Maurizio Conti areacknowledged for the elaboration of the data.

18
Figure 8 (Continuation)
The storm event is summarized in Figs. 10 and 12: the daily totals for Nov. 4 th and 5 th areshown in Fig. 10, while Fig. 12 shows the hourly precipitation intensities and accumulated depthsrecorded by three characteristic rain gauges. Peak intensities as high as 35-40 mm/hr and totalsexceeding 200 mm in six hours were observed: such extremes are rare, but not unprecedented inMediterranean climatology.
5.3 PEAK FLOWS
By noon of November 6th, peak flows were observed in the hydrometric stations of the westernand northern upper catchments: the major tributary from the north, the Sesia, had already peakedat more than 3,000 m3/s, while in the main river at Casale, the maximum flow of 6,000 m3/s wasattained at exactly noon, greatly exceeding historically observed values. The largest southerntributary, the Tanaro, flooded many cities along its course before noon: at its confluence with thePo River, the peak flow of more than 3,500 m3/s was observed by 11 p.m. a value 10% higherthan that observed in 1951. Fifty kilometers downstream, at the famous hydrometric station ofPonte Becca, which controls the main course at the confluence of the Tanaro River, the flow inthe Po River peaked at 11,300 m3/s, slightly exceeding the 1951 value, by 11 a.m. of thefollowing day, the 7th of November. Downstream of Ponte Becca, the input from northern andsouthern tributaries, contrary to the events during the 1951 flood, was very low, and the floodslowly subsided to less than 9,000 m3/s on entering the final reach of the Delta.
A comparison of the November 1994 data with that of 1951 is shown in Table 4. Thetable shows the average precipitation for the whole event on the major upstream Po tributariesand for a few characteristic sections of the total Po catchment. The values for the recent eventclearly show the low flow condition of the downstream tributaries, while in the previous event,because of a second intense meteorological event that occurred two days after the first one, thecontributions of the Ticino, Adda and Oglio rivers from the north, and particularly of theTrebbia, Taro, Secchia, and Panaro rivers from the south, led to significant downstream flooding.A comparison between the flooded areas of the 1994 event and the flooded areas in previousevents is shown in Fig. 5.

19
Figure 9. Six-hour rainfall depths observed by the real-time reporting network of thePiemonte Region and by the traditional network covering the Liguria Region. Observations aremade compatible with the pixel size of the LAM predictions. Courtesy of Dr. V. Coccolo of theMeteo Center of the Regione Piemonte and of Ing. Heredia Calderon for the data over Liguria.Giorgio Boni and Maurizio Conti are kindly acknowledged for the elaboration of the data.

20
Figure 9 (Continuation)

21
Figure 10. Daily total precipitation (mm): a) 4.11.1994; b) 5.11.1994
Figure 11. Meteorological conditions at 850 hpa over Europe at 04.11.1994 12.00 GMT.From Deutscher Wetterdienst Eur. Met. Bulletin.

22
(a)
(b)
Figure 12. Hourly precipitation intensity (left scale: mm/h) and total depth (right scale: mm)in three characteristic rain-gauges of the Po River upper catchment: (a) Ponzone near theLigurian border in the South; (b) Priero in the West; and (c) Oropa in the North. Courtesy of theAutorità di Bacino del Fiume Po.

23
(c)
Figure 12 (Continuation)
Table 4. Average total precipitation on the upper Po tributary catchments and on the Upper PoRiver catchments at few characteristic sections, for the event of November 1994 compared withprevious ones.
Catchment Catchment Area(thousands km2)
4-6.11.1994 8-13.11.1951 1-4.11.1969
Upstream catchments:Sesia 2.3 313 341 414
Dora Baltea 3.3 219 154 --Tanaro 8.0 190 207 223
Whole upstream catchment 28.3 194 218 267Po at Ponte Becca 36.8 150 207 --Po at Piacenza 42.0 131 208 --Po at Boretto 55.2 99 195 --Po at Pontelagoscuro 70.0 78 178 158
5.4 IMPACTS
During the 1994 flood more then sixty people died, half of them while driving or trying toretrieve their cars from the roads or streets along the banks. The event had an impact in morethan 240 municipalities: about 31,000 families were affected and 4,500 lost their homes orproperty. The total damage to private property exceeded 0.8 billion European Currency Units(ECU), which is equivalent to 1.2 billion of U.S. dollars. The State subsidized the affectedfamilies by about 0.45 billion ECU.

24
Railways, highways, public utilities, and levees were significantly impacted:
• the “Ferrovie dello Stato” spent about 75 million ECU during the fiscal year endingDecember 1995 in rehabilitating 19 of 21 lines, connecting the major cities of Piemonte,Lombardia, and Liguria. Two connections are still out of service due to a shortage of funds;
• the “Azienda Nazionale Autostrade e Strade” spent a similar amount in the same period.However, for three state highways, SS31 near Chivasso, SS28 near Ceva, and SS339 nearCortemilia, the bridges over the Po and the Tanaro rivers are yet to be rebuild;
• local connections and public utilities, such as schools and hospitals, suffered extensivedisruptions: 1.5 billion ECU were spent locally by the Municipalities. One third were directlytransferred by the state, while two thirds are soft loans to be repaid over ten to fifteen years.
The ”Magistrato per il Po” has a shopping list totaling 0.7 billion ECU for the repair andrehabilitation of the levee system and its technical components. The yearly budget of theMagistrato is such that this rehabilitation activity will extend well into the next millennium.
With regard to the damage to industrial installations, the evaluation of banks’ soft loans tofirms, factories and small businesses show that the total amount of funds needed to restoreindustrial and commercial activity is of the order of 0.4 billion ECU.
The inundation of large agricultural areas near the critical reaches of rivers in the uppercatchments did not destroy property, but reduced the agricultural output of the Spring andSummer of 1995. The losses are of the order of 0.15 billion ECU, including livestock and smallagricultural facilities.
The total amount of direct damage to the Padania economic and social system totals about3.35 billion ECU. Indirect losses include the general decrease of the Gross Regional Product ofthe Padania, which is nearly half of the national GNP, and a large decrease of the capital stockdue to the sudden depreciation of the inundated areas.
The local financial crisis was managed by the Central Government using three tools: thedirect subsidy of private parties, the diversion of annual resources of large national agenciestoward the restoration of the Padania infrastructure, and the coverage, by the bank system, of thedifference between the prevailing lending costs in the financial market and the rate of interestcharged on the soft loans to industry and commerce.
The total cost for the public administration was, in the current fiscal year, of the order of1.2 billion ECU, while the remaining part has been transferred to subsequent years. No insurancesystem against natural hazards is yet operational in the country.
6. MANAGING THE FLOODING RISK
As a consequence of the long history of hydraulic works undertaken along the Po River,the spatial distribution of the flooding risk is not uniform along the river. The development oflevees started in the lower Po and propagated upstream in the middle Po, first as discontinuoussystems, which then connected to form two uninterrupted belts. These have reduced both theoverflow discharges and the storage capacity in the flood bed - delimited by main levees - of themiddle Po. The outcome of this process is an increased value of the flood peak in the lower Po,

25
which is the reach with the highest flood risk. The upper catchments, where the river is onlyprovided with partial embankments, experienced a flooding event in 1994, and require someform of protection.
In the subsequent paragraph, different proposals aimed at reducing the flood risks areintroduced. The perspective is that of global river-training, and the description follows thehistorical development of the hydraulic works along the river.
6.1 THE DOWNSTREAM REACH
As previously described, the distance between the main levees is reduced to an averagevalue of 1 km in the downstream reach of the Po River, with minimum values of 400 m.Moreover, the river is surrounded, as shown in Fig. 3c, by civil and industrial settlements. Thisgreatly reduces the feasibility of widening the river. An alternative solution -- increasing thelevee height -- is limited by the characteristics of the structures themselves (earth embankment)and the heterogeneity of the construction, which is the result of centuries of additions, as shownin Fig. 4. The failure of this defense would therefore be expected to be from seepage due to theinfiltration of water through the embankment, and not by overtopping, as was the case in the1951 flood.
The only feasible solution is therefore a controlled reduction of the flood dischargeentering the lower Po, aimed at limiting the height of the water surface during floods. To thisend, different proposals can be formulated; all associated with structural or non-structural worksin the upstream parts of the river: the middle Po and the upper catchments.
6.2 THE NORTHERN LAKES
There are four lakes in the northern area of the middle Po catchment: Maggiore, Como,Iseo, and Garda. Inflows and outflows from these lakes are regulated for hydropower generationand water supply for irrigation. Their storage capacities (1,100 million m3 was stored inMaggiore, Como, and Iseo lakes during the 1951 flood) contribute to the attenuation of the floodpeak in the tributaries to the Po River. However, this capacity cannot be increased withoutflooding the urban settlements located along their shores. Reservoirs developed for hydropowerproduction are located all along the Alpine arch. Their total storage capacity is 1,600 million m3.Unfortunately, their contributing area is less than 3-4% of the Po total catchment area, and thetypical operating rule yields a full reservoir in the fall season, which is the critical period for thePo floods.
6.3 THE SOUTHERN TRIBUTARIES
The southern tributaries present a different regime: surface and groundwater storagecapacities are reduced when compared with the northern area. As a consequence, dischargevalues are, in these rivers, more directly related to rainfall events. Past experience shows that acritical condition develops when the contributions from southern tributaries overlap a Po floodwave due to rainfall on the upper catchment. In this condition, a reduction of the peak dischargeentering the Po River from these tributaries would be effective, but not sufficient, in reducing theflood risk in the lower Po reaches. Due to a valley morphology that does not permit theconstruction of traditional flood control reservoirs, the reduction of the peak discharge is

26
presently obtained, on the Secchia and Panaro tributaries, by allowing the expansion of the flood-wave, with temporary storage of the diverted water. A typical flood control structure used forthis purpose is presented in Fig. 13. Problems arise in defining the operating rules of thesereservoirs: they do not reduce the total flood volume, and a longer duration of high dischargevalues is therefore associated with the reduction of the flood peak, thereby increasing theprobability of flood waves overlapping in the Po River. Nevertheless, the downstream reaches inthe tributaries are then subject to a controlled flood that can be conveyed without inundation.
Figure 13. Flood control structure on the Secchia river: A) main storage reservoir, B)spillway, C) dam with calibrated bottom outlets, D) outlet from the reservoir, andE) barrage.
6.4 THE UPSTREAM CATCHMENT
The 1994 flood event in the upper Po catchments, with its associated relevant economiclosses, evinced the need and importance of some form of protection for this area. Since theconstruction of levees would increase the already high downstream flood risk, the use of thisstructural protection must be restricted to the limited portion of the drainage network alongwhichcivil and industrial settlements exist. Non-structural protections, such as the diffusion ofpreventive instructions about the flood hazard and prompt alarms during floods, can be used inagricultural areas. They can also include, for example, the elaboration of insurance plans to

27
reduce the economic losses and the use of development plans to prevent the expansion of civiland industrial establishments in areas subject to inundation.
7. RISK MITIGATION POLICY FOR THE YEAR 2000
A risk-mitigation policy should follow in a global point of view whereby all thecomponents of the river system and their connections are correctly perceived and accounted for.With this perspective, it is clear that the development of traditional structural protection againstinundation along the Po River and its tributaries has reached a critical stage in which furtherupstream expansion of the existing levee system would increase the risk in the downstreamportion of the river. Moreover, the lower Po cannot cope with an increase in the risk ofinundation simply by widening the river cross-section or raising the levee height.
From the viewpoint of non-structural protection, methodologies for the interpretation,validation, and integration of meteorological data based on multisensor data can be used to assistin the estimation of rainfall intensity, storm areal coverage, and ground effects. In fact, themorphology of the Po River and past experience suggest that, on the basis of the monitoring ofextreme rainfall on the entire Po catchment and of the discharge at the Ticino confluence, i.e. inthe upstream Po catchment, early warnings of flood hazards can be provided to vulnerablecommunities.
Finally, to reduce the flooding risk in the lower Po reaches and the risk of inundation ofthe Polesine region (1,000 km2 of this region was covered with 2-3 m of water in the 1951 flood)a reduction of the flood discharge entering the lower Po is necessary. This can be obtained bydiverting part of the flood wave - nearly 300-500 million m3 - from the Po River immediatelyupstream of the lower reach, and by allowing the temporary storage of the diverted water over anarea of nearly 100 km2, to a mean water depth of 4 m. The diversion could be located betweenthe Oglio and Mincio tributaries on the left bank, or between the Secchia and Panaro tributarieson the right bank. In both cases, the levees of the tributaries must be used to limit the expansionof the water, and pumping stations must be constructed to return the diverted waters to the PoRiver after the flood.
In order to make possible the diversion of an extreme flood on the Po River before thefinal reach, the populace should be evacuated well before the eventual breaching of the levees inthe pre-determined location. The joint use of upstream hydrometric observations and properhydraulic modeling of flood propagation, numerical rainfall prediction on the downstreamtributary catchments, and proper flood formation modeling will allow the issuance of earlywarnings with sufficient lead-time and acceptable reliability. The actual breaching of the leveeshould obviously be based only on hydrometric observations in the nearest upstream section,because the required lead-time is very short.
The achievement of such a plan involves obvious economic and social responses: togetherwith proper technical choices, authoritative political decisions are therefore needed.
Acknowledgments. The authors kindly acknowledge the support of the National Research Groupfor the Protection from Natural Hazards of the Italian Research Council, and the help of theAuthority for the Po River Basin in making available the majority of the data.

28
8. REFERENCES
Cati, L. (1981). Idrografia e idrologia del Po, Istituto Poligrafico dello Stato, Roma.Columella, L.G.M. (1977). De Agricoltura (in Latin with Italian translation), Giulio Einaudi,
Torino.Marchi, E. (1961). Sulla filtrazione attraverso gli argini fluviali, VII Convegno di Idraulica,
Palermo.Marchi, E. (1970). Problems of Po regulation and flood control, Internationale Fachtagung überFlussregulierungen, Universität Karlsruhe, July 9-11.Piccoli, A. (1976). Le maggiori piene del Po dal 1900 al 1970, Accademia Nazionale dei Lincei,
Roma.Ramis, C., Alonso S., and Llasat, M.C. (1994). A comparative study between two cases of
extreme rainfall events in Cataluna, Surveys in Geophysics, 16(2).Roth, G., Barrett, E., Giuli, D., Goddard, J., Llasat, M.C., Minciardi, R., Mugnai, A., Scarchilli,
G., and Siccardi, F. (1996). The STORM Project: Aims, objectives and organisation, RemoteSensing Reviews, 14, 23-50.
SIMPO (1984). Studio e progettazione di massima delle sistemazioni idrauliche dell’astaprincipale del fiume Po, Roma.