
The Northeast Kingdom & Vermont Newport, VT October 24, 2014 Mathew Barewicz Economic & Labor Market...
19
The Northeast Kingdom & Vermont Newport, VT October 24, 2014 Mathew Barewicz Economic & Labor Market Information Division Vermont Department of Labor www.vtlmi.info
-
Upload
virginia-waters -
Category
Documents
-
view
217 -
download
1
Transcript of The Northeast Kingdom & Vermont Newport, VT October 24, 2014 Mathew Barewicz Economic & Labor Market...

The Northeast Kingdom & Vermont
Newport, VT October 24, 2014
Mathew BarewiczEconomic & Labor Market Information Division
Vermont Department of Labor
www.vtlmi.info

E&LMI: WHO ARE WE?
The Economic & Labor Market Information Division– housed in the Vermont Department of Labor– state partner to the federal government– 100% federally funded
Purpose:- to produce, explain and disseminate economic data
for the benefit of the State of Vermont, educational institutes, employers, students, job-seekers, researchers, and the general public.
www.vtlmi.info

Nationwide, job losses during this recession outpace anything in recent history:
www.vtlmi.info

The Great Recession: Digging out of a very deep hole
2005 2006 2007 2008 2009 2010 2011
-4
-3
-2
-1
0
1
2
3
Annual percent change in per capita GDP
United StatesVermont
www.vtlmi.info

Perhaps the most troubling US trend…
www.vtlmi.info

Losses in Vermont resemble 1990…
-5.0%
-4.0%
-3.0%
-2.0%
-1.0%
0.0%
1.0%
2.0%
-18 -16 -14 -12 -10 -8 -6 -4 -2 0 2 4 6 8 10 12 14 16 18 20 22 24 26 28 30 32 34 36
%
Job
Losses
VT's Last Three Recessions: % Change in Jobs & Duration in Months (relative to trough of US recessions)
2008 2001 1990
Months, aligned with bottom of the recession
NBER announcing end of US recession
S
Aug '12
S
But recovery has been far slower
www.vtlmi.info

The Burlington MSA has outpaced the state
www.vtlmi.info

SO WHAT DOES IT ALL MEAN?
- The economy is just now getting back to where it was before the last recession
- The “recovery” has not been felt by all
- And what about the NEK???
www.vtlmi.info

THE RECENT ECONOMIC HISTORY OF THE NEK
www.vtlmi.info

THE RECENT ECONOMIC HISTORY OF THE NEK
www.vtlmi.info

THE RECENT ECONOMIC HISTORY OF THE NEK
www.vtlmi.info
• But that doesn’t tell us anything…– Differences in industry composition and
occupational opportunities– Average wage is not the experience of all– Inflation– Etc…

DATA LIMITATIONS - AVAILABILITY
www.vtlmi.info
of Total 2012 Covered EmploymentVermont Caledonia Essex Orleans
Private 82.5% 81.4% 61.9% 79.8%Public 17.5% 18.6% 38.0% 20.2%
of Total 2012 Covered Private EmploymentVermont Caledonia Essex Orleans
Goods Producing 20.0% 24.6% 36.7% 26.0%Service Providing 80.0% 75.4% 63.3% 74.0%

THE RECENT ECONOMIC HISTORY OF THE NEK
www.vtlmi.info
Total Covered Employment% Change Since 2000
2000 2007 2013 2007 2013VT 301,722 303,438 301,596 0.6% 0.0%Caledonia 11,578 11,772 10,973 1.7% -5.2%Essex 1,795 1,397 999 -22.2% -44.3%Orleans 9,422 10,015 10,329 6.3% 9.6%US (000s) 132,019 137,936 136,368 4.5% 3.3%
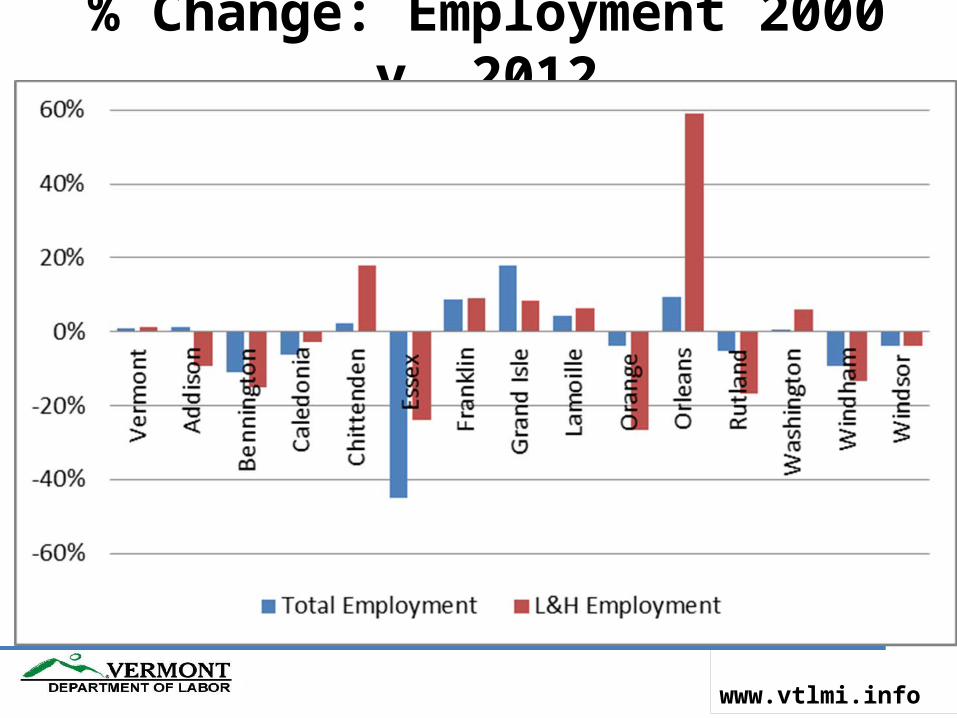
% Change: Employment 2000 v. 2012
www.vtlmi.info

BUT BEFORE I GO…
- A quick point about the labor force…
www.vtlmi.info

Labor Force Percent Change by Age Group:
Projected 2012-2216-24
25-34
35-44
45-54
55-64
65+
-13.3%
9.9%
6.3%
-9.9%
14.6%
74.4%
16
Total labor force growth= 5.5%

THE FUTURE…. MAYBE
www.vtlmi.info
Low Scenario High ScenarioRegion Census Projection Projection Percent Projection Projection Percent
2010 2020 2030 Change* 2020 2030 Change*2010-30 2010-30
Caledonia 31,227 32,199 32,534 4.2% 32,336 32,752 4.9%Essex 6,306 5,974 5,480 -13.1% 5,949 5,489 -13.0%Orleans 27,231 27,424 27,008 -0.8% 28,598 29,296 7.6%Vermont 625,741 628,688 620,480 -0.8% 653,575 670,073 7.1%
Population Projections 2010-2030

E&LMI: RESOURCES Regional information Publications like the
Economic & Demographic Profile Series
Employment by Industry data; Including breakdowns by county and by size of firm
Employer Database – publicly* available, searchable directory of employers
*(not VDOL data)
www.vtlmi.info

Questions….& Thank you!
Mathew BarewiczEconomic & Labor Market Information Division
Vermont Department of Labor802.828.4153
www.vtlmi.info