The North Carolina Online Computer Skills Assessment: Relationships between Item Response Times and...
24
Assessment: Assessment: Relationships between Item Response Times Relationships between Item Response Times and and Item Residuals Item Residuals – or – – or – Can Item Response Times Tell Us Anything about the Probability of a Correct Response? John Klaric John Klaric 1,2 1,2 1 Department of Educational Research Department of Educational Research Methodology, The University of North Methodology, The University of North Carolina at Greensboro Carolina at Greensboro 2 NC Department of Public Instruction: NC Department of Public Instruction: Accountability Services Division Accountability Services Division Accountability Conference, 2009 Accountability Conference, 2009
-
Upload
ruby-hopkins -
Category
Documents
-
view
215 -
download
1
Transcript of The North Carolina Online Computer Skills Assessment: Relationships between Item Response Times and...

The North Carolina Online The North Carolina Online Computer Skills Assessment:Computer Skills Assessment:
Relationships between Item Response Times andRelationships between Item Response Times andItem ResidualsItem Residuals
– or – – or –Can Item Response Times Tell Us Anything about
the Probability of a Correct Response?
John KlaricJohn Klaric1,21,2
11Department of Educational Research Department of Educational Research Methodology, The University of North Carolina Methodology, The University of North Carolina
at Greensboroat Greensboro22NC Department of Public Instruction:NC Department of Public Instruction:
Accountability Services DivisionAccountability Services Division
Accountability Conference, 2009Accountability Conference, 2009

22
Purpose and SignificancePurpose and Significance• PurposePurpose
– Accountability Services at DPI faces a daunting Accountability Services at DPI faces a daunting task: task: • The Testing Policy and Operations team and the Test The Testing Policy and Operations team and the Test
Development team concentrate on developing Development team concentrate on developing policies and tests that assess student proficiency in a policies and tests that assess student proficiency in a number of content areas. number of content areas.
• Various groups analyze student test results – results Various groups analyze student test results – results that are used by many stakeholders. These results that are used by many stakeholders. These results are also used for federal and state reports as officials are also used for federal and state reports as officials make data-driven policy decisions.make data-driven policy decisions.
– What if the tempo, or pace, with which students respond – correctly or incorrectly – is a stable student characteristic that is informative about that student’s proficiency?
33
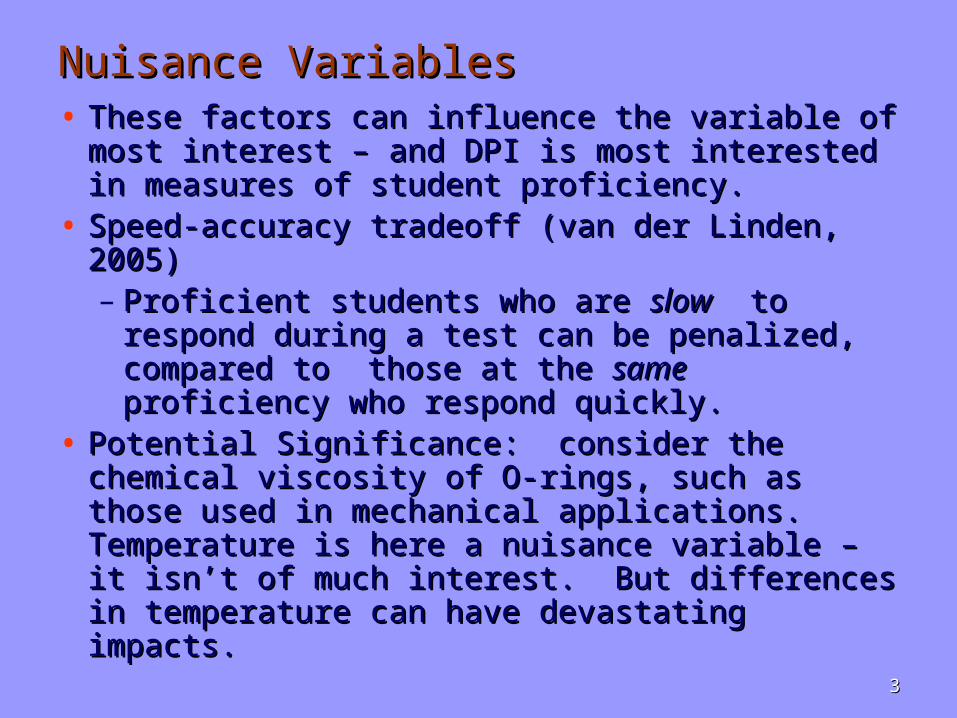
Nuisance VariablesNuisance Variables• These factors can influence the variable of These factors can influence the variable of
most interest – and DPI is most interested in most interest – and DPI is most interested in measures of student proficiency.measures of student proficiency.
• Speed-accuracy tradeoff (van der Linden, Speed-accuracy tradeoff (van der Linden, 2005)2005)– Proficient students who are Proficient students who are slowslow to to
respond during a test can be penalized, respond during a test can be penalized, compared to those at the compared to those at the samesame proficiency proficiency who respond quickly.who respond quickly.
• Potential Significance: consider the chemical Potential Significance: consider the chemical viscosity of O-rings, such as those used in viscosity of O-rings, such as those used in mechanical applications. Temperature is here mechanical applications. Temperature is here a nuisance variable – it isn’t of much interest. a nuisance variable – it isn’t of much interest. But differences in temperature can have But differences in temperature can have devastating impacts.devastating impacts.

44
Research Methods:Research Methods:The NC Online Computer Skills The NC Online Computer Skills Assessment (OCSA, 3Assessment (OCSA, 3rdrd Edition Edition
Administered Fall, 2005)Administered Fall, 2005)• Because it is a computer-based assessment, Because it is a computer-based assessment,
examinee actions with the mouse and/or examinee actions with the mouse and/or keyboard can be captured accurately.keyboard can be captured accurately.
• Response times: length of item presentation vs Response times: length of item presentation vs “time to overt response”“time to overt response”
• 2 datasets built from the Fall 2005 data:2 datasets built from the Fall 2005 data:– ““Complete” dataset, containing item responses and Complete” dataset, containing item responses and
times from all students taking the exam. times from all students taking the exam. – ““Time Truncated” dataset – some slower-responding Time Truncated” dataset – some slower-responding
examinees were systematically excluded (about 2000, examinees were systematically excluded (about 2000, taking longer than roughly 2 hours to complete the test)taking longer than roughly 2 hours to complete the test)

55
Research Methods:Research Methods:The NC Online Computer Skills The NC Online Computer Skills Assessment (OCSA, 3Assessment (OCSA, 3rdrd Edition Edition
Administered Fall, 2005)Administered Fall, 2005)• Test DescriptionTest Description
– Computer-based (non-adaptive) assessmentComputer-based (non-adaptive) assessment– 54 items in length: approximately half, 54 items in length: approximately half,
multiple-choice (MC) items with 4 response multiple-choice (MC) items with 4 response options; remainder, performance-based options; remainder, performance-based arranged in problem-based item setsarranged in problem-based item sets
– 0/1 scoring procedures0/1 scoring procedures• Fall 2005 AdministrationFall 2005 Administration
– 8 forms spiralled within schools, administered 8 forms spiralled within schools, administered to over 100,000 8to over 100,000 8thth graders graders
– Motivation: NC graduation requirementMotivation: NC graduation requirementSource: North Carolina Department of Public Instruction, 2008. Source: North Carolina Department of Public Instruction, 2008.

66
Research Methods:Research Methods:The NC Online Computer Skills The NC Online Computer Skills Assessment (OCSA, 3Assessment (OCSA, 3rdrd Edition Edition
Administered Fall, 2005)Administered Fall, 2005)• 6 content-related strands:6 content-related strands:
Societal/Ethical Issues (12-14%)Societal/Ethical Issues (12-14%)
Spreadsheet (22-25%)Spreadsheet (22-25%)
Multimedia & Presentation (10-12%)Multimedia & Presentation (10-12%)
Database (22-25%)Database (22-25%)
Keyboarding/Word Processing/Keyboarding/Word Processing/
Desktop Publishing (18-20%)Desktop Publishing (18-20%)
Telecommunications and Internet (10-12%)Telecommunications and Internet (10-12%)

77
Figure 1. Total Test Response Times, Figure 1. Total Test Response Times, Complete Dataset (Complete Dataset (NN=105917): Fall =105917): Fall
2005, NC Online Computer Skills 2005, NC Online Computer Skills
AssessmentAssessment
0 3400 6800 10200 13600 17000Total Response Time (sec)
0
2000
4000
6000
8000
10000
Fre
quen
cy
0.0
0.01
0.02
0.03
0.04
0.05
0.06
0.07
0.08
0.09
Proportion per B
ar

88
Figure 2. Total Test Response Times, Figure 2. Total Test Response Times, Time-Truncated Dataset (Time-Truncated Dataset (NN=103751): =103751): Fall 2005, NC Online Computer Skills Fall 2005, NC Online Computer Skills
AssessmentAssessment
0 2500 5000 7500Total Response Time (sec)
0
1000
2000
3000
4000
Fre
qu
en
cy
0.0
0.01
0.02
0.03 Pro
po
rtion
pe
r Ba
r
99
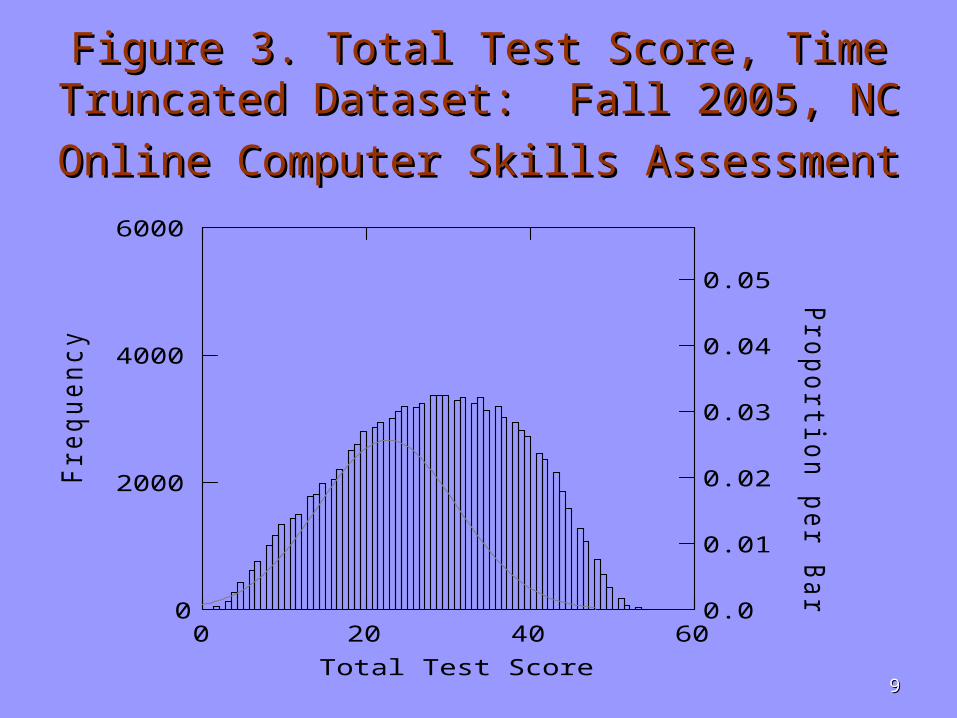
Figure 3. Total Test Score, Time Figure 3. Total Test Score, Time Truncated Dataset: Fall 2005, NC Truncated Dataset: Fall 2005, NC
Online Computer Skills AssessmentOnline Computer Skills Assessment
0 20 40 60Total Test Score
0
2000
4000
6000
Fre
qu
en
cy
0.0
0.01
0.02
0.03
0.04
0.05
Pro
po
rtion
pe
r Ba
r

1010
Comparison of Score Distributions from Comparison of Score Distributions from Complete vs Time Truncated DataComplete vs Time Truncated Data
Table 1. Statistical Moments for Total Test Scores during the Fall 2005 Table 1. Statistical Moments for Total Test Scores during the Fall 2005 Administration of NC’s Online Computer Skills AssessmentAdministration of NC’s Online Computer Skills Assessment
NN MeanMean Standard Standard DeviationDeviation
Skew-Skew-nessness
KurtosisKurtosis
Complete datasetComplete dataset 105911059177
28.228.2 10.6510.65 -0.12-0.12 -0.77-0.77
Truncated Truncated datasetdataset
103751037511
28.328.3 10.6610.66 -0.13-0.13 -0.77-0.77
Note:Note: Means and standard deviations are from sums of dichotomized item scores Means and standard deviations are from sums of dichotomized item scores (0=incorrect, 1=correct) across all items where a response was made. Items with (0=incorrect, 1=correct) across all items where a response was made. Items with missing responses are excluded.missing responses are excluded.

1111
Classical Item Statistics from Edition 3 Classical Item Statistics from Edition 3 of the NC Computer Skills Assessment of the NC Computer Skills Assessment
(Time Truncated Data): Fall 2005 (Time Truncated Data): Fall 2005 AdministrationAdministration
Pearson Serial Pearson Serial Pearson Serial1 62.5 0.225 0.287 19 61.8 0.378 0.482 37 73.2 0.555 0.7462 72.5 0.495 0.663 20 68.9 0.374 0.489 38 60.9 0.337 0.4283 27.6 0.423 0.565 21 34.1 0.425 0.549 39 54.7 0.475 0.5974 59.9 0.463 0.587 22 77.8 0.349 0.488 40 79.8 0.358 0.5115 48.8 0.274 0.344 23 82.4 0.438 0.644 41 57.5 0.438 0.5536 61.6 0.282 0.359 24 42.3 0.242 0.305 42 43.5 0.278 0.357 51.5 0.313 0.392 25 56 0.418 0.526 43 73.9 0.553 0.7478 62.7 0.374 0.478 26 31.6 0.502 0.656 44 65.7 0.425 0.5499 76.8 0.347 0.48 27 63.2 0.467 0.598 45 80.5 0.46 0.6610 69.8 0.372 0.49 28 74.8 0.271 0.369 46 50.8 0.457 0.57311 43.2 0.303 0.382 29 74.4 0.349 0.473 47 29.1 0.54 0.71512 75.2 0.169 0.231 30 41.3 0.222 0.28 48 33.9 0.273 0.35413 23.4 0.165 0.229 31 36.1 0.43 0.552 49 64.3 0.282 0.36214 10.6 0.301 0.506 32 29 0.447 0.593 50 60.5 0.445 0.56515 22.4 0.374 0.521 33 41.9 0.329 0.415 51 16.5 0.365 0.54516 66.1 0.475 0.615 34 33.6 0.572 0.741 52 39.7 0.49 0.62117 29.7 0.446 0.589 35 37.2 0.448 0.572 53 43.3 0.631 0.79518 48.8 0.329 0.412 36 49.3 0.578 0.724 54 52.1 0.288 0.361
Table 2. Classical Item Statistics
Item pItem-Total Correlation
Item pItem-Total Correlation
Item pItem-Total Correlation

1212
Item Summary Statistics from a 3-Item Summary Statistics from a 3-Parameter Logistic IRT Model: Fall ’05 Parameter Logistic IRT Model: Fall ’05 NC Computer Skills Assessment, Time NC Computer Skills Assessment, Time
Truncated DataTruncated Data
IRT Parameter MeanStandard Deviation Minimum Maximum
Discrimination (a i ) 0.81 0.271 0.258 1.617
Difficulty (b i ) 0.09 0.987 -2.555 2.094Pseudo-guessing
(c i )Response Probability 0.52 0.181 0.109 0.816
Residual (e ij =u ij -P( 1j )) 0.01 0.008 -0.003 0.039
Notes: Descriptive statistics are computed from the truncated dataset. All calculations were performed to full precision.
Table 3. Summary of IRT Item Characteristics
0.09 0.112 <0.001 0.444
1313
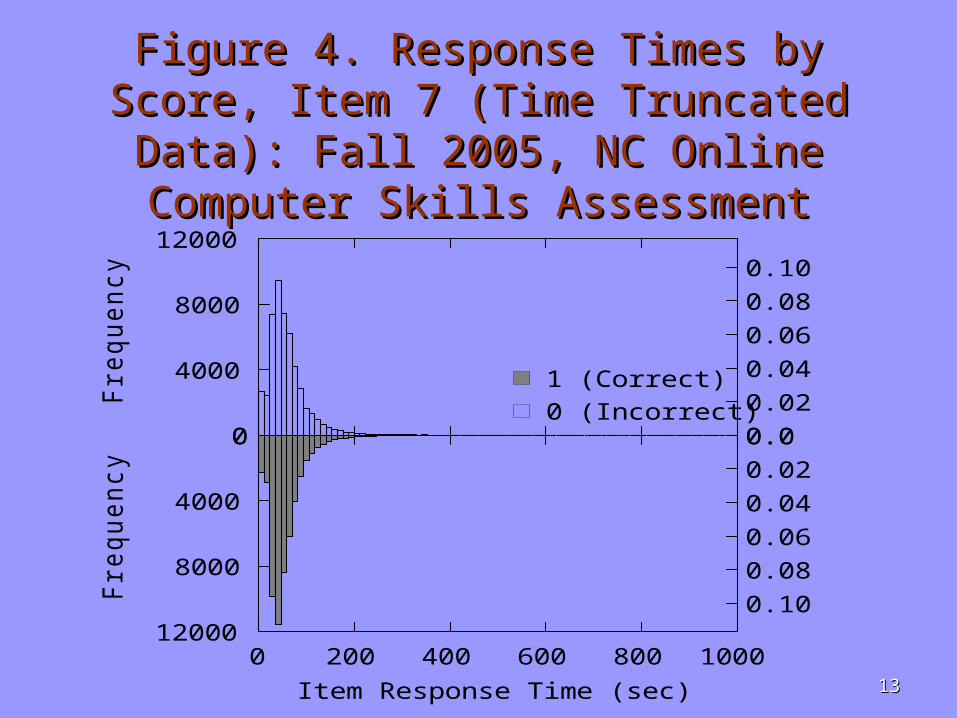
Figure 4. Response Times by Score, Figure 4. Response Times by Score, Item 7 (Time Truncated Data): Fall Item 7 (Time Truncated Data): Fall 2005, NC Online Computer Skills 2005, NC Online Computer Skills
AssessmentAssessment
0
4000
8000
12000
Fre
qu
en
cy
0.00.020.040.060.080.10
Pro
po
rtion
pe
r Ba
r
0 200 400 600 800 1000Item Response Time (sec)
0
4000
8000
12000
Fre
qu
en
cy 0.0
0.020.040.060.080.10
Pro
po
rtion
pe
r Ba
r
0 (Incorrect)1 (Correct)

1414
Figure 5. Response Times by Score, Figure 5. Response Times by Score, Item 9 (Time Truncated Data): Fall Item 9 (Time Truncated Data): Fall 2005, NC Online Computer Skills 2005, NC Online Computer Skills
AssessmentAssessment
02000400060008000
100001200014000
Fre
qu
en
cy
0.00.020.040.060.080.100.12
Pro
po
rtion
pe
r Ba
r
0 200 400 600 800 1000Item Response Time (sec)
02000400060008000
100001200014000
Fre
qu
en
cy 0.0
0.020.040.060.080.100.12
Pro
po
rtion
pe
r Ba
r
0 (Incorrect)1 (Correct)

1515
Figure 6. Response Times by Score, Figure 6. Response Times by Score, Item 14 (Time Truncated Data): Fall Item 14 (Time Truncated Data): Fall
2005, NC Online Computer Skills 2005, NC Online Computer Skills AssessmentAssessment
0
2600
5200
7800
10400
13000
Fre
qu
en
cy
0.00.020.040.060.080.100.12
Pro
po
rtion
pe
r Ba
r
0 200 400 600 800 1000Item Response Time (sec)
0
2600
5200
7800
10400
13000
Fre
qu
en
cy 0.0
0.020.040.060.080.100.12
Pro
po
rtion
pe
r Ba
r
0 (Incorrect)1 (Correct)

1616
Figure 7. Response Times by Score, Figure 7. Response Times by Score, Item 23 (Time Truncated Data): Fall Item 23 (Time Truncated Data): Fall
2005, Online Computer Skills 2005, Online Computer Skills
AssessmentAssessment
0
10000
20000
30000
Fre
quency
0.0
0.1
0.2
Pro
portio
n p
er B
ar
0 200 400 600 800 1000Item Response Time (sec)
0
10000
20000
30000
Fre
quency 0.0
0.1
0.2
Pro
portio
n p
er B
ar
0 (Incorrect)1 (Correct)

1717
Figure 8. Response Times by Score, Figure 8. Response Times by Score, Item 45 (Time Truncated Data): Fall Item 45 (Time Truncated Data): Fall
2005, NC Online Computer Skills 2005, NC Online Computer Skills
AssessmentAssessment
0
5000
10000
15000
20000
Fre
quency
0.0
0.1
0.2
Pro
portio
n p
er B
ar
0 200 400 600 800 1000Item Response Time (sec)
0
5000
10000
15000
20000
Fre
quency 0.0
0.1
0.2
Pro
portio
n p
er B
ar
0 (Incorrect)1 (Correct)

1818
A Relationship between Error andA Relationship between Error andResponse Time?Response Time?
Variability in item error when estimating probability of a correct response.
A
Item #1: Components of Potential Interest
Variability in item response time.
B

1919
Non-zero Correlation between Error Non-zero Correlation between Error and Response Timeand Response Time
A: Variance in Item Residual ErrorB: Variance in Item Response Time
Intersection: Portion of A explained by B – quantified by a “semi-partial correlation”
A B
2020
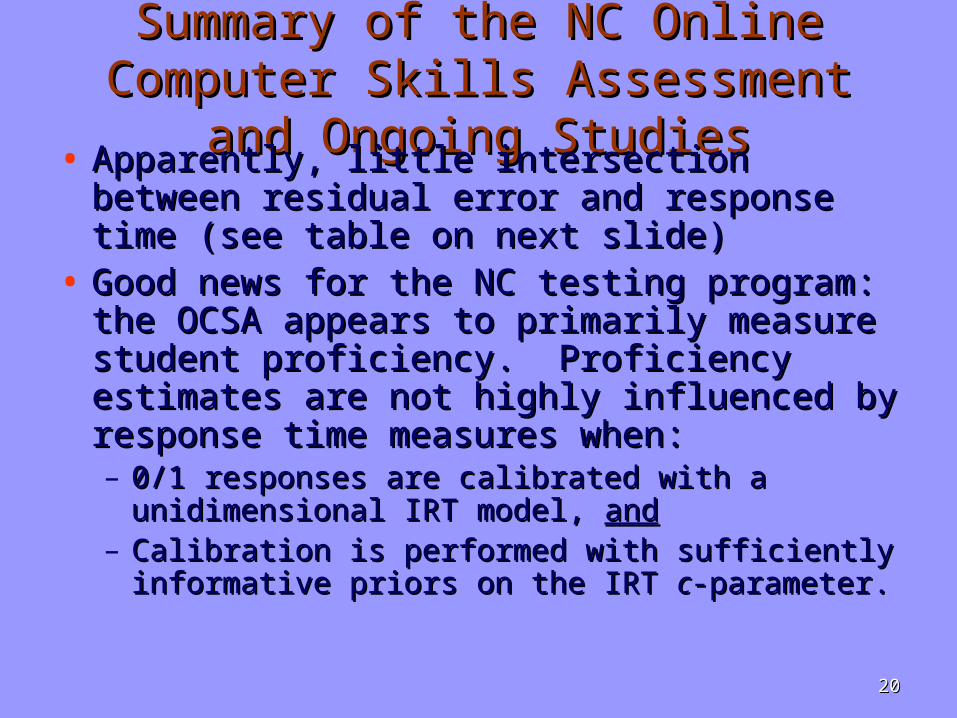
Summary of the NC Online Summary of the NC Online Computer Skills Assessment and Computer Skills Assessment and
Ongoing StudiesOngoing Studies• Apparently, little intersection between Apparently, little intersection between residual error and response time (see residual error and response time (see table on next slide)table on next slide)
• Good news for the NC testing program: Good news for the NC testing program: the OCSA appears to primarily measure the OCSA appears to primarily measure student proficiency. Proficiency estimates student proficiency. Proficiency estimates are not highly influenced by response time are not highly influenced by response time measures when:measures when:– 0/1 responses are calibrated with a 0/1 responses are calibrated with a
unidimensional IRT model, unidimensional IRT model, andand– Calibration is performed with sufficiently Calibration is performed with sufficiently
informative priors on the IRT informative priors on the IRT cc-parameter.-parameter.

2121
Correlations expressing relationships Correlations expressing relationships between residual errors and item between residual errors and item
response timesresponse times
1 -0.098 0.01 0.952 -0.18 0.033 3.253 -0.013 <0.001 0.024 -0.134 0.018 1.815 -0.075 0.006 0.576 -0.117 0.014 1.377 -0.075 0.006 0.578 -0.143 0.02 2.039 -0.23 0.053 5.2810 -0.084 0.007 0.7111 -0.058 0.003 0.3412 -0.057 0.003 0.3313 0.031 0.001 0.114 0.035 0.001 0.1215 0.064 0.004 0.4116 -0.152 0.023 2.317 -0.079 0.006 0.6318 -0.054 0.003 0.2919 -0.076 0.006 0.5720 -0.007 <0.001 0.01
Note: Rounding was performed after calculating to full precision. RT = Item Response Time.
Semipartial Correlation (reij.tij )
Table 20. Semipartial Correlation Coefficients (reij.tij)First 20 Items from Fall 2005 Administration of NC
Online Computer Skills Assessment
Item
Squared Semipartial Correlation
Percent of Variance

2222
Ongoing StudiesOngoing Studies
• Simulation studies are being Simulation studies are being conducted to see if this intersection conducted to see if this intersection can be detected, and under what can be detected, and under what circumstances. Whether possible circumstances. Whether possible intersections impact estimates of intersections impact estimates of student proficiency as shown by bias student proficiency as shown by bias and RMSE statistics is also being and RMSE statistics is also being studied.studied.

2323
Selected ReferencesSelected References• Lord, F.M. (1980). Lord, F.M. (1980). Applications of Item Response Theory to Practical Applications of Item Response Theory to Practical
Testing Problems.Testing Problems. Hillsdale, NJ: Lawrence Erlbaum Associates, Inc. Hillsdale, NJ: Lawrence Erlbaum Associates, Inc.
• Luecht, R.M. (2008). MIRTGEN 2.0 with Response Times. Greensboro NC: Luecht, R.M. (2008). MIRTGEN 2.0 with Response Times. Greensboro NC: University of North Carolina at Greensboro. University of North Carolina at Greensboro.
• North Carolina Department of Public Instruction. (2008). Test of computer North Carolina Department of Public Instruction. (2008). Test of computer skills (Graduation – Requirement) [Electronic Version]. Retrieved skills (Graduation – Requirement) [Electronic Version]. Retrieved September 12, 2008 fromSeptember 12, 2008 from http://www.dpi.state.nc.us/accountability/testing/computerskills/http://www.dpi.state.nc.us/accountability/testing/computerskills/
• Thissen, D. (1983). Timed testing: An approach using item response Thissen, D. (1983). Timed testing: An approach using item response theory. In D.J. Weiss (ed.), theory. In D.J. Weiss (ed.), New Horizons in Testing: Latent Trait Test New Horizons in Testing: Latent Trait Test Theory and Computerized Adaptive Testing.Theory and Computerized Adaptive Testing. New York, NY: Academic New York, NY: Academic Press.Press.
• van der Linden, W.J. (2006). A lognormal model for response times on van der Linden, W.J. (2006). A lognormal model for response times on test items. test items. Journal of Educational and Behavioral StatisticsJournal of Educational and Behavioral Statistics, , 3131, 181-204., 181-204.
• Wise, S.L., & Kong, X. (2005). Response time effort: A new measure of Wise, S.L., & Kong, X. (2005). Response time effort: A new measure of examinee motivation in computer-based tests. examinee motivation in computer-based tests. Applied Measurement in Applied Measurement in Education, Education, 1818,, 163-183. 163-183.

2424
AcknowledgementsAcknowledgements
Many thanks are owed to many people. Here are a Many thanks are owed to many people. Here are a few:few:
Dr. Ric Luecht (UNCG, ERM)Dr. Ric Luecht (UNCG, ERM)Dr. Terry Ackerman (UNCG, ERM)Dr. Terry Ackerman (UNCG, ERM)
Dr. Lou Fabrizio (NCDPI, Accountability Services)Dr. Lou Fabrizio (NCDPI, Accountability Services)Dr. Gary Williamson (NCDPI, Accountability Services)Dr. Gary Williamson (NCDPI, Accountability Services)Dr. Laura Kramer (NCDPI, Test Development)Dr. Laura Kramer (NCDPI, Test Development)
Dr. Wim van der Linden (U. Twente)Dr. Wim van der Linden (U. Twente)