The Normal Density Curve - University of...
8
The Normal Density Curve April 25, 2012 Smooth Curves. Density Curves. Normal Density Curve. Standard Scores. 1.0 Smooth Curves We can use curves in place of histograms to picture the overall shape of a distribution of data.
Transcript of The Normal Density Curve - University of...

The Normal Density Curve
April 25, 2012
Smooth Curves.
Density Curves.
Normal Density Curve.
Standard Scores.
1.0 Smooth Curves
We can use curves in place of histograms to picture theoverall shape of a distribution of data.

1.0 Smooth Curves
For the sampling data of 1,000 p-hat values, the curve issymmetric, single peaked and bell shaped.
1.0 Smooth Curves
It is a mathematical fact that the distribution of p-hatfollows a specific kind of curve called the normal curve.

2.0 Density Curves
Density CurvesA density curve is a theoretical curve that describes thedistribution of a continuous variable.
Density curves versus frequency histograms:
Frequency histograms are a plot of thedata obtained from a sample.
Frequency histograms show the countof observations in each bin.
Density curves are theidealized shape of thepopulation distribution.
Density curves are set upto show the proportionof observations in anyregion by areas underthe curve.
2.1 Using a Density Curve
The area of the shaded bars of the histogram on the leftis the percentage of p-hat that were larger than 0.51.The shaded area under the normal curve provides avery good approximation.

3.0 The Normal Density Curve
DefinitionThe normal curves are a family of symmetric, single-peakedbell-shaped density curves.
Mean
Standard Deviation
3.1 Properties of the Normal Curve
A specific normal curve is completely described by givingits mean and its standard deviation.
The mean and the median equal each other.
The standard deviation fixes the spread of the curve.

4.0 Finding Areas Under the Normal
Curve
The S.A.T. exams are scaled so that scores should roughlyfollow the Normal density curve with mean 500 and S.D. 100.
What proportion of scores fall below 500?
What proportion of scores fall between 400 and 600?
4.1 Standard Scores
The first step in finding any area under a Normal densitycurve is to convert the observation into its standard score.
DefinitionThe standard score for any observation is
standard score =observation - mean
standard deviation
For the S.A.T. data, convert the following into theirstandard scores: 500, 400, 600.

4.2 Aside
The area between two standard scores for a Normaldensity curve is the same, no matter what the mean andstandard deviation of the original Normal curve are.
This area has been tabulated for many different standardscores and can be found in Table B.
4.2 Using Table B
The second step is to consult Table B for the area.
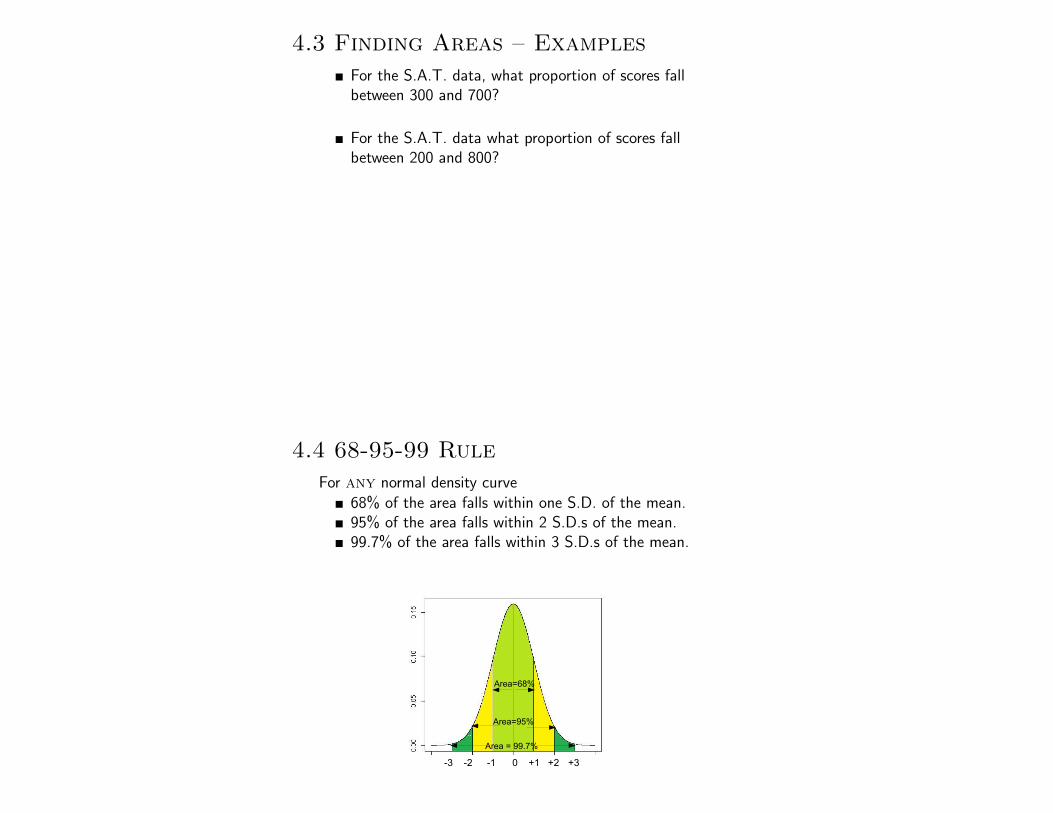
4.3 Finding Areas – Examples
For the S.A.T. data, what proportion of scores fallbetween 300 and 700?
For the S.A.T. data what proportion of scores fallbetween 200 and 800?
4.4 68-95-99 Rule
For any normal density curve68% of the area falls within one S.D. of the mean.95% of the area falls within 2 S.D.s of the mean.99.7% of the area falls within 3 S.D.s of the mean.
Area=68%
Area=95%
Area = 99.7%
0-1-2-3 +1 +2 +3

5.0 More on Standard Scores
Standard scores are also called z-scores or standard units.
Standard scores should only be used for density curveswhere the S.D. is used to describe the spread.
They can be used to compare values in two differentdistributions.
The S.A.T.s are scaled to have a Normal distribution withmean 500 and S.D. 100. The A.C.T.s are scaled to have amean of 18 and S.D. of 6. Student “X” scores 600 on theS.A.T.s. Student “Y” scores 21 on the A.C.T.s. Who doesbetter (relatively speaking)?