
The Norfolk Arthritis Register Alan Silman arc Epidemiology Unit University of Manchester UK.
69
The Norfolk Arthritis The Norfolk Arthritis Register Register Alan Silman Alan Silman arc Epidemiology arc Epidemiology Unit University of Unit University of Manchester UK Manchester UK
-
Upload
nelson-mckinney -
Category
Documents
-
view
215 -
download
0
Transcript of The Norfolk Arthritis Register Alan Silman arc Epidemiology Unit University of Manchester UK.

The Norfolk Arthritis RegisterThe Norfolk Arthritis Register
Alan SilmanAlan Silman
arc Epidemiology Unit arc Epidemiology Unit
University of University of
Manchester UKManchester UK

Manchester
The Norfolk Arthritis The Norfolk Arthritis RegisterRegister
A primary care based A primary care based
inception cohort study of inception cohort study of
patients with inflammatory patients with inflammatory polyarthritispolyarthritis

Norfolk

Why Norfolk?Why Norfolk?
Geographically ‘isolated’Geographically ‘isolated’ Stable populationStable population Single central major hospitalSingle central major hospital Excellent links primary to Excellent links primary to
secondary caresecondary care Local enthusiasmLocal enthusiasm
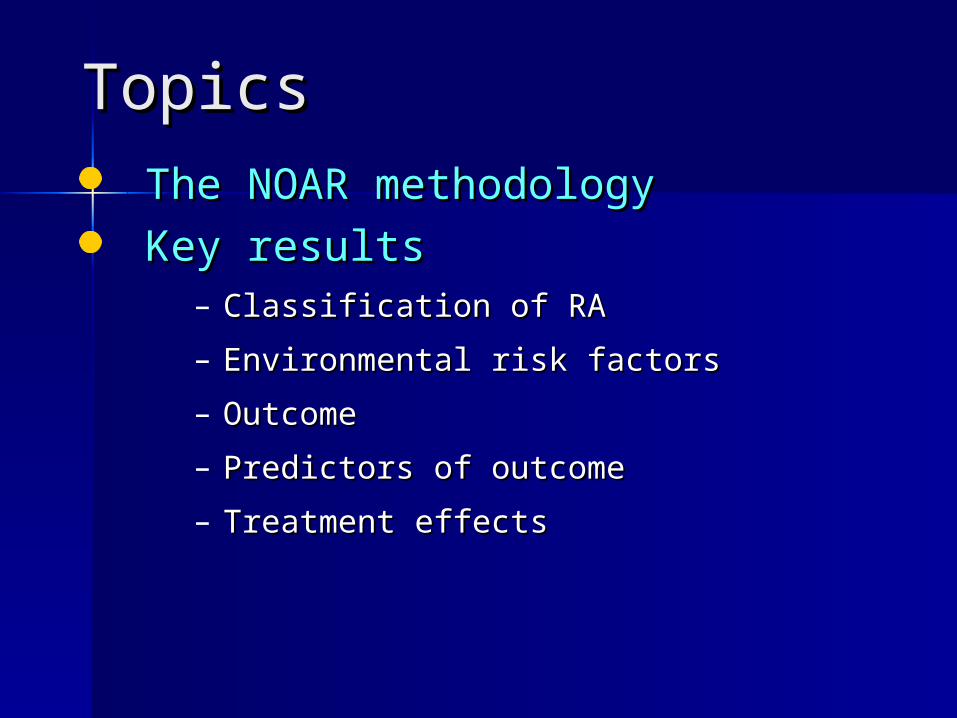
TopicsTopicsThe NOAR methodologyThe NOAR methodology
Key resultsKey results– Classification of RAClassification of RA
– Environmental risk factorsEnvironmental risk factors
– OutcomeOutcome
– Predictors of outcomePredictors of outcome
– Treatment effectsTreatment effects

Manchester
Norwich
NOAR : Recruitment
Entry criteria- age > 16 years- registered with local GP- swelling of > 2 joints- duration > 4 weeks- onset since 1/1/90
Metrology assessment
Apply ACR criteria

Metrologist AssessmentMetrologist Assessment

Data CollectedData Collected
(())------(())(())--X-raysX-rays
------(())(())Blood testsBlood tests
----------Pain scorePain score
------------SF36SF36
HAQHAQ
- - - deformity- deformity
----- - - activity- activity
ManikinManikin
DrugsDrugs
Co-morbidityCo-morbidity
ReproductiveReproductive
OccupationOccupation
101077554433221100
AnniversaryAnniversary

The Norfolk Arthritis Register (NOAR)
To establish the incidence of IP and subset with RA
To identify risk factors for the development of IP and RA
To study the natural history of treated IP and RA
To identify predictors of outcome in IP and RA
Initial aims

The Norfolk Arthritis Register (NOAR)
To investigate the epidemiology of cardiovascular disease in patients with IP (risk factors, incidence and outcome)
To identify predictors of treatment response and non-response
Current Major Aims

Key resultsKey results
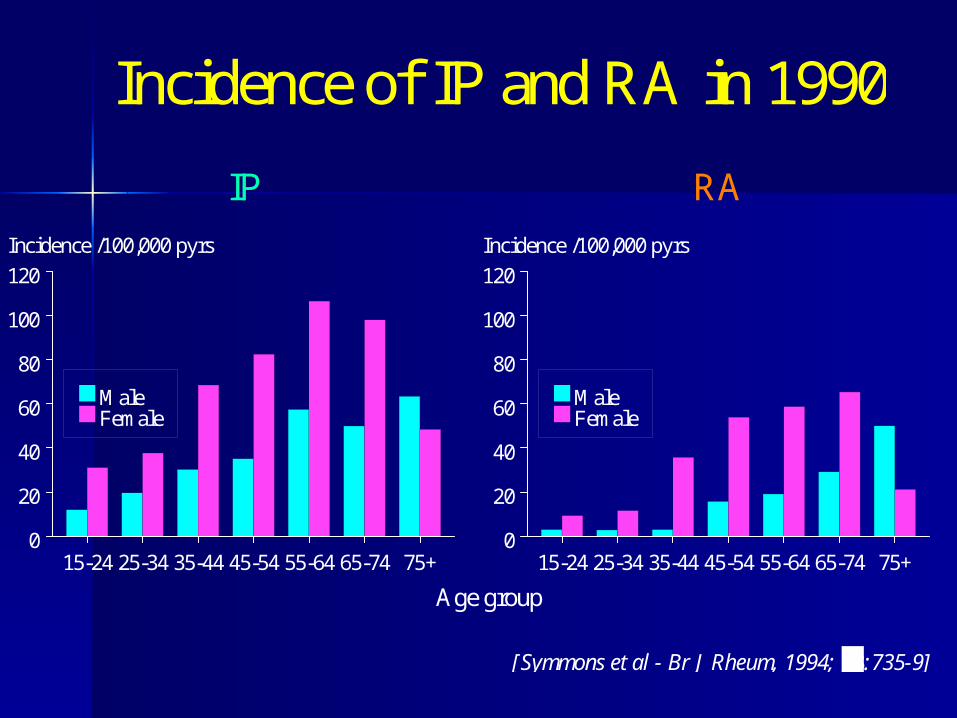
Incidence of IP Incidence of IP and RAand RA
15-24 25-34 35-44 45-54 55-64 65-74 75+0
20
40
60
80
100
120
Incidence /100,000 pyrs
MaleFemale
[Symmons et al - Br J Rheum, 1994; 33:735-9]
Age group
IP RA
15-24 25-34 35-44 45-54 55-64 65-74 75+0
20
40
60
80
100
120
Incidence /100,000 pyrs
MaleFemale
Incidence of IP and RA in 1990
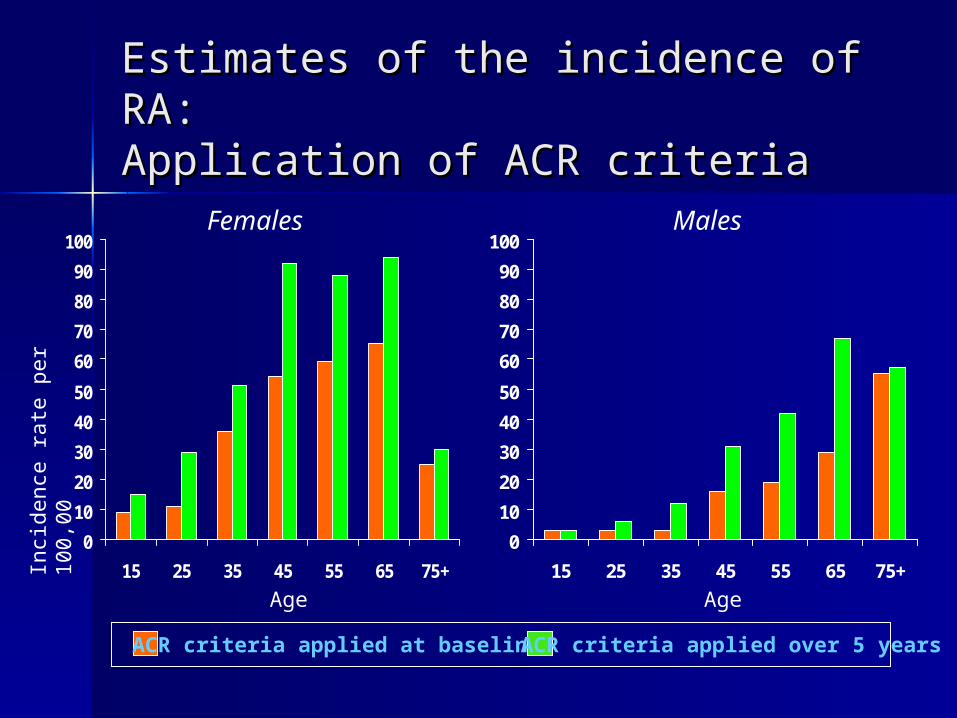
Estimates of the incidence of RA:Estimates of the incidence of RA:Application of ACR criteriaApplication of ACR criteria
0
10
20
30
40
50
60
70
80
90
100
15 25 35 45 55 65 75+
0
10
20
30
40
50
60
70
80
90
100
15 25 35 45 55 65 75+
Inci
denc
e ra
te p
er
100,
00
Females Males
ACR criteria applied at baseline ACR criteria applied over 5 years
Age Age
Issues of ClassificationIssues of Classification
IP vs RAIP vs RA

ConceptConcept
Early IPEarly IP
Recovery
Another disease
Established Established RARA

ConceptConcept
Early IPEarly IP
Recovery
Another disease
? Treatment
Established Established RARA

Does early RA Does early RA exist?exist?
Are there differences between IP Are there differences between IP destined to differentiate into RA and destined to differentiate into RA and other ‘causes’ of IP?other ‘causes’ of IP?
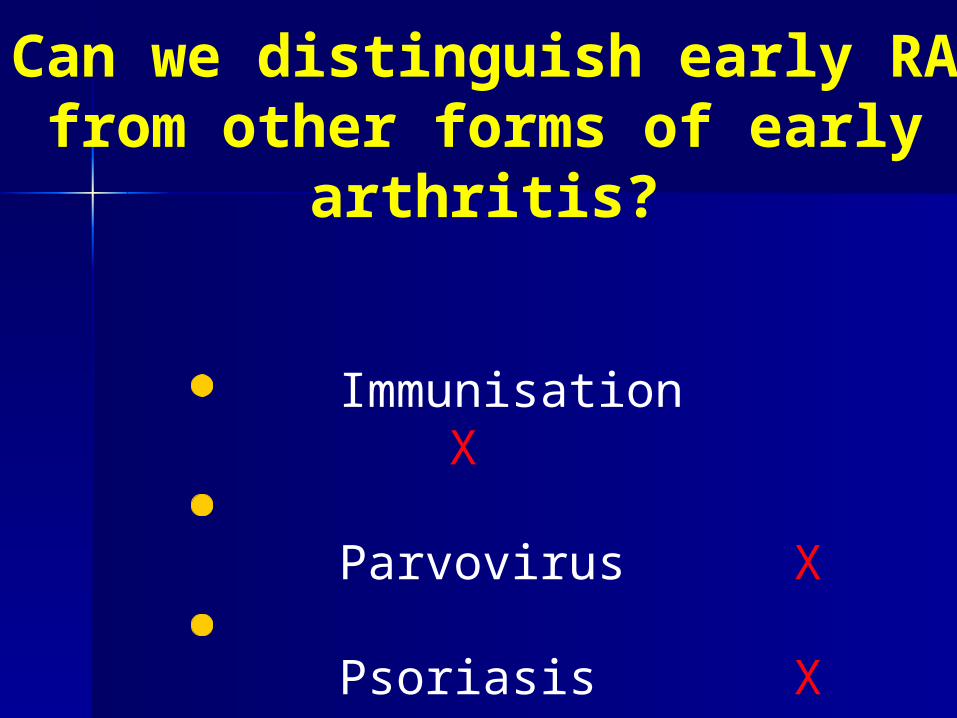
Immunisation X
Parvovirus X
Psoriasis X
Can we distinguish early RAfrom other forms of early
arthritis?

Leiden model: Leiden model: prediction of outcomeprediction of outcomeGoal:Goal:To discriminate at first visit To discriminate at first visit
between patients who will go between patients who will go on to have:on to have:
self-limiting arthritisself-limiting arthritis persistent non-erosive persistent non-erosive
arthritisarthritis persistent erosive arthritispersistent erosive arthritis

Leiden model: 7 variablesLeiden model: 7 variables
Symptom duration at presentationSymptom duration at presentation
Morning stiffness > 1 hourMorning stiffness > 1 hour
Arthritis of > 3 jointsArthritis of > 3 joints
Bilateral compression pain of MTPsBilateral compression pain of MTPs
Rheumatoid factorRheumatoid factor
Anti-cyclic citrullinated peptide Anti-cyclic citrullinated peptide antibodyantibody
Erosions in hands or feetErosions in hands or feet

Validation of Leiden Validation of Leiden modelmodelerosive vs non-erosive erosive vs non-erosive arthritisarthritis In presence of persistenceIn presence of persistence
Radiological criterion omittedRadiological criterion omitted
LeidenLeiden NOARNOAR(n= 526)(n= 526) (n=486)(n=486)
Prediction model ROCPrediction model ROC 0.830.83 0.760.76
ACR criteria ROCACR criteria ROC 0.770.77 0.660.66

Key resultsKey results
Risk factors for the Risk factors for the development of IP development of IP and RAand RA

Sources of DataSources of Data
Descriptive AnalysisDescriptive Analysis

Local Clustering of RALocal Clustering of RA
Silman et al., 1999
Jan1990
June Jan1991
June Jan1992
June
25
20
15
10
5
0
30
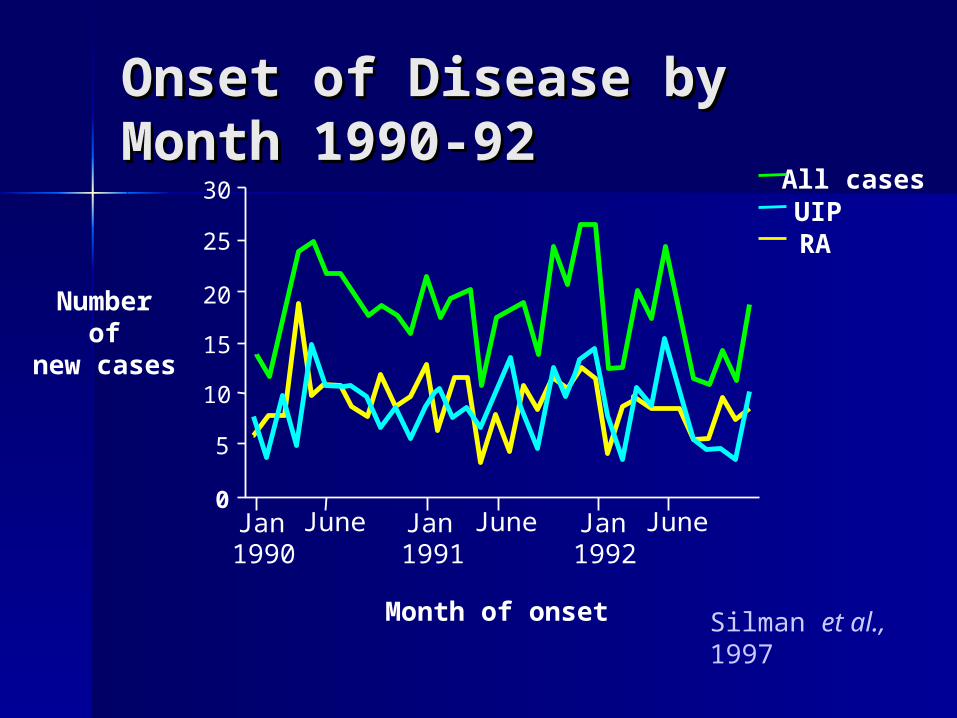
Month of onset
Number of
new cases
All casesUIPRA
Onset of Disease by Onset of Disease by Month 1990-92Month 1990-92
Silman et al., 1997

Observed & Expected Observed & Expected Events in Relation to Events in Relation to Time & DistanceTime & Distance
Silman et al., 1997
0
-5e7
-1e8
400300
200100
D
Time 5001000
1500
Distance
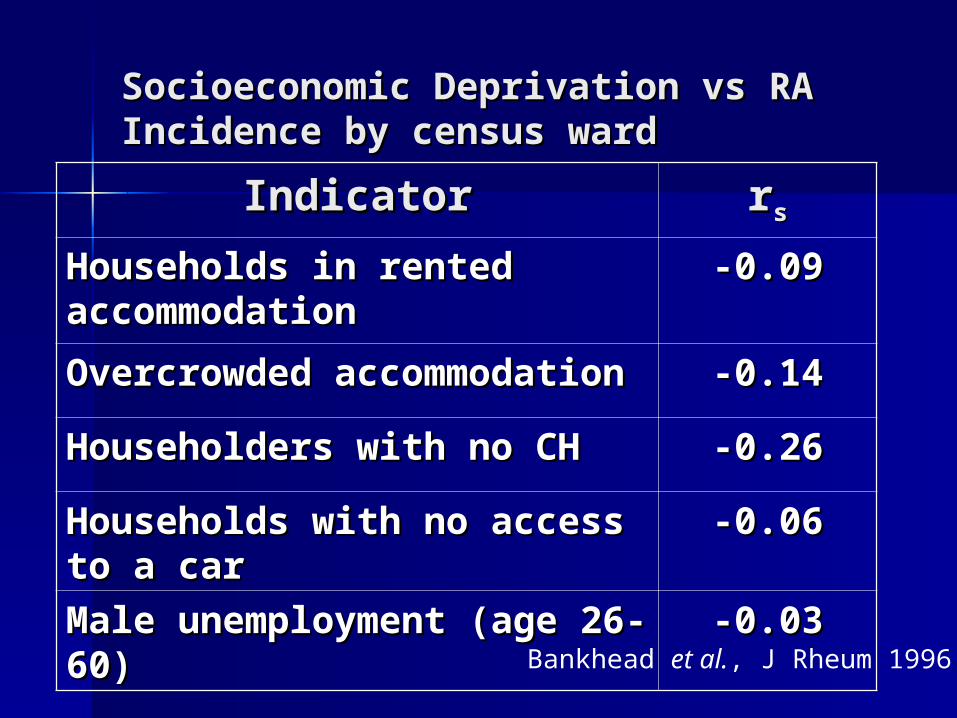
Socioeconomic Deprivation vs RA Socioeconomic Deprivation vs RA Incidence by census wardIncidence by census ward
Bankhead et al., J Rheum 1996
IndicatorIndicator rrss
Households in rented Households in rented accommodationaccommodation
-0.09-0.09
Overcrowded Overcrowded accommodationaccommodation
-0.14-0.14
Householders with no CHHouseholders with no CH -0.26-0.26
Households with no access Households with no access to a carto a car
-0.06-0.06
Male unemployment (age Male unemployment (age 26-60)26-60)
-0.03-0.03

Socioeconomic Deprivation & Socioeconomic Deprivation & RARA
Bankhead et al., J Rheum 1996
0
10
20
30
40
50
I & II IIIN IIIM IV V
Men
Women
Social Class
Incidence/100,000
* IV & V combined for men
*
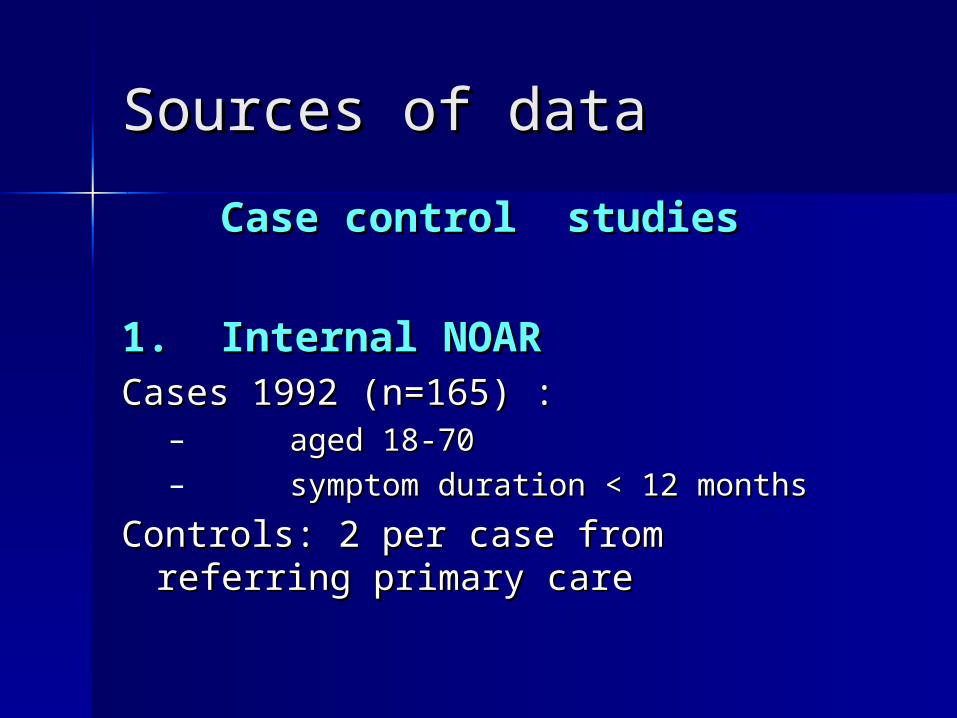
Sources of dataSources of data
Case control studiesCase control studies
1. Internal NOAR1. Internal NOARCases 1992 (n=165) : Cases 1992 (n=165) :
– aged 18-70aged 18-70– symptom duration < 12 monthssymptom duration < 12 months
Controls: 2 per case from referring Controls: 2 per case from referring primary careprimary care

Lifestyle Factors
SmokingObesity
20
10
5
4
3
2
1

Association of Smoking with Association of Smoking with Severe RA: Rheumatoid NodulesSevere RA: Rheumatoid Nodules
CurrentExNever
20
10
4
2
1
0.4
Harrison Harrison et al.et al., Arth Rheum 2003, Arth Rheum 2003
Odds Ratio(95% CI)

Hormonal Risk Factors
TerminationOral ContraceptiveMiscarriage
8
6
4
2
1.8
.6
.4
.2
.1

Symmons et al., 1997
Cases Controls0
5
10
15
20
%
Association between Association between Prior Blood Transfusion Prior Blood Transfusion and RAand RA

2. 2. NOAR EPIC LinkNOAR EPIC Link

Co-occurrence of NOAR & EPICCo-occurrence of NOAR & EPIC in same population in same population
Area for new cases of IP referred to NOAR
EPIC
practices

European Prospective study of the Incidence of Cancer (EPIC-Norfolk)
Baseline assessmentsBaseline assessments
Random sample (n= 25,000)Random sample (n= 25,000)
45 – 75 years45 – 75 years
Recruited 1993 – 1997Recruited 1993 – 1997
Health and lifestyle questionnaireHealth and lifestyle questionnaire
Height and weightHeight and weight

Prospective ‘nested’ case Prospective ‘nested’ case control studycontrol study
Free of IP at Free of IP at baselinebaseline
Subsequent Subsequent registration with registration with NOARNOAR
2 per case2 per case
Matched:Matched:- age (- age (± 3 years)± 3 years)
- - gendergender- - within 3 months ofwithin 3 months of
baseline assessmentbaseline assessment
73 Cases Controls

EPIC Diet SurveyEPIC Diet Survey
7 day detailed food diary with 7 day detailed food diary with portion sizesportion sizes
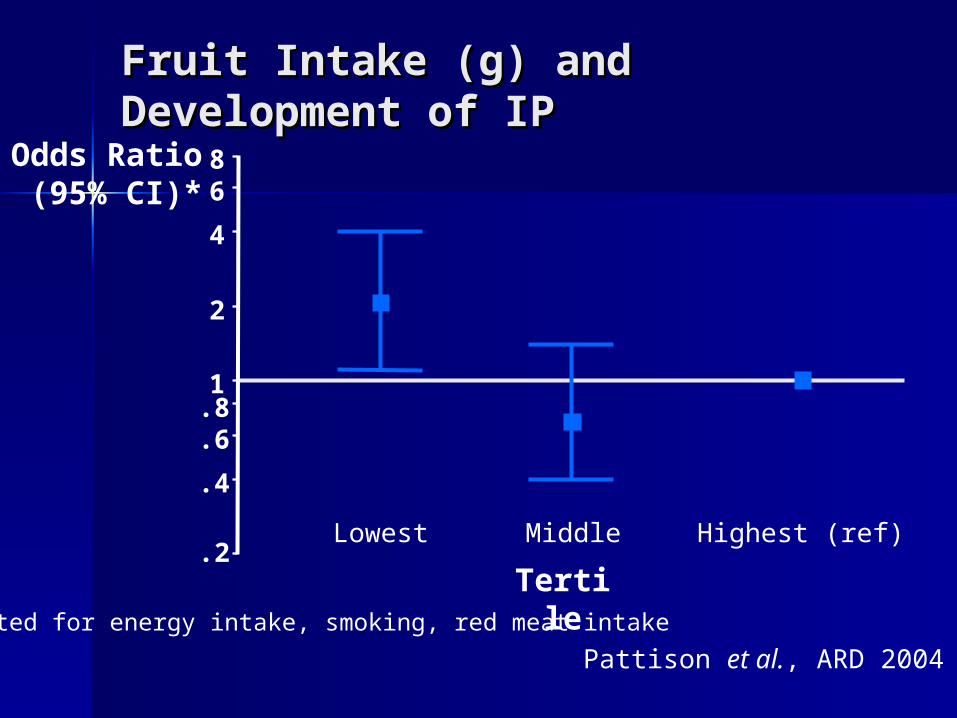
Fruit Intake (g) and Fruit Intake (g) and Development of IPDevelopment of IP
Highest (ref)MiddleLowest
86
4
2
1.8.6
.4
.2
*Adjusted for energy intake, smoking, red meat intake
Odds Ratio (95% CI)*
Pattison et al., ARD 2004
Tertile

Tertiles of Vitamin C Intake (mg)Tertiles of Vitamin C Intake (mg)
Highest (ref)MiddleLowest
86
4
2
1.8.6
.4
.2
*Adjusted for energy intake, smoking, protein intake
Pattison et al., ARD 2004
Odds Ratio
(95% CI)*
Tertile

Tertiles of Tertiles of -cryptoxanthin Intake -cryptoxanthin Intake (µg)(µg)
HighestMiddleLowest (ref)
3
2
1
.5
.3
.2
.1
Odds Ratio
(95% CI)*
*Adjusted for energy intake, smoking, protein intake
Pattison et al. 2005
Tertile
HighestMiddleLowest (ref)
3
2
1
.7
.5
.3
.2
.1
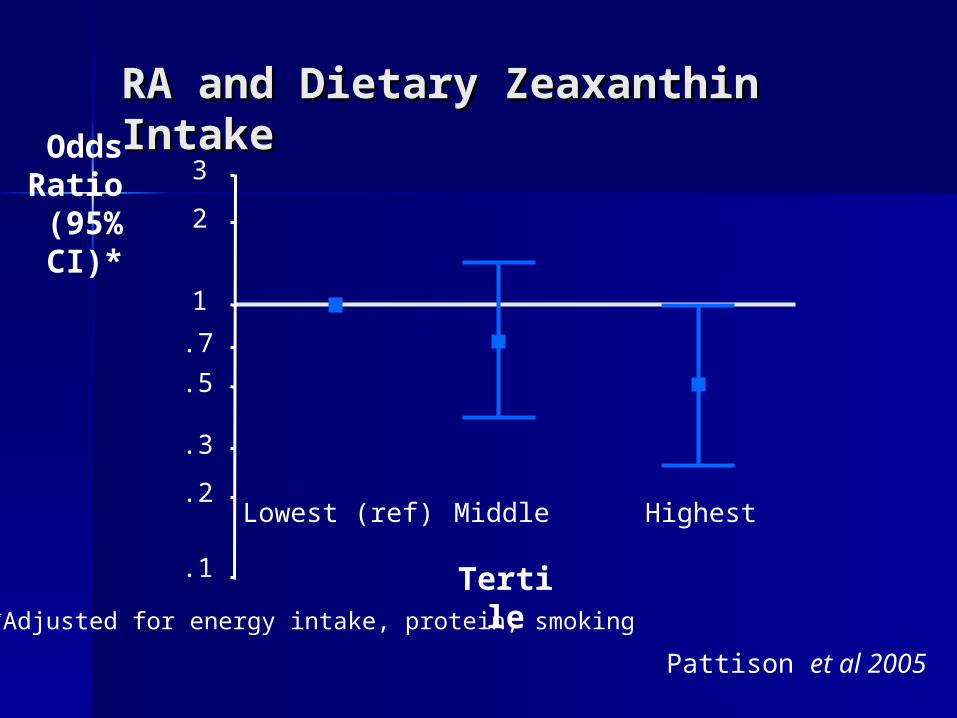
RA and Dietary Zeaxanthin RA and Dietary Zeaxanthin IntakeIntakeOdds
Ratio (95% CI)*
*Adjusted for energy intake, protein, smoking
Pattison et al 2005
Tertile
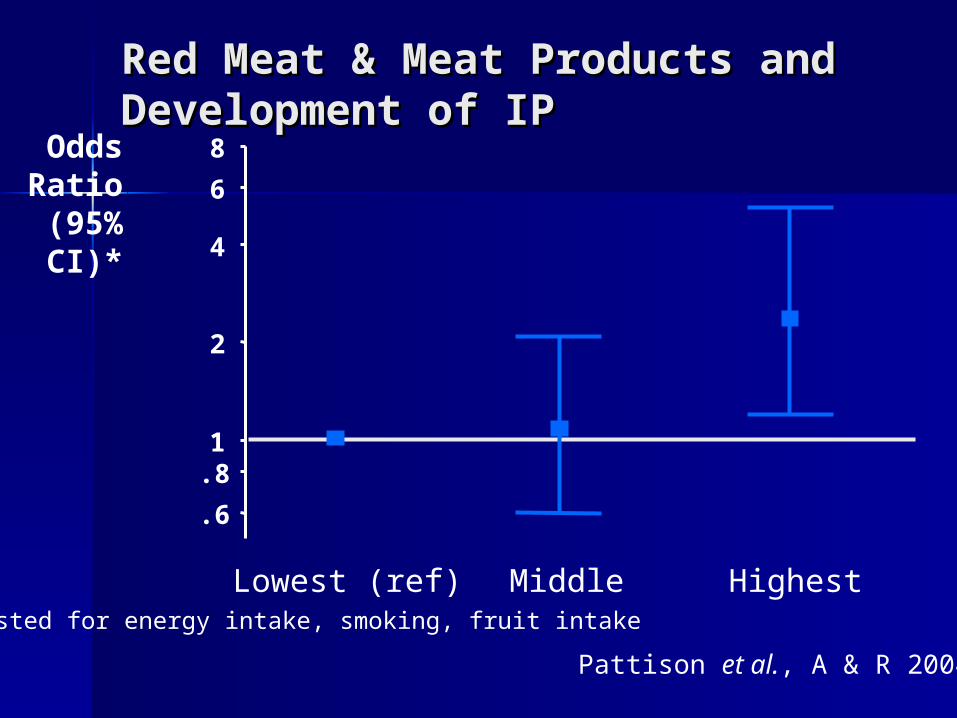
Red Meat & Meat Products and Red Meat & Meat Products and Development of IPDevelopment of IP
*Adjusted for energy intake, smoking, fruit intake
MiddleLowest (ref) Highest
8
6
4
2
1.8
.6
Pattison et al., A & R 2004
Odds Ratio
(95% CI)*
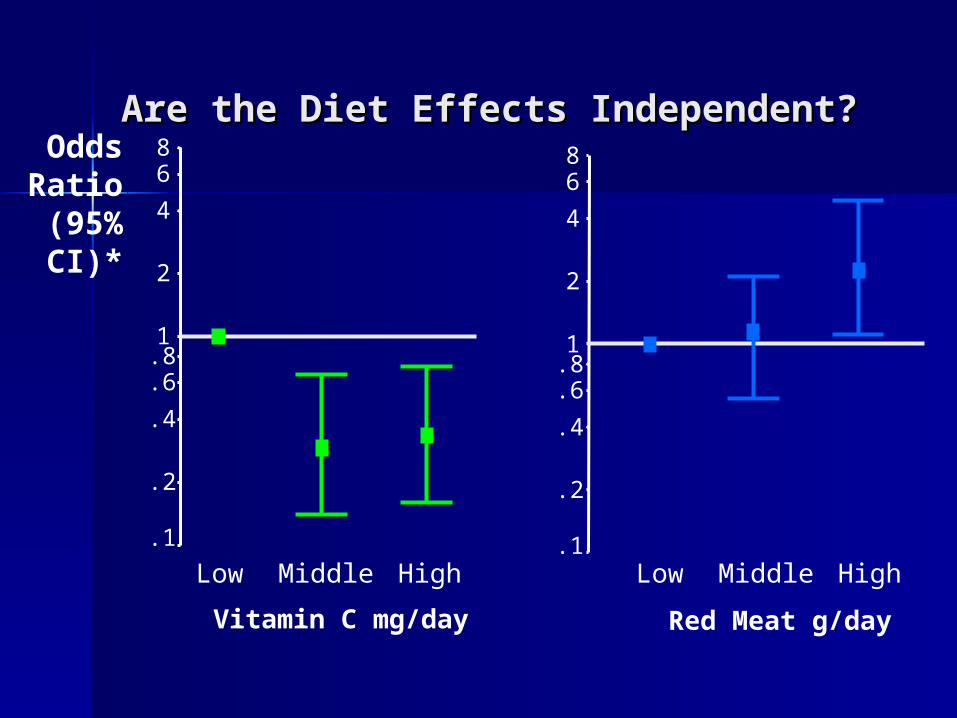
Are the Diet Effects Independent?Are the Diet Effects Independent?
Vitamin C mg/day
HighMiddleLow
86
4
2
1.8.6
.4
.2
.1
Red Meat g/day
HighMiddleLow
86
4
2
1.8.6
.4
.2
.1
Odds Ratio
(95% CI)*
Key resultsKey results
The natural The natural history of history of
treated IP and RAtreated IP and RA

Outcomes investigated
Persistence Radiological damage
Physical function (HAQ) Economic costs
Health status (SF-36) Co-morbidity
Work disability Mortality

Work disabilityWork disability
Year of onset
0
5
10
15
20
25
30
35
Oneyear
Twoyears
Per
cen
tage
1989-19921994-1997

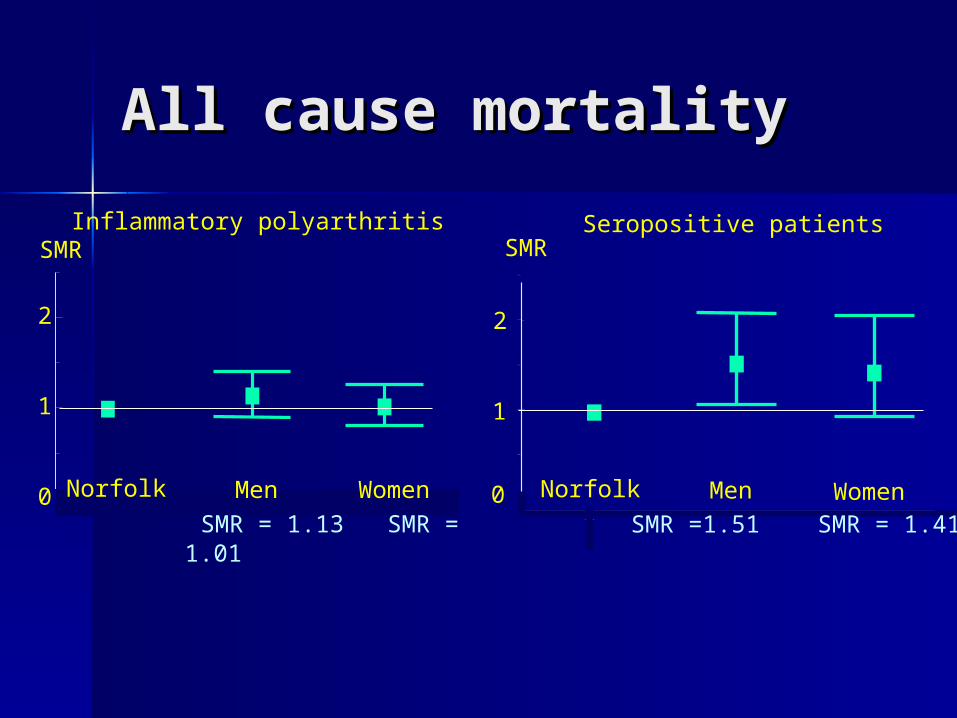
All cause mortalityAll cause mortality
Seropositive patients
Men WomenNorfolk0
1
SMRInflammatory polyarthritis
0
1
2
SMR
Men WomenNorfolk
SMR = 1.13 SMR = 1.01
2
SMR =1.51 SMR = 1.41

Cardiovascular mortality:Cardiovascular mortality:Influence of RF StatusInfluence of RF Status
Males0.5
1
2
3
Females
RF-
SMR(95% CI)
RF+

Key resultsKey results
Predictors of Predictors of outcomeoutcomegeneticgenetic
environmentalenvironmental
treatmenttreatment
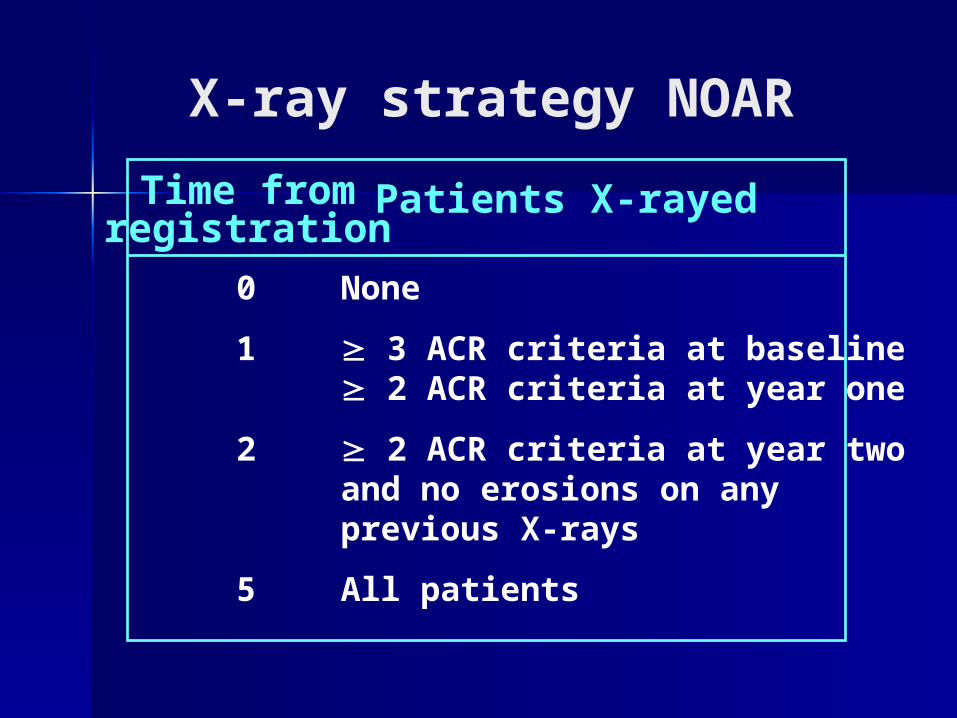
X-ray strategy NOAR
Time fromregistration
Patients X-rayed
0
1
2
5
None
3 ACR criteria at baseline 2 ACR criteria at year one
2 ACR criteria at year two and no erosions on anyprevious X-rays
All patients

Timing of first erosions
Risk set Time of 1st“erosion free”
X-rayMedian (IQR)
Timing of 2ndX-ray
Median (IQR)
% erosiveat 2nd X-ray
Incidence rateof 1st erosions(per 1000 pm)
(95% CI)
1
2
3
4
18 (16-20)
29 (26-31)
41 (37-45)
18 (16-22)
66 (64-69)
69 (66-73)
75 (70-84)
36
23
28
47
24 (21-29)
5 (4-8)
7 (5-10)
13 (9-19)

NOAR: Predicting NOAR: Predicting radiological erosionsradiological erosions
Risk group RF > 40Initial duration > 3 months
Probability of erosions
1
2
3
4
X
X
X
X
0.79
0.52
0.33
0.10
Overall performance: PPV 61% NPV 74%

Role of genetic factorsRole of genetic factors
HLA.DRBIHLA.DRBI CytokineCytokine
– TNFTNF– IL1 etc etcIL1 etc etc
MMPMMP MBLMBL MIFMIF

Weak association with shared Weak association with shared epitope, less strong than in epitope, less strong than in clinic based studiesclinic based studies
Few candidates tested were Few candidates tested were predictors of presence/severity predictors of presence/severity erosionserosions
Genetic Factors

? Confounding effect of ? Confounding effect of therapytherapy

Propensity models
Bias in treatment assignments“Confounding by indication”
Variable duration of exposure to treatment
Problems
Solution
Assessing the effect of treatment

In observational studies :
It is not random who will get DMARD therapy
Treated patients have more severe disease
Therefore ‘bias in allocation’ occurs
Adjustment for this effect is needed

Propensity modelling
Logistic model used to predict treatment decision
Using disease characteristics that inform treatment decision
Each individual given probability of being treated = propensity score
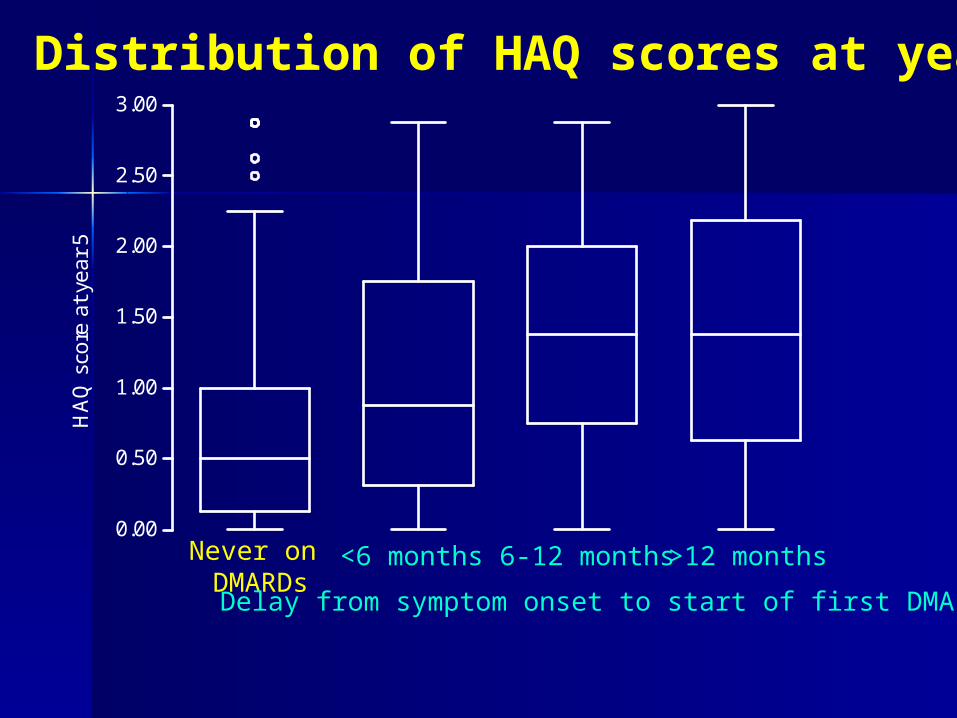
Distribution of HAQ scores at year 5
Never on DMARDs
<6 months 6-12 months >12 months
Delay from symptom onset to start of first DMARD
0.00
0.50
1.00
1.50
2.00
2.50
3.00H
AQ
sco
re a
t ye
ar 5

Odds of moderate disability(HAQ1.0) at 5 years
Delay from onset to start of treatment
Odd
s ra
tio (9
5% C
I)
DMARDs/steroidsMonthsNever on < 6 6-12 > 12
0.5
1
2
5
10
20

Odds of moderate disability (HAQ 1.0) at 5 years(Models include propensity scores & hospital referral)
Delay from onset to start of treatment
Odd
s ra
tio (9
5% C
I)
Never on < 6 6-12 > 120.2
0.3
0.5
1
2
3
5
10
DMARDs/steroidsMonths
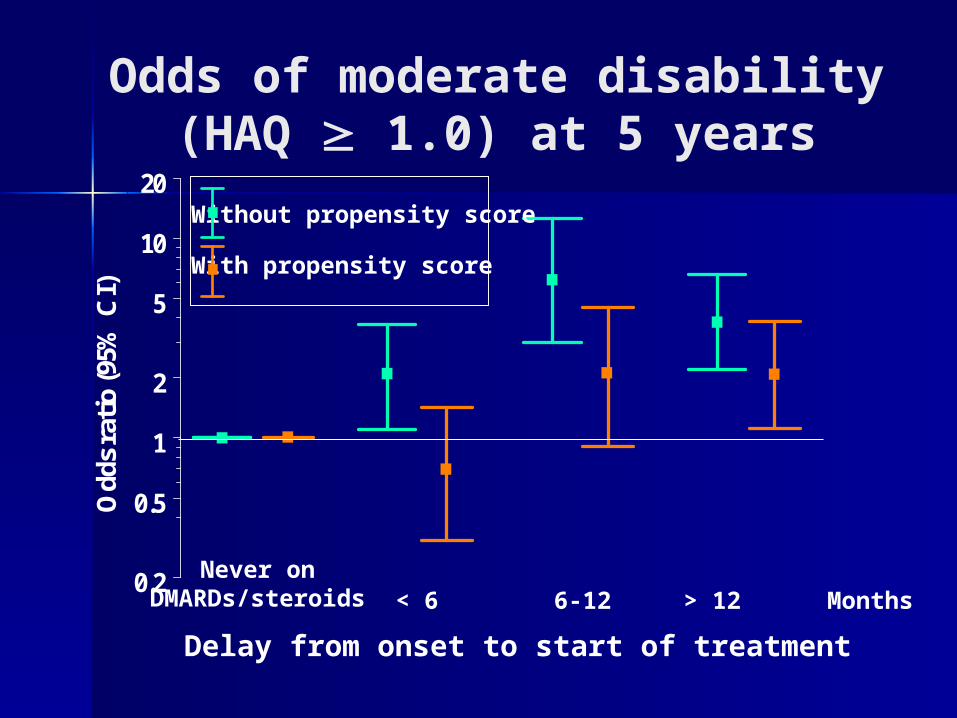
Odds of moderate disability(HAQ 1.0) at 5 years
0.2
0.5
1
2
5
10
20
Odd
s ra
tio
(95%
CI)
Without propensity score
With propensity score
Delay from onset to start of treatment
Never onDMARDs/steroids < 6 6-12 > 12 Months

Larsen score at year 5 adjusted for propensity score
Delay to start of first DMARD
< 6 months 6-12 months > 12 monthsNo Treatment
0.5
1
2
3
0.5
1
2
3

Patients treated with DMARDS had worse disease at presentation and worse outcome
The greatest benefit of treatment was seen in those treated within six months

Jt Principal Investigator : Deborah Symmons
Research Fellows : Marwan Bukhari
Beverley Harrison
Nicola Goodson
Research Assistants : Clare Bankhead
Nicola Wiles
Dorothy Pattison
Statisticians : Paul Brennan
Mark LuntResearch nurses, consultant rheumatologists
Acknowledgements


![Reason for Decision - World Oil Resources Limited [2013] ATP 1 · dated 2 October 2012. Templefield is the trustee of M. Silman Superannuation Fund. Maurice and Judith Silman are](https://static.fdocuments.in/doc/165x107/5e7f5cdf3c5ddf3803231279/reason-for-decision-world-oil-resources-limited-2013-atp-1-dated-2-october-2012.jpg)


