THE NONPROFIT SECTOR IN NOVA SCOTIA
59
THE NONPROFIT SECTOR IN NOVA SCOTIA A Statistical Portrait Report prepared by Imagine Canada for Volunteerism and the Non-Profit Sector Division Department of Labour and Advanced Education Government of Nova Scotia
Transcript of THE NONPROFIT SECTOR IN NOVA SCOTIA

THE NONPROFIT SECTOR IN NOVA SCOTIAA Statistical Portrait
Report prepared by Imagine Canada
forVolunteerism and the Non-Profit Sector DivisionDepartment of Labour and Advanced Education
Government of Nova Scotia

Executive Summary ivSize and Scope of the Core Nonprofit Sector in Nova Scotia........................................................................................ iv
.................................Financial Resources of Core Charities v...........................Paid Human Resources of Core Charities v
............................Supports from Individual Nova Scotians vi.................................................Attitudes about Charities vii
Introduction 1....................................................................Data Sources 1
.................Report Scope and Definition of the Core Sector 2................................................Organization of the Report 2
1. A Portrait of Core Sector Charities and Nonprofits 4
..................................................Number of Organizations 4...........................................................Financial Resources 5
.............................................................Human Resources 5.....................................................Economic Contribution 6
........................................................Internal Composition 7
2. Financial Resources of Core Charities 10...................................................Distribution of revenue 10
.............................................................Revenue sources 11...................................Dominant Sources of Revenue 12
.......................................Gifts, donations and grants 14..............................................................Government 14
..........................................................Earned income 15.................................................Fundraising Methods 16
.........................................................In-kind Support 18...........................................................Trends in Revenue 19
3. Paid Human Resources of Core Charities 21.................................Paid Human Resources of Charities 21
...........................................................Paid Staff Size 21.................................................Annual Revenue Size 22................................................Organizational Cause 23
.................................................Human Resources Trends 23.........................................Changes in Paid Staff Size 23
............Changes Full-Time vs. Part-time Employment 24
4. Supports from Individuals to Core Charities and Nonprofits 26
.............................................................................Giving 27.........................................Giving and Demographics 28
.............................................Donating by sub-sector 30.............................Motivations and Barriers to Giving 31
....................................................Donation Methods 33.....................................Prior Planning and Donating 35
...................................................................Volunteering 35...............................Demographics and Volunteering 37
........................................Volunteering by sub-sector 37...................Motivations and Barriers to Volunteering 38
The Nonprofit Sector in Nova Scotia: A Statistical Portrait ii
...................................................Volunteer Activities 41...............The Role of Mandatory Community Service 42
5. Attitudes about Charities 43..............................Trust in Charities and Charity Leaders 44
............................................Opinions about Fundraising 45...................................Information Provided by Charities 46
..............Opinions on the Need for Oversight of Charities 47
Appendix A - Classification of Organizational Primary Activity Area and Cause 49
References Cited 51
The Nonprofit Sector in Nova Scotia: A Statistical Portrait iii

EXECUTIVE SUMMARY
Size and Scope of the Core Nonprofit Sector in Nova Scotia
• Currently, the core nonprofit sector is estimated to have
about 5,900 organizations - about two thirds charities and
one third nonprofits.
• Total core nonprofit sector revenues for 2012 are estimated to
be between $1.9 and $2.2 billion.
• The total number of staff positions for 2012 is estimated to
be between 34,400 and 37,400, evenly split between full-
time and part-time positions.
• In 2010, volunteers contributed hours equivalent to 41,000
full-time positions.
• The number of organizations in the core sector has increased
just 4% since 2003. Over the same period, revenues are
estimated to have increased by a third and paid and volunteer
resources (as measured by number of staff positions and
volunteer hours) by about a fifth.
• A group of nonprofits and charities that make up roughly two
thirds of the core sector accounted for approximately 1.7% of
provincial GDP in 2012.
The Nonprofit Sector in Nova Scotia: A Statistical Portrait iv

• Many organizations are small - 45% have annual revenues
less than $30,000 and 51% have no paid staff.
Financial Resources of Core Charities
• Resources are not uniformly distributed across the sector.
Core charities with annual revenues of $1 million or more
accounted for nearly three quarters of total reported
revenues. Similarly, Health and Social Services organizations
represent about one quarter of core charities, but account for
over half of total revenues.
• About three in five core charities depend on gifts, donations
and grants for more than half of their revenues. Just over one
in seven rely primarily on government and one in eight on
earned income. The balance rely on some other source or mix
of sources.
• Reliance on gifts donations and grants is highest among small
charities, while reliance on government is highest among
large charities.
• The vast majority government revenue comes from the
provincial government and the bulk of earned income comes
from the sale of goods and services.
• Since 2003, total revenues reported by core charities have
increased by approximately one third.
Paid Human Resources of Core Charities
• The vast majority of charities draw on small or no paid staff
resources - one third have between one and four paid staff;
half have none at all. Just 1% have 100 or more paid staff.
• Most positions are with larger charities – roughly three
quarters of positions are with the 6% of charities that have
20 or more staff.
• Compared to businesses, charities are more likely to have
between one and four paid staff, but less likely to have
between five and 49 staff.
The Nonprofit Sector in Nova Scotia: A Statistical Portrait v

• Among charities, more positions are among smaller
organizations than with business – organizations with less
than 20 paid staff account for over a quarter of charity
positions, but less than a fifth of business positions.
• Since 2003, reliance on volunteers and part-time paid staff
has increased notably – the percentage of charities with no
paid staff has gone from 44% to 53% and the average
number of part-time positions reported by charities has gone
from 2.6 to 3.8 (the average number of full-time positions
remained constant).
• While the total number of staff positions has increased from
approximately 20,000 to 25,000, nine-tenths of this increase
has been in part-time positions.
Supports from Individual Nova Scotians
• The vast majority of Nova Scotians support core sector
organizations in some way. In 2010, 86% of those aged 15
and over donated and 52% volunteered.
• In 2010, Nova Scotians donated just under $238 million to
core charities and nonprofits and volunteered approximately
78.7 million hours (the equivalent of 41,000 full-time jobs).
• Not all groups of Nova Scotians are equally likely to give and
volunteer for core organizations. Variations in likelihood and
level of support are related to demographic factors such as
age, sex, education level, income, and frequency of religious
attendance.
• In terms of how total support is apportioned across sub-
sectors, giving is far more focused than volunteering. Religion
organizations receive approximately half the total value of
donations. Volunteer hours are much more evenly distributed,
with Social services, Sports & recreation and Religion each
accounting for about a fifth of total hours.
• People are most likely to say that they give and volunteer for
ideological or aspirational reasons and less likely to say they
do so for more self-interested reasons.
The Nonprofit Sector in Nova Scotia: A Statistical Portrait vi

• The most commonly reported barriers to giving and
volunteering are scarcity (i.e., not having the time or money)
and being satisfied with the level of support already offered.
• Typically, the financial role of a given donation method is
driven more by how much people usually give using the
method than by how many people donate using the method.
Attitudes about Charities
• Levels of trust are generally high. 81% of Nova Scotians
report some or a lot of trust in charities and 76% report the
same of charity leaders. Very few institutions and professions
rate more highly.
• Opinions around fundraising are mixed. For example, most
Nova Scotians believe charities are generally honest about
how they use donations, but only a third believe charities only
ask for money when they really need it.
• Many Nova Scotians believe that information provided to
them by charities falls short of their needs. For example, 86%
said information about programs and services charities
provide is very important, but just 18% said charities were
doing a good or excellent job at providing it.
• Substantial majorities of the public think that more attention
should be paid to various aspects of charities’ operations,
including how they raise and spend their money and how
much they spend on programs and on professional
fundraising.
The Nonprofit Sector in Nova Scotia: A Statistical Portrait vii

INTRODUCTION
The objective of this report is to synthesize currently available data to
present a statistical portrait of what is currently known about the
core charitable and nonprofit sector in Nova Scotia. The report
discusses a range of topics, including:
• top line statistics and composition of the core sector,
• human and financial resources reported by organizations,
• supports contributed by individual Nova Scotians through
donating and volunteering, and
• public attitudes about the sector.
Data Sources
The report draws on a number of existing surveys and administrative
data sources. These include the National Survey of Nonprofit and
Voluntary Organizations (NSNVO), T3010 Registered Charity
Information Returns, the Canada Survey of Giving, Volunteering, and
Participating (CSGVP), The Muttart Foundation’s Talking About
Charities survey, and various Statistics Canada data tabulations.
The scope and coverage of each of these data sources differs,
sometimes significantly. The NSNVO covers both charities and
nonprofits, but dates from 2003. T3010 returns are used to explore
trends from 2003 to 2012, but cover only registered charities,
excluding organizations without charitable status. Editions of the
CSGVP date to 2004, 2007 and 2010 and cover supports offered by
Nova Scotians to both charities and nonprofits. Editions of the Talking
About Charities surveys date to 2000, 2004, 2006, 2008, and 2013.
The Nonprofit Sector in Nova Scotia: A Statistical Portrait 1

While the questions in this survey specifically reference charities,
given the generally low level of public knowledge regarding the
distinctions between charities and nonprofits, responses probably
pertain more or less equally to nonprofits. Generally, the 2012
reference year is used with Statistics Canada tabulations for ease of
comparability of data.
Report Scope and Definition of the Core Sector
The focus of this report is the core charitable and nonprofit sector in
Nova Scotia. By extension, this means that Hospitals, Universities,
Colleges, and School Boards are beyond its scope. Although legally
all of these organizations are registered charities, the analytical
framework used in Canadian nonprofit studies views them as distinct
from core charities, because they are more subject to government
control than most other organizations, as well as highly reliant on
government funding.1 The number of non-core charities in Nova
Scotia is quite small, numbering some three dozen, but they have
considerable importance beyond their numbers. As an example, total
reported revenues of non-core charities are approximately three times
those of core charities, as is the total number of reported full-time
paid staff.
Co-operatives are also beyond the scope of this report. Contrary to
the situation with non-core charities, this is not due to issues of
organizational independence or funding sources - instead, it is driven
by the fact that co-operatives were out of scope for substantially all
of the data sources drawn upon in this report, making it impossible
to meaningfully integrate co-operatives into this statistical portrait.
That said, the briefest summary of top line statistics for non-financial
co-operatives is presented in Chapter 1 below, in hopes of providing
at least some useful comparative context.
Organization of the Report
The first section of the report provides projections of key top line
statistics describing the size and internal composition of the core
charitable and nonprofit sector as a whole. Sections two and three
draw on analysis of T3010 returns to describe the financial and
human resources of core charities, including recent trends. These
sections focus exclusively on charities because no equivalent
The Nonprofit Sector in Nova Scotia: A Statistical Portrait 2

information is available for nonprofits. Section four draws on the
CSGVP to describe how Nova Scotians give and volunteer for the
province’s charities and nonprofits. Section five uses Talking About
Charities survey results to explore Nova Scotians’ attitudes about
charities.
The Nonprofit Sector in Nova Scotia: A Statistical Portrait 3
1 In addition, the Canadian System of National Accounts classifies these organizations to the government sector.
1. A PORTRAIT OF CORE SECTOR CHARITIES AND NONPROFITS
This section presents estimates of key top line statistics for the core
charitable and nonprofit sector in Nova Scotia and describes the
composition of the sector across various dimensions such as size and
organizational focus. The primary focus is on providing a snapshot of
the “state of the sector” in Nova Scotia. It must be emphasized that
the statistics presented here are projections, based on a combination
of survey and administrative data. Every effort has been taken to
ensure the statistics presented are as accurate as possible, but there
are significant associated uncertainties. We have attempted to
account for these uncertainties by reporting ranges that incorporate
the uncertainties (rather than reporting point estimates), and by using
simple methodologies rather than complex ones (methods are briefly
described for the reader in endnotes that follow this section of the
report).
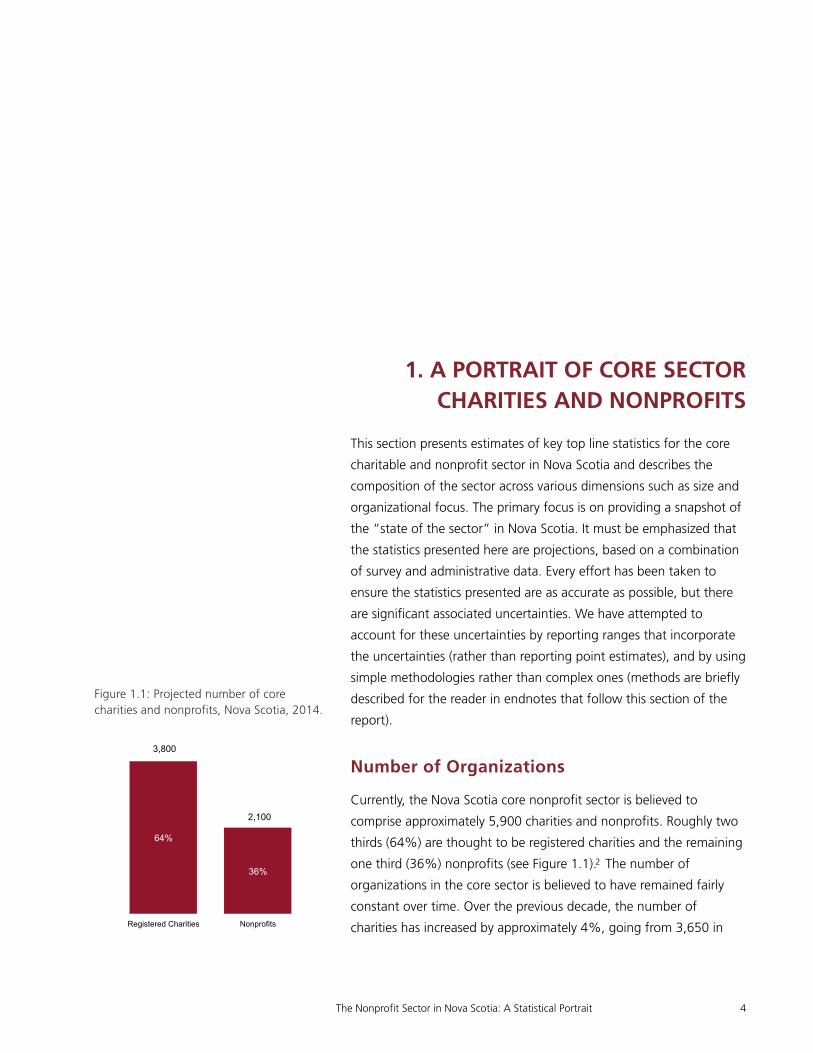
Number of Organizations
Currently, the Nova Scotia core nonprofit sector is believed to
comprise approximately 5,900 charities and nonprofits. Roughly two
thirds (64%) are thought to be registered charities and the remaining
one third (36%) nonprofits (see Figure 1.1).2 The number of
organizations in the core sector is believed to have remained fairly
constant over time. Over the previous decade, the number of
charities has increased by approximately 4%, going from 3,650 in
The Nonprofit Sector in Nova Scotia: A Statistical Portrait 4
Figure 1.1: Projected number of core charities and nonprofits, Nova Scotia, 2014.
64%
36%
Registered Charities Nonprofits
3,800
2,100

2003, to a present (2014) total of just under 3,800. The projected
number of nonprofits assumes the same trend for nonprofits.
Financial Resources
For 2012, total core nonprofit sector annual revenues are estimated
to have been between $1.9 billion and $2.2 billion, with charities
accounting for two-thirds of total sector revenues and nonprofits one
third (see Figure 1.2).3 By way of comparison, this is equivalent to
roughly a fifth of total revenue for the manufacturing sector in Nova
Scotia and a quarter of ordinary revenue for the provincial
government (Statistics Canada, n.d.-c; Steele, 2012).
Assuming that revenues for charities and nonprofits have followed
similar trajectories, total core sector revenues are estimated to have
increased by approximately 33% in constant dollar terms (i.e.,
adjusting for inflation) between 2003 and 2012. This is equivalent to
an average annual growth rate of approximately 3.2% over the
decade as a whole. The pace of increase appears to have been
highest between 2003 and 2006 (with an average annual growth
rate of 6.7%) and significantly lower between 2006 and 2012
(average annual growth of 1.5%).
Human Resources
In 2012, total paid employment in the core sector is estimated to
have been somewhere between 34,400 and 37,400 paid staff
positions (full-time and part-time; see Figure 1.3).4 This is equivalent
to between 7.4% to 8.0% of total jobs in the province
(Statistics Canada, n.d.-d). Charities account for the majority of
positions (between 67% and 73% of total positions). From 2003 to
2013, low bound estimates reflect a total growth in paid staff
positions of 17%, while high bound estimates reflect total growth of
24%.
Unfortunately, given the available data, it is not possible to determine
how the number of positions in the core sector translates into full-
time equivalent jobs. However, based on reports from T3010 returns
and projections from the NSNVO, between 18,300 to 19,400 of
these positions are thought to be full-time and 16,100 to 18,000
part-time / part-year, meaning that nearly half of estimated positions
(47-48%) are part-time.5 It is somewhat challenging to draw direct
comparisons with other sectors given the data available, but it seems
The Nonprofit Sector in Nova Scotia: A Statistical Portrait 5
Figure 1.2: Projected revenues, core charities and nonprofits, Nova Scotia, 2012.
67% 67%
33% 33%
Low Bound High Bound
Registered Charities Nonprofits
$1.9 billion $2.2 billion
Figure 1.3: Projected paid staff positions, core charities and nonprofits, Nova Scotia, 2012.
53% 52%
47% 48%
Low bound High bound
Full-time Part-time
34,400 37,400
safe to say that the core sector has a significantly higher than usual
ratio of part-time to full-time employment. By way of comparison,
just under a fifth (18.9%) of the employed Nova Scotia labour force
was employed part-time in 2012 (Statistics Canada, n.d.-b).
In the nonprofit sector, paid employees represent only part of the
human resources organizations can draw upon. In 2010,
approximately 410,000 Nova Scotians volunteered for a core
charitable or nonprofit organization. Collectively, these volunteers
contributed 78.7 million volunteer hours to core organizations, the
equivalent of nearly 41,000 full-time positions and noticeably larger
than the paid labour component of the core sector in Nova Scotia.6
Since 2004, the total number of Nova Scotians volunteering for core
organizations has increased by 13% while the total number of
volunteer hours they contribute has increased by just under 20%.
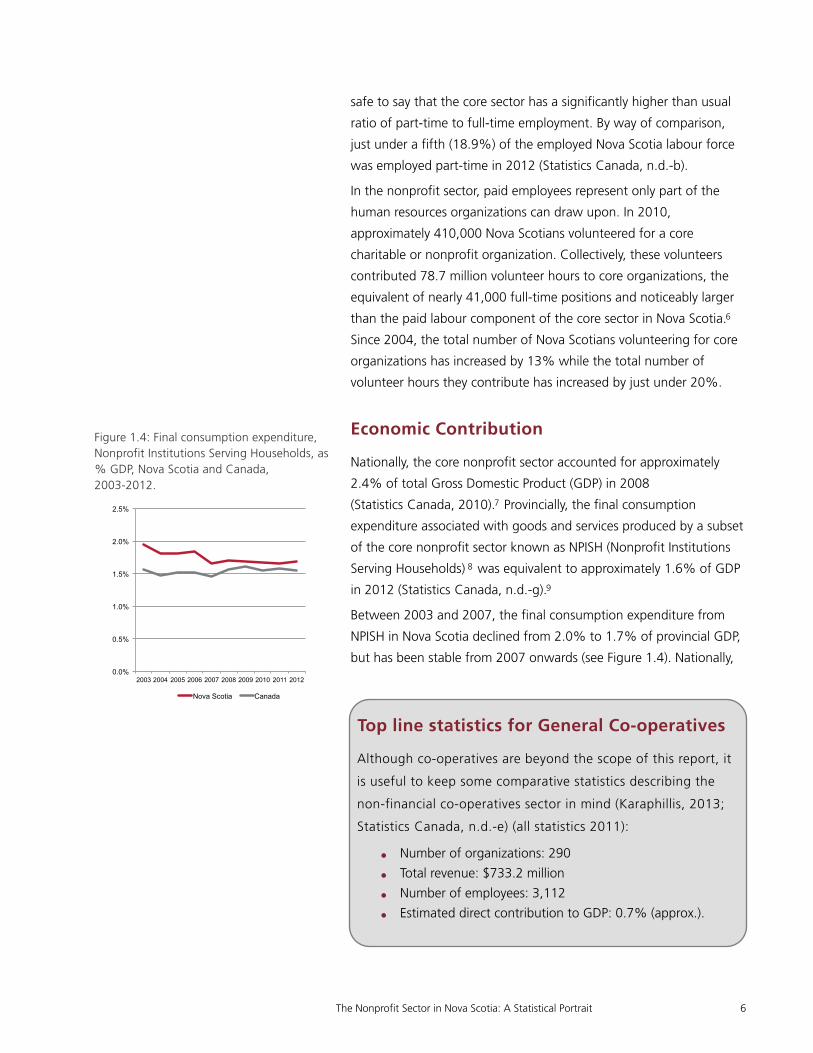
Economic Contribution
Nationally, the core nonprofit sector accounted for approximately
2.4% of total Gross Domestic Product (GDP) in 2008
(Statistics Canada, 2010).7 Provincially, the final consumption
expenditure associated with goods and services produced by a subset
of the core nonprofit sector known as NPISH (Nonprofit Institutions
Serving Households) 8 was equivalent to approximately 1.6% of GDP
in 2012 (Statistics Canada, n.d.-g).9
Between 2003 and 2007, the final consumption expenditure from
NPISH in Nova Scotia declined from 2.0% to 1.7% of provincial GDP,
but has been stable from 2007 onwards (see Figure 1.4). Nationally,
The Nonprofit Sector in Nova Scotia: A Statistical Portrait 6
Figure 1.4: Final consumption expenditure, Nonprofit Institutions Serving Households, as % GDP, Nova Scotia and Canada, 2003-2012.
0.0%
0.5%
1.0%
1.5%
2.0%
2.5%
2003 2004 2005 2006 2007 2008 2009 2010 2011 2012
Nova Scotia Canada
Top line statistics for General Co-operatives
Although co-operatives are beyond the scope of this report, it
is useful to keep some comparative statistics describing the
non-financial co-operatives sector in mind (Karaphillis, 2013;
Statistics Canada, n.d.-e) (all statistics 2011):
• Number of organizations: 290
• Total revenue: $733.2 million
• Number of employees: 3,112
• Estimated direct contribution to GDP: 0.7% (approx.).

final consumption associated with NPISH has remained essentially
stable at 1.5% - 1.6% of GDP since 2003.
Internal Composition
The core nonprofit sector is made up of many individual sub-sectors,
defined by organizations’ primary focus. The largest sub-sector, in
terms of number of organizations, is Religion (25% of organizations),
followed by Social services (16%), Sports & recreation (12%) and Arts
& culture (10%; see Figure 1.5). The smallest sub-sectors are
International (0.3%), followed by Law, advocacy & politics (2%), and
Health (3%). Particular organizational forms (i.e., charities or
nonprofits) tend to predominate in most sub-sectors. The vast
majority of Religion organizations are registered charities, as are the
vast majority of Health and Fundraising, grantmaking & voluntarism
organizations. Solid majorities of both Arts & culture and Education &
research organizations are also charities. Nonprofits predominate
among Business & professional associations and in the Sports &
recreation and Development & housing sub-sectors. About two thirds
of Law, advocacy & politics organizations are also nonprofits.
Environment organizations are almost exactly evenly split between
the two forms.
As measured by the size of their annual revenues, most organizations
are quite small. Nearly half of core organizations (45%) are believed
to have annual revenues less than $30,000, with another fifth (21%)
having annual revenues of between $30,000 and $99,999 (see Figure
1.6). Just 6% of core organizations are thought to have annual
revenues of $1 million or more. In terms of organizational form,
charities account for roughly four fifths (82%) of organizations with
annual revenues of $10 million or more and about three quarters
(74%) of organizations with annual revenues between $30,000 and
$99,999. Nonprofits are most prevalent among organizations with
annual revenues between $500,000 and $999,999 (44% of
organizations) and organizations with annual revenues less than
$30,000 (40%). The compositions of other revenue categories are
more mixed.
Most organizations report quite small numbers of paid staff, if they
employ them at all. In fact, slightly over half (51%) report no paid
staff (see Figure 1.7). Just under a third (30%) report having less than
five paid staff (full-time or part-time) and about one in eight (13%)
The Nonprofit Sector in Nova Scotia: A Statistical Portrait 7
Figure 1.6: Projected distribution of core charities and nonprofits by annual revenue size, Nova Scotia, 2012.
<$30K $30K - $99.9K
$100K - $249.9K
$250K - $499.9K
$500K - $999.9K
$1M - $9.9M
$10M+
Annual revenue size
Charities Nonprofits
45%
21% 16%
8% 4% 5%
0.4%
Figure 1.7: Projected distribution of core charities and nonprofits by paid staff size, Nova Scotia, 2012.
No Staff Reported
1 to 4 5 to 19 20 to 49 50 to 99 100 or more
Paid staff size
Charities Nonprofits
51%
30%
13%
3% 1% 1%
Figure 1.5: Projected distribution of organizations by sub-sector, core charities and nonprofits, Nova Scotia, 2012.
Not elsewhere classified
International
Law, advocacy & politics
Health
Environment
Development & housing
Business/Professional
Philanthropic intermediaries & voluntarism
Education & research
Arts & culture
Sports & recreation
Social services
Religion
Charities Nonprofits
25%
16%
12%
10%
8%
6%
4%
4%
3%
3%
2%
0.3%
6%

report having between five and nineteen paid staff. Just one percent
of core organizations report having 100 or more paid staff. In terms
of organizational forms, just over two thirds of organizations with 20
or more paid staff are registered charities, as opposed to about three
fifths of organizations in most other paid staff size categories (the
only exception to this generality is organizations with one to five paid
staff - 68% of these are charities).
The Nonprofit Sector in Nova Scotia: A Statistical Portrait 8
2 The number of core charities is taken directly from recent T3010 filings, while the number of nonprofits is an estimate that assumes that the ratio of nonprofits to charities has remained consistent since the 2003 NSNVO.
3 The estimate of total revenues assumes that the percentage of total core sector revenues contributed by nonprofits has remained constant since the 2003 NSNVO. The range of the estimates accounts for identifiable errors in T3010 filings. The lower bound estimate includes only T3010 returns without identifiable significant revenue reporting errors, while the upper bound estimate includes total revenues, as reported (i.e., including returns with identifiable significant revenue reporting errors).
4 The number of paid staff for core charities is taken directly from 2012 T3010 filings, while the number of paid staff employed by nonprofits is an estimate based on NSNVO data. The low bound figure assumes that the number of paid staff employed by nonprofits has remained constant since 2003, while the high bound figure assumes that the total number of paid staff has increased the same amount as among charities. This approach produces quite a large range of uncertainty - we used it because the ratio of full-time to part-time positions for charities from the 2003 NSNVO was significantly different than reported in 2003 T3010 information returns and because the ratio of full-time to part time positions among charities changed significantly from 2003 to 2012 (we do not know whether the same is true for nonprofits).
5 The number of full-time and part-time paid staff for charities is taken directly from 2012 T3010 filings. The numbers of full-time and part-time for nonprofits are estimates based on NSNVO data. The low bound figures assume that the number of full-time and part-time paid staff have remained constant since 2003, while the high bound figures assume that total nonprofit employment has increased at the same pace as total charitable employment and that the ratio of full-time to part-time employees has shifted along the same lines (with full-time employees dropping ten percentage points, from 73% of total employment to 63%).
6 Assuming a 40 hour work week and a 48 week work year.

The Nonprofit Sector in Nova Scotia: A Statistical Portrait 9
7 2008 is the last year for which total core nonprofit sector GDP statistics were produced by the Satellite Account of Nonprofit Institutions and Volunteering. Moving forward, NPISH statistics have been integrated into the 2012 revisions to the System of National Accounts.
8 NPISH are a sub-set of institutions in the core nonprofit sector that produce “goods and services free or at prices that are not economically significant to individual households or the community at large” (Statistics Canada, 2009). The other major components of the nonprofit sector are organizations classified to government (mainly non-core organizations that are institutionally controlled by government) and non-profit institutions classified to the corporate sector (institutionally independent organizations that produce goods and services at market prices). The most recent figures available (2008) indicate that nationally, NPISH collectively accounted for 22% of total nonprofit GDP and 63% of core sector GDP (Statistics Canada, 2009).
9 Final consumption expenditure of NPISH accounts for the goods and services provided to households by nonprofits, either free or at non-market prices. User fees are specifically netted out.

2. FINANCIAL RESOURCES OF CORE CHARITIES
This section of the report uses data from T3010 information returns
to describe how revenues are distributed within the core charitable
sector, what revenue sources charities rely on, trends in revenue over
the past decade, fundraising methods used by charities, and in-kind
donations.
The T3010 contains a wealth of information on revenues for
charities, although variations in reporting requirements and errors in
filing make it somewhat challenging to use. As of 2012, large
charities are required to report the amount of revenue they received
from 13 specific sources, while smaller charities are required to report
revenues from six sources.10 These sources can be grouped into three
main categories (gifts, donations and grants, government, and
earned income) with a fourth catchall category to collect revenue
from sources not specifically collected by the form. The analyses
presented below exclude data from charity returns that appear to
have significant filing errors.11
Distribution of revenue
Revenues are quite unevenly distributed across the core charitable
sector. As one would expect, the largest charities account for
disproportionately large percentages of total revenues. However, the
magnitude of this is extremely striking. In 2012, the 1% of core
charities with annual revenues of $10 million or more accounted for
The Nonprofit Sector in Nova Scotia: A Statistical Portrait 10
Figure 2.1 Distribution of core charities and total revenue by revenue size, Nova Scotia, 2012.
42%
24%
17%
8%
4% 5%
1% 1% 4%
7% 8% 7%
44%
29%
<$30K $30K - $99.9K
$100K - $249.9K
$250K - $499.9K
$500K - $999.9K
$1M - $9.9M
$10M+
Annual revenue size % Charities % Revenues

29% of total revenues (see Figure 2.1). The 5% of organizations with
revenues between $1 million and just less than $10 million accounted
for an even larger percentage of total revenues at 44%. Conversely,
the 42% of charities with annual revenues less than $30,000
collectively accounted for just 1% of total revenues, and the 24% of
charities in the next largest revenue class accounted for 4%.
The distribution of revenues also varies with the causes charities seek
to address.12 Clearly, the number of organizations does not
determine how revenues are distributed. For example, although
charities that focus primarily on Religion are most numerous,
accounting for 36% of core charities, they account for a significantly
smaller percentage of total revenues at 13% (see Figure 2.2). Other
causes that account for significantly smaller proportions of total
revenues than their numbers would lead one to expect include the
Environment, Fundraising, grantmaking & voluntarism, Arts & culture,
and causes that don’t fall into one of the specific categories.
Conversely, Health (5% of core charities but 31% of total revenues),
Development & housing (1% charities vs. 8% total revenues) and
Social services (19% vs. 26%) account for significantly higher
percentages of core charitable sector revenues than the number of
organizations focusing primarily on these causes would suggest.
Revenue sources
In the aggregate, the largest single revenue source for core charities
is government. Collectively, the three levels of government account
for half of total revenues (see Figure 2.3). Gifts, donations, and
grants are the second largest source, accounting for a quarter of total
revenues. Earned income accounts for one fifth of total revenues and
the remaining five percent come from some source that filers are
unable to fit into one of these three categories.
In interpreting the above figures, it is important to understand that
they are aggregates for the core charitable sector as a whole and do
not reflect the revenue mix of a typical core charity. For example, the
bulk of government revenues go to a relatively small number of
charities, meaning that government revenues account for a much
smaller piece of the pie for most organizations (in fact, 62% of core
charities report receiving no government revenues at all). When
seeking to understand typical funding sources for core charities, it is
more appropriate to look at the average percentage of total revenues
The Nonprofit Sector in Nova Scotia: A Statistical Portrait 11
Figure 2.2 Distribution of core charities and total revenue by cause, Nova Scotia, 2012.
0.2%
1%
1%
2%
2%
3%
5%
8%
8%
13%
26%
31%
7%
1%
3%
3%
0.4%
8%
10%
7%
1%
36%
19%
5%
Not elsewhere classified
Law, advocacy & politics
Environment
Sports & recreation
International
Fundraising, grantmaking & voluntarism
Arts & culture
Education & research
Development & housing
Religion
Social services
Health
% Charities % Revenues
Figure 2.3: Distribution of total and average revenues by source, core charities, Nova Scotia, 2012.
25%
50%
20%
5%
Aggregate Revenues
Gifts, Donations & Grants Government
Earned Income Other
58% 15%
15%
8%
Average Revenues
Gifts, Donations & Grants Government
Earned Income Other

from each of the three sources. This analysis indicates that gifts,
donations, and grants play a much larger role for most core charities,
accounting for 58% of total revenues, on average. Government and
earned income each account for an average of 15% of total revenues
and other income sources account for 8%.
DOMINANT SOURCES OF REVENUE
Looking at where individual organizations receive their revenue, it is
clear most core charities receive the bulk of their revenue from one of
the three major areas. In 2012, somewhat over half of charities
(59%) reported that gifts, donations, and grants accounted for more
than half of total organizational revenues (see Figure 2.4). A much
smaller percentage of charities (15%) reported that the majority of
their revenues came from government. A like number of charities
(12%) obtained most of their revenue from various forms of earned
income from non-governmental sources. One twentieth of charities
reported that they received the bulk of their funding from some
source not specified elsewhere on the form. One in ten (10%) did
not rely on any one of these categories for the majority of their
income, but instead drew from multiple sources.
The dominant source of revenue tends to vary according to how big
charities are, as measured by the size of their annual revenues.
Smaller charities are more likely to draw most of their revenue from
gifts, donations, and grants than larger charities. For example, over
two thirds of charities with annual revenues between $30,000 and
$99,999 (70%) reported obtaining most of their revenues from this
source, compared to less than a fifth of charities with annual
revenues of $1 million or more (see Figure 2.5). Generally speaking,
the likelihood of being reliant on gifts, donations and grants appears
to decrease fairly consistently with increases in organization size.
Conversely, reliance on other revenue sources appears to increase
with organization size. This is most clearly seen with government
revenues. About one in eight charities (12%) with annual revenues
between $30,000 and $99,999 receive more than half of their total
revenues from government. This percentage increases fairly
consistently with organization size, peaking at just under four fifths
of organizations with annual revenues of $10 million or more.
Patterns of reliance on earned income are somewhat more difficult to
evaluate. Its importance does generally seem to increase with annual
revenue size, but the size of the shifts between revenue size
The Nonprofit Sector in Nova Scotia: A Statistical Portrait 12
Figure 2.4 Distribution of core charities by revenue dependency, Nova Scotia, 2012.
10%
5%
12%
15%
59%
Mixed sources
Other
Earned income
Government
Gifts, donations & grants
Figure 2.5: Distribution of core charities by revenue dependency and annual revenue size, Nova Scotia, 2012.
62% 70% 65%
47% 37%
17% 17%
6%
12% 16%
28% 35%
49%
78%
12%
8% 10% 13% 18%
23% 6%
5% 3% 2%
4% 4% 14% 5% 6% 10% 6% 7%
<$30K $30K - $99.9K
$100K - $249.9K
$250K - $499.9K
$500K - $999.9K
$1M - $9.9M
$10M+
Annual revenue size
Gifts, donations & grants Government Earned income Other Mixed sources
categories are much smaller (e.g., 8% of core charities with annual
revenues between $30,000 and $99,999 and nearly a quarter of
charities with annual revenues between $1 million and less than $10
million). The percentages of organizations that depend on other
revenue sources or draw on a mix of sources are comparatively small
and do not seem to vary much with increases in total revenues. That
said, one interesting fact that should be highlighted is the relatively
high incidence mixed sources of funding amongst the smallest
organizations.
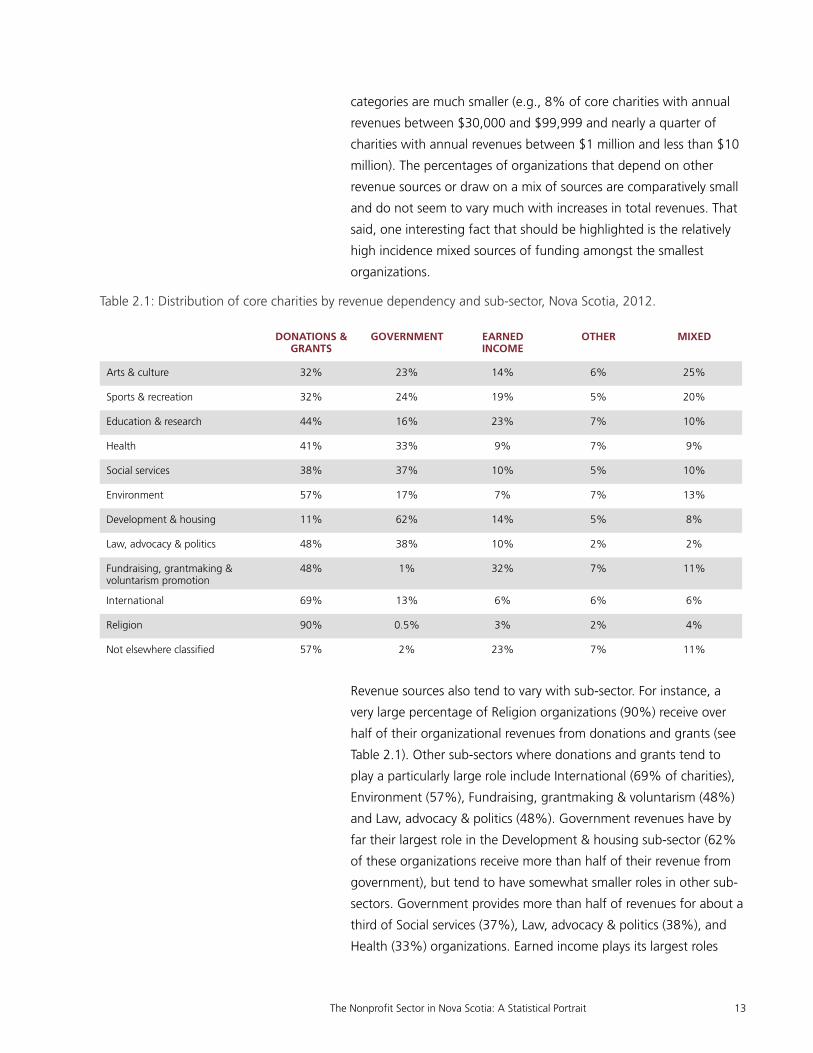
Revenue sources also tend to vary with sub-sector. For instance, a
very large percentage of Religion organizations (90%) receive over
half of their organizational revenues from donations and grants (see
Table 2.1). Other sub-sectors where donations and grants tend to
play a particularly large role include International (69% of charities),
Environment (57%), Fundraising, grantmaking & voluntarism (48%)
and Law, advocacy & politics (48%). Government revenues have by
far their largest role in the Development & housing sub-sector (62%
of these organizations receive more than half of their revenue from
government), but tend to have somewhat smaller roles in other sub-
sectors. Government provides more than half of revenues for about a
third of Social services (37%), Law, advocacy & politics (38%), and
Health (33%) organizations. Earned income plays its largest roles
The Nonprofit Sector in Nova Scotia: A Statistical Portrait 13
Table 2.1: Distribution of core charities by revenue dependency and sub-sector, Nova Scotia, 2012.
DONATIONS & GRANTS
GOVERNMENT EARNED INCOME
OTHER MIXED
Arts & culture 32% 23% 14% 6% 25%
Sports & recreation 32% 24% 19% 5% 20%
Education & research 44% 16% 23% 7% 10%
Health 41% 33% 9% 7% 9%
Social services 38% 37% 10% 5% 10%
Environment 57% 17% 7% 7% 13%
Development & housing 11% 62% 14% 5% 8%
Law, advocacy & politics 48% 38% 10% 2% 2%
Fundraising, grantmaking & voluntarism promotion
48% 1% 32% 7% 11%
International 69% 13% 6% 6% 6%
Religion 90% 0.5% 3% 2% 4%
Not elsewhere classified 57% 2% 23% 7% 11%

among Fundraising, grantmaking & voluntarism organizations (32%),
and Education & research (23%) and Sports & recreation
organizations (19%). Interestingly, Arts & culture (25%) and Sports &
recreation (20%) organizations are most likely to report drawing on a
mix of revenue sources.
GIFTS, DONATIONS AND GRANTS
In 2012, core charities reported that gifts, donations and grants
accounted for an average of 58% of total organizational revenues.
This revenue comes from four sources: receipted donations,
unreceipted donations, unreceipted revenue from fundraising, and
gifts or grants from other registered charities. Of these, receipted
donations are the most significant, accounting for almost two thirds
(65%) of the total value of gifts, donations and grants revenue (see
Figure 2.6). Unreceipted income from fundraising accounts for 16%
and unreceipted gifts accounts for about a tenth (9%). Grants from
other charities account for another 10%.
Gifts, donations and grants play a fairly significant role in all sizes of
organizations. A majority of core charities in all size categories report
receiving this type of revenue (see Figure 2.7). Notably, about nine
tenths of organizations with annual revenues between $30,000 and
less than $1 million reported this. The very largest organizations are
least likely to report receiving this type of revenue (61% reported
this). The financial role of this type of income clearly tends to
decrease with revenue size, at least among organizations with annual
revenues less than $1 million. The smallest charities receiving this
type of revenue reported that it accounted for an average of 74% of
total organizational revenues, as compared to roughly a quarter of
total revenues for charities with annual revenues of $1 million or
more. However, although gifts and donations tend to play a smaller
role in financing very large organizations, much of the total value of
gifts, donations and grants went to them. Although core charities
with annual revenues of $1 million or more account for just 6% of
charities, they received almost half (46%) of the total value of gifts,
donations and grants.
GOVERNMENT
On average, government funding accounted for 15% of
organizational funding in 2012. Unfortunately, detailed
understanding of government revenue is hampered somewhat by
The Nonprofit Sector in Nova Scotia: A Statistical Portrait 14
Figure 2.6: Distribution of gifts, donation, and grants revenue by specific source, core charities, Nova Scotia, 2012.
9% 10%
16%
65%
Gifts donations and grants revenue
Unreceipted donations Other charities Fundraising Receipted donations
Figure 2.7: Likelihood of receiving gifts, donations & grants, typical financial role, and distribution of total gifts, donations & grants revenue by annual revenue size, Nova Scotia, 2012.
21%
25%
10%
13%
18%
10%
3%
27%
23%
38%
50%
66%
71%
74%
61%
82%
93%
93%
96%
96%
81%
$10M+
$1M - $9.9M
$500K - $999.9K
$250K - $499.9K
$100K - $249.9K
$30K - $99.9K
<$30K
% Reporting
Avg % Organizational Revenues
% Total Gifts, Donations & Grants

inconsistencies in reporting requirements. Smaller charities are not
required to break down governmental revenues by level of
government. Among core charities that are required to detail funding
by level of government, it is clear that the provincial government
provides the vast majority of funds, accounting for fully 86% of the
total value of government funding (see Figure 2.8). The federal
government accounts for 10% and municipal governments 4%.
As one would expect from the pattern of revenue dependency
described above, the importance of government revenue increases
with the size of the charity. One fifth of the smallest organizations
(20%) reported receiving government revenue in 2012, compared to
nearly nine tenths (89%) of the largest (see Figure 2.9). The typical
role of government revenue among recipients also tends to increase
with organizational size, at least among medium and large-sized
charities. Among government-funded charities with annual revenues
less than $250,000 government revenues account for a third of
organizational revenues, on average. Amongst larger organizations,
the typical role increases steadily, accounting for nearly three quarters
(73%) of organizational revenues amongst core charities with annual
revenues of $10 million or more. As one would expect given these
patterns, government revenues are clearly not allocated uniformly
across organization size categories. The vast majority of government
revenues go to the small number of core charities with annual
revenues of $1 million or more. The 5% of core charities with annual
revenues between $1 million and less than $10 million account for
46% of total government revenues, while the 0.5% of core charities
in the largest revenue category account for 40%.
EARNED INCOME
In 2012, core charities reported that, on average, just under 15% of
total organizational revenues came from various forms of earned
income. There are five sub-categories of earned income collected on
the T3010 form. These include: sale of goods and services (other than
to government); memberships, fees, and association dues; rental
income; income from investments and interest; and net income from
the sale of assets. Of these sources, sale of goods and services is by
far the most significant, accounting for 62% of total earned income.
Interest and investment income accounted for just under 13% of
earned income and rental income a further 12% (see Figure 2.10).
The Nonprofit Sector in Nova Scotia: A Statistical Portrait 15
Figure 2.8: Distribution of government revenue by specific source, core charities, Nova Scotia, 2012.
4%
86%
10%
Government revenue
Municipal government Provincial government
Federal government
Figure 2.9: Likelihood of receiving government revenues, typical financial role of government revenues, and distribution of government revenues by annual revenue size, Nova Scotia, 2012.
40%
46%
5%
5%
3%
1%
0.2%
73%
60%
51%
47%
34%
32%
37%
89%
79%
70%
61%
51%
38%
20%
$10M+
$1M - $9.9M
$500K - $999.9K
$250K - $499.9K
$100K - $249.9K
$30K - $99.9K
<$30K
% Reporting
Avg % Organizational Revenues
% Total Government Revenues
Figure 2.10: Distribution of earned income by specific source, core charities, Nova Scotia, 2012.
5% 8%
12%
13%
62%
Earned income
Goods & services Interest and investments Rental income Membership dues & fees Disposition of assets
Memberships, fees and dues (8%) and net proceeds from the
disposition of assets (5%) round out the earned income picture.
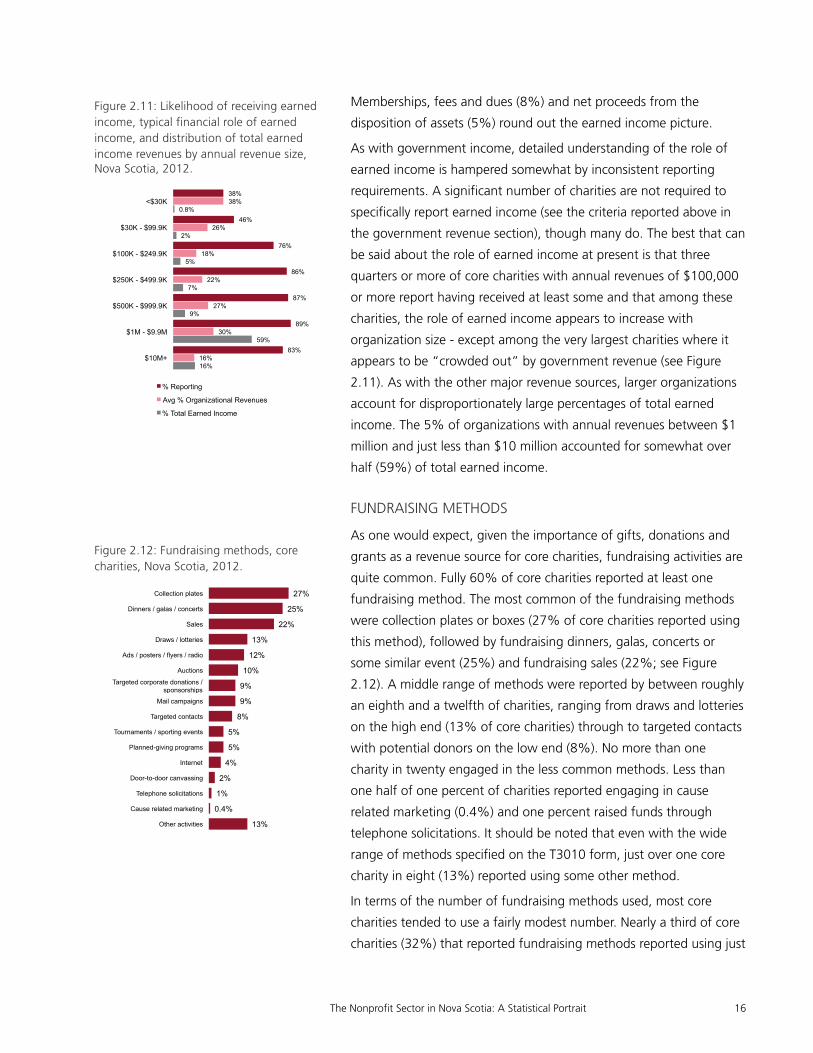
As with government income, detailed understanding of the role of
earned income is hampered somewhat by inconsistent reporting
requirements. A significant number of charities are not required to
specifically report earned income (see the criteria reported above in
the government revenue section), though many do. The best that can
be said about the role of earned income at present is that three
quarters or more of core charities with annual revenues of $100,000
or more report having received at least some and that among these
charities, the role of earned income appears to increase with
organization size - except among the very largest charities where it
appears to be “crowded out” by government revenue (see Figure
2.11). As with the other major revenue sources, larger organizations
account for disproportionately large percentages of total earned
income. The 5% of organizations with annual revenues between $1
million and just less than $10 million accounted for somewhat over
half (59%) of total earned income.
FUNDRAISING METHODS
As one would expect, given the importance of gifts, donations and
grants as a revenue source for core charities, fundraising activities are
quite common. Fully 60% of core charities reported at least one
fundraising method. The most common of the fundraising methods
were collection plates or boxes (27% of core charities reported using
this method), followed by fundraising dinners, galas, concerts or
some similar event (25%) and fundraising sales (22%; see Figure
2.12). A middle range of methods were reported by between roughly
an eighth and a twelfth of charities, ranging from draws and lotteries
on the high end (13% of core charities) through to targeted contacts
with potential donors on the low end (8%). No more than one
charity in twenty engaged in the less common methods. Less than
one half of one percent of charities reported engaging in cause
related marketing (0.4%) and one percent raised funds through
telephone solicitations. It should be noted that even with the wide
range of methods specified on the T3010 form, just over one core
charity in eight (13%) reported using some other method.
In terms of the number of fundraising methods used, most core
charities tended to use a fairly modest number. Nearly a third of core
charities (32%) that reported fundraising methods reported using just
The Nonprofit Sector in Nova Scotia: A Statistical Portrait 16
Figure 2.11: Likelihood of receiving earned income, typical financial role of earned income, and distribution of total earned income revenues by annual revenue size, Nova Scotia, 2012.
16%
59%
9%
7%
5%
2%
0.8%
16%
30%
27%
22%
18%
26%
38%
83%
89%
87%
86%
76%
46%
38%
$10M+
$1M - $9.9M
$500K - $999.9K
$250K - $499.9K
$100K - $249.9K
$30K - $99.9K
<$30K
% Reporting
Avg % Organizational Revenues
% Total Earned Income
Figure 2.12: Fundraising methods, core charities, Nova Scotia, 2012.
13%
0.4%
1%
2%
4%
5%
5%
8%
9%
9%
10%
12%
13%
22%
25%
27%
Other activities
Cause related marketing
Telephone solicitations
Door-to-door canvassing
Internet
Planned-giving programs
Tournaments / sporting events
Targeted contacts
Mail campaigns
Targeted corporate donations / sponsorships
Auctions
Ads / posters / flyers / radio
Draws / lotteries
Sales
Dinners / galas / concerts
Collection plates

one (see Figure 2.13). About another fifth used each of two (21%) or
three (19%) methods. From that point, the number of methods used
decreases fairly quickly, with just 3% of organizations using eight or
more.
Not all charities are equally likely to report fundraising activities. As
one would generally expect, core charities that depend on gifts,
donations and grants for more than half of their revenues are quite
likely to report fundraising activities (63% reported this), but what
one might not expect is that core charities that derive more than half
of their revenues from government sources are slightly more likely to
report fundraising activities (66%; see Figure 2.14). Organizations
that depend on earned income or some other revenue source are less
likely to report fundraising (46% for both types), while charities that
depend on a mix of revenue sources rank in between these extremes
(55%). Interestingly, there does not seem to be much variation in the
number of fundraising activities by revenue dependency. The only
exception in this regard seems to be with organizations that depend
on a mix of revenue sources – these organizations report a slightly
higher average number of methods (3.4 vs. an average of 2.8 for all
core charities).
The likelihood of reporting fundraising activities also varies by other
organizational attributes, such as annual revenue size and sub-sector.
The likelihood of reporting fundraising methods tends to increase
with annual revenue size, from 45% among core charities with
annual revenues less than $30,000 to a peak of 78% for annual
revenues between $500,000 and $999,999, whereupon it decreases
to 70% for organizations with annual revenues between $1 million
and just less than $10 million and 47% of those with annual
revenues of $10 million or more. The average number of fundraising
methods that charities engage in also increases with organization
size. Interestingly, the average number of activities increases even
amongst the very largest organizations (going from a low average of
2.1 activities for charities with less than $30,000 in annual revenues
to a high of 5.6 among organizations with annual revenues of $10
million or more). Focussing on sub-sectors, Arts & culture charities are
most likely to report fundraising methods (73%; see Figure 2.15).
Around two thirds of charities working in most other sub-sectors
report fundraising methods, ranging from 68% of Health
organizations to 63% of Religion organizations. Sub-sectors that
stand out as being particularly unlikely to report fundraising methods
The Nonprofit Sector in Nova Scotia: A Statistical Portrait 17
Figure 2.13: Number of fundraising methods used, core charities, Nova Scotia, 2012.
32%
21% 19%
11%
8%
4% 2% 1% 1% 1%
1 2 3 4 5 6 7 8 9 10 or more
Figure 2.14 Incidence of fundraising activities by revenue dependency, core charities, Nova Scotia, 2012.
63% 66%
46% 46%
55%
Gifts, donations &
grants
Government income
Earned income
Other income
Mixed sources
Figure 2.15: Incidence of fundraising activities by sub-sector, core charities, Nova Scotia, 2012.
26%
47%
50%
53%
59%
63%
64%
64%
67%
67%
68%
73%
Not elsewhere classified
Fundraising, grantmaking & voluntarism
Education & research
Development & housing
Law, advocacy & politics
Religion
Sports & recreation
Social services
Environment
International
Health
Arts & culture

include Philanthropic Intermediaries & Voluntarism at 47%, Education
& research (50%), Development & housing (53%), and Law,
advocacy & politics (59%). As with with revenue size, the average
number of methods reported varies across different organization
types. Sub-sectors that stand out as reporting particularly high
numbers of fundraising methods include International (an average of
3.8 methods), Environment (3.7), Arts & culture (3.5) and
Fundraising, grantmaking & voluntarism (3.2). Interestingly, while
organizations in most of these sub-sectors are also more likely to
report fundraising activities at all, Philanthropic Intermediaries are
quite unlikely to do so. Sub-sectors that stand out for reporting
particularly low average numbers of fundraising activities include
Religion (2.5) and Education & research (2.5).
IN-KIND SUPPORT
Donations of goods and services are an important resource for many
charities. T3010 returns collect information on in-kind donations for
which charities issue receipts. While this means that an unknown
proportion of in-kind giving is not captured (i.e., giving for which
receipts are not issued), the data still provides useful insights into the
range of supports charities receive, as well as a lower bound estimate
of the scale of in-kind giving. In 2012, slightly over 11% of core
charities reported issuing receipts for at least one type of in-kind
donation. Most organizations reporting in-kind donations report just
one type of donation (59%). About a fifth (22%) report two, just
under a tenth (9%) three types, and the balance (9%) four or more.
Contributions of clothing, furniture or food were by far the most
common type of in-kind contribution reported (31% of core charities
reporting in-kind donations reported this type of contribution; see
Figure 2.16). Just under a quarter (23%) reported contributions of
artwork, wine, or jewelry, 16% reported receiving contributions of
machinery or other equipment (notably including computers and/or
software) and 13% books. A number of types of contributions have
particular policy relevance, including publicly traded securities or
mutual funds (reported by 13% of core charities that issued receipts
for in-kind contributions), privately held securities (1%), and cultural
(3%) or ecological (0.5%) properties. It is clear that Nova Scotians
contribute a very broad range of in-kind goods. In spite of the
breadth of types of contributions mentioned, just under half (49%)
of reporting charities say that they received some other type of good.
The Nonprofit Sector in Nova Scotia: A Statistical Portrait 18
Figure 2.16: Types of in-kind gifts reported, core charities reporting issuing receipts in return for in-kind contributions, Nova Scotia, 2012.
49%
0.5%
1%
2%
3%
4%
4%
13%
13%
13%
16%
23%
31%
Other
Ecological properties
Privately-held securities
Vehicles
Cultural properties
Life insurance policies
Medical equipment/supplies
Building materials
Publicly traded securities/mutual funds
Books
Machinery/equipment (including computers &
Artwork/wine/jewellery
Clothing/furniture, food
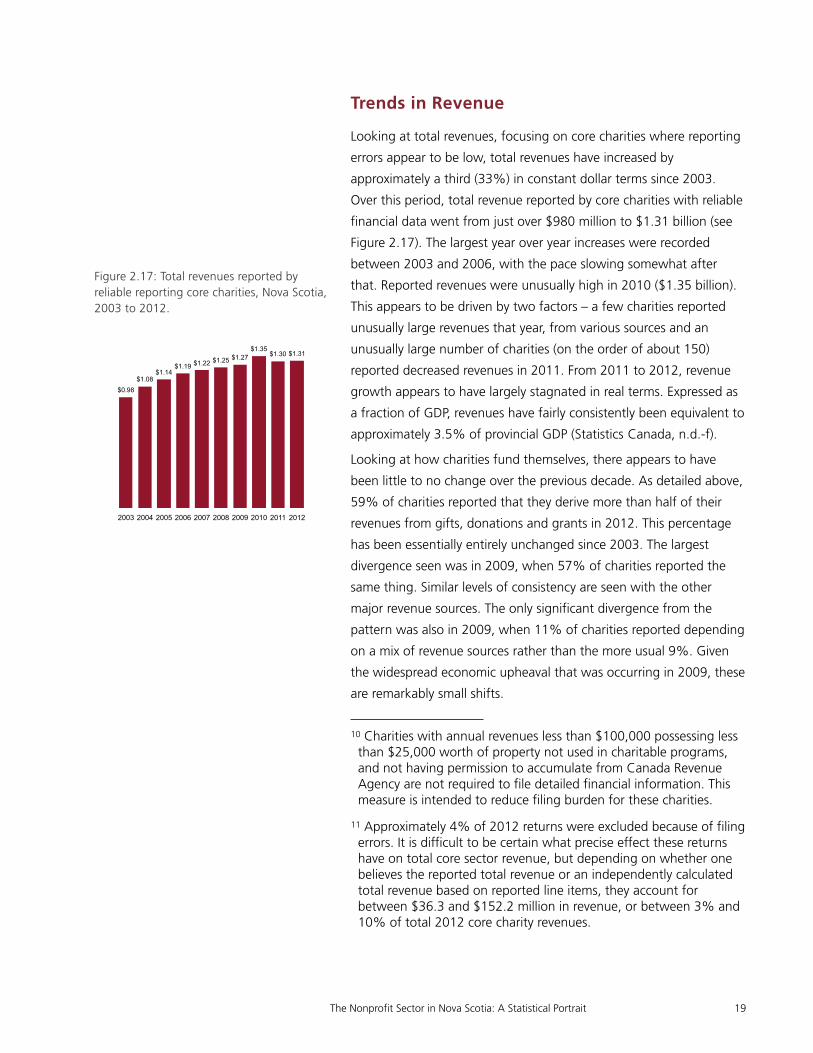
Trends in Revenue
Looking at total revenues, focusing on core charities where reporting
errors appear to be low, total revenues have increased by
approximately a third (33%) in constant dollar terms since 2003.
Over this period, total revenue reported by core charities with reliable
financial data went from just over $980 million to $1.31 billion (see
Figure 2.17). The largest year over year increases were recorded
between 2003 and 2006, with the pace slowing somewhat after
that. Reported revenues were unusually high in 2010 ($1.35 billion).
This appears to be driven by two factors – a few charities reported
unusually large revenues that year, from various sources and an
unusually large number of charities (on the order of about 150)
reported decreased revenues in 2011. From 2011 to 2012, revenue
growth appears to have largely stagnated in real terms. Expressed as
a fraction of GDP, revenues have fairly consistently been equivalent to
approximately 3.5% of provincial GDP (Statistics Canada, n.d.-f).
Looking at how charities fund themselves, there appears to have
been little to no change over the previous decade. As detailed above,
59% of charities reported that they derive more than half of their
revenues from gifts, donations and grants in 2012. This percentage
has been essentially entirely unchanged since 2003. The largest
divergence seen was in 2009, when 57% of charities reported the
same thing. Similar levels of consistency are seen with the other
major revenue sources. The only significant divergence from the
pattern was also in 2009, when 11% of charities reported depending
on a mix of revenue sources rather than the more usual 9%. Given
the widespread economic upheaval that was occurring in 2009, these
are remarkably small shifts.
The Nonprofit Sector in Nova Scotia: A Statistical Portrait 19
10 Charities with annual revenues less than $100,000 possessing less than $25,000 worth of property not used in charitable programs, and not having permission to accumulate from Canada Revenue Agency are not required to file detailed financial information. This measure is intended to reduce filing burden for these charities.
11 Approximately 4% of 2012 returns were excluded because of filing errors. It is difficult to be certain what precise effect these returns have on total core sector revenue, but depending on whether one believes the reported total revenue or an independently calculated total revenue based on reported line items, they account for between $36.3 and $152.2 million in revenue, or between 3% and 10% of total 2012 core charity revenues.
Figure 2.17: Total revenues reported by reliable reporting core charities, Nova Scotia, 2003 to 2012.
$0.98 $1.08
$1.14 $1.19 $1.22 $1.25 $1.27
$1.35 $1.30 $1.31
2003 2004 2005 2006 2007 2008 2009 2010 2011 2012

The Nonprofit Sector in Nova Scotia: A Statistical Portrait 20
12 For analysis by cause area, charities are assigned to categories based on the primary focus of the organization. For example, a charity that reported devoting 70% total effort to Health and 30% to Social services would be classified as a Health charity. In contrast, revenues are allocated according to the degree of effort charities devote to a given cause area. In the example above, 70% of organizational revenues would be assigned to Health and 30% to Social services.

3. PAID HUMAN RESOURCES OF CORE CHARITIES
This section of the report draws on T3010 information returns to
describe what is known about the paid human resources of core
charities.
Paid Human Resources of Charities
As of 2012, core charities reported a total of just over 25,000 paid
positions. Just under half (44%) were full-time positions and the
balance (56%) part-time / part-year.13
PAID STAFF SIZE
Although core charities collectively account for a considerable
number of positions, not all organizations employ paid staff. In fact,
fully half did not report paid staff (see Figure 3.1). Just under a third
(32%) reported one to four paid staff positions and 13% reported
between five and nineteen positions.14 At the other end of the size
spectrum, just 1% of organizations reported having 100 or more
paid staff positions.
Charities are more likely than businesses to have small numbers of
paid staff. Nearly two thirds (63%) of charities with paid staff
reported one to four paid staff, compared to just over half of
businesses (54%; see Figure 3.2). Conversely, charities are somewhat
less likely to report 5 to 19 paid staff - just over a quarter (26%) of
charities with paid staff are in this category, compared to one third of
The Nonprofit Sector in Nova Scotia: A Statistical Portrait 21
Figure 3.1: Distribution of organizations by total paid staff size categories, core charities, Nova Scotia, 2012.
50%
32%
13%
3% 1% 1%
None 1 to 4 5 to 19 20 to 49 50 to 99 100 or more
Figure 3.2: Distribution of charities and businesses by paid staff size category, core charities and businesses reporting paid staff, Nova Scotia, 2012.
63%
26%
7% 3% 3%
54%
33%
9% 3% 2%
1 to 4 5 to 19 20 to 49 50 to 99 100 or more
Paid staff size
Charities Businesses
businesses. Charities are also slightly less likely to have 20 to 49 paid
staff (7% of charities vs. 9% of businesses). The likelihoods of
businesses and charities having 50 or more paid staff are more or less
equal (Statistics Canada, n.d.-h).
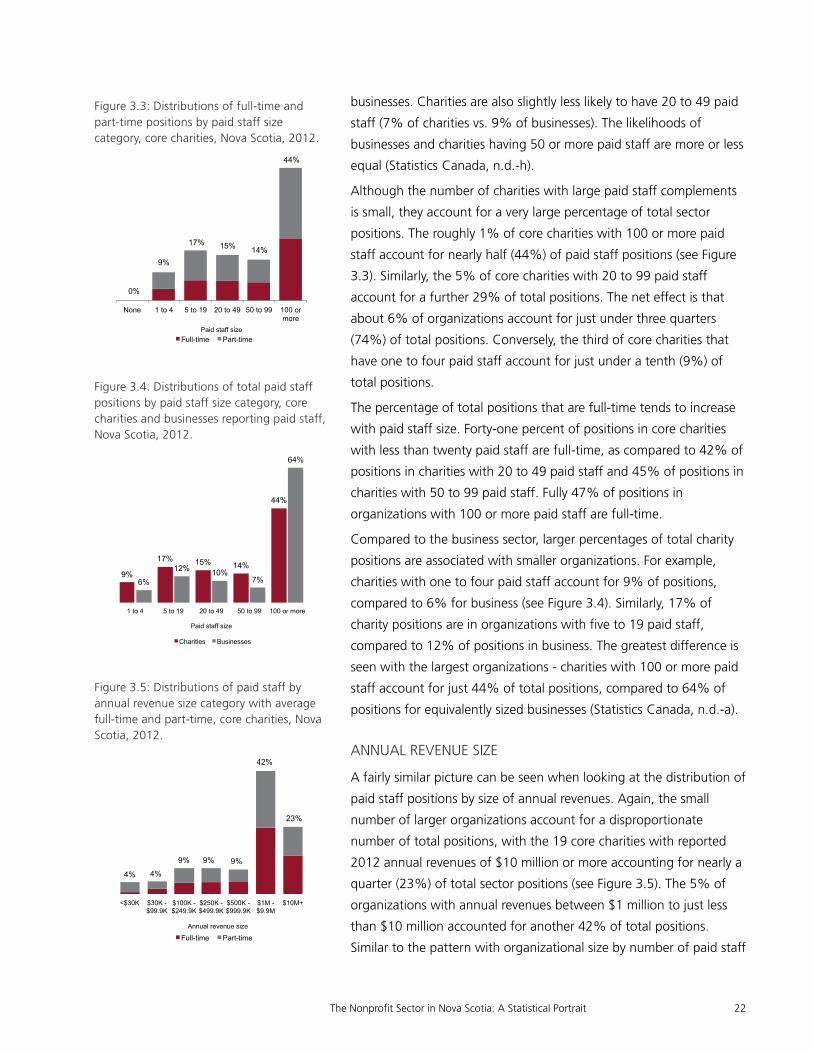
Although the number of charities with large paid staff complements
is small, they account for a very large percentage of total sector
positions. The roughly 1% of core charities with 100 or more paid
staff account for nearly half (44%) of paid staff positions (see Figure
3.3). Similarly, the 5% of core charities with 20 to 99 paid staff
account for a further 29% of total positions. The net effect is that
about 6% of organizations account for just under three quarters
(74%) of total positions. Conversely, the third of core charities that
have one to four paid staff account for just under a tenth (9%) of
total positions.
The percentage of total positions that are full-time tends to increase
with paid staff size. Forty-one percent of positions in core charities
with less than twenty paid staff are full-time, as compared to 42% of
positions in charities with 20 to 49 paid staff and 45% of positions in
charities with 50 to 99 paid staff. Fully 47% of positions in
organizations with 100 or more paid staff are full-time.
Compared to the business sector, larger percentages of total charity
positions are associated with smaller organizations. For example,
charities with one to four paid staff account for 9% of positions,
compared to 6% for business (see Figure 3.4). Similarly, 17% of
charity positions are in organizations with five to 19 paid staff,
compared to 12% of positions in business. The greatest difference is
seen with the largest organizations - charities with 100 or more paid
staff account for just 44% of total positions, compared to 64% of
positions for equivalently sized businesses (Statistics Canada, n.d.-a).
ANNUAL REVENUE SIZE
A fairly similar picture can be seen when looking at the distribution of
paid staff positions by size of annual revenues. Again, the small
number of larger organizations account for a disproportionate
number of total positions, with the 19 core charities with reported
2012 annual revenues of $10 million or more accounting for nearly a
quarter (23%) of total sector positions (see Figure 3.5). The 5% of
organizations with annual revenues between $1 million to just less
than $10 million accounted for another 42% of total positions.
Similar to the pattern with organizational size by number of paid staff
The Nonprofit Sector in Nova Scotia: A Statistical Portrait 22
Figure 3.3: Distributions of full-time and part-time positions by paid staff size category, core charities, Nova Scotia, 2012.
None 1 to 4 5 to 19 20 to 49 50 to 99 100 or more
Paid staff size Full-time Part-time
9%
17% 15% 14%
44%
0%
Figure 3.4: Distributions of total paid staff positions by paid staff size category, core charities and businesses reporting paid staff, Nova Scotia, 2012.
9%
17% 15% 14%
44%
6%
12% 10% 7%
64%
1 to 4 5 to 19 20 to 49 50 to 99 100 or more
Paid staff size
Charities Businesses
Figure 3.5: Distributions of paid staff by annual revenue size category with average full-time and part-time, core charities, Nova Scotia, 2012.
<$30K $30K - $99.9K
$100K - $249.9K
$250K - $499.9K
$500K - $999.9K
$1M - $9.9M
$10M+
Annual revenue size
Full-time Part-time
4%
9% 9% 9%
42%
23%
4%

positions, the largest organizations account for around two thirds of
total paid staff. Conversely, although about two thirds of core
charities have annual revenues less than $100,000 they account for
less than a tenth of total paid staff positions. Part-time staff positions
are much more common among smaller organizations. Core charities
with annual revenues of less than $30,000 report that on average
79% of their positions are part-time. An average of slightly over half
of positions are part-time for core charities with annual revenues
between $30,000 and $499,999. The role of full-time positions
increases steadily among organizations with annual revenues of
$500,000 or more, peaking at an average of 58% of positions
among those with $10 million or more in annual revenues.
ORGANIZATIONAL CAUSE
Social services (35%) and Health (30%) account for the majority of
total core charity paid staff positions (see Figure 3.6).15 Other major
sub-sectors include Religion (12% of positions), Arts & culture (6%),
and Education & research (6%). International charities account for
the smallest percentage of total positions (0.3%) followed by Law,
advocacy & politics (1%), and Fundraising, grantmaking &
voluntarism charities (1%).
The balance between full-time and part-time positions varies
significantly across sub-sectors. International organizations are most
oriented towards full-time staff (an average of 68% of positions are
full-time). Development & housing organizations report an average of
52% of positions as full-time and Law, advocacy & politics
organizations 50%. Part-time positions are most predominant among
organizations working in the areas of Arts & culture (83%),
Environment (80%) and Sports & recreation (77%). The consistently
high average percentages of total paid staff that are part-time
demonstrates how central part-time staff are to charities of all types.
Human Resources Trends
CHANGES IN PAID STAFF SIZE
The past decade has seen significant shifts in human resources
among Nova Scotia core charities. Most importantly, the number of
charities with no paid staff has increased appreciably. Since 2003, the
number of organizations with no paid staff has increased by
approximately 240. Over the same period, the number of
The Nonprofit Sector in Nova Scotia: A Statistical Portrait 23
Figure 3.6: Distribution of paid staff by sub-sector with average full-time and part-time positions, core charities, Nova Scotia, 2012.
Not elsewhere classified
International
Law, advocacy & politics
Fundraising, grantmaking & voluntarism
Environment
Development & housing
Sports & recreation
Education & research
Arts & culture
Religion
Health
Social services
Full-time Part-time
35%
30%
12%
6%
6%
3%
3%
2%
1%
1%
0.3%
1%

organizations with one to four paid staff has decreased by
approximately 220. The net effect has been that the number of
charities with no paid staff has increased by six percentage points,
from 44% in 2003 to 50% in 2012 and the percentage of charities
with one to four paid staff has decreased from 38% to 32% over the
same period (see Figure 3.7). Additionally, over the same period, the
number of core charities employing 50 or more paid staff has
increased by 24. This may sound like a small change, but it has had
significant effects - in 2003, core charities with paid staffs of 50 or
more accounted for 49% of total paid employment in the core
sector. By 2012, that percentage had increased to 58%.
From 2003 to 2012, the total number of positions reported by core
charities has increased by approximately a quarter (24%), going from
just over 20,000 to 25,000 (see Figure 3.8). The pace of increase has
been relatively constant, save for the period between 2005 and
2007, when the number of reported positions held more or less
constant. The vast majority of the increase (approximately 88%) was
in part-time positions. Over the same period, the total number of
individuals employed in Nova Scotia increased by approximately 6%
(Statistics Canada, n.d.-b).
CHANGES FULL-TIME VS. PART-TIME EMPLOYMENT
Since 2002, the percentage of total paid staff positions that are part-
time appears to have increased appreciably. In 2003, for core charities
that reported paid staff, the average percentage of positions that
were full-time was 52% (see Figure 3.9). By 2012, this percentage
had dropped steadily to 43%. It should be remembered that these
figures refer to absolute numbers of paid staff, rather than full-time
equivalents, the shift in terms of hours worked is somewhat smaller
than these figures indicate. That said, the directionality of the trend is
clear. It should be noted that this shift towards part-time employment
does not appear to be paralleled by shifts in employment generally.
The percentage of employed persons who are employed part-time in
Nova Scotia has remained more or less constant since 2003
(Statistics Canada, n.d.-b).
The shift towards increased percentages of total paid staff positions
being part-time appears to be driven by two factors – one, a decrease
in the number of organizations with less than five full-time paid staff
and two, an increase in the number of part-time employees (as
opposed to a decrease in the number of full-time employees). From
The Nonprofit Sector in Nova Scotia: A Statistical Portrait 24
Figure 3.7: Distributions of core charities by paid staff size category, Nova Scotia, 2003 and 2012.
44%
38%
13%
3% 1% 1%
50%
32%
13%
3% 1% 1%
None 1 to 4 5 to 19 20 to 49 50 to 99 100 or more
Paid staff size
2003 2012
Figure 3.8: Number of paid staff positions reported by core charities, Nova Scotia, 2003 to 2012.
20.1 21.5 22.0 22.4 22.3
23.1 24.3 24.7 25.2 25.0
2003 2004 2005 2006 2007 2008 2009 2010 2011 2012
Figure 3.9 Average percentage of total positions by full-time / part-time status, core charities, Nova Scotia, 2002 to 2012.
52% 50% 48% 48% 47% 46% 45% 44% 44% 43%
48% 50% 52% 53% 53% 54% 55% 56% 56% 57%
2003 2004 2005 2006 2007 2008 2009 2010 2011 2012
% Full-time % Part-time

2003, the percentage of core charities with one to four full-time paid
staff has decreased seven percentage points, from 33% to 26% of
organizations. Over the same period, the percentage of core charities
with no part-time paid staff has remained quite constant, while the
numbers of organizations with five or more part-time paid staff have
increased. The net effect is that fewer core charities are employing
full-time staff and the number of part-time staff they employ has
increased. From 2003, the average number of part-time positions
reported by core charities has increased from 2.6 to 3.8 in 2012 (see
Figure 3.10). Over the same period, the average reported number of
full-time positions has remained constant.
The Nonprofit Sector in Nova Scotia: A Statistical Portrait 25
13 Compared with other available data, it seems likely that T3010 filings report a higher number of part-time / part-year positions. Statistics Canada data tabulations show only 15,800 jobs for Nonprofit Institutions Serving Households. Given the scope differences (i.e., charities only vs. the mix of charities and nonprofits that make up NPISH), this seems quite a large divergence. Looking specifically the Religious organizations sub-component of NPISH (which should be almost entirely composed of charities), it is clear that the Statistics Canada tabulations report fewer jobs than T3010 returns report positions (2,400 vs. approximately 3,100) (Statistics Canada, n.d.-d). Given that the figures reported T3010 returns are extremely consistent year over year, because they have a clear, known scope and because they provide considerably richer data, we have chosen to emphasize the core charities analysis over NPISH tabulations, but readers should be aware that other estimates with different definitions and scopes exist.
14 Note that the number of paid staff positions includes both full-time and part-time / part-year positions.
15 For analysis by cause area, charities are assigned to categories based on the primary focus of the organization. For example, a charity that reported devoting 70% total effort to Health and 30% to Social services would be classified as a Health charity. In contrast, paid staff positions are allocated according to the degree of effort charities devote to a given cause area. In the example above, 70% of positions would be assigned to Health and 30% to Social services. This holds true both for full-time and part-time positions.
Figure 3.10: Average number of part-time and full-time positions, core charities, Nova Scotia, 2002 to 2012.
2.9 3.0 2.9 2.9 2.8 2.9 2.9 3.0 3.0 3.0
2.6 2.9 3.1 3.1 3.2 3.3 3.6 3.6 3.8 3.8
2003 2004 2005 2006 2007 2008 2009 2010 2011 2012
# Full-time # Part-time

4. SUPPORTS FROM INDIVIDUALS TO CORE CHARITIES AND NONPROFITS
This section of the report summarizes what is currently known about
the contributions of time and money Nova Scotians make to
organizations working in the core charitable and nonprofit sector.
The objective is to provide greater insight into the level of
contributions, who contributes, why they contribute, and what
factors affect the level of contribution. The main focus is on
describing the current situation, with any significant recent trends
included as the data indicates.
The next several sub-sections are all based on data from three waves
(2004, 2007, and 2010) of the Canada Survey of Giving,
Volunteering, and Participating (CSGVP). Every three years, this
telephone survey (conducted by Statistics Canada) asks Canadians
aged 15 and over about their contributions of time and money to
charitable and non-profit organizations. It covers a wide range of
topics, from levels of support for organizations, to personal and
economic characteristics of donors and volunteers, through methods
of donating and volunteering, to motivations and barriers faced by
supporters – with many other topics in between. While the survey
covers all of Canada and explores supports for all charities and
nonprofits, the results presented here focus specifically on Nova
Scotians’ support for core sector organizations (i.e., excluding
Hospitals, Universities, and Colleges).1 Because of this, readers may
note that the estimates presented here differ appreciably from
The Nonprofit Sector in Nova Scotia: A Statistical Portrait 26

estimates in other CSGVP-based publications, particularly those with
a national focus.
Giving
In 2010, just over 680,000 Nova Scotians made at least one donation
to a core charity or nonprofit, the equivalent of 86% of the
population aged 15 and over (see Table 4.1). These donors
contributed an average of $348 each to core organizations, for a
reported total of just under $238 million. Slightly under half of the
total amount donated ($115 million) went to religious organizations
(i.e., religious congregations and related organizations) and the
balance to non-religious organizations.2 Donors to religious
organizations contributed an average of $423 to religious
organizations, which was significantly larger than the average
contribution by donors to non-religious organizations ($185). While
religious organizations received significant financial support, it came
from a relatively narrow population base. Only about a third of Nova
Scotians (34%) reported donating to religious organizations,
compared to 84% for other core organizations. For this reason, much
of the analysis below will distinguish between donors to religious and
non-religious organizations.
In comparison to residents of other regions, Nova Scotians are more
likely to donate to non-religious core organizations than are residents
of Quebec (76% donated), Ontario (79%) or Western Canada (77%).
They tend to give larger average amounts than do Quebeckers
($155), but less than Ontarians and Westerners ($286 for both
groups).
In terms of donations to religious organizations, Nova Scotians are
less likely to donate than those who live elsewhere in Atlantic Canada
The Nonprofit Sector in Nova Scotia: A Statistical Portrait 27
Table 4.1: Donation rate and average donation amounts, donors to core organizations, non-religious core organizations, and religious organizations, 2010.
DONOR RATEDONOR RATEDONOR RATE AVERAGE DONATIONAVERAGE DONATIONAVERAGE DONATION
All Core Non-religious Religious All Core Non-religious Religious
Nova Scotia 86% 84% 34% $348 $185 $423
Other Atlantic 89% 86% 43% $354 $175 $383
Quebec 82% 76% 38% $187 $155 $91
Ontario 83% 79% 32% $490 $286 $568
Western 82% 77% 28% $512 $286 $716

(34% vs. 43%), but more likely to give than Westerners (28%). They
also give smaller donations to religious organizations, on average,
than Ontarians ($568) and Westerners ($716), but larger donations
than Quebeckers ($91).
GIVING AND DEMOGRAPHICS
Not all Nova Scotians are equally likely to donate to core
organizations, nor do they tend to contribute equal amounts when
they contribute. While personal and economic characteristics do not
determine individual behaviour, at the level of the population these
characteristics can have significant predictive value and provide a
better understanding of the contours of support for charitable and
nonprofit organizations. Table 4.2 presents a summary of how giving
to both religious and non-religious core organizations varies
according to the personal and economic characteristics of Nova
Scotians.
Multivariate analysis of the likelihood of donating shows that a few
key groups stand out from others. Those who are statistically more
likely to donate to non-religious core charities and nonprofits include:
• women (86% donated), and
• those who have more than a high school education,
particularly those who have some post-secondary
education (95%) or a university degree (92%).
People statistically less likely to donate include those:
• aged 25 to 34 (75% donated), and
• with household incomes less than $20,000 (62%).
Turning to the amounts donated, some groups again stand out from
others. Having made the decision to donate, those who tend to
donate larger amounts to non-religious core organizations include
those:
• 65 years of age and older ($236, on average),
• with a university degree ($288), and
• with annual household incomes of $100,000 or more
($264).
Those who stand out for donating smaller amounts to non-religious
organizations include those:
aged 15 to 24 ($86*),
• who have not graduated from high school ($84), and
The Nonprofit Sector in Nova Scotia: A Statistical Portrait 28
* Use with caution.

The Nonprofit Sector in Nova Scotia: A Statistical Portrait 29
Table 4.2: Giving to non-religious and non-religious core organizations by key demographic characteristics, Nova Scotia, 2010.
NON-RELIGIOUSNON-RELIGIOUS RELIGIOUSRELIGIOUS
Donor RateAverage Donation Donor Rate
Average Donation
Age group
15 to 24 79% $86* 17%* …
25 to 34 75% $131* 29% …
35 to 44 87% $223* 32% $219*
45 to 54 90% $180 36% $459*
55 to 64 85% $228 33% $358*
65 and over 82% $236 56% $594
Sex
Male 81% $202 28% $373
Female 86% $170 40% $456
Marital status
Married or common-law 87% $197 40% $422
Single, never married 76% $125 18% $286*
Widow or widower 86% $222 54% $759*
Separated or divorced 75% $253* 23% $182*
Education level
Less than high school 71% $84 27% …
Graduated from high school 75% $148* 29% $436*
Some postsecondary 95% $227* 33%* …
Postsecondary diploma 87% $162 39% $320
University degree 92% $288 37% $629*
Labour force status
Employed 87% $194 29% $365
Full-time 87% $205 28% $364*
Part-time 86% $144* 29% $371*
Unemployed 89% … 57%* …
Not in the labour force 78% $155 39% $459*
Household income
Less than $20,000 62% $90* 30% …
$20,000 to $39,999 82% $118 37% $471*
$40,000 to $59,999 80% $156 29% $337*
$60,000 to $99,999 89% $207 38% $416*
$100,000 or more 89% $264 33% $462*
Religious attendance
Weekly attender 90% $212 84% $728
Not a weekly attender 82% $178 25% $240*
* Use with caution.... Too unreliable to be published.

• with annual household incomes less than $20,000
($90*).
With regards to the likelihood of donating to religious organizations,
groups that stand out as being more likely to donate include those:
• who attend religious services on a weekly basis (84%
donated),
• who are widowed (54%), and
• who have household incomes between $20,000 and
$39,999 (37%) or $60,000 to $99,999 (38%).
Groups that are less likely to donate to religious organizations include
those:
• who do not attend religious services on a weekly basis
(25%), and
• who are single and have never been married (18%).
Having made the decision to donate, those who tend to contribute
larger amounts to religious organizations include those:
• aged 65 and over ($594 on average),
• who are widowed ($759*), and
• attend religious services on a weekly basis ($728).
Groups that stand out as tending to donate smaller amounts to
religious organizations include:
• those who are separated or divorced ($182*), and
• those who do not attend services on a weekly basis
($240*).
DONATING BY SUB-SECTOR
Nova Scotians are more likely to support charities and nonprofits
working in some sub-sectors than others. In 2010, a majority of Nova
Scotians donated to Health (58%) and Social services (51%)
organizations (see Figure 4.1). About a third (34%) donated to
Religion organizations, 29% to Education & research organizations
and a fifth to Sports & recreation organizations. The Arts & culture
and Development & housing sub sectors have the narrowest base of
support at 3%*.
As previously mentioned, Religion organizations tended to receive by
far the largest donation amounts from their donors ($423 on
average), followed by International organizations ($188; see Figure
4.2). Supporters of Education & research ($24), Business or
The Nonprofit Sector in Nova Scotia: A Statistical Portrait 30
Figure 4.1: Donor rate by sub-sector, core organizations, Nova Scotia, 2010.
5%*
3%*
3%*
7%
8%
9%
12%
20%
29%
34%
51%
58%
Other
Arts & culture
Development & housing
Environment
Law, advocacy & politics
International
Fundraising, grantmaking & voluntarism
Sports & recreation
Education & research
Religion
Social services
Health
Figure 4.2: Average donation amounts by sub-sector, core organizations, Nova Scotia, 2010.
$24
$36*
$48*
$52*
$53*
$69*
$78
$80
$99
$188
$423
Education & research
Business / Professional Associations & Unions
Law, advocacy & politics
Sports & recreation
Development & housing
Environment
Social services
Health
Fundraising, grantmaking & voluntarism
International
Religion
* Use with caution.

professional associations & unions ($36*) and Law, advocacy &
politics ($48*) organizations tended to contribute the smallest
amounts.
In terms of the proportion of total donations, Religion organizations
account for by far the largest part of total support at slightly under
half (49%) of total donation value (see Figure 4.3). This is driven by
the combination of very high average donation value and a fairly
broad base of support. Although Health organizations have by far the
broadest base of support, they receive about a third as much (16% of
total donation value) due to the much smaller average donation. A
very similar pattern is seen with Social services organizations (13%).
Although International organizations typically receive quite large
donations, their comparatively narrow base of support means they
account for a fairly modest percentage of total donation value (6%*).
Other sub-sectors account for even smaller percentages of total
donations.
Some causes are more central objects of focus for donors than
others. For example, supporters of Religion organizations are very
focused on this cause, allocating an average of 58% of their total
donation value to it (see Figure 4.4). Similarly, donors to International
organizations allocate 41% of their total donation value on this
cause. Other causes, such as Arts & culture (17%*), Development &
housing (22%), and Sports & recreation (24%) tend to receive much
lower percentages of their supporters’ total donation dollars.
Generally speaking, the lower the average percentage of total
donations a given cause receives, the greater the competition it faces
from other causes for donor dollars.
MOTIVATIONS AND BARRIERS TO GIVING
Potential motivations for giving are measured by asking donors if
each of six potential factors was a reason for their donations over the
previous year. Ideological motivations were by far the most common
reasons reported. Fully nine tenths of donors to core organizations
said they gave because they feel compassion towards those in need,
86% said they wanted to help a cause that they personally believe in,
and 80% said they donated because they want to make a
contribution to the community (see Figure 4.5). Just over two thirds
(70%) say that they donate because they have personally been
affected by the cause of the organizations they support. Somewhat
smaller numbers of donors to core organizations say that they
The Nonprofit Sector in Nova Scotia: A Statistical Portrait 31
Figure 4.3: Percentage of total donation value by sub-sector, core organizations, Nova Scotia, 2010.
1%*
1%*
2%*
2%
3%*
4%*
6%*
13%
16%
49%
Development & housing
Law, advocacy & politics
Environment
Education & research
Sports & recreation
Fundraising, grantmaking & voluntarism
International
Social services
Health
Religion
Figure 4.4: Average percentage of total core donations allocated to cause by donors to that cause, Nova Scotia, 2010.
39%
17%*
22%
24%
24%
27%
27%
33%
37%
39%
41%
58%
Other
Arts & culture
Development & housing
Sports & recreation
Education & research
Environment
Law, advocacy & politics
Social services
Fundraising grantmaking & voluntarism
Health
International
Religion
Figure 4.5: Motivations for giving, donors to core organizations, Nova Scotia, 2010.
23%
27%
70%
80%
86%
90%
Income tax credit
To fulfil religious obligations or beliefs
Personally affected by cause of organization
To make a contribution to the community
To help a cause in which personally believe
Feel compassion towards people in need
* Use with caution.
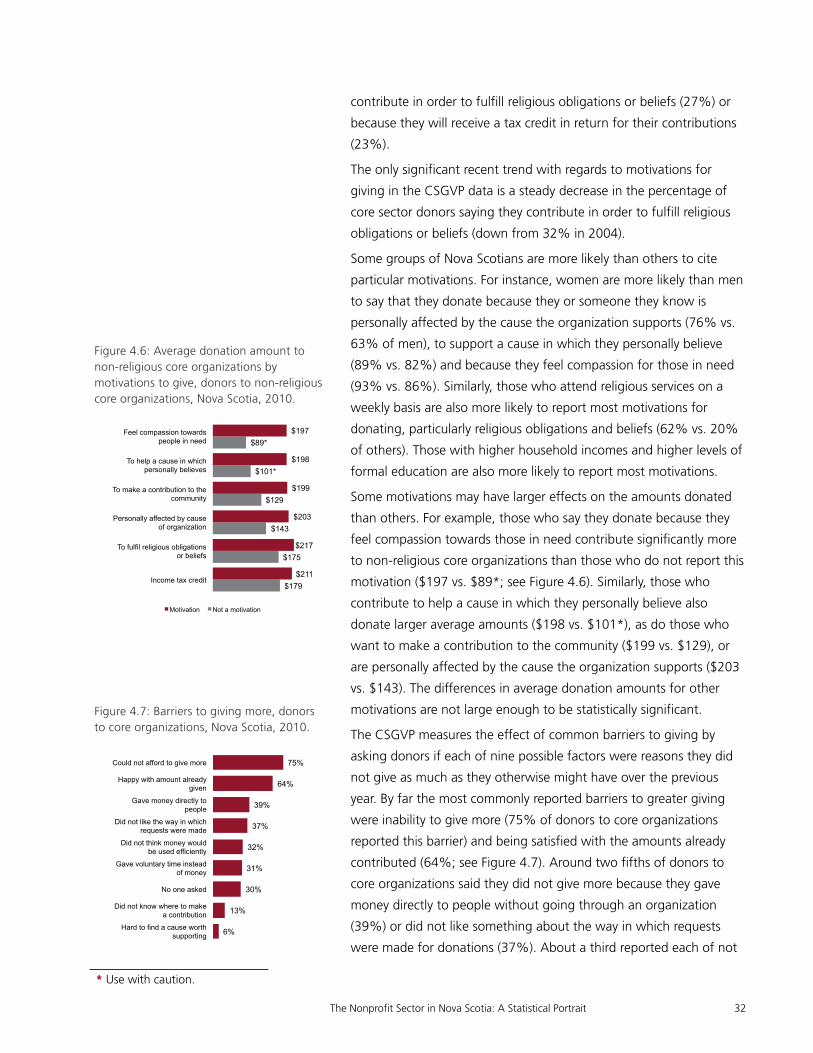
contribute in order to fulfill religious obligations or beliefs (27%) or
because they will receive a tax credit in return for their contributions
(23%).
The only significant recent trend with regards to motivations for
giving in the CSGVP data is a steady decrease in the percentage of
core sector donors saying they contribute in order to fulfill religious
obligations or beliefs (down from 32% in 2004).
Some groups of Nova Scotians are more likely than others to cite
particular motivations. For instance, women are more likely than men
to say that they donate because they or someone they know is
personally affected by the cause the organization supports (76% vs.
63% of men), to support a cause in which they personally believe
(89% vs. 82%) and because they feel compassion for those in need
(93% vs. 86%). Similarly, those who attend religious services on a
weekly basis are also more likely to report most motivations for
donating, particularly religious obligations and beliefs (62% vs. 20%
of others). Those with higher household incomes and higher levels of
formal education are also more likely to report most motivations.
Some motivations may have larger effects on the amounts donated
than others. For example, those who say they donate because they
feel compassion towards those in need contribute significantly more
to non-religious core organizations than those who do not report this
motivation ($197 vs. $89*; see Figure 4.6). Similarly, those who
contribute to help a cause in which they personally believe also
donate larger average amounts ($198 vs. $101*), as do those who
want to make a contribution to the community ($199 vs. $129), or
are personally affected by the cause the organization supports ($203
vs. $143). The differences in average donation amounts for other
motivations are not large enough to be statistically significant.
The CSGVP measures the effect of common barriers to giving by
asking donors if each of nine possible factors were reasons they did
not give as much as they otherwise might have over the previous
year. By far the most commonly reported barriers to greater giving
were inability to give more (75% of donors to core organizations
reported this barrier) and being satisfied with the amounts already
contributed (64%; see Figure 4.7). Around two fifths of donors to
core organizations said they did not give more because they gave
money directly to people without going through an organization
(39%) or did not like something about the way in which requests
were made for donations (37%). About a third reported each of not
The Nonprofit Sector in Nova Scotia: A Statistical Portrait 32
Figure 4.6: Average donation amount to non-religious core organizations by motivations to give, donors to non-religious core organizations, Nova Scotia, 2010.
$179
$175
$143
$129
$101*
$89*
$211
$217
$203
$199
$198
$197
Income tax credit
To fulfil religious obligations or beliefs
Personally affected by cause of organization
To make a contribution to the community
To help a cause in which personally believes
Feel compassion towards people in need
Motivation Not a motivation
Figure 4.7: Barriers to giving more, donors to core organizations, Nova Scotia, 2010.
6%
13%
30%
31%
32%
37%
39%
64%
75%
Hard to find a cause worth supporting
Did not know where to make a contribution
No one asked
Gave voluntary time instead of money
Did not think money would be used efficiently
Did not like the way in which requests were made
Gave money directly to people
Happy with amount already given
Could not afford to give more
* Use with caution.

thinking further money donated would be used efficiently (32%),
giving voluntary time rather than money (31%) and not having been
asked to make further contributions (30%). Small number of donors
to core organizations reported not knowing where to make further
contributions (13%) or being unable to find a cause worth
supporting (6%).
In terms of significant recent trends, the percentage of core sector
donors saying that they were happy with what they had already
contributed has decreased, from a high of 69% in 2004. Similarly,
the number of donors saying that they did not like something about
how requests for donations were made has decreased from 42% in
2004. Conversely, it appears that concerns about the efficient use of
donations are on the rise as can be seen by recent increases in the
percentage of donors reporting this barrier (up from 26% in 2007).
Most barriers do not appear to have strong relations with the
amounts donated, in that the average amounts contributed by
donors who report a given barrier are not statistically different from
donors who do not report the barrier. Probably the most important of
the exceptions is not being able to afford to donate more. Those who
reported this barrier contributed an average of $159 to core non-
religious organizations, as compared to $267 for those did not report
the barrier, over $100 more (see Figure 4.8). The other two
statistically significant barriers are actually correlated with higher
donation amounts. Those who say they did not donate more because
they did not like how requests were made gave and average of $247
vs. $148 for those who did not report the barriers. Similarly, those
who are happy with the amounts they have already given gave $207
vs. $142 for those who did not report this barrier.
DONATION METHODS
Nova Scotians are most likely to donate to core organizations by
sponsoring someone (44% said they used this method during 2010;
see Figure 4.9). They are next most likely to donate in response to an
appeal at the door (37%), followed by being asked in a public place,
such as in a shopping mall or on the street (32%). Slightly fewer
Nova Scotians donated at a church or other place of worship (29%),
in memory of someone (27%), or by attending some sort of charity
event such as a dinner or gala (26%). Quite few donated in response
to appeals broadcast on the television or by radio (6%) or in response
to a telephone appeal (7%). The overwhelming majority of donation
The Nonprofit Sector in Nova Scotia: A Statistical Portrait 33
Figure 4.8: Average donation amount to non-religious core organizations by barriers to giving more, donors to non-religious core organizations, Nova Scotia, 2010.
$267
$194
$194
$188
$180
$177
$174
$142
$148
$159
$132
...
...
$196
$206
$210
$207
$247
Could not afford to give more
No one asked
Did not know where to make a contribution
Hard to find a cause worth supporting
Gave money directly to people
Gave voluntary time instead of money
Did not think money would be used efficiently
Happy with amount already given
Did not like the way in which requests were made
Barrier Not a barrier
Figure 4.9: Donor rate by donation method, core organizations, Nova Scotia, 2010.
11%
6%
7%
7%
21%
23%
26%
27%
29%
32%
37%
44%
Other methods
TV, radio, telethon
Telephone
On own
At work
Charity event
In memoriam
Place of worship
Public place
Door-to-door
Sponsoring someone
... Too unreliable to be published.

activity appears to be as a result of being approached in some way –
just 7% of Nova Scotians said they made any donations on their own
initiative.
In general, how common a given method of donation is does not
closely correlate with the size of the individual donation. To the
extent that there is a correlation, it may be more correct to say that
likelihood of donating and typical donation size are negatively
correlated (i.e., all things being equal, less common methods seem to
be slightly more likely to be tied to larger donations). For example,
some of the most common methods tend to result in quite small
donations – the average value of a door-to-door donation is just $21
(see Figure 4.10). Similarly, donations to sponsor someone average
$25 and donations in response to appeals made in a public place
such as a shopping centre average just $17. Conversely, quite
uncommon donation methods such as donating on one’s own
initiative ($189* on average) and in response to an appeal on
television or the radio ($80*) can be associated with fairly high value
donations. It is important to understand that the associations are only
tendencies, but as will be seen below, they go a long way to
explaining why the likelihood of donating via any given method is
only loosely associated with its financial role.
In terms of financial impact, donations through place of worship
dwarf all other methods, accounting for nearly half of the total value
of donations to core organizations (44%; see Figure 4.11). Donations
by mail, the next ranking method, are only about a fifth as large,
accounting for 10% of total donation value. Quite common methods
that play quite a small financial role include door-to-door canvassing
(37% of Nova Scotians donated in this way, but these donations
account for just 4%* of donation value) and sponsoring someone
(44% of Nova Scotians, but 4% of value). Some methods that are
significantly less common, such as donating on the telephone (7% of
Nova Scotians vs. 1%* of value) and donating in response to a
television or radio appeal (6% of Nova Scotians vs. 2%* of value)
account for only modestly smaller percentages of total donation
value. In interpreting these results, it is important to keep in mind
that the vast majority of donations through place of worship go to
Religion organizations. As such, the importance of other methods for
other sub-sectors is roughly double what is shown in Figure 4.11.
The Nonprofit Sector in Nova Scotia: A Statistical Portrait 34
Figure 4.10: Average value of donations by donation method, core organizations, Nova Scotia, 2010.
$140
$17*
$21
$25*
$25
$50
$59
$70
$80*
$80*
$189*
$420
Other methods
Public place
Door-to-door
Telephone
Sponsoring someone
At work
In memoriam
Charity event
TV, radio, telethon
On own
Place of worship
Figure 4.11: Distribution of total value of donations by donation method, core organizations, Nova Scotia, 2010.
6%
1%*
2%*
2%*
4%*
4%
5%
6%*
7%
8%*
10%
44%
Other methods
Telephone
TV, radio, telethon
Public place
Door-to-door
Sponsoring someone
At work
On own
In memoriam
Charity event
Place of worship
* Use with caution.
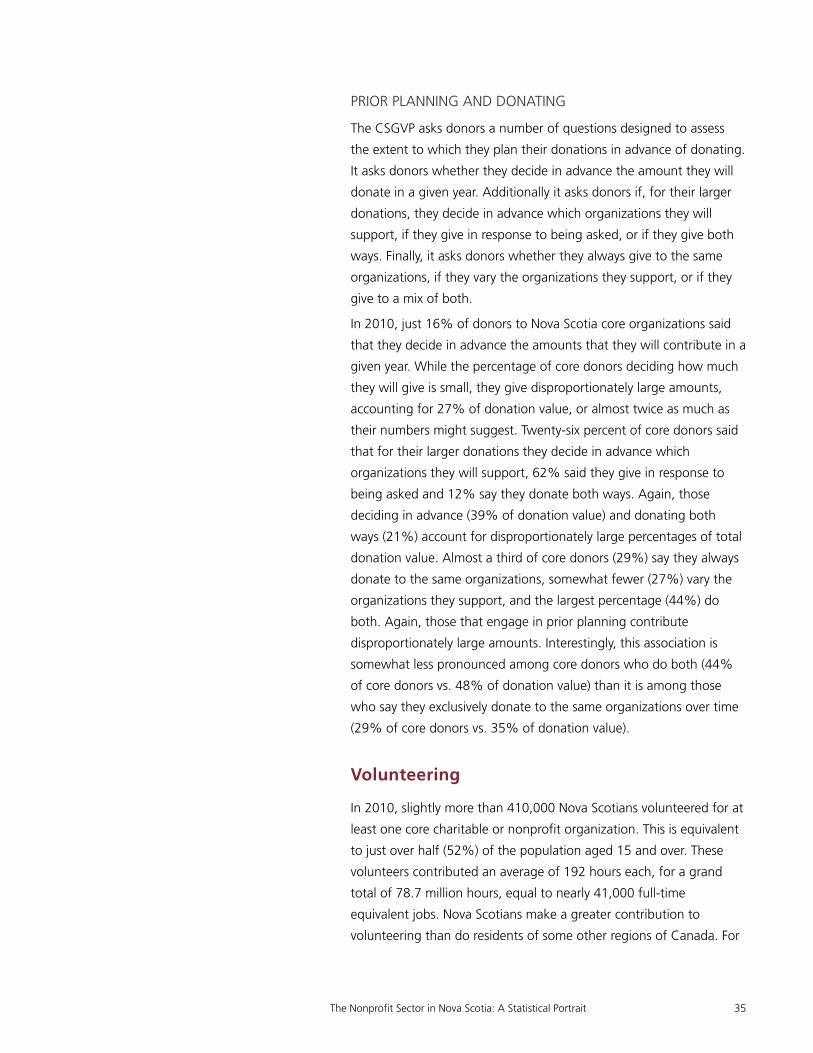
PRIOR PLANNING AND DONATING
The CSGVP asks donors a number of questions designed to assess
the extent to which they plan their donations in advance of donating.
It asks donors whether they decide in advance the amount they will
donate in a given year. Additionally it asks donors if, for their larger
donations, they decide in advance which organizations they will
support, if they give in response to being asked, or if they give both
ways. Finally, it asks donors whether they always give to the same
organizations, if they vary the organizations they support, or if they
give to a mix of both.
In 2010, just 16% of donors to Nova Scotia core organizations said
that they decide in advance the amounts that they will contribute in a
given year. While the percentage of core donors deciding how much
they will give is small, they give disproportionately large amounts,
accounting for 27% of donation value, or almost twice as much as
their numbers might suggest. Twenty-six percent of core donors said
that for their larger donations they decide in advance which
organizations they will support, 62% said they give in response to
being asked and 12% say they donate both ways. Again, those
deciding in advance (39% of donation value) and donating both
ways (21%) account for disproportionately large percentages of total
donation value. Almost a third of core donors (29%) say they always
donate to the same organizations, somewhat fewer (27%) vary the
organizations they support, and the largest percentage (44%) do
both. Again, those that engage in prior planning contribute
disproportionately large amounts. Interestingly, this association is
somewhat less pronounced among core donors who do both (44%
of core donors vs. 48% of donation value) than it is among those
who say they exclusively donate to the same organizations over time
(29% of core donors vs. 35% of donation value).
Volunteering
In 2010, slightly more than 410,000 Nova Scotians volunteered for at
least one core charitable or nonprofit organization. This is equivalent
to just over half (52%) of the population aged 15 and over. These
volunteers contributed an average of 192 hours each, for a grand
total of 78.7 million hours, equal to nearly 41,000 full-time
equivalent jobs. Nova Scotians make a greater contribution to
volunteering than do residents of some other regions of Canada. For
The Nonprofit Sector in Nova Scotia: A Statistical Portrait 35

example, a larger percentage of Nova Scotians volunteer for core
organizations than do residents of Quebec (34%) or Ontario (45%;
see Figure 4.12). Similarly, the average hours volunteered for core
organizations is higher in Nova Scotia than in Quebec (117) and
Western Canada (146).16
The Nonprofit Sector in Nova Scotia: A Statistical Portrait 36
Figure 4.12: Volunteer rate and average annual volunteer hours, core organizations, by region, 2010.
52% 49%
34%
45%
51%
192
145
117
152 146
Nova Scotia Other Atlantic
Quebec Ontario Western
Volunteer Rate Average Hours
Table 4.3: volunteering for core organizations by key demographic characteristics, Nova Scotia, 2010.
VOLUNTEER RATE AVERAGE HOURS
Age group15 to 24 60% …25 to 34 43% 123*35 to 44 64% 173*45 to 54 57% 258*55 to 64 48% 182*65 and over 39% 213SexMale 46% 187*Female 57% 195Marital statusMarried or common-law 53% 216Single, never married 55% 159*Widow or widower 32% 116*Separated or divorced 48% 98*Education levelLess than high school 36% …Graduated from high school 43% …Some postsecondary 64% 158*Postsecondary diploma 51% 176University degree 70% 203*Labour force statusEmployed 56% 165Full-time 55% 168*Part-time 62% 151*Unemployed … …Not in the labour force 49% 253*Household incomeLess than $20,000 29% …$20,000 to $39,999 37% 247*$40,000 to $59,999 55% 177*$60,000 to $99,999 57% 166*$100,000 or more 66% 172Religious attendanceWeekly attender 68% 293Not a weekly attender 49% 165
* Use with caution.... Too unreliable to be published.

DEMOGRAPHICS AND VOLUNTEERING
As with giving, not all Nova Scotians are equally likely to volunteer for
core organizations, nor do they tend to contribute the same number
of hours when they do volunteer. Again, it is important to remember
that although personal and economic characteristics have important
effects that are visible at the population level, they are not themselves
determinative. Groups that stand out as being particularly likely to
volunteer include:
• women (57% volunteered; see Table 3),
• those with either some post-secondary education (64%)
or a university degree (70%);
• those with higher household incomes, particularly those
between $60,000 and $99,999 (57%) or $100,000 or
more (66%), and
• those who attend religious services at least once a week
(68%).
Conversely, groups that stand out as being less likely to volunteer
include those aged 25 to 34 (43%) or 65 and older (39%).
Because of small sample sizes, it is difficult to draw many conclusions
about variations in the number of hours different groups tend to
contribute. However, a very few groups are sufficiently different that
they still stand out. Those with a university degree stand out in that
they tend to contribute larger numbers of hours (203 on average).
Those who attend religious services at least weekly also stand out as
tending to contribute substantially more hours (293) while those
attend services less frequently or do not attend services at all stand
out as tending to contribute fewer hours (165).
VOLUNTEERING BY SUB-SECTOR
Nova Scotians are most likely to volunteer for core organizations
working in the areas of Social services (14% volunteered) and Sports
& recreation (14%; see Figure 4.13). Around a tenth of Nova Scotians
volunteered for each of Religion (11%), Education & research (10%),
and Development & housing (9%). Roughly one in 14 (7%)
volunteered for Health organizations. Nova Scotians were least likely
to volunteer for Business and professional associations & unions (just
1%* volunteered), or organizations working in the areas of Arts &
culture (3%*) or Fundraising, grantmaking & voluntarism Promotion
(3%*).
The Nonprofit Sector in Nova Scotia: A Statistical Portrait 37
Figure 4.13: Volunteer rate by sub-sector, core organizations, Nova Scotia, 2010.
1%*
3%*
3%*
4%
7%
9%
10%
11%
14%
14%
Business / Professional Associations & Unions
Arts & culture
Fundraising, grantmaking & voluntarism
Environment
Health
Development & housing
Education & research
Religion
Sports & recreation
Social services
* Use with caution.

In terms of the hours contributed to the organizations they volunteer
for, Nova Scotians tend to contribute the largest numbers of hours to
Arts & culture (163* hours annually, on average), Religion (160*),
Social services (149*), and Sports & recreation (146*) organizations
(see Figure 4.14). They tend to volunteer somewhat fewer hours for
Development & housing (95) and Education & research (85*)
organizations. Health organizations tend to receive the lowest
number of hours (48* on average).
Collectively, Social services, Sports & recreation, and Religion
organizations receive over half of total volunteer hours contributed
by Nova Scotia volunteers. One fifth go to Social services (20%*) and
Sports & recreation (20%*). Religion organizations receive slightly
less (18%*; see Figure 4.15). These organizations receive large
percentages of total volunteer hours because they have fairly broad
bases of support and their supporters tend to volunteer fairly large
numbers of hours. Although the base of support for Education &
research organizations is fairly broad, these volunteers tend to
contribute relatively few hours compared to the three sub-sectors
mentioned above. The net effect is that this sub-sector accounts for a
fairly modest percentage of total volunteer hours (9%*). A very
similar pattern is seen with the Development & housing sub-sector,
which accounts for 8%* of total volunteer hours. The Arts & culture
sub-sector, on the other hand, accounts for a modest percentage of
total hours (6%*) by virtue of the fact of its narrow base of support,
as these supporters do tend to be quite generous with their time
when they volunteer.
MOTIVATIONS AND BARRIERS TO VOLUNTEERING
The CSGVP asks volunteers if any of eight key potential motivations
were important in their decisions to volunteer for the organization to
which they contributed the most hours. Substantially all volunteers
for core organizations agreed that they volunteered because they
wanted to make a contribution to their community (95%; see Figure
4.16). About four fifths (82%) said they volunteered because they
wanted to use their skills and experiences in support of a worthy
cause. Personal connections, either with the cause of the
organization or with other individuals, are important to many
volunteers. Nearly two thirds (63%) said they volunteered because
they were personally affected by the cause of the organization).
Similarly, 58% said they volunteer because their friends volunteer and
The Nonprofit Sector in Nova Scotia: A Statistical Portrait 38
Figure 4.14: Average annual volunteer hours by sub-sector, core organizations, Nova Scotia, 2010.
48*
85*
95
146*
149*
160*
163*
Health
Education & research
Development & housing
Sports & recreation
Social services
Religion
Arts & culture
Figure 4.15: Percentage of total volunteer hours by sub-sector, core organizations, Nova Scotia, 2010.
6%*
8%*
9%*
18%*
20%*
20%*
Arts & culture
Development & housing
Education & research
Religion
Sports & recreation
Social services
Figure 4.16: Motivations for volunteering, volunteers for core organizations, Nova Scotia, 2010.
18%
22%
49%
53%
58%
63%
82%
95%
Religious obligations or beliefs
Improve job opportunities
Network with or meet people
Explore own strengths
Friends volunteer
Personally affected by the cause of the organization
Use skills and experiences
Contribution to the community
* Use with caution.

49% volunteer in order to network or to meet new people. Just over
a fifth (22%) said that they volunteer in order to improve their job
opportunities, either in terms of finding a job or increasing their skills.
Volunteering to fulfill religious obligations or beliefs was relatively
uncommon, with just under a fifth of volunteers for core
organizations (18%) saying this was a reason they volunteered.
Some groups of volunteers for core organizations are more likely than
others to report particular motivations for more volunteering. Marital
status appears to be particularly important in this regard. For
instance, those who are married are more likely to volunteer because
they are personally affected by the cause the organization supports
(67% reported this). Similarly, those who are separated or divorced
are substantially less likely to say they volunteer because their friends
volunteer (31%*), and those who are single are more likely to say
they volunteer because they want to explore their own strengths
(65%). Frequency of attendance at religious services also appears to
be an important variable, though it is also correlated with age. Core
volunteers who attend religious services on a weekly basis are
substantially more likely to volunteer because of religious obligations
or beliefs (50% vs. 9% of those who do not attend services on a
weekly basis), but also because they want to meet and network with
people (62% vs. 48%). Conversely, they are less likely to volunteer as
a means to improve their job prospects (11% vs. 26%).
In terms of significant recent trends, the importance of friends
volunteering appears to be increasing rapidly. Currently, 58% of
volunteers say his motivation is important, compared to 51% in 2007
and 43% in 2004. Conversely, volunteering to fulfill religious
obligations or beliefs has become less common, being reported by
18% of volunteers in 2010, compared to 24% in 2007 and 22% in
2004.
Potential barriers to volunteering are measured in two key ways.
Volunteers are asked if any of ten potential barriers to volunteering
was a reason they did not volunteer as many hours as they might
otherwise have done during the previous year. Non-volunteers are
asked in any of the same potential barriers were reasons they did not
volunteer at all. In terms of barriers to volunteering more, time
factors predominate. The most commonly reported barrier keeping
volunteers for making greater contributions, is not having enough
time (73% of volunteers reported this barrier; see Figure 4.17). Just
over half of volunteers (56%) said they were unable to make a long-
The Nonprofit Sector in Nova Scotia: A Statistical Portrait 39
Figure 4.17: Barriers to volunteering more, volunteers for core organizations, Nova Scotia, 2010.
5%*
12%
15%
18%
19%
30%
30%
39%
56%
73%
Dissatisfied with a previous experience
Financial cost of volunteering
Did not know how to get involved
Health problems or physically unable
Had no interest
No one asked
Gave money instead of time
Gave enough time already
Unable to make long-term commitment
Did not have the time
* Use with caution.

term commitment to further volunteering. A significant percentage
of volunteers do not volunteer more because they consider
themselves to have volunteered enough time already (39%) or
because they have no interest in volunteering further (19%). Practical
challenges around recruitment are important barriers for some
volunteers, with 30% saying they had not been asked to volunteer
more time and 15% not knowing how they could become more
involved as volunteers. Health and financial barriers also have effects,
with 18% saying they have health challenges or disabilities that keep
them from volunteering and 12% saying that the financial costs
associated with volunteering are a barrier. About a third of volunteers
(30%) say that they do not volunteer more because they contribute
money instead of volunteering more time. Clearly, volunteering is
satisfying for the vast majority of those involved, as can be seen in
the fact that just 5%* of volunteers said that dissatisfaction with
previous volunteering experiences was a barrier to volunteering.
Among non-volunteers, time factors continue to predominate.
However, there are some important differences compared to
volunteers. Non-volunteers are more likely to say that they are unable
to make a long-term commitment (62% vs. 56% of volunteers), but
somewhat less likely to say that they do not have the time to
volunteer (61% vs. 73% of volunteers; see Figure 4.18). Non-
volunteers were much less likely to say they had already given
enough volunteer time previously (16% vs. 39% of volunteers), but
they were somewhat more likely to say that they simply had no
interest in volunteering (23% vs. 19% of volunteers). Recruitment
linked challenges are more prominent among non-volunteers, with
fully half (49%) saying that they had not been asked to volunteer (vs.
30% of volunteers) and just over a fifth (21%) saying they did not
know how to become more involved (vs. 15% of volunteers). Health
and financial barriers are also more potent among non-volunteers,
with significantly higher percentages saying that the financial costs of
volunteering (20% vs. 12% of volunteers) and health or disabilities
related challenges (31% vs. 18% of volunteers) kept them from
volunteering. Contributing money instead of time also appears to be
more common among non-volunteers (52% vs. 30%).
A few recent trends can be seen in the data. First, the numbers of
both volunteers and non-volunteers reporting dissatisfaction with
previous volunteering experiences have declined recently (11% of
volunteers reported this in 2007, compared to 5% in 2010; similarly,
The Nonprofit Sector in Nova Scotia: A Statistical Portrait 40
Figure 4.18: Barriers to volunteering at all, non-volunteers, Nova Scotia, 2010.
6%*
16%
20%
21%
23%
31%
49%
52%
61%
62%
Dissatisfied with a previous experience
Gave enough time already
Financial cost of volunteering
Did not know how to get involved
Had no interest
Health problems or physically unable
No one asked
Gave money instead of time
Did not have the time
Unable to make long-term commitment
* Use with caution.
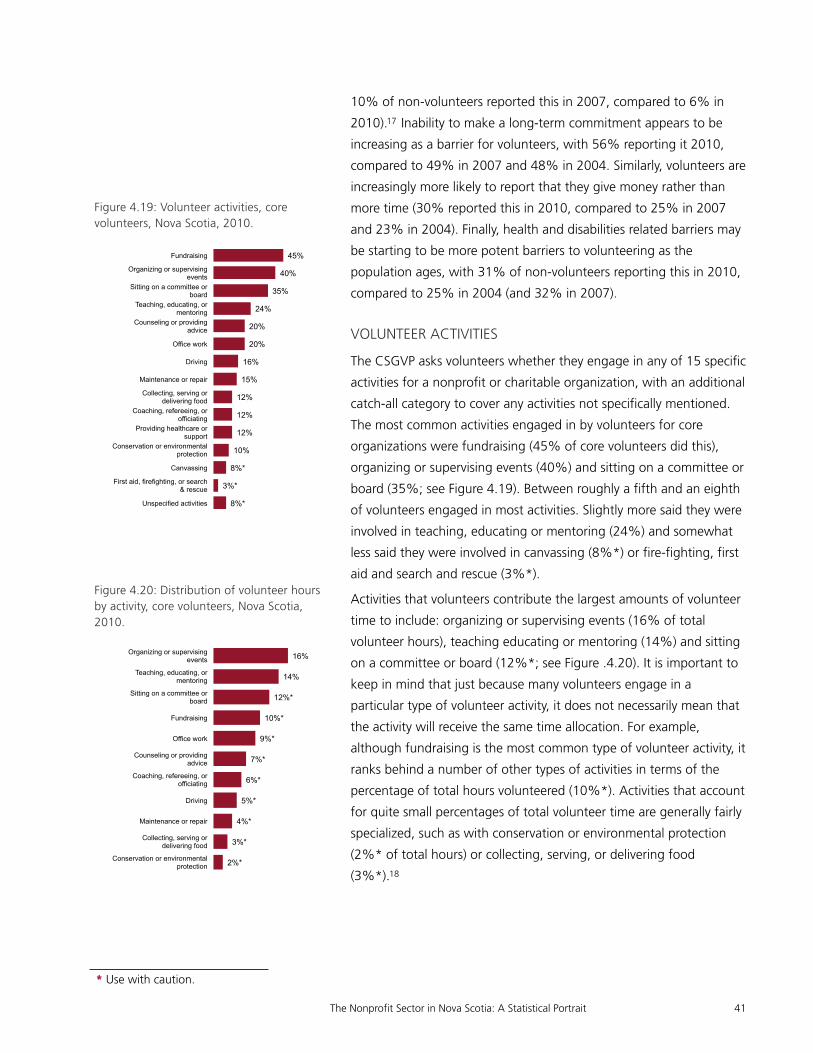
10% of non-volunteers reported this in 2007, compared to 6% in
2010).17 Inability to make a long-term commitment appears to be
increasing as a barrier for volunteers, with 56% reporting it 2010,
compared to 49% in 2007 and 48% in 2004. Similarly, volunteers are
increasingly more likely to report that they give money rather than
more time (30% reported this in 2010, compared to 25% in 2007
and 23% in 2004). Finally, health and disabilities related barriers may
be starting to be more potent barriers to volunteering as the
population ages, with 31% of non-volunteers reporting this in 2010,
compared to 25% in 2004 (and 32% in 2007).
VOLUNTEER ACTIVITIES
The CSGVP asks volunteers whether they engage in any of 15 specific
activities for a nonprofit or charitable organization, with an additional
catch-all category to cover any activities not specifically mentioned.
The most common activities engaged in by volunteers for core
organizations were fundraising (45% of core volunteers did this),
organizing or supervising events (40%) and sitting on a committee or
board (35%; see Figure 4.19). Between roughly a fifth and an eighth
of volunteers engaged in most activities. Slightly more said they were
involved in teaching, educating or mentoring (24%) and somewhat
less said they were involved in canvassing (8%*) or fire-fighting, first
aid and search and rescue (3%*).
Activities that volunteers contribute the largest amounts of volunteer
time to include: organizing or supervising events (16% of total
volunteer hours), teaching educating or mentoring (14%) and sitting
on a committee or board (12%*; see Figure .4.20). It is important to
keep in mind that just because many volunteers engage in a
particular type of volunteer activity, it does not necessarily mean that
the activity will receive the same time allocation. For example,
although fundraising is the most common type of volunteer activity, it
ranks behind a number of other types of activities in terms of the
percentage of total hours volunteered (10%*). Activities that account
for quite small percentages of total volunteer time are generally fairly
specialized, such as with conservation or environmental protection
(2%* of total hours) or collecting, serving, or delivering food
(3%*).18
The Nonprofit Sector in Nova Scotia: A Statistical Portrait 41
Figure 4.19: Volunteer activities, core volunteers, Nova Scotia, 2010.
8%*
3%*
8%*
10%
12%
12%
12%
15%
16%
20%
20%
24%
35%
40%
45%
Unspecified activities
First aid, firefighting, or search & rescue
Canvassing
Conservation or environmental protection
Providing healthcare or support
Coaching, refereeing, or officiating
Collecting, serving or delivering food
Maintenance or repair
Driving
Office work
Counseling or providing advice
Teaching, educating, or mentoring
Sitting on a committee or board
Organizing or supervising events
Fundraising
Figure 4.20: Distribution of volunteer hours by activity, core volunteers, Nova Scotia, 2010.
2%*
3%*
4%*
5%*
6%*
7%*
9%*
10%*
12%*
14%
16%
Conservation or environmental protection
Collecting, serving or delivering food
Maintenance or repair
Driving
Coaching, refereeing, or officiating
Counseling or providing advice
Office work
Fundraising
Sitting on a committee or board
Teaching, educating, or mentoring
Organizing or supervising events
* Use with caution.

THE ROLE OF MANDATORY COMMUNITY SERVICE
The CSGVP includes instances of mandatory community service or
mandated volunteering. In 2010, just over 7%* of volunteers for
core organizations said that they were required to volunteer for some
reason. Collectively, those who were required to volunteer accounted
for a fairly small percentage of total volunteer hours – non-
mandatory volunteers accounted for fully 94% of total volunteer
hours for core organizations.
The Nonprofit Sector in Nova Scotia: A Statistical Portrait 42
16 The statistical significance of the difference between average volunteer hours in Nova Scotia and the rest of the Atlantic provinces is 0.0548.
17 sig. 0.078.
18 Note that the survey results for hours devoted to other types of volunteer activities were too unreliable to be published.
* Use with caution.

5. ATTITUDES ABOUT CHARITIES
This section of the report presents highlights of what is currently
known about the opinions and attitudes Nova Scotians hold
regarding charities. Unlike in other chapters, the findings presented
here do not focus on core charities, but instead include attitudes and
beliefs about charities more broadly (i.e., including non-core
charities). The objective of this section is to provide useful insights
into public opinions about charities and the effects that these
opinions have on charities’ operations. The main focus is on providing
a brief snapshot of high level findings. A detailed exploration of
opinion and the factors that structure it is beyond the scope of this
section.
This section is based on data from The Muttart Foundation’s Talking
About Charities survey. The survey has been conducted five times
since 2000, most recently in 2013. The survey is administered by
telephone and includes Canadians 18 and over. The most recent
edition of the survey covered a wide range of topics, including levels
of trust in charities and their leaders, opinions about fundraising, the
quality of information that charities provide to stakeholders, business
and advocacy activities of charities, and perceived need for
monitoring and supervision of charities. The most recent edition of
the survey included responses from 303 Nova Scotians. While this is a
larger than usual sample size for a privately funded survey, it is
substantially smaller than with the CSGVP. This smaller sample size
means that we will be able to draw fewer statistically valid
comparisons.
The Nonprofit Sector in Nova Scotia: A Statistical Portrait 43

Trust in Charities and Charity Leaders
In 2013, just over four fifths (81%) of Nova Scotians said they had
some or a lot of trust in charities. Twice as many respondents had
“some” (54%) as opposed to “a lot” (27%) of trust. Overall levels of
trust in Nova Scotia were statistically indistinguishable from trust in
the rest of Canada (81% vs. 79% in the rest of Canada).
Not all specific types of charities are equally trusted by Nova Scotians.
Hospitals receive the highest levels of trust (90% had some or a lot of
trust in them), followed by Health organizations (81%) and
organizations that serve children or focus on children’s issues (81%;
see Figure 5.1). Other types of charities received lower levels of trust
than charities overall. Most differences were modest, but some were
quite considerable. For instance, religious organizations other than
places of worship were trusted by just 41% of respondents. Similarly,
International Development and Relief organizations were trusted by
slightly less than half (49%) of respondents. The only statistically
significant difference between Nova Scotia and the rest of Canada in
terms of levels of trust for specific types of charities is that Nova
Scotians have somewhat higher levels of trust in Hospitals (90% vs.
86% for the rest of Canada).
In interpreting these results, it is important to understand how levels
of trust in charities compare to levels of trust in other societal
institutions. Put simply, charities do very well compared to almost all
other institutions covered by the survey. While just over four fifths of
respondents said they had some or a lot of trust in charities (81%),
less than three fifths said the same of local government (56%) - and
the percentages are even lower for provincial (47%) and federal
(39%) governments (see Figure 5.2). Three fifths said they trusted the
media (59%) and one third (33%) said they trusted major
corporations. The only major societal institution included in the
survey with similar levels of trust to charities was small business
(84%).
In addition to asking about trust in charities as institutions, the survey
also asks about levels of trust in charity leaders. Here too, levels of
trust are fairly high. In 2013, just over three quarters (76%) of
respondents said they had some (59%) or a lot (17%) of trust in
charity leaders. Again, leaders of charities compare favourably to
leaders of many other types of institutions. The only individuals more
trusted by Nova Scotians were nurses (trusted by 97% of
The Nonprofit Sector in Nova Scotia: A Statistical Portrait 44
Figure 5.1: Level of trust by specific type of charity, Nova Scotia, 2013.
41%
49%
63%
65%
67%
71%
71%
75%
81%
81%
90%
Other religious
International
Places of worship
Arts
Environment
Social Services
Animals
Education
Children
Health
Hospitals
Figure 5.2: Levels of trust in societal institutions, Nova Scotia, 2013.
33%
39%
47%
56%
59%
81%
84%
Major corporations
Federal government
Provincial government
Local government
Media
Charities
Small business

respondents) and doctors (93%; see Figure 5.3). Government
employees (71%) and business leaders (69%) were broadly
comparable to charity leaders, but some other personalities trailed
significantly. The lowest levels of trust recorded by the survey were
with federal (37%) and provincial (41%) politicians.
Opinions about Fundraising
The Talking About Charities survey probes respondents for their
opinions about a number of aspects of fundraising. Having a clear
understanding of individual attitudes around fundraising is important
because it bears directly on charities’ ability to generate a key source
of revenue they depend on to carry out their missions. While some
attitudes about fundraising held by Nova Scotians are favourable, this
is certainly not universal. The overwhelming majority of respondents
agree that it takes significant effort for charities to raise the money
they need (95% strongly or somewhat agreed with this idea) and
nearly three quarters (72%) agreed that charities are generally honest
about the way they use donations (see Figure 5.4). However, 71%
said there are too many charities trying to raise money for the same
cause, and half were of the opinion that charities spend too much on
fundraising. The greatest skepticism was reserved for the idea that
charities only ask for money when they really need it. Less than one
third of respondents (31%) thought this was the case.
Other opinions around fundraising are generally consistent with the
results described above. Fully nine tenths of Nova Scotians said they
believe that charities should be required to disclose how donors’
contributions will be spent with every request for donations. Sixty-
seven percent strongly agreed with this idea and 23% somewhat
agreed. When asked about their expectations regarding how charities
should spend the money donors contribute, nearly three quarters of
Nova Scotians (73%) agreed most closely with a statement to the
effect that it is appropriate that some money go towards covering the
operating costs of the charity, as long as the costs are reasonable (the
other quarter of respondents agreed most closely with a statement to
the effect that all of the money donors contribute should go to the
charity’s cause). Opinion was mixed on whether there should be a
legal limit on the amounts that charities spend on fundraising. A
slight majority (51%) said charities should decide for themselves how
much it is reasonable to spend on fundraising. Forty-four percent
The Nonprofit Sector in Nova Scotia: A Statistical Portrait 45
Figure 5.3: Levels of trust in types of leaders, Nova Scotia, 2013.
37%
41%
52%
55%
60%
62%
69%
71%
76%
93%
97%
Federal politicians
Provincial politicians
Lawyers
Union leaders
Religious leaders
Journalists & reporters
Business leaders
Government employees
Charity leaders
Medical doctors
Nurses
Figure 5.4: Opinions about fundraising, Nova Scotia, 2013.
31%
50%
71%
72%
95%
Charities only ask for money when they really need it
Charities spend too much money on fundraising
Too many charities are trying to get donations for same
cause
Charities are generally honest about the way they
use donations
It takes significant effort for charities to raise money they
need to support their cause
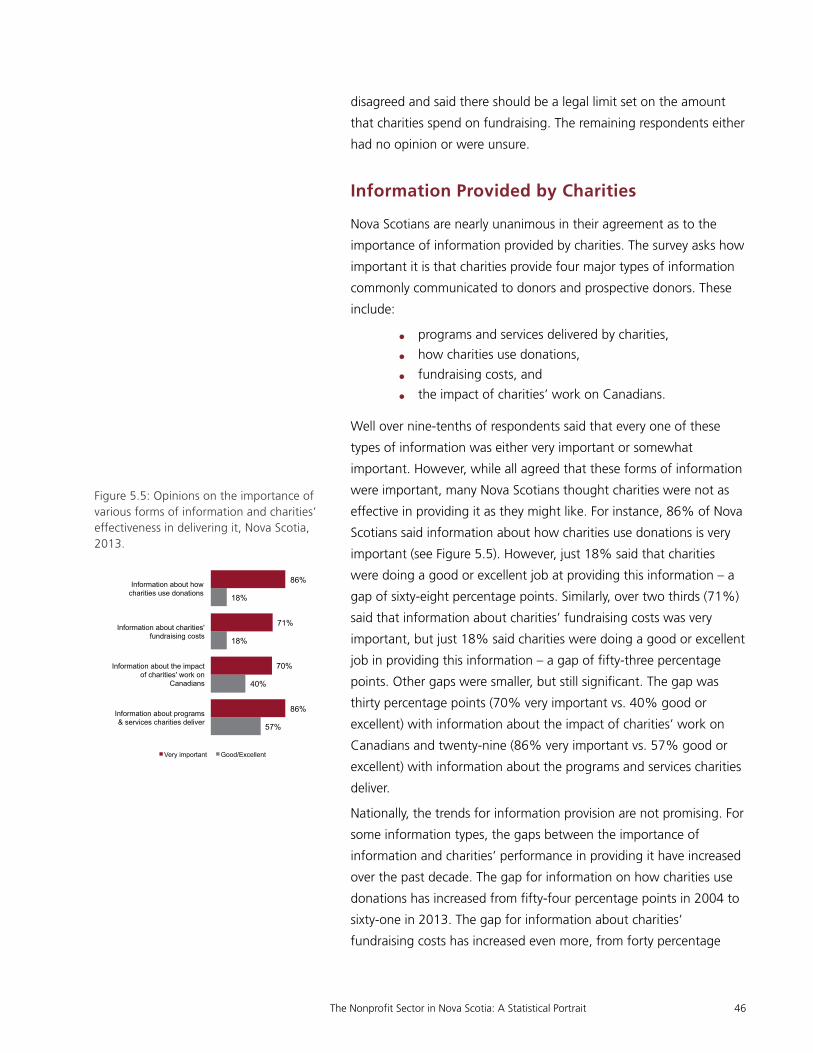
disagreed and said there should be a legal limit set on the amount
that charities spend on fundraising. The remaining respondents either
had no opinion or were unsure.
Information Provided by Charities
Nova Scotians are nearly unanimous in their agreement as to the
importance of information provided by charities. The survey asks how
important it is that charities provide four major types of information
commonly communicated to donors and prospective donors. These
include:
• programs and services delivered by charities,
• how charities use donations,
• fundraising costs, and
• the impact of charities’ work on Canadians.
Well over nine-tenths of respondents said that every one of these
types of information was either very important or somewhat
important. However, while all agreed that these forms of information
were important, many Nova Scotians thought charities were not as
effective in providing it as they might like. For instance, 86% of Nova
Scotians said information about how charities use donations is very
important (see Figure 5.5). However, just 18% said that charities
were doing a good or excellent job at providing this information – a
gap of sixty-eight percentage points. Similarly, over two thirds (71%)
said that information about charities’ fundraising costs was very
important, but just 18% said charities were doing a good or excellent
job in providing this information – a gap of fifty-three percentage
points. Other gaps were smaller, but still significant. The gap was
thirty percentage points (70% very important vs. 40% good or
excellent) with information about the impact of charities’ work on
Canadians and twenty-nine (86% very important vs. 57% good or
excellent) with information about the programs and services charities
deliver.
Nationally, the trends for information provision are not promising. For
some information types, the gaps between the importance of
information and charities’ performance in providing it have increased
over the past decade. The gap for information on how charities use
donations has increased from fifty-four percentage points in 2004 to
sixty-one in 2013. The gap for information about charities’
fundraising costs has increased even more, from forty percentage
The Nonprofit Sector in Nova Scotia: A Statistical Portrait 46
Figure 5.5: Opinions on the importance of various forms of information and charities’ effectiveness in delivering it, Nova Scotia, 2013.
57%
40%
18%
18%
86%
70%
71%
86%
Information about programs & services charities deliver
Information about the impact of charities' work on
Canadians
Information about charities' fundraising costs
Information about how charities use donations
Very important Good/Excellent

points to fifty-two over the same period. Gaps have remained much
more consistent for other information types. Interestingly, although
there are significant (and sometimes increasing) performance gaps
with respect to information provision, this does not necessarily
translate into demand for more information. Asked in the context of
their decision making around charitable donations, fully half of Nova
Scotians said they were comfortable with the amount of information
they have about the work charities do. Slightly fewer (47%) said they
would like more information, even if it might require more money to
be spent in communications. The remaining respondents were
unsure.
Opinions on the Need for Oversight of Charities
Substantial majorities of Nova Scotians agree that there is need for
more oversight of various aspects of charities’ activities. Nine tenths
thought there should be more attention devoted to the ways that
charities spend their money (62% strongly agreed with this and 28%
somewhat agreed; see Figure 5.6). Eighty-six percent thought that
more attention should be paid to the amounts that charities spend
on program activities (42% strongly agree and 43% somewhat
agree). There were broadly similar levels of agreement that there
should be more attention devoted to the amounts charities spend on
professional fundraisers and to the ways that charities raise money,
though the percentage of respondents strongly agreeing that there
needed to be more oversight of professional fundraisers (56%)
stands out as particularly high. Even nationally, there are few
statistically significant trends with respect to these questions. The
only exception appears to be decreased concern with how charities
raise money. In 2004, 88% of Canadians strongly or somewhat
agreed that more attention should be paid to this issue - by 2013,
that percentage had dropped to 80%.
Asked who they believe should be responsible for watching over the
activities of charities, nearly two-thirds of Nova Scotians (63%) said
they believed that some sort of independent organization or agency
that is not part of government, nor part of the charity should be
responsible. One fifth (20%) said some sort of government agency or
department should be responsible. Sixteen percent said the charity’s
board of directors should be responsible. Nationally, support for the
notion that a government department or agency should be
The Nonprofit Sector in Nova Scotia: A Statistical Portrait 47
Figure 5.6: Opinions on the need for greater oversight of charities’ activities, Nova Scotia, 2013.
44%
27%
43%
28%
38%
56%
42%
62%
More attention should be paid to the way charities
raise money
More attention should be paid to the amount of money
charities spend on hiring professionals to do their
fundraising
More attention should be paid to the amount of money
charities spend on program activities
More attention should be paid to the way charities
spend their money
Somewhat agree Strongly agree

responsible appears to be growing. In 2000, just 9% of Canadians
held this view, compared to 23% in 2013.
The Nonprofit Sector in Nova Scotia: A Statistical Portrait 48
APPENDIX A - CLASSIFICATION OF ORGANIZATIONAL PRIMARY ACTIVITY AREA AND CAUSE
This report uses a classification scheme based on the International
Classification of Nonprofit Organizations (ICNPO), developed by the
Johns Hopkins Comparative Nonprofit Sector Project (Salamon &
Anheier, 1996).
Arts & culture. Organizations working in the area of media and
communications, visual, graphic and performing arts, and
architecture. Also includes historical, literary and humanistic societies,
museums, zoos, and aquariums.
Sports & recreation. Sports clubs, recreation and social clubs, and
service clubs.
Education & research. Elementary, primary, and secondary
education. Vocational and technical schools and adult/continuing
education. Also includes research in medicine, science and
technology, social sciences and policy studies. Excludes universities
and colleges.
Health. Inpatient nursing homes, and psychiatric hospitals. Also
includes outpatient treatment and rehabilitation, public health and
wellness, crisis intervention, and emergency medical services.
Excludes hospitals and inpatient rehabilitation facilities.
Social services. Child welfare and child services, including day-care.
Youth services and youth welfare. Family services, services for the
handicapped and the elderly. Self-help and other personal Social
The Nonprofit Sector in Nova Scotia: A Statistical Portrait 49

services. Disaster and emergency prevention and control, shelters,
and refugee assistance. Income support and maintenance, material
assistance including food banks.
Environment. Pollution abatement and control, natural resources
conservation and protection, and environmental beautification and
open spaces. Animal protection and welfare, wildlife preservation and
protection, and veterinary services.
Development & housing. Economic, social and community
development. Housing associations and housing assistance.
Employment and training, including vocational rehabilitation and
sheltered workshops.
Law, advocacy & politics. Civic and advocacy organizations. Legal
services, crime prevention and public safety, rehabilitation of
offenders, support of victims and consumer protection. Political
parties and organizations.
Fundraising, grantmaking & voluntarism. Grantmaking and
fundraising organizations (e.g., federated fundraising organizations),
organizations providing support and services for the charitable sector,
voluntarism promotion and support.
International. Exchange, friendship and cultural programs.
Development assistance, international disaster and relief
organizations. International human rights and peace organizations.
Religion. Religious congregations and associations of congregations.
Seminaries, monasteries, etc.
Business and professional associations & unions. Business
associations, professional associations, and labour unions.
Not elsewhere classified. Organizations to do not fall into one of
the above categories.
The Nonprofit Sector in Nova Scotia: A Statistical Portrait 50

REFERENCES CITED
Karaphillis, George. (2013). Economic Impact of the Co-Operative
Sector. Webinar. Measuring the Co-operative Difference
Research Network. Ottawa. Retrieved from http://
www.cooperativedifference.coop/assets/files/
Webinar_materials/
GK_EconImpact_CoopDiff_Webinar_041013.pdf
Salamon, L. M., & Anheier, H. K. (1996). The International
Classification of Nonprofit Organizations: ICNPO-Revision 1,
1996 Working Papers of the Johns Hopkins Comparative
Nonprofit Sector Project, no. 19. Baltimore: The Johns
Hopkins Institute for Policy Studies.
Statistics Canada. (2009). Satellite Account of Non-profit Institutions
and Volunteering. Ottawa: Author.
Statistics Canada. (2010). Satellite account of non-profit institutions
and volunteering. Retrieved April 24, 2013, from http://
www.statcan.gc.ca/daily-quotidien/101217/dq101217b-
eng.htm
Statistics Canada. (n.d.-a). Table 281-0042 Employment by enterprise
size of employment (SEPH) for all employees, for selected
industries classified using the North American Industry
Classification System (NAICS). Retrieved September 26,
2014, from CANSIM (database)
Statistics Canada. (n.d.-b). Table 282 - 0087 - Labour force survey
estimates (LFS), by sex and age group, seasonally adjusted
and unadjusted, annual. Retrieved September 28, 2014,
from CANSIM (database)
Statistics Canada. (n.d.-c). Table 301-0006 Principal statistics for
manufacturing industries, by North American Industry
Classification System (NAICS), annual. Retrieved September
26, 2014, from CANSIM (database)
Statistics Canada. (n.d.-d). Table 383 - 0030 - Labour statistics by
business sector industry and by non-commercial activity
consistent with the industry accounts, provinces and
territories, annual. Retrieved September 28, 2014, from
CANSIM (database)
The Nonprofit Sector in Nova Scotia: A Statistical Portrait 51

Statistics Canada. (n.d.-e). Table 384-0037 Gross domestic product,
income-based, provincial and territorial, annual. Retrieved
September 26, 2014, from CANSIM (database)
Statistics Canada. (n.d.-f). Table 384-0038 Gross domestic product,
expenditure-based, provincial and territorial, annual.
Retrieved September 26, 2014, from CANSIM (database)
Statistics Canada. (n.d.-g). Table 384-0038 Gross domestic product,
expenditure-based, provincial and territorial, annual (dollars x
1,000,000). Retrieved September 26, 2014, from CANSIM
(database)
Statistics Canada. (n.d.-h). Table 551-0003 - Canadian business
patterns, location counts, employment size and North
American Industry Classification System (NAICS), national
industries, by Canada and provinces, semi-annual (number).
Retrieved August 14, 2014, from CANSIM (database)
Steele, Graham. (2012). Estimates and Supplementary Detail: for the
fiscal year 2012 - 2013. Halifax: Minister of Finance.
The Nonprofit Sector in Nova Scotia: A Statistical Portrait 52