Spectroscopic Target Selection in the Sloan Digital Sky Survey: The ...

The Astrophysical Journal Supplement Series, 203:21 (13pp), 2012 December doi:10.1088/0067-0049/203/2/21C© 2012. The American Astronomical Society. All rights reserved. Printed in the U.S.A.
THE NINTH DATA RELEASE OF THE SLOAN DIGITAL SKY SURVEY: FIRST SPECTROSCOPICDATA FROM THE SDSS-III BARYON OSCILLATION SPECTROSCOPIC SURVEY
Christopher P. Ahn1, Rachael Alexandroff2, Carlos Allende Prieto3,4, Scott F. Anderson5, Timothy Anderton1,Brett H. Andrews6, Eric Aubourg7, Stephen Bailey8, Eduardo Balbinot9,10, Rory Barnes5, Julian Bautista7,Timothy C. Beers11,12, Alessandra Beifiori13, Andreas A. Berlind14, Vaishali Bhardwaj5, Dmitry Bizyaev15,
Cullen H. Blake2, Michael R. Blanton16, Michael Blomqvist17, John J. Bochanski5,18, Adam S. Bolton1,Arnaud Borde19, Jo Bovy20,95, W. N. Brandt21,22, J. Brinkmann15, Peter J. Brown1,23, Joel R. Brownstein1,
Kevin Bundy24, N. G. Busca7, William Carithers8, Aurelio R. Carnero10,25, Michael A. Carr2,Dana I. Casetti-Dinescu26, Yanmei Chen27,28, Cristina Chiappini10,29, Johan Comparat30, Natalia Connolly31,Justin R. Crepp32,33, Stefano Cristiani34,35, Rupert A. C. Croft36, Antonio J. Cuesta37, Luiz N. da Costa10,25,
James R. A. Davenport5, Kyle S. Dawson1, Roland de Putter38,39, Nathan De Lee14, Timothee Delubac19,Saurav Dhital14,40, Anne Ealet41, Garrett L. Ebelke15,42, Edward M. Edmondson43, Daniel J. Eisenstein44,
S. Escoffier41, Massimiliano Esposito3,4, Michael L. Evans5, Xiaohui Fan45, Bruno Femenıa Castella3,4,Emma Fernandez Alvar3,4, Leticia D. Ferreira10,46, N. Filiz Ak21,22,47, Hayley Finley48, Scott W. Fleming21,49,50,
Andreu Font-Ribera8,51, Peter M. Frinchaboy52, D. A. Garcıa-Hernandez3,4, A. E. Garcıa Perez53, Jian Ge49,R. Genova-Santos3,4, Bruce A. Gillespie15, Leo Girardi10,54, Jonay I. Gonzalez Hernandez3, Eva K. Grebel55,
James E. Gunn2, Hong Guo56, Daryl Haggard57, Jean-Christophe Hamilton7, David W. Harris1, Suzanne L. Hawley5,Frederick R. Hearty53, Shirley Ho36, David W. Hogg16, Jon A. Holtzman42, Klaus Honscheid58, J. Huehnerhoff15,
Inese I. Ivans1, Zeljko Ivezic5,59,60, Heather R. Jacobson61,96, Linhua Jiang45, Jonas Johansson43,62,Jennifer A. Johnson6, Guinevere Kauffmann62, David Kirkby17, Jessica A. Kirkpatrick8,63, Mark A. Klaene15,
Gillian R. Knapp2, Jean-Paul Kneib30, Jean-Marc Le Goff19, Alexie Leauthaud24, Khee-Gan Lee64, Young Sun Lee12,Daniel C. Long15, Craig P. Loomis2, Sara Lucatello54, Britt Lundgren37, Robert H. Lupton2,
Bo Ma49, Zhibo Ma56, Nicholas MacDonald5, Claude E. Mack III14, Suvrath Mahadevan21,50, Marcio A. G. Maia10,25,Steven R. Majewski53, Martin Makler10,65, Elena Malanushenko15,42, Viktor Malanushenko15,42, A. Manchado3,4,
Rachel Mandelbaum2,36, Marc Manera43, Claudia Maraston43, Daniel Margala17, Sarah L. Martell55,66,Cameron K. McBride44, Ian D. McGreer45, Richard G. McMahon67,68, Brice Menard24,69, Sz. Meszaros3,4,
Jordi Miralda-Escude38,70, Antonio D. Montero-Dorta1,71, Francesco Montesano13, Heather L. Morrison56,Demitri Muna16, Jeffrey A. Munn72, Hitoshi Murayama24, Adam D. Myers73, A. F. Neto10, Duy Cuong Nguyen49,74,Robert C. Nichol43, David L. Nidever53, Pasquier Noterdaeme48, Sebastian E. Nuza29, Ricardo L. C. Ogando10,25,
Matthew D. Olmstead1, Daniel J. Oravetz15, Russell Owen5, Nikhil Padmanabhan37,Nathalie Palanque-Delabrouille19, Kaike Pan15, John K. Parejko37, Prachi Parihar2, Isabelle Paris48,75,
Petchara Pattarakijwanich2, Joshua Pepper14, Will J. Percival43, Ismael Perez-Fournon3,4, Ignasi Perez-Rafols38,Patrick Petitjean48, Janine Pforr11,43, Matthew M. Pieri43, Marc H. Pinsonneault6, G. F. Porto de Mello10,46,
Francisco Prada71,76,77, Adrian M. Price-Whelan78, M. Jordan Raddick69, Rafael Rebolo3,79, James Rich19,Gordon T. Richards80, Annie C. Robin81, Helio J. Rocha-Pinto10,46, Constance M. Rockosi82, Natalie A. Roe8,
Ashley J. Ross43, Nicholas P. Ross8, Graziano Rossi19,83, J. A. Rubino-Martin3,4, Lado Samushia43,84,J. Sanchez Almeida3,4, Ariel G. Sanchez13, Basılio Santiago9,10, Conor Sayres5, David J. Schlegel8,
Katharine J. Schlesinger6,82, Sarah J. Schmidt5, Donald P. Schneider21,22, Mathias Schultheis81, Axel D. Schwope29,C. G. Scoccola3,4, Uros Seljak8,51,63,85, Erin Sheldon86, Yue Shen44, Yiping Shu1, Jennifer Simmerer1,
Audrey E. Simmons15, Ramin A. Skibba45, M. F. Skrutskie53, A. Slosar86, Flavia Sobreira10,25, Jennifer S. Sobeck87,Keivan G. Stassun14,88, Oliver Steele43, Matthias Steinmetz29, Michael A. Strauss2,97, Alina Streblyanska3,
Nao Suzuki8, Molly E. C. Swanson44, Tomer Tal26, Aniruddha R. Thakar69, Daniel Thomas43,Benjamin A. Thompson52, Jeremy L. Tinker16, Rita Tojeiro43, Christy A. Tremonti27, M. Vargas Magana7,19,
Licia Verde38,70, Matteo Viel34,35, Shailendra K. Vikas89, Nicole P. Vogt42, David A. Wake26, Ji Wang49,Benjamin A. Weaver16, David H. Weinberg6, Benjamin J. Weiner45, Andrew A. West90, Martin White8,John C. Wilson53, John P. Wisniewski5,91, W. M. Wood-Vasey89,97, Brian Yanny92, Christophe Yeche19,
Donald G. York93, O. Zamora3,4, Gail Zasowski53, Idit Zehavi56, Gong-Bo Zhao43,94, Zheng Zheng1,Guangtun Zhu69, and Joel C. Zinn2
1 Department of Physics and Astronomy, University of Utah, Salt Lake City, UT 84112, USA2 Department of Astrophysical Sciences, Princeton University, Princeton, NJ 08544, USA
3 Instituto de Astrofısica de Canarias (IAC), C/Vıa Lactea, s/n, E-38200 La Laguna, Tenerife, Spain4 Departamento de Astrofısica, Universidad de La Laguna, E-38206 La Laguna, Tenerife, Spain5 Department of Astronomy, University of Washington, Box 351580, Seattle, WA 98195, USA
6 Department of Astronomy, Ohio State University, 140 West 18th Avenue, Columbus, OH 43210, USA7 APC, University of Paris Diderot, CNRS/IN2P3, CEA/IRFU, Observatoire de Paris, Sorbonne Paris Cite, F-75205 Paris, France
8 Lawrence Berkeley National Laboratory, One Cyclotron Road, Berkeley, CA 94720, USA9 Instituto de Fısica, UFRGS, Caixa Postal 15051, Porto Alegre, RS-91501-970, Brazil
10 Laboratorio Interinstitucional de e-Astronomia, LIneA, Rua Gal. Jose Cristino 77, Rio de Janeiro, RJ-20921-400, Brazil
1
The Astrophysical Journal Supplement Series, 203:21 (13pp), 2012 December Ahn et al.
11 National Optical Astronomy Observatory, 950 North Cherry Avenue, Tucson, AZ 85719, USA12 Department of Physics & Astronomy and JINA (Joint Institute for Nuclear Astrophysics), Michigan State University, East Lansing, MI 48824, USA
13 Max-Planck-Institut fur Extraterrestrische Physik, Giessenbachstraße, D-85748 Garching, Germany14 Department of Physics and Astronomy, Vanderbilt University, VU Station 1807, Nashville, TN 37235, USA
15 Apache Point Observatory, P.O. Box 59, Sunspot, NM 88349, USA16 Center for Cosmology and Particle Physics, Department of Physics, New York University, 4 Washington Place, New York, NY 10003, USA
17 Department of Physics and Astronomy, University of California, Irvine, CA 92697, USA18 Haverford College, Department of Physics and Astronomy, 370 Lancaster Avenue, Haverford, PA 19041, USA
19 CEA, Centre de Saclay, Irfu/SPP, F-91191 Gif-sur-Yvette, France20 Institute for Advanced Study, Einstein Drive, Princeton, NJ 08540, USA
21 Department of Astronomy and Astrophysics, 525 Davey Laboratory, The Pennsylvania State University, University Park, PA 16802, USA22 Institute for Gravitation and the Cosmos, The Pennsylvania State University, University Park, PA 16802, USA
23 George P. and Cynthia Woods Mitchell Institute for Fundamental Physics & Astronomy, Texas A. & M. University,Department of Physics and Astronomy, 4242 TAMU, College Station, TX 77843, USA
24 Kavli Institute for the Physics and Mathematics of the Universe (Kavli IPMU, WPI), Todai Institutes for Advanced Study,The University of Tokyo, Kashiwa 277-8583, Japan
25 Observatorio Nacional, Rua Gal. Jose Cristino 77, Rio de Janeiro, RJ-20921-400, Brazil26 Astronomy Department, Yale University, P.O. Box 208101, New Haven, CT 06520-8101, USA
27 Department of Astronomy, University of Wisconsin-Madison, 475 North Charter Street, Madison, WI 53703, USA28 Department of Astronomy, Key Laboratory of Modern Astronomy and Astrophysics, Nanjing University, Ministry of Education, Nanjing 210093, China
29 Leibniz-Institut fur Astrophysik Potsdam (AIP), An der Sternwarte 16, D-14482 Potsdam, Germany30 Laboratoire d’Astrophysique de Marseille, CNRS-Universite de Provence, 38 rue F. Joliot-Curie, F-13388 Marseille cedex 13, France
31 Department of Physics, Hamilton College, Clinton, NY 13323, USA32 Department of Astronomy, California Institute of Technology, Pasadena, CA 91125, USA
33 Department of Physics, 225 Nieuwland Science Hall, Notre Dame, IN 46556, USA34 INAF, Osservatorio Astronomico di Trieste, Via G. B. Tiepolo 11, I-34131 Trieste, Italy
35 INFN/National Institute for Nuclear Physics, Via Valerio 2, I-34127 Trieste, Italy36 Bruce and Astrid McWilliams Center for Cosmology, Department of Physics, Carnegie Mellon University, 5000 Forbes Avenue, Pittsburgh, PA 15213, USA
37 Yale Center for Astronomy and Astrophysics, Yale University, New Haven, CT 06520, USA38 Institut de Ciencies del Cosmos, Universitat de Barcelona/IEEC, Barcelona E-08028, Spain
39 Instituto de Fisica Corpuscular, University of Valencia-CSIC, E-46071 Valencia, Spain40 Department of Astronomy, Boston University, 725 Commonwealth Avenue, Boston, MA 02215, USA
41 Centre de Physique des Particules de Marseille, Aix-Marseille Universite, CNRS/IN2P3, F-13288 Marseille, France42 Department of Astronomy, MSC 4500, New Mexico State University, P.O. Box 30001, Las Cruces, NM 88003, USA43 Institute of Cosmology & Gravitation, Dennis Sciama Building, University of Portsmouth, Portsmouth PO1 3FX, UK
44 Harvard-Smithsonian Center for Astrophysics, Harvard University, 60 Garden Street, Cambridge, MA 02138, USA45 Steward Observatory, 933 North Cherry Avenue, Tucson, AZ 85721, USA
46 Universidade Federal do Rio de Janeiro, Observatorio do Valongo, Ladeira do Pedro Antonio 43, 20080-090 Rio de Janeiro, Brazil47 Faculty of Sciences, Department of Astronomy and Space Sciences, Erciyes University, 38039 Kayseri, Turkey
48 UPMC-CNRS, UMR7095, Institut d’Astrophysique de Paris, 98bis Boulevard Arago, F-75014 Paris, France49 Department of Astronomy, University of Florida, Bryant Space Science Center, Gainesville, FL 32611-2055, USA
50 Center for Exoplanets and Habitable Worlds, 525 Davey Laboratory, Pennsylvania State University, University Park, PA 16802, USA51 Institute of Theoretical Physics, University of Zurich, 8057 Zurich, Switzerland
52 Department of Physics & Astronomy, Texas Christian University, 2800 South University Drive, Fort Worth, TX 76129, USA53 Department of Astronomy, University of Virginia, P.O. Box 400325, Charlottesville, VA 22904-4325, USA
54 INAF, Osservatorio Astronomico di Padova, Vicolo dell’Osservatorio 5, I-35122 Padova, Italy55 Astronomisches Rechen-Institut, Zentrum fur Astronomie der Universitat Heidelberg, Monchhofstr. 12–14, D-69120 Heidelberg, Germany
56 Department of Astronomy, Case Western Reserve University, Cleveland, OH 44106, USA57 Center for Interdisciplinary Exploration and Research in Astrophysics, Department of Physics and Astronomy,
Northwestern University, 2145 Sheridan Road, Evanston, IL 60208, USA58 Department of Physics and Center for Cosmology and Astro-Particle Physics, Ohio State University, Columbus, OH 43210, USA
59 Department of Physics, Faculty of Science, University of Zagreb, Bijenicka cesta 32, 10000 Zagreb, Croatia60 Hvar Observatory, Faculty of Geodesy, Kaciceva 26, 10000 Zagreb, Croatia
61 Department of Physics and Astronomy, Michigan State University, East Lansing, MI 48823, USA62 Max-Planck Institute for Astrophysics, Karl-SchwarzschildStr 1, D-85748 Garching, Germany
63 Department of Physics, University of California, Berkeley, CA 94720, USA64 Max-Planck-Institut fur Astronomie, Konigstuhl 17, D-69117 Heidelberg, Germany
65 ICRA-Centro Brasileiro de Pesquisas Fısicas, Rua Dr. Xavier Sigaud 150, Urca, Rio de Janeiro, RJ-22290-180, Brazil66 Australian Astronomical Observatory, P.O. Box 296, Epping, NSW 1710, Australia
67 Institute of Astronomy, University of Cambridge, Madingley Road, Cambridge CB3 0HA, UK68 Kavli Institute for Cosmology, University of Cambridge, Madingley Road, Cambridge CB3 0HA, UK
69 Center for Astrophysical Sciences, Department of Physics and Astronomy, Johns Hopkins University, 3400 North Charles Street, Baltimore, MD 21218, USA70 Institucio Catalana de Recerca i Estudis Avancats, Barcelona E-08010, Spain
71 Instituto de Astrofısica de Andalucıa (CSIC), Glorieta de la Astronomıa, E-18080 Granada, Spain72 US Naval Observatory, Flagstaff Station, 10391 West Naval Observatory Road, Flagstaff, AZ 86001-8521, USA
73 Department of Physics and Astronomy, University of Wyoming, Laramie, WY 82071, USA74 Department of Physics and Astronomy, University of Rochester, Rochester, NY 14627-0171, USA
75 Departamento de Astronomıa, Universidad de Chile, Casilla 36-D, Santiago, Chile76 Campus of International Excellence UAM+CSIC, Cantoblanco, E-28049 Madrid, Spain
77 Instituto de Fısica Teorica, (UAM/CSIC), Universidad Autonoma de Madrid, Cantoblanco, E-28049 Madrid, Spain78 Department of Astronomy, Columbia University, New York, NY 10027, USA
79 Consejo Superior Investigaciones Cientıficas, E-28006 Madrid, Spain80 Department of Physics, Drexel University, 3141 Chestnut Street, Philadelphia, PA 19104, USA
81 Universite de Franche-Comte, Institut Utinam, UMR CNRS 6213, OSU Theta, Besancon F-25010, France82 UCO/Lick Observatory, University of California, Santa Cruz, 1156 High Street, Santa Cruz, CA 95064, USA
83 School of Physics, Korea Institute for Advanced Study, 85 Hoegiro, Dongdaemun-gu, Seoul 130-722, Republic of Korea
2

The Astrophysical Journal Supplement Series, 203:21 (13pp), 2012 December Ahn et al.
84 National Abastumani Astrophysical Observatory, Ilia State University, 2A Kazbegi Avenue, GE-1060 Tbilisi, Georgia85 Department of Astronomy, University of California, Berkeley, CA 94720, USA
86 Brookhaven National Laboratory, Bldg 510, Upton, NY 11973, USA87 Department of Astronomy and Astrophysics and JUNA, University of Chicago, Chicago, IL 60637, USA
88 Department of Physics, Fisk University, 1000 17th Avenue North, Nashville, TN 37208, USA89 PITT PACC, Department of Physics and Astronomy, University of Pittsburgh, Pittsburgh, PA 15260, USA
90 Department of Astronomy, Boston University, 725 Commonwealth Avenue, Boston, MA 02215, USA91 H. L. Dodge Department of Physics and Astronomy, University of Oklahoma, Norman, OK 73019, USA
92 Fermi National Accelerator Laboratory, P.O. Box 500, Batavia, IL 60510, USA93 Department of Astronomy and Astrophysics and the Enrico Fermi Institute, University of Chicago, 5640 South Ellis Avenue, Chicago, IL 60637, USA
94 National Astronomy Observatories, Chinese Academy of Science, Beijing 100012, ChinaReceived 2012 July 31; accepted 2012 September 18; published 2012 November 19
ABSTRACT
The Sloan Digital Sky Survey III (SDSS-III) presents the first spectroscopic data from the Baryon OscillationSpectroscopic Survey (BOSS). This ninth data release (DR9) of the SDSS project includes 535,995 new galaxyspectra (median z ∼ 0.52), 102,100 new quasar spectra (median z ∼ 2.32), and 90,897 new stellar spectra, alongwith the data presented in previous data releases. These spectra were obtained with the new BOSS spectrograph andwere taken between 2009 December and 2011 July. In addition, the stellar parameters pipeline, which determinesradial velocities, surface temperatures, surface gravities, and metallicities of stars, has been updated and refinedwith improvements in temperature estimates for stars with Teff < 5000 K and in metallicity estimates for stars with[Fe/H] > −0.5. DR9 includes new stellar parameters for all stars presented in DR8, including stars from SDSS-Iand II, as well as those observed as part of the SEGUE-2. The astrometry error introduced in the DR8 imagingcatalogs has been corrected in the DR9 data products. The next data release for SDSS-III will be in Summer 2013,which will present the first data from the APOGEE along with another year of data from BOSS, followed by thefinal SDSS-III data release in 2014 December.
Key words: atlases – catalogs – surveys
Online-only material: color figures
1. INTRODUCTION
The Sloan Digital Sky Survey III (SDSS-III; Eisenstein et al.2011) is an extension of the SDSS-I and II projects (York et al.2000). It uses the dedicated 2.5 m wide-field Sloan FoundationTelescope (Gunn et al. 2006) at Apache Point Observatory(APO), and fiber-fed multi-object spectrographs to carry outfour surveys to study dark energy through observations ofdistant galaxies and quasars (the Baryon Oscillation Sky Survey,BOSS), to understand the structure of the Milky Way Galaxy(SEGUE-2; and APOGEE), and to search for extrasolar planets(MARVELS). SDSS-III commenced in Fall 2008, and will carryout observations for six years through Summer 2014. The firstdata release of this phase of SDSS (and the eighth release overall,DR8; Aihara et al. 2011a) was made public in Winter 2011. Inaddition to all the data from SDSS-I and II (Abazajian et al.2009), DR8 included additional five-band imaging data over2500 deg2 over the Southern Galactic Cap, as well as stellarspectra from SEGUE-2.
This paper presents the ninth data release (DR9) from SDSS,including all survey-quality data from BOSS gathered through2011 July. BOSS (Dawson et al. 2012) uses new spectrographs(Smee et al. 2012) to obtain spectra of galaxies with 0.15 < z <0.8 and quasars with 2.15 < z < 3.5 to measure the scale of thebaryon oscillation peak in the correlation function of matter inorder to probe the geometry and dynamics of the universe. DR9includes the first year of BOSS data, and this paper describesthe characteristics of these data (summarized in Section 2), with
95 Hubble fellow.96 National Science Foundation Astronomy and Astrophysics PostdoctoralFellow.97 Corresponding authors.
a particular emphasis on how it differs from the spectroscopycarried out in SDSS-I and SDSS-II (Section 3).
The erratum to the DR8 paper (Aihara et al. 2011b) describesa systematic error in the astrometry in the imaging catalogs inDR8. This has now been fixed, as we describe in Section 4.
The SEGUE Stellar Parameters Pipeline (SSPP) fits detailedmodels to the spectrum of each star, to determine surface tem-peratures, metallicities, and gravities. It has been continuouslyimproved since its introduction in the sixth data release (DR6;Adelman-McCarthy et al. 2008; see also Lee et al. 2008a). InSection 5, we describe the improvements since DR8 that areincorporated into the DR9 outputs.
Section 6 describes how one can access the DR9 data, andwe conclude and outline the planned future data releases inSection 7.
2. SCOPE OF DR9
DR9 presents the release of the first 1.5 years of datafrom the SDSS-III BOSS spectroscopic survey. BOSS startedcommissioning in early Fall 2009, and began survey-qualityobservations on the night of 2009 December 5 (UTC-7; MJD55171). All processed data from that date until the summertelescope shutdown98 in 2011 July are included in DR9. Allraw data taken by the BOSS spectrograph from the start ofcommissioning (2009 September) up through and including2011 July 10 (MJD 55752) are also available as flat files aspart of the DR9 release, although the commissioning data areof quite poor quality, and do not always include data from both
98 The SDSS telescope pauses science operations during the month-long“monsoon” in July/August in the southwestern United States. This time isused for telescope maintenance and engineering work.
3

The Astrophysical Journal Supplement Series, 203:21 (13pp), 2012 December Ahn et al.
Table 1Contents of DR9
Imaginga Total Uniqueb
Area imaged 31637 deg2 14555 deg2
Cataloged objects 1231051050 469053874
New BOSS Spectroscopyc
Total Uniqueb
Spectroscopic footprint effective area · · · 3275 deg2
Platesd 831 819Spectra observede 829073 763425Galaxies 535995 493845CMASS galaxies 336695 309307LOWZ galaxies 110427 102890All quasars 102100 93003Main quasarsf 85977 79570Main quasars, 2.15 < z < 3.5g 59783 55047Ancillary program spectra 32381 28968Stars 90897 82645Standard stars 16905 14915Sky spectra 78573 75850
All Spectroscopy from SDSS-I/II/III
Total number of spectra 2674200Total number of useful spectrah 2598033
Galaxies 1457002Quasars 228468Stars 668054Sky 181619Unclassifiedi 62890
Notes.a These numbers are unchanged since DR8.b Removing all duplicates and overlaps.c See Bolton et al. (2012) for full details.d Twelve plates of the 831 observed plates were re-plugged and re-observed forcalibration purposes. Six of the 819 unique plates are different drillings of thesame tiling objects.e This excludes the small fraction of the observations through broken fibers orthose that fell out of their holes. There were 831,000 spectra attempted.f This counts only quasars from the main survey (Section 3.1.2), and does notinclude those from ancillary programs (Section 3.1.3) or that were used forcalibration purposes.g Quasars with redshifts in the range 2.15 < z < 3.5 provide the most signal inthe BOSS spectra of the Lyα forest.h Spectra on good or marginal plates. “Spectrum” refers to a combined setof sub-exposures that define a completed plate. Duplicates are from plates thatwere observed more than once, or are objects that were observed on overlappingplates.i Non-sky spectra for which the automated redshift/classification pipeline(Bolton et al. 2012) gave unreliable results, as indicated by the ZWARNING
flag.
spectrographs. DR9 also includes the spectroscopic data fromSDSS-I/II and SEGUE2; it is unchanged since DR8.
The details of the data included in DR9 are summarized inTable 1, and the footprints of the imaging and spectroscopic dataare shown in Figure 1. The imaging data and imaging catalogsare the same as in DR8, with the key update of an improvedastrometric solution to correct an error affecting objects at highdeclinations (Aihara et al. 2011b).
Figure 2 presents the distribution with look-back time ofspectroscopically confirmed stars, galaxies, and quasars fromBOSS in the DR9 data set. Figure 3 compares these distributionsto those of all previous SDSS spectra of galaxies and quasars.
All data released with DR9 are publicly available athttp://www.sdss3.org/dr9.
Figure 1. Distribution on the sky of all SDSS imaging (top; 14,555 deg2,same as DR8) and BOSS DR9 spectroscopy (bottom; 3275 deg2) in equatorialcoordinates (α = 0◦ is offset to the right in this projection). The Galacticequatorial plane is shown by the solid line. To make the image for BOSSspectroscopy, we simply plotted a sparse version of the BOSS quasar catalog(Paris et al. 2012).
Figure 2. Distribution with look-back time of the 82,645 stars, 493,845 galaxies,and 93,003 quasars with spectra in DR9 BOSS. Look-back time is basedon the observed redshift under the assumption of a flat ΛCDM cosmology(ΩM , ΩΛ, h) = (0.272,0.728,0.71) consistent with the joint cosmologicalanalysis of WMAP7 (Komatsu et al. 2011).
3. THE BARYON OSCILLATIONSPECTROSCOPIC SURVEY
When the universe was radiation-dominated, sound wavespropagated through the radiation–matter fluid at a significantfraction of the speed of light. They slowed dramatically aftermatter–radiation equality, and were frozen in after recombina-tion. Sound waves emanating from overdensities thus traveleda given distance, roughly 150 comoving Mpc (given standardcosmological parameters) from the initial perturbations; the re-sulting overdensity gives an excess in the clustering of matter atthis scale. This is the origin of the oscillations seen in the powerspectrum of the cosmic microwave background (e.g., Komatsuet al. 2011), and was first conclusively seen in the clusteringof galaxies from the Two Degree Field Galaxy Redshift Survey(Cole et al. 2005) and the SDSS (Eisenstein et al. 2005). Thisfeature in the galaxy or matter correlation function or powerspectrum is a standard ruler; measuring it as a function of
4

The Astrophysical Journal Supplement Series, 203:21 (13pp), 2012 December Ahn et al.
0.0 0.2 0.4 0.6 0.8 1.0Redshift
0
10000
20000
30000
40000
50000
60000#/
0.01
bin
inre
dshi
ft
Galaxies:LEGACY
Galaxies:BOSS
0.0 0.5 1.0 1.5 2.0 2.5 3.0 3.5 4.0Redshift
0
1000
2000
3000
4000
5000
#/0.
05bi
nin
reds
hift
Ly-α 2.15 < z < 3.5
Quasars:LEGACY
Quasars:BOSS
Figure 3. N (z) of BOSS spectra in DR9 compared to that of the SDSS-I/IILegacy spectra for galaxies (top) and quasars (bottom). BOSS’ focus on galaxieswith 0.4 < z < 0.6 and quasars with z > 2.15 is apparent. The BOSS quasarsin the bump from 0.5 < z < 0.9 are selected because of a degeneracy in colorspace between these lower-redshift quasars and those at z > 2.15.
redshift gives a powerful constraint on cosmological models(e.g., Weinberg et al. 2012).
The initial SDSS detection of the baryon oscillation feature(Eisenstein et al. 2005; see also Tegmark et al. 2006; Percivalet al. 2010; Padmanabhan et al. 2012) was based upon a galaxysample with effective mean redshift z ∼ 0.35. BOSS aimsto measure spectra (and thus redshifts) for a sample of 1.5million galaxies extending to z = 0.8 over 10,000 deg2, touse the baryon oscillation feature to make a 1% measurementof the angular diameter distance at z = 0.35 and a separateuncorrelated 1% measurement at z = 0.6. In addition, 150,000quasars with z > 2.15 will be observed to measure the clusteringof the Lyα forest, and thus to determine the baryon oscillationscale at z ∼ 2.5, an epoch before dark energy dominated theexpansion of the universe.
The samples of galaxies and quasars needed to carry out thisprogram are significantly fainter than those targeted in SDSS-Iand SDSS-II (Eisenstein et al. 2001; Strauss et al. 2002; Richardset al. 2002), and have a higher density on the sky. The SDSSspectrographs and supporting infrastructure were extensivelyrebuilt to increase throughput and observing efficiency, asdescribed in detail in Smee et al. (2012). In particular:
1. The optical fibers, which bring light from the focal plane tothe spectrographs, subtended 3′′ on the sky in SDSS-I/II.Given the smaller angular size of the higher redshift BOSSgalaxy targets, the fibers now subtend 2′′.
2. The number of fibers was increased from 640 to 1000.
3. New high-throughput volume phase holographic (VPH)gratings were installed.
4. The optics have been replaced, with improved throughput.5. The CCDs were replaced, with improved response at both
the blue and red limits.
The resulting spectra are broadly similar to those ofSDSS-I/II, but have significantly higher signal-to-noise ratio(S/N) at a given fiber magnitude. While the resolution as afunction of wavelength is similar, the spectral coverage is sig-nificantly broader, from 3600 Å to 10400 Å. Finally, the targetselection algorithms for galaxies (N. Padmanabhan et al. 2013,in preparation) and quasars (Ross et al. 2012) are significantlydifferent from those used in SDSS-I/II, given the rather differentscientific goals.
The design of the BOSS survey itself is described in detail inDawson et al. (2012). First baryon oscillation results from theDR9 galaxy sample may be found in Anderson et al. (2012) andreferences therein, and the first analysis of the clustering of theLyα forest from BOSS quasar spectra is found in Slosar et al.(2011).
3.1. BOSS Main Survey Targets
There are four broad categories of targets on the BOSSplates: galaxies (Section 3.1.1; see N. Padmanabhan et al. 2013,in preparation), quasars (Section 3.1.2; see Ross et al. 2012),ancillary targets (Section 3.1.3), and standards and calibrations(Dawson et al. 2012).
3.1.1. Galaxies
The SDSS-I/II Legacy survey targeted galaxies in two cat-egories: a magnitude-limited sample of galaxies in the r band(Strauss et al. 2002), with a median redshift of z ∼ 0.10, anda magnitude- and color-limited sample of fainter galaxies de-signed to select the most luminous red galaxies (LRG) at eachredshift (Eisenstein et al. 2001); the LRG sample is approx-imately volume limited to z ∼ 0.38, and includes galaxies toz ∼ 0.55. BOSS aims to measure large-scale clustering of galax-ies at higher redshifts and at lower luminosities (to sample thedensity field at higher space density), and thus targets signifi-cantly fainter galaxies.
The galaxy target selection algorithm is described in detail inN. Padmanabhan et al. (2013, in preparation). In brief, it usesthe DR8 imaging catalog to select two categories of objectsusing colors that track the locus of a passively evolving galaxypopulation with redshift (Maraston et al. 2009). The “LOWZ”subsample, containing about a quarter of all galaxies in BOSS,targets galaxies with 0.15 < z < 0.4 with colors similar toLRGs, but with lower luminosity; the space density of LOWZgalaxies is about 2.5 times that of the SDSS-I/II LRG sample.The constant-mass or “CMASS” sample, containing three timesmore galaxies than LOWZ, is designed to select galaxies with0.4 < z < 0.8. The rest-frame color distribution of thissample is significantly broader than that of the LRG sample,thus CMASS contains a nearly complete sample of massivegalaxies above the magnitude limit of the survey. The LOWZand CMASS samples together give a very roughly volume-limited sample, with space density of order 3 × 10⁻⁴ (h Mpc−3)to z ∼ 0.6, and a tail to z ∼ 0.8. In practice, it is somewhatdifficult to select objects at z = 0.45 as the 4000 Å break fallsbetween the g and r bands. The space density of the sample atthat redshift is consequently 25% lower.
5

The Astrophysical Journal Supplement Series, 203:21 (13pp), 2012 December Ahn et al.
The CMASS sample includes a “SPARSE” extension incolor space, to better understand incompleteness in the CMASSsample and to sample a population of fainter, bluer, and lessmassive galaxies. The galaxies were selected by extendingthe CMASS color–magnitude cut, and are sub-sampled at5 galaxies deg−2.
As described in N. Padmanabhan et al. (2013, in preparation),there was an error in the implementation of the LOWZ samplefor the early BOSS data (plate numbers 3987 and less); thesedata should be excluded from any analysis which requires auniform LOWZ sample.
The BOSS galaxy sample extends about half a magnitudefainter than the SDSS-I/II LRG sample, and thus the S/N ofthe spectra tend to be lower, despite the higher throughput ofthe spectrographs. Nevertheless, in DR9 the vast majority of thegalaxy targets are confirmed galaxies with confidently measuredredshifts: 95.4% of all CMASS targets and 99.2% of all LOWZtargets. The 4.6% of unsuccessful galaxy redshifts for CMASStargets are mostly erroneously targeted red stars. As described inSection 3.3, the S/N of the spectra is sufficient that higher-orderquantities (stellar masses, velocity dispersions, emission-lineproperties, and so on) can be measured for most objects.
3.1.2. Quasars
The BOSS Quasar Survey uses imaging data from DR8(Aihara et al. 2011a) to select its main spectroscopic targets.The aim is to observe z > 2.15 quasars, as for these objectsthe Lyα forest enters into the spectral coverage of the BOSSspectrographs. This is a challenging task, given the fact thatthe quasar locus in SDSS color space crosses that of F starsat z ∼ 2.7 (Fan 1999). Ross et al. (2012) give full details onthe BOSS quasar target selection methods that were used. Inbrief, we implemented and tested a range of methods over thecommissioning period and the first year of BOSS spectroscopy(Year One, ending in 2010 July). Quasar targets were selectedbased on their optical fluxes and colors, and properties in otherbands, including radio and near-infrared. Unlike the SDSS-I/IILegacy quasar sample (Richards et al. 2002), the BOSS quasarselection actively selects against quasars with redshifts less than2.15 (in particular, most ultraviolet excess sources).
As the main science goal of the BOSS quasar sample is toprobe the foreground hydrogen in the intergalactic medium,priority was placed on maximizing the surface density of z > 2quasars (McDonald & Eisenstein 2007; McQuinn & White2011), rather than aiming for a homogeneous data set. Thus thefull target selection is a complicated heterogeneous combinationof several methods, using ancillary data sets where available(Ross et al. 2012).
However, to allow statistical studies of quasar physical prop-erties, demographics, and clustering, we defined a subsample(called “CORE” in Ross et al. 2012) that will be uniformly se-lected throughout BOSS. It uses a single selection algorithm,the extreme deconvolution method (hereafter XDQSO) of Bovyet al. (2011), using single-epoch SDSS photometry. However,we settled on XDQSO only at the end of Year One, and thusthe CORE sample in the first year of data is not homoge-neous. CORE targets were allocated at 20 deg−2, of which∼10–15 deg−2 are confirmed spectroscopically to be quasars atz > 2. An additional 20 targets deg−2 (the “BONUS” sample)were selected using a heterogeneous set of selection criteriato maximize the surface density of high-z quasars; of these,∼5 deg−2 are found to be quasars at z > 2. In Year One, es-
pecially in the commissioning period, we increased the numberdensity of targets as we fine-tuned the selection algorithms.
Finally, given the improved throughput of the BOSS spectro-graphs and extended blue coverage, we re-observed all previ-ously known z > 2.15 quasars (most of which were discoveredby SDSS-I/II; see Schneider et al. 2010) to obtain higher S/Nin the Lyα forest.
Approximately half of the quasar targets observed in DR9were confirmed to be quasars spectroscopically; many of theremaining objects turn out to be F stars.
All quasar targets, plus all objects from other target algo-rithms spectroscopically identified as quasars via our automatedpipeline, have been visually inspected, and both automatedpipeline results and these visual redshifts and classificationsare provided in DR9. The resulting quasar catalog, togetherwith measurements of broad absorption lines and damped Lyαsystems, will be made public in Paris et al. (2012). A subsam-ple of BOSS quasar spectra suitable for Lyα forest analysis(z � 2.15) will be described in K.-G. Lee et al. (2012, in prepa-ration), which will provide additional products such as quasarcontinua, improved noise estimates, and pixel masks.
3.1.3. BOSS Ancillary Targets
In addition to the main galaxy and quasar programs, roughly3.5% of the BOSS fibers in DR9 were devoted to a series of25 small ancillary projects, each consisting of a few hundred toa few thousand targets. These programs, described in detail inAppendix A of Dawson et al. (2012), were selected via internalcollaboration review, and cover scientific goals ranging fromstudies of nearby stars to z > 4 quasars. The ancillary programsallow fibers to be used that would otherwise go unplugged inregions where the principal targets are more sparse than average.These spectra are processed with the same pipeline (D. Schlegelet al. 2012, in preparation; Bolton et al. 2012) as all the otherspectra.
A particular focus of many of these ancillary programs isthe roughly 220 deg2 in the Southern Galactic Cap covered by“Stripe 82” (−1.◦25 < δ < +1.◦25, 320◦ < α < 45◦) thatwas imaged repeatedly in SDSS (Adelman-McCarthy et al.2008). Using stacked photometry and variability information,for example, the quasar sample on Stripe 82 is particularlycomplete (e.g., Palanque-Delabrouille et al. 2011).
3.2. Differences between SDSS-I/II Spectraand SDSS-III BOSS Spectra
Readers who are familiar with the SDSS-I/II spectra will beable to use the BOSS spectra quickly, since the twin BOSSspectrographs are upgraded versions of the original SDSS-I/IIspectrographs, as described above. In addition, the pipelinesused to process the BOSS spectra (D. Schlegel et al. 2012,in preparation; Bolton et al. 2012) are improved versions ofthose used in SDSS-I/II. In this section, we briefly outline themain differences between the BOSS spectra and the SDSS-I/II spectra. For more detailed information on the BOSSspectrographs, the reader is referred to Smee et al. (2012), whilethe BOSS operations are described in Dawson et al. (2012).
The BOSS spectrographs include 1000 fibers in each plate, incomparison with 640 fibers per plate in SDSS-I/II. In addition,the spectral coverage has been increased from 3800–9200 Åto 3600–10400 Å. The dichroic split between the blue and redsides occurs at roughly 6000 Å, as it was in SDSS-I/II. Theexpanded blue coverage means that the Cd i arc line at 3610.51 Åis now included in the wavelength calibration, enabling a more
6

The Astrophysical Journal Supplement Series, 203:21 (13pp), 2012 December Ahn et al.
Figure 4. S/N per pixel distribution of DR9 BOSS plates (red), compared withthe equivalent for DR7 SDSS-I/II plates (black). The quantity shown is thesquare of the S/N, measured at a fiducial fiber magnitude. In SDSS-I andSDSS-II, these fiducial magnitudes differ somewhat (and the flux is measuredthrough a 3′′ fiber, not a 2′′ fiber); these effects have been accounted for in thisfigure to make a fair comparison.
(A color version of this figure is available in the online journal.)
accurate wavelength solution on the blue end (see the discussionin Adelman-McCarthy et al. 2008). The median resolution ofthe BOSS spectra remains R = λ/Δλ ≈ 2000 as in SDSS-I/II,with a similar wavelength dependence (Smee et al. 2012); theresolution ranges from R ≈ 1500 at 3700 Å, to R ≈ 2500 at9500 Å.
In addition, the diameter of the spectroscopic fibers in BOSShas been decreased in size from 3′′ to 2′′. While this improvesthe S/N for point-like objects and the smaller galaxies targetedby BOSS due to decreased sky background relative to the sourcesignal, the smaller fiber size affects the spectrophotometry forgalaxies, and is more subject to differential chromatic aberrationand seeing effects. As in SDSS-I/II, the spectrophotometry istied to the point-spread function (PSF) photometry of stars oneach plate. In SDSS-I/II, the rms scatter between the PSFphotometry and synthesized photometry from the calibratedspectra was of order 4% (Adelman-McCarthy et al. 2008);with BOSS, it is closer to 6% (Dawson et al. 2012, but seethe discussion below about quasar spectrophotometry). Thephotometric catalog released in DR8 and DR9 (Section 6)provides the 2′′ photometry (termed FIBER2MAG) for eachobject to complement 3′′ photometry (FIBERMAG).
The more sensitive CCDs, improved throughput of the VPHgratings, and improved optics have further improved the S/Nin the BOSS spectra, enabling the targeting of fainter objects.For each plate, the median log S/N per pixel within wavelengthregions corresponding to the SDSS imaging bands g, r , and i(Fukugita et al. 1996) is tabulated against the corresponding 2′′fiber magnitude. A line of slope 0.3 is fit to this line, and theintercept at the fiducial magnitudes of g = 21.2, r = 20.2, andi = 20.2 is noted. This quantity is compared for SDSS DR7 andBOSS plates in Figure 4. The median exposure times of BOSSDR9 plates (1.5 hr) are only 70% longer than those in SDSS-
I/II (0.89 hr), but due to the instrument upgrades, the resulting(S/N)2 values of the BOSS spectra are more than twice those inSDSS-I/II at the same magnitude.
Because one of the stated goals of the BOSS survey is tostudy the Lyα forest absorption in quasars, efforts have beenmade to improve the S/N at the blue end of the BOSS objectstargeted as quasars. In particular, the focal plane of the SDSStelescope was designed to be in focus for BOSS at ∼5400 Å,whereas the z ∼ 2.5 Lyα forest lies at λ � 4000 Å, a wavelengththat will be out of focus and offset radially due to differentialchromatic aberration. To correct for this, we have offset thequasar target fibers in both the radial and axial directions tomaximize the throughput at λ ∼ 4000 Å. The radial offsetwas implemented by drilling the quasar plug holes at slightlydifferent positions (depending on the assumed hour angle atwhich the plate will be observed), while in the axial direction wehave introduced thin washers to the plug holes on the fiber sideof the plates, with thicknesses of 175 and 300 μm in the regionsspanning 1.02–1.34 deg and 1.34–1.50 deg radially from theplate center, respectively (Dawson et al. 2012). These offsets aretabulated in the ZOFFSET and LAMBDA_EFF flags in the surveydata (Section 6).
The current pipeline flux calibration (D. Schlegel et al. 2012,in preparation) does not take these fiber offsets into account,therefore the spectrophotometry of the objects in the quasartargets is biased toward bluer colors, with excess flux relativeto the SDSS imaging data at λ < 4000 Å and a flux decrementat longer wavelengths (Paris et al. 2012). We have measuredthe mean difference between spectrophotometric and imagingmagnitudes for those objects targeted as quasars but that turnedout to be stars99—the values are (0.11 ± 0.24, 0.16 ± 0.29,0.24 ± 0.33) mag in (g, r, i). Objects observed at higher airmassshow larger offsets.
Quasars targeted solely as part of ancillary programs werenot subject to these offsets, and thus their spectrophotometryshould show no significant bias. Of course, these objects willhave reduced S/N in the blue. However, some quasars targetedin ancillary programs were also targets in the main CORE orBONUS samples; these ancillary quasars do have the washeroffsets applied (at least after MJD 55441, when the washerswere first applied; see Section 3.4 below).
DR9 includes new BOSS observations of objects observedwith the previous spectrograph in SDSS-I/II. This includes4074 galaxies, 16,967 quasars (mostly specifically re-targetedto obtain better Lyα forest measurements), and 7875 stars. Therepeated galaxy and star observations confirm that the redshiftscales of the two data sets are consistent within a few km s−1.However, due to an updated set of quasar templates in the BOSSpipeline (Bolton et al. 2012), quasar redshifts are 175 km s−1
higher in the median in BOSS than in SDSS-I/II. The limitationsof the quasar redshifts in previous data releases were highlightedby Hewett & Wild (2010) in a reanalysis of DR6 quasar redshifts.While the new templates are designed to more fully representthe range of quasars found, obtaining accurate redshifts remainschallenging because of the uncertainty in the relative velocityoffsets of different emission lines from the rest frame of thequasar host galaxy system. See Paris et al. (2012) and Boltonet al. (2012) for a discussion of the details and caveats of quasarredshift determination in DR9.
99 We exclude quasars from this comparison to avoid introducing intrinsicquasar variability between the time the photometry and spectroscopy werecarried out into the comparison between the two different magnitudes.
7

The Astrophysical Journal Supplement Series, 203:21 (13pp), 2012 December Ahn et al.
Figure 5. A galaxy (upper panels) and a quasar (lower panels) that were observed in both SDSS-I/II (as released in DR7) and BOSS. These spectra are unsmoothed. Inaddition to the extended BOSS wavelength coverage from 3600 to 10400 Å, the estimated noise per pixel (red line) is lower at every wavelength for the BOSS spectra,particularly at the red and blue ends of the spectrum. This is consistent with the higher S/N of the BOSS spectra shown in the distributions in Figure 4. Because theSDSS-I/II spectra are observed through 3′′ fibers, while the BOSS spectra use 2′′ fibers, one does not expect the galaxy spectra to be identical.
(A color version of this figure is available in the online journal.)
Figure 5 shows spectra of a galaxy and a quasar, observed bothwith SDSS-I/II and BOSS. This figure illustrates the greaterwavelength coverage and the significantly higher S/N of theBOSS spectra for observations of the same object.
3.3. Quantities Derived from Galaxy Spectra
The spectroscopic pipeline (Bolton et al. 2012) initiallyclassifies all spectra without regard to its imaging data. Thatis, each object is tested against galaxy, quasar, and stellartemplates, regardless of how it was targeted. However, in BOSS,we found that galaxy targets were often incorrectly matched toquasar templates with unphysical fit parameters, e.g., negativecoefficients causing a quasar template emission line to fit agalaxy absorption feature. Thus, for galaxy targets in BOSS, thebest classification and redshift are selected only from the fits tothe galaxy and star templates. The resulting quantities are listedwith the suffix _NOQSO in the DR9 database. Results withoutthis template restriction are also made available.
In addition, we have computed a variety of derived quantitiesfrom the galaxy spectra following the spectroscopic pipeline,applying stellar population models to derive stellar masses,emission-line fluxes and equivalent widths, stellar and gaskinematics, and velocity dispersions (Chen et al. 2012; Marastonet al. 2012; Thomas et al. 2012).
Each of the stellar population models is applied to all objectsthat the spectroscopic pipeline calls a galaxy with a reliableand positive definite redshift (i.e., CLASS_NOQSO=“GALAXY”and ZWARNING_NOQSO= 0 and Z_NOQSO> Z_ERR_NOQSO> 0;see Bolton et al. 2012).
1. Portsmouth spectrophotometric stellar masses (Marastonet al. 2012) are calculated using the BOSS spectroscopicredshift, Z_NOQSO, and u, g, r, i, z photometry by meansof broadband spectral energy distribution (SED) fitting ofpopulation models. Separate calculations are carried outwith a passive template and a star-forming template, andin each case for both Salpeter (1955) and Kroupa (2001)initial mass functions, and for stellar evolution with andwithout stellar mass loss. Templates are based on Maraston(2005) and Maraston et al. (2009) for the star-forming andpassive stellar population models, respectively. In order notto underestimate stellar mass, internal galaxy reddeningis not included in the Portsmouth SED fitting proceduresused in DR9. Reddening for individual galaxies may,however, be computed via the Portsmouth emission-lineflux calculations (see below).
2. Portsmouth emission-line fluxes and equivalent widths, andstellar and gas kinematics (Thomas et al. 2012), are basedon the stellar population synthesis models of Maraston& Stromback (2011) applied to BOSS spectra using anadaptation of the publicly available Gas AND AbsorptionLine Fitting (GANDALF; Sarzi et al. 2006) and penalizedPiXel Fitting (pPXF; Cappellari & Emsellem 2004).
3. Wisconsin stellar masses and velocity dispersions arederived from the optical rest-frame spectral region(3700–5500 Å) using a principal component analysis (PCA)method (Chen et al. 2012). The estimation is based on a li-brary of model spectra generated using the single stellarpopulation models of Bruzual & Charlot (2003) assuminga Kroupa (2001) initial mass function, and with a broad
8

The Astrophysical Journal Supplement Series, 203:21 (13pp), 2012 December Ahn et al.
range of star formation histories, metallicities, dust extinc-tions, and stellar velocity dispersions.
The different stellar mass estimates for BOSS galaxiesencompass calculations based on different stellar populationmodels (Bruzual & Charlot 2003 for Wisconsin, and Maraston2005 for Portsmouth), different assumptions regarding galaxystar formation histories, reddening, and multiple choices forthe initial mass function and stellar mass-loss rates, and eachmethod focuses on a different aspect of the available imagingand spectroscopic data. The Portsmouth SED fitting focuseson broadband colors and BOSS redshifts, the Wisconsin PCAanalysis uses the rest-frame 3700–5500 Å stellar continuumregion of each galaxy spectrum, and the Portsmouth emission-line fitting focuses on specific regions of the spectrum thatcontain specific information on gas and stellar kinematics.The array of choices allows consistent comparisons with theliterature and future surveys. A detailed comparison between thePortsmouth SED and the Wisconsin spectral PCA calculationscan be found in Maraston et al. (2012, Appendix A).
The Galspec product (Kauffmann et al. 2003; Brinchmannet al. 2004; Tremonti et al. 2004) provided by the Max PlanckInstitute for Astrophysics and the Johns Hopkins University(MPA-JHU) introduced in DR8 is maintained for SDSS-I/IIgalaxies, but is not available for SDSS-III BOSS spectra. ThePortsmouth and Wisconsin stellar population model algorithmsare new to DR9 and currently available only for SDSS-IIIBOSS spectra. However, Chen et al. (2012) and Thomas et al.(2012) each found consistent results between their respectivetechniques (Wisconsin PCA, and Portsmouth emission-line) andthe SDSS-I/II MPA-JHU results for a set of SDSS galaxiesfrom DR7.
3.4. Changes in BOSS Spectrographs and Survey Strategy
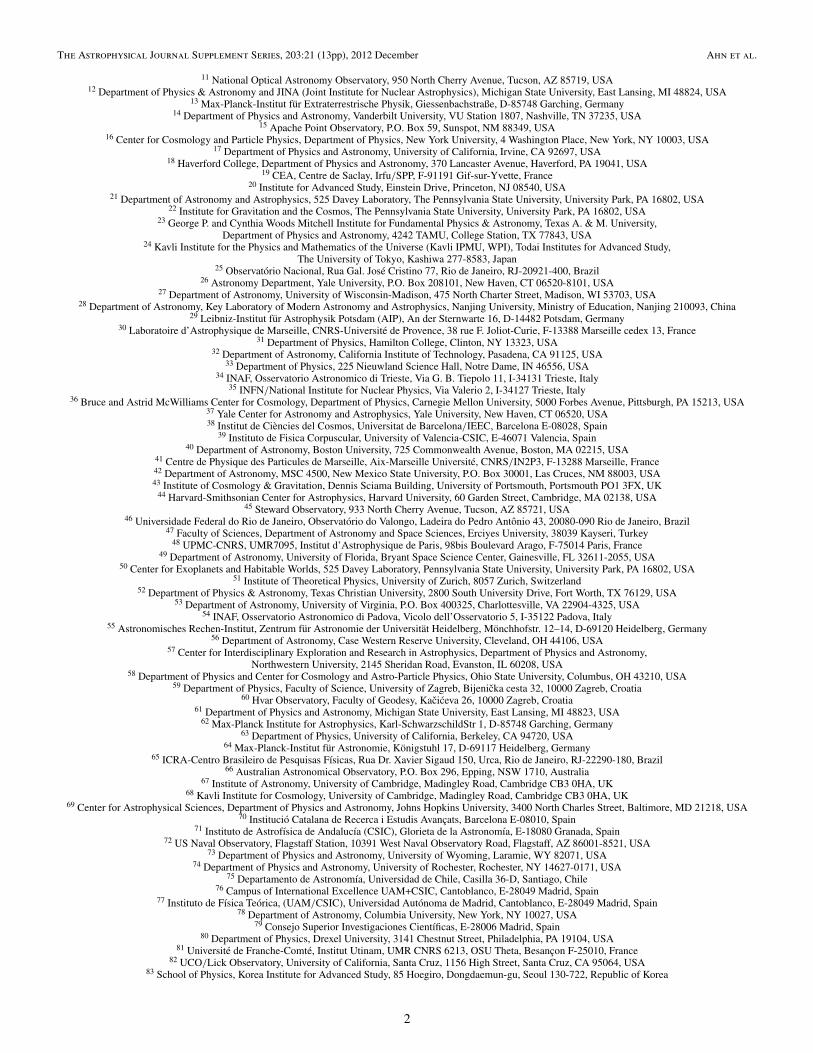
While commissioning of the BOSS spectrographs was com-pleted in early 2009 December, we continued to make improve-ments and changes to the spectrographs, the observing sys-tem, and the exposure depths. In this section, we outline thosechanges that affect the DR9 data. The effects on the quality ofthe resulting spectra due to these changes are subtle, but thereader interested in detailed comparisons of the BOSS data as afunction of time should be aware of them.
BOSS observes spectra with 15 minute exposures whichare repeated until the summed signal-to-noise squared perpixel, (S/N)2, reaches a given threshold in each of the fourspectrograph cameras (B1, B2, R1, R2 for the blue and red armsof spectrographs 1 and 2). A quick-look pipeline runs after eachexposure to estimate the accumulated (S/N)2 in near real timeand a plate is exposed again until given (S/N)2 thresholds arereached.
For the first year of the survey BOSS conservatively observeda little deeper than was thought to be necessary, with the idea ofre-evaluating and updating these (S/N)2 thresholds for futureyears. After the first year of observations, it became clearthat that we were not covering the sky sufficiently quicklyto reach our goal of 10,000 deg2 by the end of the survey inSummer 2014. BOSS thus conducted a review of the fiducial(S/N)2 thresholds needed to optimize both survey speed andspectroscopic completeness. The decision was made to lowerthe (S/N)2 thresholds and impose a more restrictive cut onthe galaxy surface brightness faint limit. On MJD 55497 the(S/N)2 thresholds were reduced from >16 to >10 for the bluespectrograph cameras (for g = 22) and from >26 to >22 for the
Figure 6. Accumulated signal-to-noise ratio squared per pixel at a fiducialmagnitude on each plate, plotted as a function of time for the DR9 BOSS surveydata for all completed plates marked as good. The blue (S/N)2 is the averageof the signal in blue cameras of the spectrograph for an object with g = 21.2(2′′ fiber magnitude), while the red (S/N)2 is the average of the red camerasof the spectrograph for an object with r = 20.2. Survey-quality data began atMJD 55171. Changes in survey strategy, hardware, and guider software (Table 2)are indicated with vertical lines. The mean signal-to-noise ratio per platedropped significantly after the requirements for exposure depths were reducedon MJD 55497 (Section 3.4). The large gap is the 2010 summer shutdown. Thesmaller gaps are the times of bright moonlight when BOSS does not observe.
(A color version of this figure is available in the online journal.)
red spectrograph cameras (for i = 21).100 At the same time, theCMASS target selection limiting magnitude was changed fromIFIBER2MAG < 21.7 to <21.5. There is a very slight changein spectroscopic survey completeness after this date. Furtherdetails are provided in Section 5 of Dawson et al. (2012).
Improvements to the guider software were made onMJD 55253, leading to better guiding and thus improvedthroughput. Improvements to the field acquisition softwareand the efficiency of calibration observations were made onMJD 55343 and resulted in reduced observing overheads and alarger fraction of open-shutter time.
Table 2 summarizes a series of hardware changes that furtherimproved throughput and image quality and reduced scatteredlight. Figure 6 demonstrates the effect on S/N of the hardwareand survey strategy changes. This allowed us to reach thefiducial (S/N)2 in the spectra in fewer exposures. Air bubbleshad developed in the oil interfaces between the B1 tripletlenses, reducing throughput and causing scattered light. Thesewere replaced on MJD 55520. The triplet lenses for the otherspectrograph arms have also been replaced, but only after the2011 July date that marks the end of DR9. The R2 CCD wasreplaced on MJD 55298 due to a hardware failure. The R1and R2 CCD clocking was changed from one- to two-phase forcharge collection on MJD 55390. The use of washers to optimize(S/N)2 for quasar targets began on MJD 55441 and was fullyimplemented for all CORE and BONUS quasar targets startingMJD 55474. Finally, we did two rounds of adjusting the focusof the CCDs in their dewars, further improving the throughput.
100 These values of (S/N)2 are as measured by the quick reductions done ofeach exposure immediately after it is taken. The full reductions have amoderately higher (S/N)2. The full pipeline also uses a different set of fiducialmagnitudes for tracking (S/N)2: g = 21.2 mag, r = 20.2 mag, andi = 20.2 mag. It is these full pipeline (S/N)2 values that are shown in Figure 4.
9
The Astrophysical Journal Supplement Series, 203:21 (13pp), 2012 December Ahn et al.
Table 2BOSS Survey Changes
Date MJDa Change
2009 Aug 28 55071 Earliest BOSS commissioning data available in SAS2009 Dec 6 55171 Beginning of survey-quality data2010 Feb 26 55253 Installed mask in the central optics to eliminate a secondary light path that
was directly imaged onto the CCD2010 Feb 26 55253 Guider improvements2010 Feb 26 55253 CCD dewars adjusted for better focus2010 Mar 1 55256 Installed a collimator mask to remove light being reflected off of the
slithead and re-imaged onto the CCD2010 Apr 12 55299 R2 CCD replaced2010 May 28 55343 Field acquisition and calibration efficiency improvements2010 Jul 7 55384 CCD positions adjusted inside dewars for better focus2010 Jul 13 55390 R1,R2 CCD change from one- to two-phase slightly changed effective
pixel size2010 Sep 2 55441 Washers for quasar targets, some plates2010 Oct 5 55474 Washers for quasar targets, all plates2010 Oct 28 55497 Changed (S/N)2 thresholds and target selection2010 Nov 20 55520 B1 triplet lenses replaced
Note. a All data taken on and after the given MJD include the respective change.
4. FIXED AND IMPROVED ASTROMETRY
The DR8 imaging suffered from several errors in the astro-metric calibration, as described in an erratum published shortlyafter the DR8 release (Aihara et al. 2011b).101 These errors havebeen corrected in DR9, and the resulting astrometry and propermotions are improved relative to both DR7 and DR8.102
The issues with the DR8 astrometry were, in brief:
1. Northward of +41◦ declination there was an offset of250 mas introduced by switching from the Second USNaval Observatory CCD Astrograph Catalog (UCAC2;Zacharias et al. 2004) to the United States Naval Obser-vatory (USNO)-B catalog (Monet et al. 2003) at this decli-nation.
2. Color terms were not used in calculating CCD position tosky position, introducing systematic errors of 10–20 mas.
3. UCAC2 proper motions were not applied correctly, intro-ducing further errors of order 5–10 mas.
4. Stellar positions were always measured in the r-bandphotometry, even if the r band was saturated or had alower S/N detection than other filters. For faint objects thisincreases the statistical uncertainty for the measurement,but for r-band saturated objects the difference can be asmuch as 100 mas between using r-band positions and thosein non-saturated filters.
All of these issues have been corrected for DR9. Thediscovery of the mistakes in DR8 prompted the developmentof a new set of astrometric quality-assurance metrics that arefully described in the SDSS-III DR9 data model.103
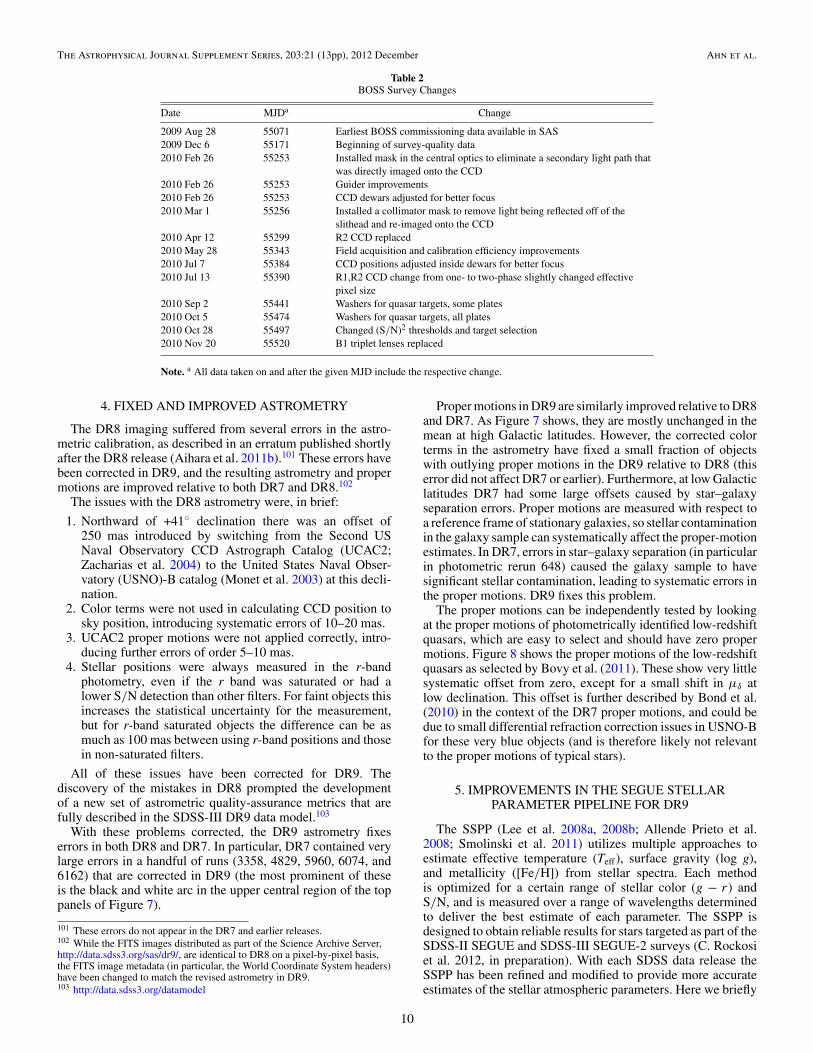
With these problems corrected, the DR9 astrometry fixeserrors in both DR8 and DR7. In particular, DR7 contained verylarge errors in a handful of runs (3358, 4829, 5960, 6074, and6162) that are corrected in DR9 (the most prominent of theseis the black and white arc in the upper central region of the toppanels of Figure 7).
101 These errors do not appear in the DR7 and earlier releases.102 While the FITS images distributed as part of the Science Archive Server,http://data.sdss3.org/sas/dr9/, are identical to DR8 on a pixel-by-pixel basis,the FITS image metadata (in particular, the World Coordinate System headers)have been changed to match the revised astrometry in DR9.103 http://data.sdss3.org/datamodel
Proper motions in DR9 are similarly improved relative to DR8and DR7. As Figure 7 shows, they are mostly unchanged in themean at high Galactic latitudes. However, the corrected colorterms in the astrometry have fixed a small fraction of objectswith outlying proper motions in the DR9 relative to DR8 (thiserror did not affect DR7 or earlier). Furthermore, at low Galacticlatitudes DR7 had some large offsets caused by star–galaxyseparation errors. Proper motions are measured with respect toa reference frame of stationary galaxies, so stellar contaminationin the galaxy sample can systematically affect the proper-motionestimates. In DR7, errors in star–galaxy separation (in particularin photometric rerun 648) caused the galaxy sample to havesignificant stellar contamination, leading to systematic errors inthe proper motions. DR9 fixes this problem.
The proper motions can be independently tested by lookingat the proper motions of photometrically identified low-redshiftquasars, which are easy to select and should have zero propermotions. Figure 8 shows the proper motions of the low-redshiftquasars as selected by Bovy et al. (2011). These show very littlesystematic offset from zero, except for a small shift in μδ atlow declination. This offset is further described by Bond et al.(2010) in the context of the DR7 proper motions, and could bedue to small differential refraction correction issues in USNO-Bfor these very blue objects (and is therefore likely not relevantto the proper motions of typical stars).
5. IMPROVEMENTS IN THE SEGUE STELLARPARAMETER PIPELINE FOR DR9
The SSPP (Lee et al. 2008a, 2008b; Allende Prieto et al.2008; Smolinski et al. 2011) utilizes multiple approaches toestimate effective temperature (Teff), surface gravity (log g),and metallicity ([Fe/H]) from stellar spectra. Each methodis optimized for a certain range of stellar color (g − r) andS/N, and is measured over a range of wavelengths determinedto deliver the best estimate of each parameter. The SSPP isdesigned to obtain reliable results for stars targeted as part of theSDSS-II SEGUE and SDSS-III SEGUE-2 surveys (C. Rockosiet al. 2012, in preparation). With each SDSS data release theSSPP has been refined and modified to provide more accurateestimates of the stellar atmospheric parameters. Here we briefly
10

The Astrophysical Journal Supplement Series, 203:21 (13pp), 2012 December Ahn et al.
Figure 7. Astrometric and proper-motion comparison of DR9 to DR7, plotted in equatorial coordinates. The top row shows the difference in right ascension (left) anddeclination (right) of objects matched between the two data releases, and the bottom row shows the differences in their proper motions. In the top row, the DR7 andDR9 astrometry agree over most of the area, with the exception of a handful of spots, all due to errors in the DR7 astrometry. In the bottom row, DR7 and DR9 propermotions agree over virtually all of the high Galactic latitude areas. At low Galactic latitudes there are substantial shifts, caused by errors in DR7 due to mistakes instar/galaxy separation affecting the proper-motion estimates.
Figure 8. DR9 proper motions of photometrically selected z < 2 quasars (as classified by Bovy et al. 2011). These motions are nearly consistent with zero, with aslight offset in μδ at low declination, possibly due to errors in differential refraction corrections in USNO-B for these very blue objects (see Bond et al. 2010).
highlight major changes and improvements made since the DR8public release that are used for the DR9 data.
A sample of 126 high-resolution spectra of SDSS/SEGUEstars, taken with Keck, Subaru, the Hobby–Eberly Telescope,and the Very Large Telescope, have been analyzed in a ho-mogeneous fashion, and a new set of stellar parameters wereobtained from this analysis (Allende Prieto et al. 2008; Smolin-ski et al. 2011). The sample covers 4000 K < Teff < 7000 K,0.0 < log g < 5.0, and −4.0 < [Fe/H] < +0.5. However,this data set contains no metal-poor ([Fe/H] < −2.5) dwarfsor metal-rich ([Fe/H] > 0.0) giants. Additional information onthis high-resolution sample can be found in Allende Prieto et al.(2008) and Smolinski et al. (2011).
The individual methods in the SSPP, in particular estimatesof surface gravity and metallicity, have been thoroughly re-calibrated based on these new data. The SSPP also adopts amuch-improved color (g − r)-temperature relation, the InfraRed
Flux Method (IRFM) as described by Casagrande et al. (2010).Each SSPP temperature estimate was re-scaled to match theIRFM temperature estimate. This technique particularly im-proves the temperature estimates for cool stars (Teff < 5000 K).
Figure 9 shows the results of the comparisons of the SSPP pa-rameters with the IRFM for temperature, and the high-resolutionanalysis for gravity and metallicity. Implementation of a grid ofsynthetic spectra with microturbulences that vary appropriatelywith surface gravity also yields improved estimates of metallic-ity for metal-rich stars ([Fe/H] > −0.5).
A parameter comparison from a sample of about 9000multiply observed stellar spectra in SEGUE provides the basisfor an estimate of the internal uncertainties of the SSPP: ∼50 Kfor Teff , ∼0.12 dex for log g, and ∼0.10 dex for [Fe/H] fora typical G-type dwarf or redder stars in the color range of0.4 < g − r < 1.3 with S/N per pixel = 30. These errorsincrease to ∼80 K, 0.30 dex, and 0.25 dex for Teff , log g, and
11

The Astrophysical Journal Supplement Series, 203:21 (13pp), 2012 December Ahn et al.
45 50 55 60 65 70 75Teff (IRFM)/100 [K]
45
50
55
60
65
70
75
Tef
f (A
dop)
/100
[K
]
-400 -200 0 200 400ΔTeff (Adop - IRFM) [K]
0
5
10
15
N
N = 107, μ = 17, σ = 145
0 1 2 3 4 5log g (Hi-res)
0
1
2
3
4
5
log
g (A
dop)
-2 -1 0 1 2Δlog g (Adop - Hi-res)
0
5
10
15
20
25
N
N = 126, μ = -0.05, σ = 0.40
-4 -3 -2 -1 0 1[Fe/H] (Hi-res)
-4
-3
-2
-1
0
1
[Fe/
H]
(Ado
p)
-1.5 -1.0 -0.5 0.0 0.5 1.0 1.5Δ[Fe/H] (Adop - Hi-res)
0
5
10
15
20
25
30
N
N = 126, μ = 0.03, σ = 0.24
Figure 9. Comparisons of Teff (left panels), log g (middle panels), and [Fe/H] (right panels) of the SSPP with the temperature from the IRFM, and surface gravity andmetallicity from analysis of high-resolution spectra of 126 stars. The symbols μ and σ are the mean and standard deviation from a Gaussian fit to the sample. “Adop”is the final adopted value in the SSPP; “Hi-res” refers to the high-resolution analysis. As was the case for DR8, the DR9 SSPP gravity value still overestimates log gby up to 1.0 dex for cool giants. There are only 107 stars available for the temperature comparison, as JHK photometry, needed to derive the IRFM temperature, wasunavailable for 19 stars.
[Fe/H], respectively, for stars with −0.3 < g − r < 0.2,[Fe/H] < −2.0, and S/N < 15.
A comparison with the DR8 parameters for stars fromSEGUE-1 indicates that the DR9 average Teff is higher by∼60 K, the DR9 log g is lower by ∼0.2 dex, and the metallicitydoes not change significantly, although these values vary withspectral type and spectral S/N.
These new SSPP results are made available for all stars inSDSS-I/II, including those of SEGUE-1 (Yanny et al. 2009),and the SEGUE-2 stars in SDSS-III. SSPP measurements arenot currently available for the stars observed as part of BOSS,although we plan to include that in future data releases.
6. DATA DISTRIBUTION
All Data Release 9 data are available through data accesstools linked from the DR9 Web site.104 The data are storedboth as flat files in the Science Archive Server (SAS),105 andas a searchable database in the Catalog Archive Server (CAS).A number of different interfaces are available, each designedto accomplish a specific task: (1) color images of regions ofthe sky in JPEG format (based on the g, r , and i images; seeLupton et al. 2004) can be viewed in a Web browser with theSkyServer Navigate tool; (2) FITS images can be downloadedthrough the SAS; (3) complete catalog information (astrometry,photometry, etc.) of any imaging object can be viewed throughthe SkyServer Explore tool; and (4) FITS files of the spectra canbe downloaded through the SAS.
104 http://www.sdss3.org/dr9105 The Science Archive Server (SAS) is the SDSS-III equivalent of theSDSS-I/II Data Archive Server (DAS).
In addition, a number of catalog search tools are availablethrough the SkyServer interface to the CAS, each of whichreturns catalog data for objects that match supplied criteria.For more advanced queries, a powerful and flexible catalogsearch Web site called “CasJobs” allows users to create theirown personalized data sets and then to modify or graph theirdata.
The DR9 Web site also features data access tutorials, aglossary of SDSS terms, and detailed documentation aboutalgorithms used to process the imaging and spectroscopic dataand select spectroscopic targets.
Imaging and spectroscopic data from all prior data releasesare also available through DR9 data access tools.
7. CONCLUSIONS
The SDSS-III Data Release 9 presents the first data fromthe BOSS survey, with ∼102,000 new quasar spectra, ∼91,000new stellar spectra, and ∼536,000 new galaxy spectra. Theastrometry has been improved since DR8, and the stellarproperties for SEGUE-I/II and SDSS-I/II stars have beenupdated.
These data are already sufficient for cosmological analysesof large-scale structure, investigations of the structure of theMilky Way, measurements of quasar physics, clustering, anddemographics, and countless other science investigations. Weinvite the larger scientific community to investigate and explorethis new data set.
The SDSS-III project will present two more public datareleases. DR10, in Summer 2013, will include the first datafrom the APOGEE survey and another year of BOSS data.DR11 will be an internal release only, as a public release would
12

The Astrophysical Journal Supplement Series, 203:21 (13pp), 2012 December Ahn et al.
occur only six months before the final public data release forSDSS-III, DR12, which will be released in 2014 December andwill contain all of the data taken during the six years of theproject.
Funding for SDSS-III has been provided by the Alfred P.Sloan Foundation, the Participating Institutions, the NationalScience Foundation, and the U.S. Department of Energy Officeof Science. The SDSS-III Web site is http://www.sdss3.org/.
SDSS-III is managed by the Astrophysical Research Con-sortium for the Participating Institutions of the SDSS-IIICollaboration including the University of Arizona, the BrazilianParticipation Group, Brookhaven National Laboratory, Univer-sity of Cambridge, Carnegie Mellon University, University ofFlorida, the French Participation Group, the German Participa-tion Group, Harvard University, the Instituto de Astrofisica deCanarias, the Michigan State/Notre Dame/JINA ParticipationGroup, Johns Hopkins University, Lawrence Berkeley NationalLaboratory, Max Planck Institute for Astrophysics, Max PlanckInstitute for Extraterrestrial Physics, New Mexico State Univer-sity, New York University, Ohio State University, PennsylvaniaState University, University of Portsmouth, Princeton Univer-sity, the Spanish Participation Group, University of Tokyo, Uni-versity of Utah, Vanderbilt University, University of Virginia,University of Washington, and Yale University.
REFERENCES
Abazajian, K. N., Adelman-McCarthy, J. K., Agueros, M. A., et al. 2009, ApJS,182, 543
Adelman-McCarthy, J. K., Agueros, M. A., Allam, S. S., et al. 2008, ApJS, 175,297
Aihara, H., Allende Prieto, C., An, D., et al. 2011a, ApJS, 193, 29Aihara, H., Allende Prieto, C., An, D., et al. 2011b, ApJS, 195, 26Allende Prieto, C., Sivarani, T., Beers, T. C., et al. 2008, AJ, 136, 2070Anderson, L., Aubourg, E., Bailey, S., et al. 2012, arXiv:1203.6594Bolton, A. S., Schlegel, D. J., Aubourg, E., et al. 2012, AJ, 144, 144Bond, N. A., Ivezic, Z., Sesar, B., et al. 2010, ApJ, 716, 1Bovy, J., Hennawi, J. F., Hogg, D. W., et al. 2011, ApJ, 729, 141Brinchmann, J., Charlot, S., White, S. D. M., et al. 2004, MNRAS, 351, 1151Bruzual, G., & Charlot, S. 2003, MNRAS, 344, 1000Cappellari, M., & Emsellem, E. 2004, PASP, 116, 138Casagrande, L., Ramırez, I., Melendez, J., Bessell, M., & Asplund, M.
2010, A&A, 512, A54
Chen, Y.-M., Kauffmann, G., Tremonti, C. A., et al. 2012, MNRAS, 421, 314Cole, S., Percival, W. J., Peacock, J. A., et al. 2005, MNRAS, 362, 505Dawson, K. S., Schlegel, D. J., Ahn, C. P., et al. 2012, arXiv:1208.0022Eisenstein, D. J., Annis, J., Gunn, J. E., et al. 2001, AJ, 122, 2267Eisenstein, D. J., Weinberg, D. H., Agol, E., et al. 2011, AJ, 142, 72Eisenstein, D. J., Zehavi, I., Hogg, D. W., et al. 2005, ApJ, 633, 560Fan, X. 1999, AJ, 117, 2528Fukugita, M., Ichikawa, T., Gunn, J. E., et al. 1996, AJ, 111, 1748Gunn, J. E., Siegmund, W. A., Mannery, E. J., et al. 2006, AJ, 131, 2332Hewett, P. C., & Wild, V. 2010, MNRAS, 405, 2302Kauffmann, G., Heckman, T. M., White, S. D. M., et al. 2003, MNRAS,
341, 33Komatsu, E., Smith, K. M., Dunkley, J., et al. 2011, ApJS, 192, 18Kroupa, P. 2001, MNRAS, 322, 231Lee, Y. S., Beers, T. C., Sivarani, T., et al. 2008a, AJ, 136, 2022Lee, Y. S., Beers, T. C., Sivarani, T., et al. 2008b, AJ, 136, 2050Lupton, R., Blanton, M. R., Fekete, G., et al. 2004, PASP, 116, 133Maraston, C. 2005, MNRAS, 362, 799Maraston, C., Pforr, J., Henriques, B. M., et al. 2012, arXiv:1207.6114Maraston, C., & Stromback, G. 2011, MNRAS, 418, 2785Maraston, C., Stromback, G., Thomas, D., Wake, D. A., & Nichol, R. C.
2009, MNRAS, 394, L107McDonald, P., & Eisenstein, D. J. 2007, Phys. Rev. D, 76, 063009McQuinn, M., & White, M. 2011, MNRAS, 415, 2257Monet, D. G., Levine, S. E., Canzian, B., et al. 2003, AJ, 125, 984Padmanabhan, N., Xu, X., Eisenstein, D. J., et al. 2012, MNRAS, in press
(arXiv:1202.0090)Palanque-Delabrouille, N., Yeche, Ch., Myers, A. D., et al. 2011, A&A,
530, A122Paris, I., Petitjean, P., Aubourg, E., et al. 2012, A&A, in press (arXiv:1210.5166)Percival, W. J., Reid, B. A., Eisenstein, D. J., et al. 2010, MNRAS, 401, 2148Richards, G. T., Fan, X., Newberg, H. J., et al. 2002, AJ, 123, 2945Ross, N. P., Myers, A. D., Sheldon, E. S., et al. 2012, ApJS, 199, 3Salpeter, E. E. 1955, ApJ, 121, 161Sarzi, M., Falcon-Barroso, J., Davies, R. L., et al. 2006, MNRAS, 366, 1151Schneider, D. P., Richards, G. T., Hall, P. B., et al. 2010, AJ, 139, 2360Slosar, A., Font-Ribera, A., Pieri, M. M., et al. 2011, J. Cosmol. Astropart.
Phys., JCAP09(2011)001Smee, S., Gunn, J. E., Uomoto, A., et al. 2012, arXiv:1208.2233Smolinski, J. P., Lee, Y. S., Beers, T. C., et al. 2011, AJ, 141, 89Strauss, M. A., Weinberg, D. H., Lupton, R. H., et al. 2002, AJ, 124, 1810Tegmark, M., Eisenstein, D. J., Strauss, M. A., et al. 2006, Phys. Rev. D, 74,
123507Thomas, D., Steele, O., Maraston, C., et al. 2012, (arXiv:1207.6115)Tremonti, C. A., Heckman, T. M., Kauffmann, G., et al. 2004, ApJ, 613, 898Weinberg, D. H., Mortonson, M. J., Eisenstein, D. J., et al. 2012,
arXiv:1201.2434Yanny, B., Rockosi, C., Newberg, H. J., et al. 2009, AJ, 137, 4377York, D. G., Adelman, J., Anderson, J. E., Jr., et al. 2000, AJ, 120, 1579Zacharias, N., Urban, S. E., Zacharias, M. I., et al. 2004, AJ, 127, 3043
13