THE NIELSEN COMPARABLE METRICS REPORT - rab.com · number of adults who use a given platform or...
27
THE NIELSEN COMPARABLE METRICS REPORT Q1 2017 Copyright © 2017 The Nielsen Company (US), LLC. Confidential and proprietary. Do not distribute. Copyright © 2017 The Nielsen Company (US), LLC. Confidential and proprietary. Do not distribute.
Transcript of THE NIELSEN COMPARABLE METRICS REPORT - rab.com · number of adults who use a given platform or...

THE NIELSEN COMPARABLE METRICS REPORTQ1 2017
Copyright © 2017 The Nielsen Company (US), LLC. Confidential and proprietary. Do not distribute.Copyright © 2017 The Nielsen Company (US), LLC. Confidential and proprietary. Do not distribute.
2Copyright © 2017 The Nielsen Company (US), LLC. Confidential and proprietary. Do not distribute.
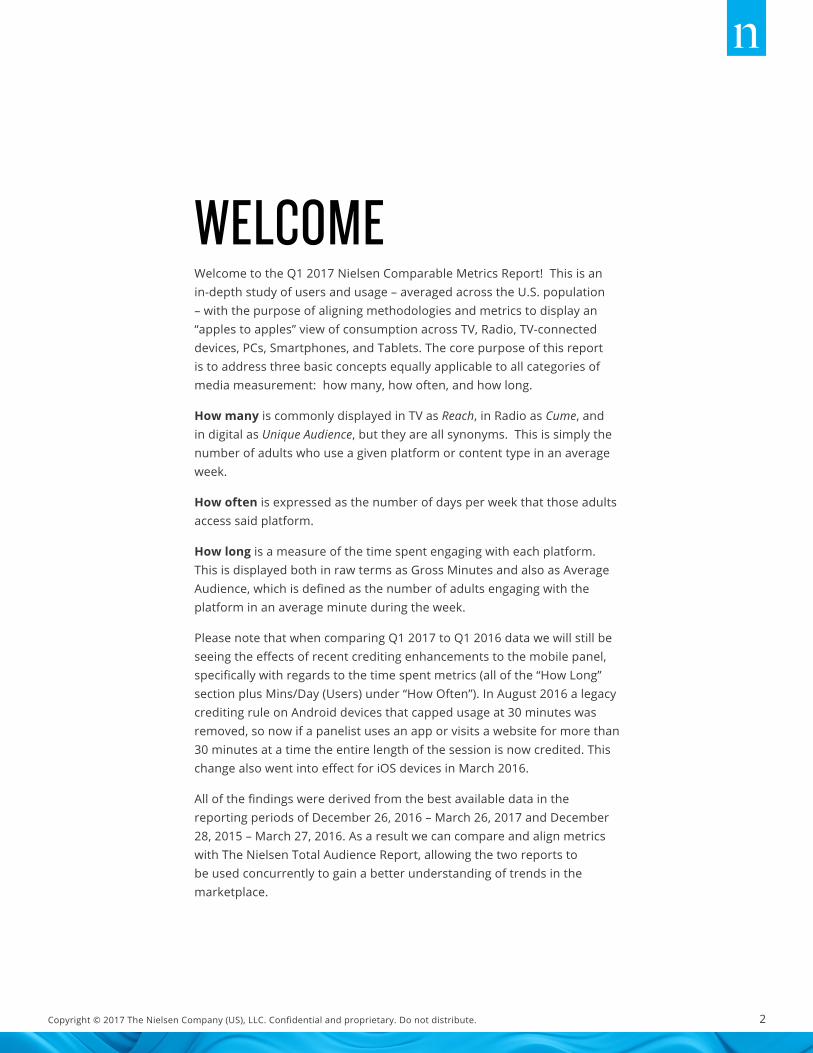
WELCOMEWelcome to the Q1 2017 Nielsen Comparable Metrics Report! This is an in-depth study of users and usage – averaged across the U.S. population – with the purpose of aligning methodologies and metrics to display an “apples to apples” view of consumption across TV, Radio, TV-connected devices, PCs, Smartphones, and Tablets. The core purpose of this report is to address three basic concepts equally applicable to all categories of media measurement: how many, how often, and how long.
How many is commonly displayed in TV as Reach, in Radio as Cume, and in digital as Unique Audience, but they are all synonyms. This is simply the number of adults who use a given platform or content type in an average week.
How often is expressed as the number of days per week that those adults access said platform.
How long is a measure of the time spent engaging with each platform. This is displayed both in raw terms as Gross Minutes and also as Average Audience, which is defined as the number of adults engaging with the platform in an average minute during the week.
Please note that when comparing Q1 2017 to Q1 2016 data we will still be seeing the effects of recent crediting enhancements to the mobile panel, specifically with regards to the time spent metrics (all of the “How Long” section plus Mins/Day (Users) under “How Often”). In August 2016 a legacy crediting rule on Android devices that capped usage at 30 minutes was removed, so now if a panelist uses an app or visits a website for more than 30 minutes at a time the entire length of the session is now credited. This change also went into effect for iOS devices in March 2016.
All of the findings were derived from the best available data in the reporting periods of December 26, 2016 – March 26, 2017 and December 28, 2015 – March 27, 2016. As a result we can compare and align metrics with The Nielsen Total Audience Report, allowing the two reports to be used concurrently to gain a better understanding of trends in the marketplace.

3Copyright © 2017 The Nielsen Company (US), LLC. Confidential and proprietary. Do not distribute.
AVERAGE AUDIENCE COMPOSITION
• TV accounts for 43% of the total average audience among adults 18+
• 28% of average audience for P18-34 is spent using smartphones
Q1 2017 AVERAGE AUDIENCE COMPOSITION BY PLATFORM
ADULTS P18-34 P35-49 P50+
5% 28%
9%
12%
17%
29%
5% 21%
9% 6% 16%
43%
6% 24%
11%
6% 16%
36%
4% 15%
7% 3% 16%
54%
TV Radio PC Smartphone TabletTV-Connected Devices(DVD, Game Console, Multimedia Device, VCR)

4Copyright © 2017 The Nielsen Company (US), LLC. Confidential and proprietary. Do not distribute.
38% 36%
57%
28%
89%
80%
91% 94% 92% 93% 95% 92%
48%
57% 57%
36%
51% 45%
59%
51%
83%90%
96%
71%
TV RADIO TV-CONNECTEDDEVICES
PC SMARTPHONE TABLET
Adults P18-34 P35-49 P50+
HOW MANYQ1 2017 WEEKLY REACH (% OF POPULATION)
• 57% of P18-49 are using TV-Connected devices
• Radio reaches more P18-34 than other platforms
• More adults P35-49 use smartphones, tablets and PCs than P18-34
5Copyright © 2017 The Nielsen Company (US), LLC. Confidential and proprietary. Do not distribute.
5.7
4.7
5.6
6.2
5.1 4.9
5.3 5.2
5.9 5.8 5.8 5.9
3.8
4.3
3.8
3.2
4.4 4.0
4.2 4.6 4.6 4.4 4.4
4.9
Adults P18-34 P35-49 P50+
TV RADIO TV-CONNECTEDDEVICES
PC SMARTPHONE TABLET
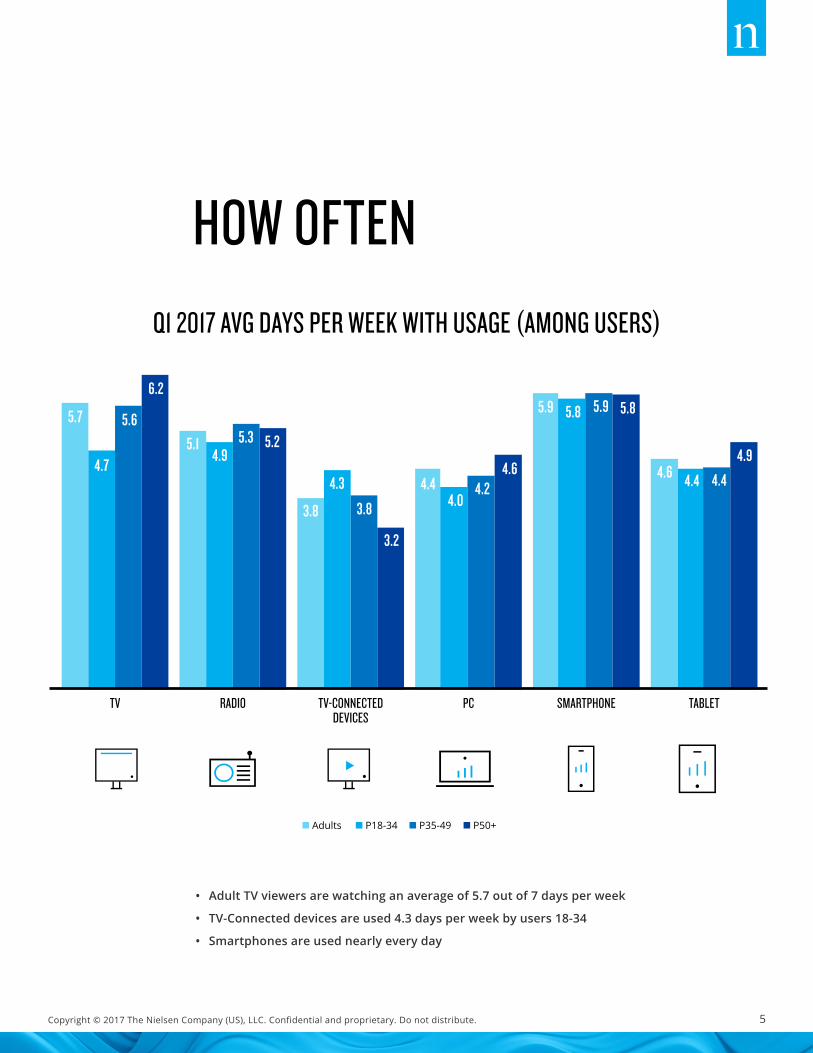
HOW OFTENQ1 2017 AVG DAYS PER WEEK WITH USAGE (AMONG USERS)
• Adult TV viewers are watching an average of 5.7 out of 7 days per week
• TV-Connected devices are used 4.3 days per week by users 18-34
• Smartphones are used nearly every day

6Copyright © 2017 The Nielsen Company (US), LLC. Confidential and proprietary. Do not distribute.
HOW LONG
• TV-Connected Devices are most heavily consumed by P18-34
• Adults spend nearly 13 hours per week listening to the radio
• Adults 35-49 spend the most time per week on Smartphones, PCs and Tablets
Q1 2017 WEEKLY HOURS:MINS OF USAGE (IN POPULATION)
34:25
12:55 4:407:05
16:163:57
18:24
10:40
7:435:56
17:423:30
30:34
13:375:08
9:39
19:565:11
47:04
14:022:246:26
13:203:35
ADULTS P18-34 P35-49 P50+
TV Radio PC Smartphone TabletTV-Connected Devices(DVD, Game Console, Multimedia Device, VCR)

7Copyright © 2017 The Nielsen Company (US), LLC. Confidential and proprietary. Do not distribute.
COMPARABLE METRICS BY RACE AND ETHNICITY
• Black audiences watch more TV than any other group
• Hispanics are the most avid radio listeners
• Asian Americans have the highest amount of tablet video usage
Q1 2017 WEEKLY HOURS:MINS OF USAGE BY ETHNICITY & RACE
Adults 18+ Total Black Hispanic Asian American
TV 34:25 49:03 26:11 16:12
Radio 12:55 13:38 13:54 na
TV-Connected Devices 4:40 4:58 4:43 4:43
PC Total 7:04 8:13 5:15 4:30
PC Video 2:19 3:22 2:17 1:58
PC Streaming Audio 0:10 0:12 0:10 0:04
PC Social Network 1:01 0:55 0:30 0:28
Smartphone (App+Web) 16:16 18:55 18:32 12:38
Smartphone Video 0:46 1:16 1:23 0:42
Smartphone Streaming Audio 0:35 0:44 0:47 0:35
Smartphone Social Network 4:01 4:24 4:49 2:33
Tablet (App+Web) 3:57 4:28 2:21 1:25
Tablet Video 0:19 0:29 0:23 0:43
Tablet Streaming Audio 0:09 0:12 0:05 0:02
Tablet Social Network 0:59 0:51 0:28 0:13

8Copyright © 2017 The Nielsen Company (US), LLC. Confidential and proprietary. Do not distribute.
COMPARABLE METRICS - ADULTS 18+AVERAGE WEEK DECEMBER 28, 2015 - MARCH 27, 2016
ADULTS 18+UE = 243,020,000
REACH/CUME/
UNIQUES
REACH%
USAGE DAYS/WEEK
MINS/DAY
(USERS)GROSS MINUTES
MINS/ADULT(POPULATION)
MINS/ADULT(USERS)
AA%
AVG AUDIENCE
TV 213,516,829 87.9% 5.69 397 516,774,314,178 2126 2260 21.1% 51,267,293
Radio 224,922,000 92.6% 5.15 164 189,834,168,000 781 844 7.7% 18,832,755
TV-Connected Devices
106,245,353 43.7% 3.52 145 60,399,343,524 249 512 2.5% 5,991,998
PC 124,230,095 51.1% 4.37 181 97,891,188,465 403 788 4.0% 9,711,427
PC Video 77,705,567 32.0% 3.52 97 26,433,682,074 109 340 1.1% 2,622,389
PC Streaming Audio
19,530,619 8.0% 2.21 42 1,819,050,092 7 93 0.1% 180,461
PC Social Network
72,742,542 29.9% 3.57 50 12,968,891,121 53 178 0.5% 1,286,596
Smartphone (App+Web)
186,641,243 76.8% 5.96 152 169,346,661,890 697 907 6.9% 16,800,264
Smartphone Video
110,098,402 45.3% 2.76 19 5,690,347,292 23 52 0.2% 564,519
Smartphone Streaming Audio
84,435,893 34.7% 3.19 31 8,339,701,579 34 99 0.3% 827,351
Smartphone Social Network
164,641,370 67.7% 5.20 61 52,445,935,201 216 319 2.1% 5,202,970
Tablet (App+Web)
82,674,274 34.0% 5.16 127 53,997,410,013 222 653 2.2% 5,356,886
Tablet Video 46,986,190 19.3% 2.86 35 4,630,828,681 19 99 0.2% 459,408
Tablet Streaming Audio
30,710,471 12.6% 3.43 33 3,487,891,964 14 114 0.1% 346,021
Tablet Social Network
68,827,474 28.3% 4.34 41 12,248,456,588 50 178 0.5% 1,215,125
HOW MANY HOW OFTEN HOW LONG
9Copyright © 2017 The Nielsen Company (US), LLC. Confidential and proprietary. Do not distribute.
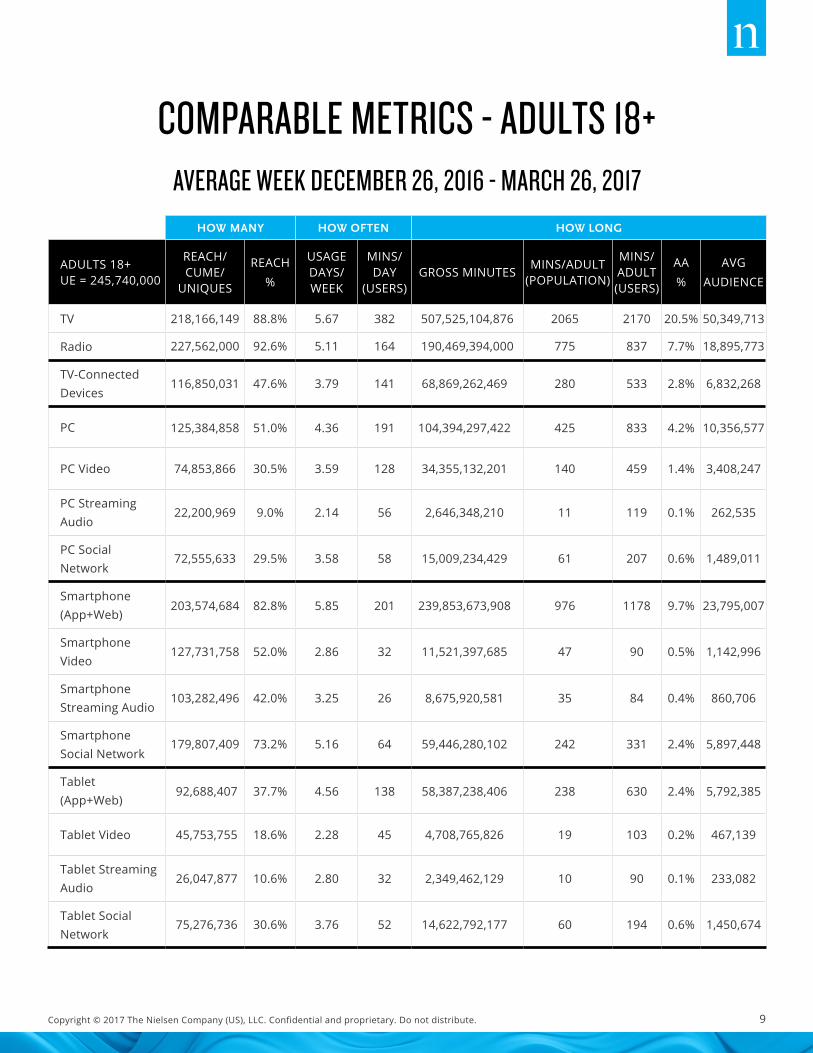
COMPARABLE METRICS - ADULTS 18+AVERAGE WEEK DECEMBER 26, 2016 - MARCH 26, 2017
ADULTS 18+UE = 245,740,000
REACH/CUME/
UNIQUES
REACH%
USAGE DAYS/WEEK
MINS/DAY
(USERS)GROSS MINUTES
MINS/ADULT(POPULATION)
MINS/ADULT(USERS)
AA%
AVG AUDIENCE
TV 218,166,149 88.8% 5.67 382 507,525,104,876 2065 2170 20.5% 50,349,713
Radio 227,562,000 92.6% 5.11 164 190,469,394,000 775 837 7.7% 18,895,773
TV-Connected Devices
116,850,031 47.6% 3.79 141 68,869,262,469 280 533 2.8% 6,832,268
PC 125,384,858 51.0% 4.36 191 104,394,297,422 425 833 4.2% 10,356,577
PC Video 74,853,866 30.5% 3.59 128 34,355,132,201 140 459 1.4% 3,408,247
PC Streaming Audio
22,200,969 9.0% 2.14 56 2,646,348,210 11 119 0.1% 262,535
PC Social Network
72,555,633 29.5% 3.58 58 15,009,234,429 61 207 0.6% 1,489,011
Smartphone (App+Web)
203,574,684 82.8% 5.85 201 239,853,673,908 976 1178 9.7% 23,795,007
Smartphone Video
127,731,758 52.0% 2.86 32 11,521,397,685 47 90 0.5% 1,142,996
Smartphone Streaming Audio
103,282,496 42.0% 3.25 26 8,675,920,581 35 84 0.4% 860,706
Smartphone Social Network
179,807,409 73.2% 5.16 64 59,446,280,102 242 331 2.4% 5,897,448
Tablet (App+Web)
92,688,407 37.7% 4.56 138 58,387,238,406 238 630 2.4% 5,792,385
Tablet Video 45,753,755 18.6% 2.28 45 4,708,765,826 19 103 0.2% 467,139
Tablet Streaming Audio
26,047,877 10.6% 2.80 32 2,349,462,129 10 90 0.1% 233,082
Tablet Social Network
75,276,736 30.6% 3.76 52 14,622,792,177 60 194 0.6% 1,450,674
HOW MANY HOW OFTEN HOW LONG

10Copyright © 2017 The Nielsen Company (US), LLC. Confidential and proprietary. Do not distribute.
COMPARABLE METRICS - PERSONS 18-34AVERAGE WEEK DECEMBER 28, 2015 - MARCH 27, 2016
P18-34UE = 72,850,000
REACH/CUME/
UNIQUES
REACH%
USAGE DAYS/WEEK
MINS/DAY
(USERS)GROSS MINUTES
MINS/ADULT(POPULATION)
MINS/ADULT(USERS)
AA%
AVG AUDIENCE
TV 56,868,752 78.1% 4.76 283 89,200,011,275 1224 1347 12.1% 8,849,207
Radio 67,190,000 92.2% 4.96 143 47,704,900,000 655 710 6.5% 4,732,629
TV-Connected Devices
37,974,921 52.1% 4.05 172 30,717,299,484 422 698 4.2% 3,047,351
PC 33,167,550 45.5% 4.10 208 28,259,042,753 388 852 3.8% 2,803,476
PC Video 20,496,139 28.1% 3.54 154 11,139,652,049 153 544 1.5% 1,105,124
PC Streaming Audio
7,265,771 10.0% 2.41 47 817,394,021 11 112 0.1% 81,091
PC Social Network
18,651,308 25.6% 3.34 50 3,095,938,477 42 166 0.4% 307,137
Smartphone (App+Web)
62,788,777 86.2% 5.94 169 62,876,959,059 863 1001 8.6% 6,237,794
Smartphone Video
43,827,570 60.2% 3.16 22 3,014,692,100 41 69 0.4% 299,077
Smartphone Streaming Audio
34,653,582 47.6% 3.50 34 4,163,734,129 57 120 0.6% 413,069
Smartphone Social Network
56,267,873 77.2% 5.44 69 21,041,585,467 289 374 2.9% 2,087,459
Tablet (App+Web)
28,457,964 39.1% 4.93 116 16,336,672,213 224 574 2.2% 1,620,702
Tablet Video 16,708,154 22.9% 3.02 40 2,005,932,465 28 120 0.3% 199,001
Tablet Streaming Audio
12,294,186 16.9% 3.50 39 1,695,672,953 23 138 0.2% 168,222
Tablet Social Network
22,787,775 31.3% 4.09 43 3,993,512,629 55 175 0.5% 396,182
HOW MANY HOW OFTEN HOW LONG

11Copyright © 2017 The Nielsen Company (US), LLC. Confidential and proprietary. Do not distribute.
COMPARABLE METRICS - PERSONS 18-34AVERAGE WEEK DECEMBER 26, 2016 - MARCH 26, 2017
P18-34UE = 73,460,000
REACH/CUME/
UNIQUES
REACH%
USAGE DAYS/WEEK
MINS/DAY
(USERS)GROSS MINUTES
MINS/ADULT(POPULATION)
MINS/ADULT(USERS)
AA%
AVG AUDIENCE
TV 58,401,410 79.5% 4.74 251 81,095,781,709 1104 1188 11.0% 8,045,216
Radio 67,679,000 92.1% 4.89 142 46,969,226,000 639 694 6.3% 4,659,645
TV-Connected Devices
41,517,679 56.5% 4.34 164 34,067,043,946 464 713 4.6% 3,379,667
PC 33,022,367 45.0% 4.02 197 26,162,211,284 356 792 3.5% 2,595,457
PC Video 19,346,001 26.3% 3.55 201 13,829,431,020 188 715 1.9% 1,371,967
PC Streaming Audio
7,266,162 9.9% 2.28 57 946,040,151 13 130 0.1% 93,853
PC Social Network
17,599,308 24.0% 3.32 53 3,110,504,971 42 177 0.4% 308,582
Smartphone (App+Web)
66,146,313 90.0% 5.76 205 78,000,470,722 1062 1179 10.5% 7,738,142
Smartphone Video
44,628,620 60.8% 3.30 36 5,317,015,331 72 119 0.7% 527,482
Smartphone Streaming Audio
39,769,233 54.1% 3.72 26 3,897,831,152 53 98 0.5% 386,690
Smartphone Social Network
57,105,237 77.7% 5.18 68 20,187,994,800 275 354 2.7% 2,002,777
Tablet (App+Web)
26,562,423 36.2% 4.38 133 15,468,445,331 211 582 2.1% 1,534,568
Tablet Video 13,948,876 19.0% 2.40 59 1,966,638,212 27 141 0.3% 195,103
Tablet Streaming Audio
8,990,061 12.2% 2.89 37 969,796,210 13 108 0.1% 96,210
Tablet Social Network
21,183,288 28.8% 3.63 45 3,438,156,029 47 162 0.5% 341,087
HOW MANY HOW OFTEN HOW LONG
12Copyright © 2017 The Nielsen Company (US), LLC. Confidential and proprietary. Do not distribute.
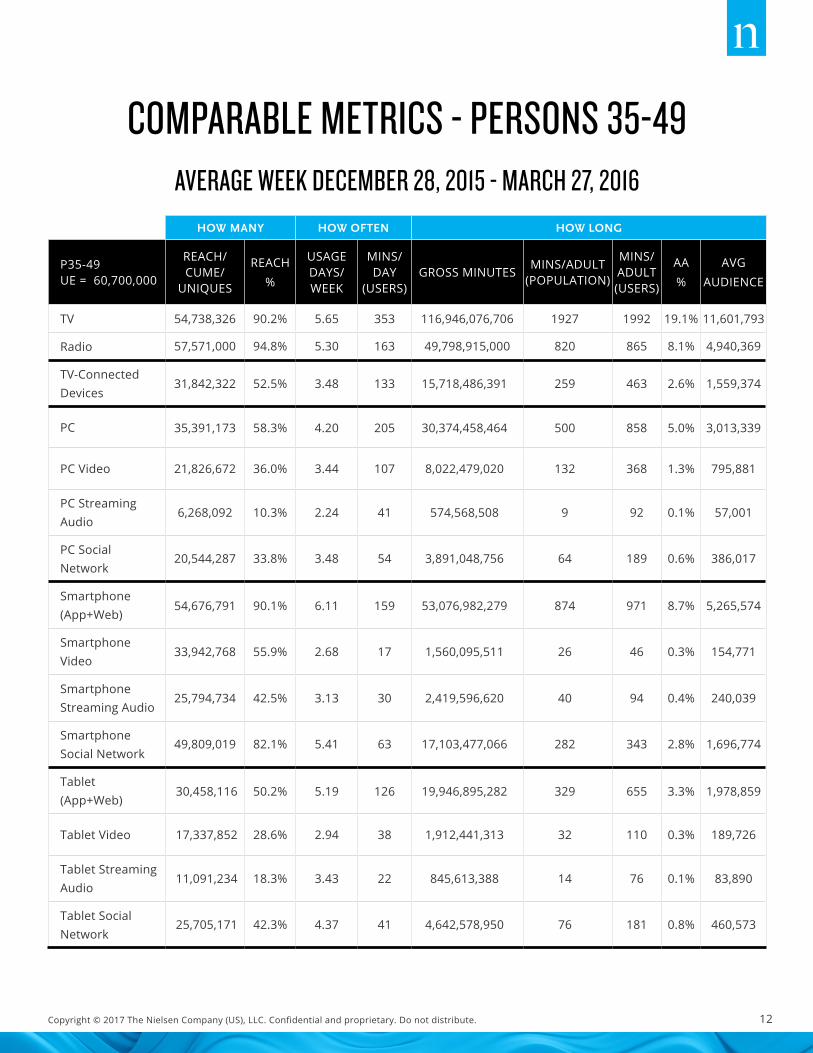
COMPARABLE METRICS - PERSONS 35-49AVERAGE WEEK DECEMBER 28, 2015 - MARCH 27, 2016
P35-49UE = 60,700,000
REACH/CUME/
UNIQUES
REACH%
USAGE DAYS/WEEK
MINS/DAY
(USERS)GROSS MINUTES
MINS/ADULT(POPULATION)
MINS/ADULT(USERS)
AA%
AVG AUDIENCE
TV 54,738,326 90.2% 5.65 353 116,946,076,706 1927 1992 19.1% 11,601,793
Radio 57,571,000 94.8% 5.30 163 49,798,915,000 820 865 8.1% 4,940,369
TV-Connected Devices
31,842,322 52.5% 3.48 133 15,718,486,391 259 463 2.6% 1,559,374
PC 35,391,173 58.3% 4.20 205 30,374,458,464 500 858 5.0% 3,013,339
PC Video 21,826,672 36.0% 3.44 107 8,022,479,020 132 368 1.3% 795,881
PC Streaming Audio
6,268,092 10.3% 2.24 41 574,568,508 9 92 0.1% 57,001
PC Social Network
20,544,287 33.8% 3.48 54 3,891,048,756 64 189 0.6% 386,017
Smartphone (App+Web)
54,676,791 90.1% 6.11 159 53,076,982,279 874 971 8.7% 5,265,574
Smartphone Video
33,942,768 55.9% 2.68 17 1,560,095,511 26 46 0.3% 154,771
Smartphone Streaming Audio
25,794,734 42.5% 3.13 30 2,419,596,620 40 94 0.4% 240,039
Smartphone Social Network
49,809,019 82.1% 5.41 63 17,103,477,066 282 343 2.8% 1,696,774
Tablet (App+Web)
30,458,116 50.2% 5.19 126 19,946,895,282 329 655 3.3% 1,978,859
Tablet Video 17,337,852 28.6% 2.94 38 1,912,441,313 32 110 0.3% 189,726
Tablet Streaming Audio
11,091,234 18.3% 3.43 22 845,613,388 14 76 0.1% 83,890
Tablet Social Network
25,705,171 42.3% 4.37 41 4,642,578,950 76 181 0.8% 460,573
HOW MANY HOW OFTEN HOW LONG
13Copyright © 2017 The Nielsen Company (US), LLC. Confidential and proprietary. Do not distribute.
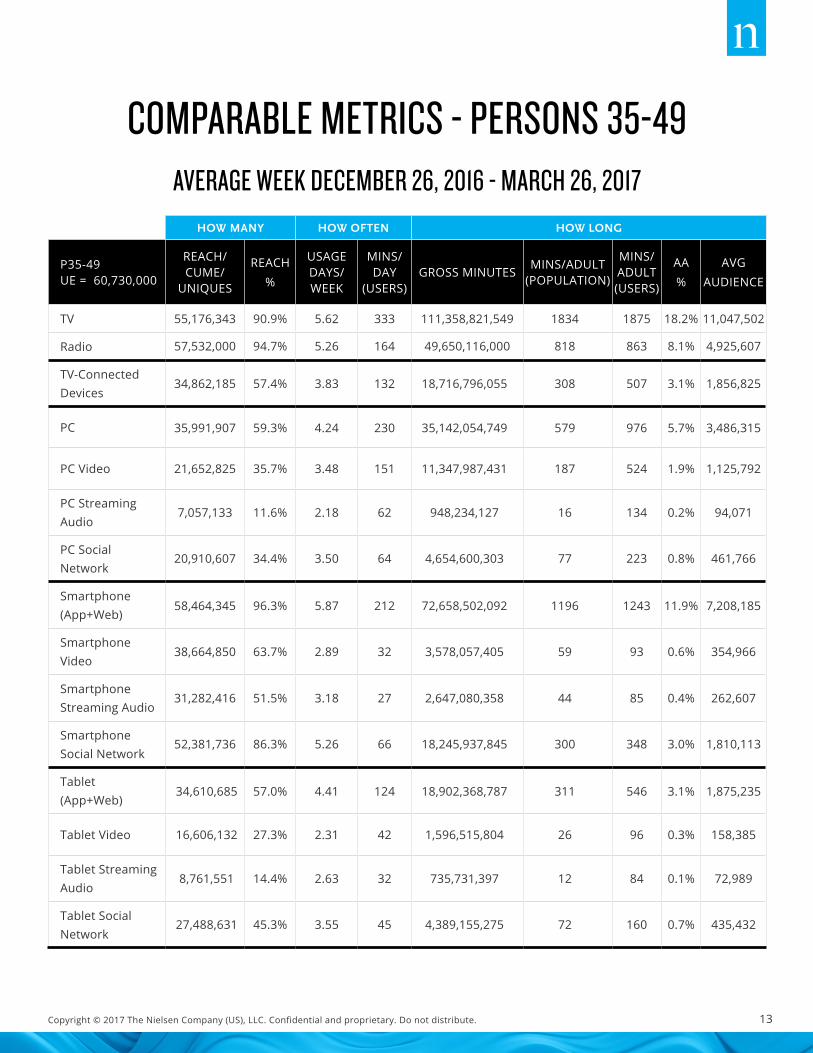
COMPARABLE METRICS - PERSONS 35-49AVERAGE WEEK DECEMBER 26, 2016 - MARCH 26, 2017
P35-49UE = 60,730,000
REACH/CUME/
UNIQUES
REACH%
USAGE DAYS/WEEK
MINS/DAY
(USERS)GROSS MINUTES
MINS/ADULT(POPULATION)
MINS/ADULT(USERS)
AA%
AVG AUDIENCE
TV 55,176,343 90.9% 5.62 333 111,358,821,549 1834 1875 18.2% 11,047,502
Radio 57,532,000 94.7% 5.26 164 49,650,116,000 818 863 8.1% 4,925,607
TV-Connected Devices
34,862,185 57.4% 3.83 132 18,716,796,055 308 507 3.1% 1,856,825
PC 35,991,907 59.3% 4.24 230 35,142,054,749 579 976 5.7% 3,486,315
PC Video 21,652,825 35.7% 3.48 151 11,347,987,431 187 524 1.9% 1,125,792
PC Streaming Audio
7,057,133 11.6% 2.18 62 948,234,127 16 134 0.2% 94,071
PC Social Network
20,910,607 34.4% 3.50 64 4,654,600,303 77 223 0.8% 461,766
Smartphone (App+Web)
58,464,345 96.3% 5.87 212 72,658,502,092 1196 1243 11.9% 7,208,185
Smartphone Video
38,664,850 63.7% 2.89 32 3,578,057,405 59 93 0.6% 354,966
Smartphone Streaming Audio
31,282,416 51.5% 3.18 27 2,647,080,358 44 85 0.4% 262,607
Smartphone Social Network
52,381,736 86.3% 5.26 66 18,245,937,845 300 348 3.0% 1,810,113
Tablet (App+Web)
34,610,685 57.0% 4.41 124 18,902,368,787 311 546 3.1% 1,875,235
Tablet Video 16,606,132 27.3% 2.31 42 1,596,515,804 26 96 0.3% 158,385
Tablet Streaming Audio
8,761,551 14.4% 2.63 32 735,731,397 12 84 0.1% 72,989
Tablet Social Network
27,488,631 45.3% 3.55 45 4,389,155,275 72 160 0.7% 435,432
HOW MANY HOW OFTEN HOW LONG

14Copyright © 2017 The Nielsen Company (US), LLC. Confidential and proprietary. Do not distribute.
COMPARABLE METRICS - PERSONS 50+AVERAGE WEEK DECEMBER 28, 2015 - MARCH 27, 2016
P50+UE = 109,470,000
REACH/CUME/
UNIQUES
REACH%
USAGE DAYS/WEEK
MINS/DAY
(USERS)GROSS MINUTES
MINS/ADULT(POPULATION)
MINS/ADULT(USERS)
AA%
AVG AUDIENCE
TV 101,909,805 93.1% 6.24 467 310,628,226,197 2838 2914 28.2% 30,816,292
Radio 100,161,000 91.5% 5.19 177 92,148,120,000 842 920 8.4% 9,141,679
TV-Connected Devices
36,428,011 33.3% 3.00 120 13,963,557,650 128 359 1.3% 1,385,274
PC 55,671,371 50.9% 4.63 152 39,257,687,247 359 705 3.6% 3,894,612
PC Video 35,382,756 32.3% 3.57 58 7,271,551,005 66 206 0.7% 721,384
PC Streaming Audio
5,996,755 5.5% 1.94 37 427,087,563 4 71 0.0% 42,370
PC Social Network
33,546,947 30.6% 3.74 48 5,981,903,887 55 178 0.5% 593,443
Smartphone (App+Web)
69,175,675 63.2% 5.87 132 53,392,720,552 488 772 4.8% 5,296,897
Smartphone Video
32,328,064 29.5% 2.29 15 1,115,559,681 10 35 0.1% 110,671
Smartphone Streaming Audio
23,987,577 21.9% 2.81 26 1,756,370,830 16 73 0.2% 174,243
Smartphone Social Network
58,564,478 53.5% 4.78 51 14,300,872,669 131 244 1.3% 1,418,737
Tablet (App+Web)
23,758,194 21.7% 5.38 139 17,713,783,316 162 746 1.6% 1,757,320
Tablet Video 12,940,184 11.8% 2.53 22 712,372,151 7 55 0.1% 70,672
Tablet Streaming Audio
7,325,051 6.7% 3.32 39 946,552,604 9 129 0.1% 93,904
Tablet Social Network
20,334,528 18.6% 4.57 39 3,612,305,859 33 178 0.3% 358,364
HOW MANY HOW OFTEN HOW LONG
15Copyright © 2017 The Nielsen Company (US), LLC. Confidential and proprietary. Do not distribute.
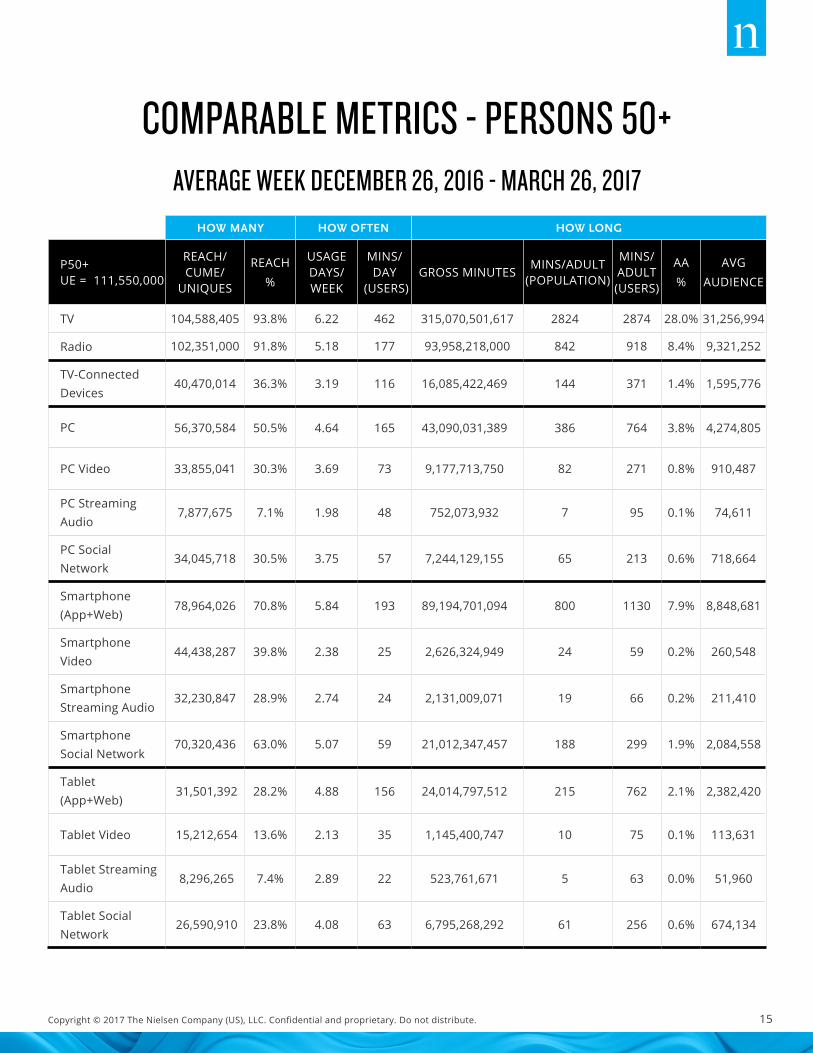
COMPARABLE METRICS - PERSONS 50+AVERAGE WEEK DECEMBER 26, 2016 - MARCH 26, 2017
P50+UE = 111,550,000
REACH/CUME/
UNIQUES
REACH%
USAGE DAYS/WEEK
MINS/DAY
(USERS)GROSS MINUTES
MINS/ADULT(POPULATION)
MINS/ADULT(USERS)
AA%
AVG AUDIENCE
TV 104,588,405 93.8% 6.22 462 315,070,501,617 2824 2874 28.0% 31,256,994
Radio 102,351,000 91.8% 5.18 177 93,958,218,000 842 918 8.4% 9,321,252
TV-Connected Devices
40,470,014 36.3% 3.19 116 16,085,422,469 144 371 1.4% 1,595,776
PC 56,370,584 50.5% 4.64 165 43,090,031,389 386 764 3.8% 4,274,805
PC Video 33,855,041 30.3% 3.69 73 9,177,713,750 82 271 0.8% 910,487
PC Streaming Audio
7,877,675 7.1% 1.98 48 752,073,932 7 95 0.1% 74,611
PC Social Network
34,045,718 30.5% 3.75 57 7,244,129,155 65 213 0.6% 718,664
Smartphone (App+Web)
78,964,026 70.8% 5.84 193 89,194,701,094 800 1130 7.9% 8,848,681
Smartphone Video
44,438,287 39.8% 2.38 25 2,626,324,949 24 59 0.2% 260,548
Smartphone Streaming Audio
32,230,847 28.9% 2.74 24 2,131,009,071 19 66 0.2% 211,410
Smartphone Social Network
70,320,436 63.0% 5.07 59 21,012,347,457 188 299 1.9% 2,084,558
Tablet (App+Web)
31,501,392 28.2% 4.88 156 24,014,797,512 215 762 2.1% 2,382,420
Tablet Video 15,212,654 13.6% 2.13 35 1,145,400,747 10 75 0.1% 113,631
Tablet Streaming Audio
8,296,265 7.4% 2.89 22 523,761,671 5 63 0.0% 51,960
Tablet Social Network
26,590,910 23.8% 4.08 63 6,795,268,292 61 256 0.6% 674,134
HOW MANY HOW OFTEN HOW LONG
16Copyright © 2017 The Nielsen Company (US), LLC. Confidential and proprietary. Do not distribute.
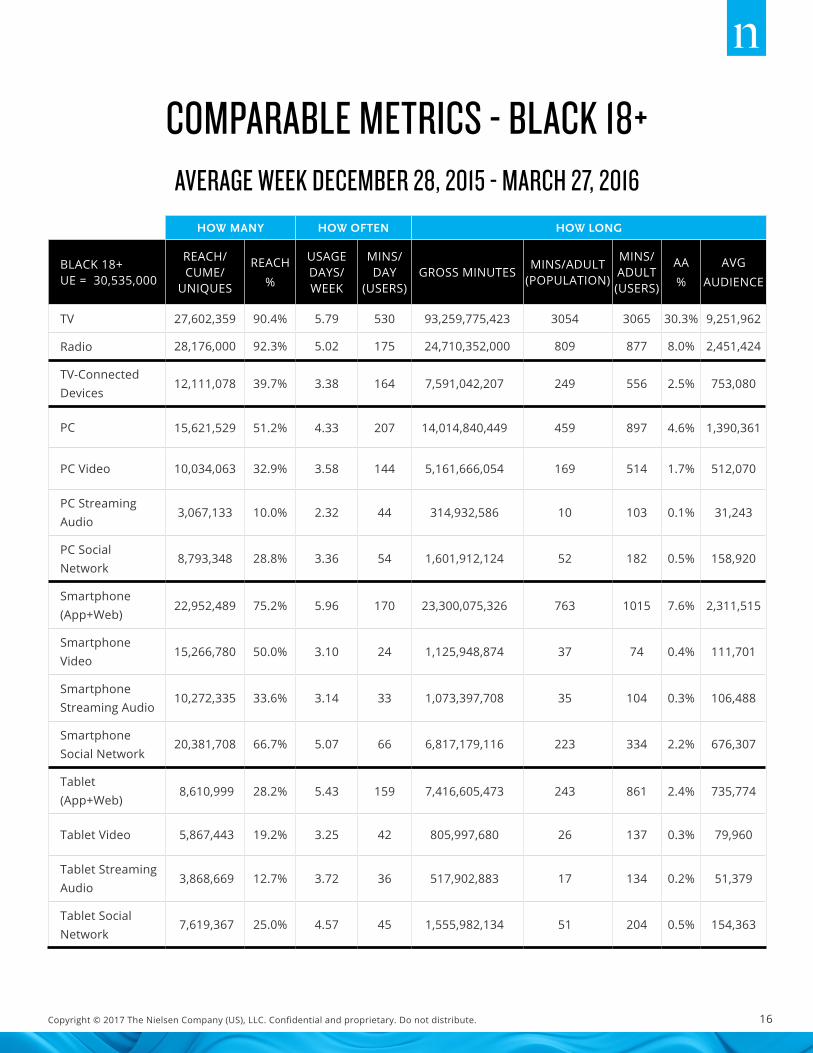
COMPARABLE METRICS - BLACK 18+AVERAGE WEEK DECEMBER 28, 2015 - MARCH 27, 2016
BLACK 18+UE = 30,535,000
REACH/CUME/
UNIQUES
REACH%
USAGE DAYS/WEEK
MINS/DAY
(USERS)GROSS MINUTES
MINS/ADULT(POPULATION)
MINS/ADULT(USERS)
AA%
AVG AUDIENCE
TV 27,602,359 90.4% 5.79 530 93,259,775,423 3054 3065 30.3% 9,251,962
Radio 28,176,000 92.3% 5.02 175 24,710,352,000 809 877 8.0% 2,451,424
TV-Connected Devices
12,111,078 39.7% 3.38 164 7,591,042,207 249 556 2.5% 753,080
PC 15,621,529 51.2% 4.33 207 14,014,840,449 459 897 4.6% 1,390,361
PC Video 10,034,063 32.9% 3.58 144 5,161,666,054 169 514 1.7% 512,070
PC Streaming Audio
3,067,133 10.0% 2.32 44 314,932,586 10 103 0.1% 31,243
PC Social Network
8,793,348 28.8% 3.36 54 1,601,912,124 52 182 0.5% 158,920
Smartphone (App+Web)
22,952,489 75.2% 5.96 170 23,300,075,326 763 1015 7.6% 2,311,515
Smartphone Video
15,266,780 50.0% 3.10 24 1,125,948,874 37 74 0.4% 111,701
Smartphone Streaming Audio
10,272,335 33.6% 3.14 33 1,073,397,708 35 104 0.3% 106,488
Smartphone Social Network
20,381,708 66.7% 5.07 66 6,817,179,116 223 334 2.2% 676,307
Tablet (App+Web)
8,610,999 28.2% 5.43 159 7,416,605,473 243 861 2.4% 735,774
Tablet Video 5,867,443 19.2% 3.25 42 805,997,680 26 137 0.3% 79,960
Tablet Streaming Audio
3,868,669 12.7% 3.72 36 517,902,883 17 134 0.2% 51,379
Tablet Social Network
7,619,367 25.0% 4.57 45 1,555,982,134 51 204 0.5% 154,363
HOW MANY HOW OFTEN HOW LONG

17Copyright © 2017 The Nielsen Company (US), LLC. Confidential and proprietary. Do not distribute.
COMPARABLE METRICS - BLACK 18+AVERAGE WEEK DECEMBER 26, 2016 - MARCH 26, 2017
BLACK 18+UE = 30,897,000
REACH/CUME/
UNIQUES
REACH%
USAGE DAYS/WEEK
MINS/DAY
(USERS)GROSS MINUTES
MINS/ADULT(POPULATION)
MINS/ADULT(USERS)
AA%
AVG AUDIENCE
TV 28,164,212 91.2% 5.77 507 90,957,899,034 2944 2924 29.2% 9,023,601
Radio 28,785,000 93.2% 5.02 175 25,302,015,000 819 879 8.1% 2,510,121
TV-Connected Devices
13,395,506 43.4% 3.69 162 9,232,503,160 299 597 3.0% 915,923
PC 16,082,532 52.1% 4.28 222 15,256,006,631 494 949 4.9% 1,513,493
PC Video 9,615,068 31.1% 3.55 183 6,249,010,173 202 650 2.0% 619,941
PC Streaming Audio
3,079,524 10.0% 2.17 58 387,564,169 13 126 0.1% 38,449
PC Social Network
8,584,121 27.8% 3.30 61 1,725,189,428 56 201 0.6% 171,150
Smartphone (App+Web)
25,115,647 81.3% 5.89 237 35,075,740,821 1135 1397 11.3% 3,479,736
Smartphone Video
18,309,544 59.3% 3.21 40 2,375,307,595 77 130 0.8% 235,646
Smartphone Streaming Audio
13,690,371 44.3% 3.29 30 1,372,858,599 44 100 0.4% 136,196
Smartphone Social Network
22,312,875 72.2% 5.10 72 8,162,957,696 264 366 2.6% 809,817
Tablet (App+Web)
11,139,399 36.1% 4.81 155 8,305,151,418 269 746 2.7% 823,924
Tablet Video 6,511,280 21.1% 2.38 59 920,520,888 30 141 0.3% 91,322
Tablet Streaming Audio
3,838,994 12.4% 2.94 34 387,345,732 13 101 0.1% 38,427
Tablet Social Network
9,513,715 30.8% 3.95 42 1,592,792,667 52 167 0.5% 158,015
HOW MANY HOW OFTEN HOW LONG

18Copyright © 2017 The Nielsen Company (US), LLC. Confidential and proprietary. Do not distribute.
COMPARABLE METRICS - HISPANIC 18+AVERAGE WEEK DECEMBER 28, 2015 - MARCH 27, 2016
HISPANIC 18+UE = 37,110,000
REACH/CUME/
UNIQUES
REACH%
USAGE DAYS/WEEK
MINS/DAY
(USERS)GROSS MINUTES
MINS/ADULT(POPULATION)
MINS/ADULT(USERS)
AA%
AVG AUDIENCE
TV 33,264,147 89.6% 5.38 314 60,594,716,104 1633 1688 16.2% 6,011,381
Radio 35,945,000 96.9% 5.27 161 30,517,305,000 822 849 8.2% 3,027,510
TV-Connected Devices
16,698,674 45.0% 3.40 146 9,115,946,292 246 497 2.4% 904,360
PC 13,707,976 36.9% 3.97 210 11,447,032,674 308 835 3.1% 1,135,618
PC Video 8,101,252 21.8% 3.35 155 4,213,157,976 114 520 1.1% 417,972
PC Streaming Audio
2,434,937 6.6% 2.19 47 250,847,050 7 103 0.1% 24,886
PC Social Network
7,022,805 18.9% 3.18 49 1,088,135,402 29 155 0.3% 107,950
Smartphone (App+Web)
32,160,386 86.7% 5.95 168 32,084,216,636 865 998 8.6% 3,182,958
Smartphone Video
21,993,740 59.3% 3.19 23 1,626,331,431 44 74 0.4% 161,342
Smartphone Streaming Audio
16,069,346 43.3% 3.33 37 1,984,015,712 53 123 0.5% 196,827
Smartphone Social Network
28,433,253 76.6% 5.28 69 10,309,766,114 278 363 2.8% 1,022,794
Tablet (App+Web)
7,160,378 19.3% 4.94 106 3,749,398,341 101 524 1.0% 371,964
Tablet Video 3,979,420 10.7% 3.03 34 403,921,985 11 102 0.1% 40,072
Tablet Streaming Audio
2,771,252 7.5% 3.31 41 374,350,463 10 135 0.1% 37,138
Tablet Social Network
5,710,541 15.4% 3.94 34 775,554,252 21 136 0.2% 76,940
HOW MANY HOW OFTEN HOW LONG
19Copyright © 2017 The Nielsen Company (US), LLC. Confidential and proprietary. Do not distribute.
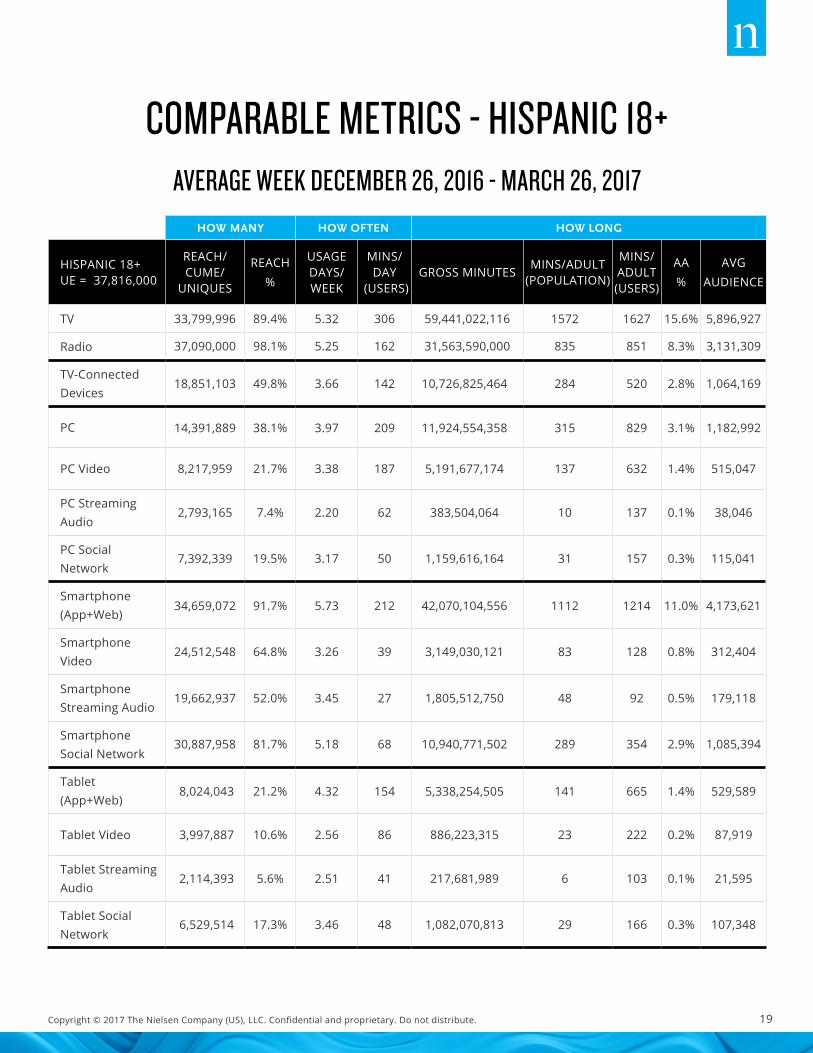
COMPARABLE METRICS - HISPANIC 18+AVERAGE WEEK DECEMBER 26, 2016 - MARCH 26, 2017
HISPANIC 18+UE = 37,816,000
REACH/CUME/
UNIQUES
REACH%
USAGE DAYS/WEEK
MINS/DAY
(USERS)GROSS MINUTES
MINS/ADULT(POPULATION)
MINS/ADULT(USERS)
AA%
AVG AUDIENCE
TV 33,799,996 89.4% 5.32 306 59,441,022,116 1572 1627 15.6% 5,896,927
Radio 37,090,000 98.1% 5.25 162 31,563,590,000 835 851 8.3% 3,131,309
TV-Connected Devices
18,851,103 49.8% 3.66 142 10,726,825,464 284 520 2.8% 1,064,169
PC 14,391,889 38.1% 3.97 209 11,924,554,358 315 829 3.1% 1,182,992
PC Video 8,217,959 21.7% 3.38 187 5,191,677,174 137 632 1.4% 515,047
PC Streaming Audio
2,793,165 7.4% 2.20 62 383,504,064 10 137 0.1% 38,046
PC Social Network
7,392,339 19.5% 3.17 50 1,159,616,164 31 157 0.3% 115,041
Smartphone (App+Web)
34,659,072 91.7% 5.73 212 42,070,104,556 1112 1214 11.0% 4,173,621
Smartphone Video
24,512,548 64.8% 3.26 39 3,149,030,121 83 128 0.8% 312,404
Smartphone Streaming Audio
19,662,937 52.0% 3.45 27 1,805,512,750 48 92 0.5% 179,118
Smartphone Social Network
30,887,958 81.7% 5.18 68 10,940,771,502 289 354 2.9% 1,085,394
Tablet (App+Web)
8,024,043 21.2% 4.32 154 5,338,254,505 141 665 1.4% 529,589
Tablet Video 3,997,887 10.6% 2.56 86 886,223,315 23 222 0.2% 87,919
Tablet Streaming Audio
2,114,393 5.6% 2.51 41 217,681,989 6 103 0.1% 21,595
Tablet Social Network
6,529,514 17.3% 3.46 48 1,082,070,813 29 166 0.3% 107,348
HOW MANY HOW OFTEN HOW LONG

20Copyright © 2017 The Nielsen Company (US), LLC. Confidential and proprietary. Do not distribute.
COMPARABLE METRICS - ASIAN AMERICAN 18+AVERAGE WEEK DECEMBER 28, 2015 - MARCH 27, 2016
ASIAN AMERICAN 18+UE = 14,634,000
REACH/CUME/
UNIQUES
REACH%
USAGE DAYS/WEEK
MINS/DAY
(USERS)GROSS MINUTES
MINS/ADULT(POPULATION)
MINS/ADULT(USERS)
AA%
AVG AUDIENCE
TV 11,070,849 75.7% 4.90 262 15,621,289,055 1067 1284 10.6% 1,549,731
TV-Connected Devices
6,775,351 46.3% 3.68 140 3,754,871,185 257 517 2.5% 372,507
PC 4,178,360 28.6% 4.29 206 3,695,898,450 253 885 2.5% 366,657
PC Video 2,684,512 18.3% 3.59 144 1,385,024,999 95 516 0.9% 137,403
PC Streaming Audio
761,466 5.2% 2.30 29 49,979,991 3 66 0.0% 4,958
PC Social Network
2,404,552 16.4% 3.39 37 303,269,850 21 126 0.2% 30,086
Smartphone (App+Web)
10,633,820 72.7% 5.54 151 8,879,915,822 607 835 6.0% 880,944
Smartphone Video
6,524,339 44.6% 3.17 24 506,110,380 35 78 0.3% 50,209
Smartphone Streaming Audio
4,680,474 32.0% 3.49 30 496,080,566 34 106 0.3% 49,214
Smartphone Social Network
8,662,468 59.2% 4.95 55 2,376,839,224 162 274 1.6% 235,798
Tablet (App+Web)
3,953,461 27.0% 4.91 105 2,045,372,463 140 517 1.4% 202,914
Tablet Video 2,145,352 14.7% 3.10 46 307,348,143 21 143 0.2% 30,491
Tablet Streaming Audio
919,840 6.3% 3.22 37 109,224,856 7 119 0.1% 10,836
Tablet Social Network
3,105,846 21.2% 3.63 26 292,165,976 20 94 0.2% 28,985
HOW MANY HOW OFTEN HOW LONG
Radio measurement includes Asian Americans but cannot be separated from the total audience at this time

21Copyright © 2017 The Nielsen Company (US), LLC. Confidential and proprietary. Do not distribute.
COMPARABLE METRICS - ASIAN AMERICAN 18+AVERAGE WEEK DECEMBER 26, 2016 - MARCH 26, 2017
ASIAN AMERICAN 18+UE = 15,537,000
REACH/CUME/
UNIQUES
REACH%
USAGE DAYS/WEEK
MINS/DAY
(USERS)GROSS MINUTES
MINS/ADULT(POPULATION)
MINS/ADULT(USERS)
AA%
AVG AUDIENCE
TV 11,554,007 74.4% 4.87 244 15,115,920,981 973 1191 9.7% 1,499,595
TV-Connected Devices
7,735,679 49.8% 3.78 140 4,407,206,310 284 530 2.8% 437,223
PC 4,586,691 29.5% 4.53 202 4,205,361,090 271 917 2.7% 417,199
PC Video 2,972,452 19.1% 3.73 166 1,838,391,788 118 618 1.2% 182,380
PC Streaming Audio
884,808 5.7% 2.24 36 71,339,497 5 81 0.0% 7,077
PC Social Network
2,681,094 17.3% 3.56 46 441,330,563 28 165 0.3% 43,783
Smartphone (App+Web)
11,555,888 74.4% 5.49 186 11,787,027,068 759 1020 7.5% 1,169,348
Smartphone Video
7,088,127 45.6% 2.89 32 660,042,711 42 93 0.4% 65,480
Smartphone Streaming Audio
5,896,233 37.9% 3.54 27 553,923,211 36 94 0.4% 54,953
Smartphone Social Network
9,254,908 59.6% 4.82 53 2,384,907,649 153 258 1.5% 236,598
Tablet (App+Web)
3,882,994 25.0% 4.01 85 1,326,425,861 85 342 0.8% 131,590
Tablet Video 2,030,657 13.1% 2.43 136 669,859,807 43 330 0.4% 66,454
Tablet Streaming Audio
1,029,454 6.6% 2.73 16 43,924,762 3 43 0.0% 4,358
Tablet Social Network
2,859,804 18.4% 2.95 25 207,710,348 13 73 0.1% 20,606
HOW MANY HOW OFTEN HOW LONG
Radio measurement includes Asian Americans but cannot be separated from the total audience at this time

22Copyright © 2017 The Nielsen Company (US), LLC. Confidential and proprietary. Do not distribute.
DIGITAL AUDIENCE MEASUREMENTIncludes Does Not Include
PC Home and work PC measurement of URLs and Internet Applications such as instant messengers, media players, and web phones
Non-browser requested URLs on-Internet Applications such as office apps, most games, and email apps
PC Video Both active (tagged) and passive (non-tagged) publisher measurement
Untagged content among active publishers, content that has been tagged for less than one full month
PC Streaming Audio Sites and Internet Applications specifically designed to provide audio content when they are in the foreground (Ex. Pandora, Spotify, iHeartRadio)
Audio content through YouTube, VEVO, and other sites that also provide video capabilities. Duration is not credited if the page is in the background or the user is inactive for over 30 minutes (Excludes Internet applications like Spotify or Apple Music)
PC Social Network All sites in the Member Communities subcategory as defined in the Nielsen NetView dictionary
Reddit, YouTube, and other sites with active public forums and comment sections
Smartphone (App+Web) Android: all app/web activity, measured passively iOS: all activity routed through an http and https proxy for both app and browser URLs
iOS apps with no http/https activity(Ex. Calculator, Notes)Email activity through the standard Mail app for iOS Standard text messaging is not included
Smartphone Video Apps and sites specifically designed to view video content (Ex. Netflix, YouTube, HBOGO)
Video content available through apps/web where video is not the primary focus (Ex. CNN, Weather Channel, Facebook)
Smartphone Streaming Audio Apps and sites specifically designed to provide audio content (Ex. Pandora, Spotify, iHeartRadio)
Audio content through YouTube, VEVO, and other apps that also provide video capabilities
Smartphone Social Network All apps/sites in the Social Networking subcategory as defined in the Nielsen EMM dictionary
Reddit, YouTube, and other sites with active public forums and comment sections
Tablet (App+Web) iOS: all activity routed through an http and https proxy for both app and browser URLs
Android tablets, iOS apps with no http/https activity mail activity through the standard Mail app for iOS Standard text messaging is not included
Tablet Video Apps and sites specifically designed to view video content (Ex. Netflix, YouTube, HBOGO)
Video content available through apps/web where video is not the primary focus (Ex. CNN, Weather Channel, Facebook)
Tablet Streaming Audio Apps and sites specifically designed to provide audio content (Ex. Pandora, Spotify, iHeartRadio)
Audio content through YouTube, VEVO, and other apps that also provide video capabilities
Tablet Social Network All apps/sites in the Social Networking subcategory as defined in the Nielsen EMM dictionary
Reddit, YouTube, and other sites with active public forums and comment sections

23Copyright © 2017 The Nielsen Company (US), LLC. Confidential and proprietary. Do not distribute.
SOURCING & METHODOLOGIESTELEVISION METHODOLOGYLive+DVR/Time-shifted TV includes Live usage plus any playback viewing within the measurement period. DVR/Time-shifted TV is playback primarily on a DVR but includes playback from video on demand, DVD recorders, server based DVR’s and services like Start Over.
TV connected devices (DVD, Game Console, Multimedia Device, VCR) would include content being viewed on the TV through these devices. This would include when these devices are in use for any purpose, not just for accessing media content. For example, Game Console would also include when the game console is being used to play video games.
Multimedia Devices is a combination of usage of the Internet Connected Devices viewing source and Audio-Video viewing sources. It would include viewing on an Apple TV, Roku, Google Chromecast, Smartphone, Computer/Laptop, etc. connected to the TV.
Reach for television and TV-connected devices includes those viewing at least one minute within the measurement period.
Data used in this report is inclusive of multicultural audiences. Hispanic consumer audiences are comprised of both English and Spanish speaking representative populations.
The last phase of a two-year sample expansion initiative (referred to as NPX) was completed on December 28, 2015, essentially doubling the sample size of our National Panel. The official production ratings that comprise Nielsen’s National television measurement service will be based on the larger panel of households. As with any past panel enhancements or methodology change, there is a trend break in the data when looking at year-over-year comparisons.

24Copyright © 2017 The Nielsen Company (US), LLC. Confidential and proprietary. Do not distribute.
AM/FM RADIO METHODOLOGYAM/FM Radio includes listening to programming from AM/FM radio stations or network programming.
Audience estimates for 48 large markets are based on a panel of people who carry a portable device called a Personal People Meter (PPM) that passively detects exposure to content that contains inaudible codes embedded within the program content. Audience estimates from the balance of markets and counties in the U.S. are based on surveys of people who record their listening in a written diary for a week.
The estimates in this report are based on RADAR and the National Regional Database. RADAR reports national network radio ratings covering the U.S. using both PPM and Diary measurement and it is based on a rolling one-year average of nearly 400,000 respondents aged 12+ per year.
Listening to HD radio broadcasts, Internet streams of AM/FM radio stations and Satellite Radio is included in the Persons Using Radio estimates in this report where the tuning meets our reporting and crediting requirements of at least 5 minutes of usage.
Data used in this report is inclusive of multicultural audiences. Hispanic consumer audiences are comprised of both English and Spanish speaking representative populations.
Universe Estimates for radio were not adjusted to account for changes in the month of September.
ONLINE METHODOLOGYNielsen Netview and VideoCensus data is reflective of the hybrid methodology which combines a census level accounting of page views and video streams where Nielsen measurement tags have been deployed in order to project audience and behavior to the full universe of all Internet users. For VideoCensus, the portion of the total video streams calibrated by census data, previously allocated to Home/Work computers, are now allocated to other devices and locations such as smartphones and viewing outside of home and work. Nielsen’s Online Panel is recruited through both probability-weighted and convenience panels which are recruited in Spanish and English.

25Copyright © 2017 The Nielsen Company (US), LLC. Confidential and proprietary. Do not distribute.
Hours:minutes for Internet and video use are based on the universe of persons who used the Internet/watched online video. While the audience of Video on a PC is a subset of Internet on a PC, overall time spent for Video on a PC should not be subtracted from Internet on a PC due to variations in the methodology and calculations.
For passively measured video, audience and duration are credited when a) video content is rendered and the stream URL matches Nielsen’s classification and b) if the meter detects audio. Actively measured/tagged video is credited when the meter detects and collects the tags from the video playback metadata. Duration is observed from the computer panel and then weighted/projected. If no audio is detected neither audience nor duration is credited.
As of August 2015, the rules used for crediting page views and duration within Netview have been updated with more comprehensive accounting of multi-tabbed browsing and iFrames, as well as the implementation of a longer timeout threshold for mouse/keyboard inactivity. These changes resulted in an increase in Internet duration on a PC.
Meter collection capability improved in February 2016, which generally resulted in increased audience, page view, stream and duration metrics for Internet on a PC.
MOBILE METHODOLOGYNielsen’s Electronic Mobile Measurement (EMM) is an observational, user-centric approach that uses passive metering technology on smartphones and tablets to track device and application usage on an opt-in convenience panel, recruited online and in English, and as such, have limited representation of non-English speaking panelists. This limited representation may understate metrics of non-English speaking language audiences. There are approximately 9,000 smartphone and 1,300 tablet panelists in the U.S. across both iOS and Android smartphone devices. This method provides a holistic view of all activity on the device as the behavior is being tracked without interruption.
A number of steps are taken after the data collection process to ensure the reported data is representative of the mobile population. For

26Copyright © 2017 The Nielsen Company (US), LLC. Confidential and proprietary. Do not distribute.
smartphones, weighting controls are applied across five characteristics (gender, age, income, race and ethnicity) while independent enumeration studies are carried out on a continuous basis to provide the most current estimates of the mobile population (aka Universe Estimation).
Tablet data is unweighted and projections are applied using estimates from the National panel that is the industry standard for TV Ratings.
In Q3 2015 Nielsen updated measurement of the Streaming Audio subcategory to accurately reflect new entrants to the market and updates to existing services. One popular service also implemented a free trial during the reporting period. These changes resulted in an increase in users and usage on smartphones and tablets.
Nielsen implemented a crediting enhancement to improve the reporting of mobile usage on iOS devices in March 2016 and Android devices in August 2016. A legacy crediting rule that capped usage at 30 minutes was removed, so now if a panelist uses an app or visits a website for more than 30 minutes at a time the entire duration is now credited towards the app or website. There are no minimum qualifiers; crediting begins when the site or app is loaded in the foreground of the device.
SOURCINGLive+DVR/Time-shifted TV, TV-Connected Devices (DVD, Game Console, Multimedia Device, VCR) 12/28/15-03/27/16, 12/26/16-03/26/17 via Nielsen NPOWER/NPM Panel, Radio 03/24/16-03/29/17, 03/26/15-03/23/16 via RADAR 133, RADAR 129, PC-Total, Streaming Audio, Social Networking 12/28/15-03/27/16, 12/26/16-03/26/17 via Nielsen Netview, PC Streaming Video 12/28/15-03/27/16, 12/26/16-03/26/17 via Nielsen VideoCensus, Smartphone - App/Web Total, Streaming VIdeo, Streaming Audio, Social Networking 12/28/15-03/27/16, 12/26/16-03/26/17 via Nielsen Electronic Mobile Measurement, iOS and Android, Tablet - App/Web Total, Streaming Video, Streaming Audio, Social Networking 12/28/15-03/27/16, 12/26/16-03/26/17 via Nielsen Electronic Mobile Measurement - unweighted, projections based on estimates from the NPOWER/NPM Panel.

27Copyright © 2017 The Nielsen Company (US), LLC. Confidential and proprietary. Do not distribute.
ABOUT NIELSENNielsen Holdings plc (NYSE: NLSN) is a global performance management company that provides a comprehensive understanding of what consumers watch and buy. Nielsen’s Watch segment provides media and advertising clients with Nielsen Total Audience measurement services for all devices on which content — video, audio and text — is consumed. The Buy segment offers consumer packaged goods manufacturers and retailers the industry’s only global view of retail performance measurement. By integrating information from its Watch and Buy segments and other data sources, Nielsen also provides its clients with analytics that help improve performance. Nielsen, an S&P 500 company, has operations in over 100 countries, covering more than 90% of the world’s population. For more information, visit www.nielsen.com.