The nickel market outlook - can the laterite revolution continue?
34
The nickel market outlook – can the laterite revolution continue? July 2013 Jim Lennon Consultant to: Macquarie Capital Securities (Europe) Ltd +44 203 037 4271 [email protected] In preparing this research, we did not take into account the investment objectives, financial situation and particular needs of the reader. Before making an investment decision on the basis of this research, the reader needs to consider, with or without the assistance of an adviser, whether the advice is appropriate in light of their particular investment needs, objectives and financial circumstances. Please see disclaimer. Page 1
-
Upload
informa-australia -
Category
Business
-
view
4.899 -
download
0
Transcript of The nickel market outlook - can the laterite revolution continue?
The nickel market outlook – can the laterite
revolution continue?
July 2013
Jim Lennon
Consultant to:
Macquarie Capital Securities (Europe) Ltd
+44 203 037 4271
In preparing this research, we did not take into account the investment objectives, financial situation and particular needs of the reader. Before making an investment decision on the basis of this research,
the reader needs to consider, with or without the assistance of an adviser, whether the advice is appropriate in light of their particular investment needs, objectives and financial circumstances. Please see
disclaimer.
Page 1
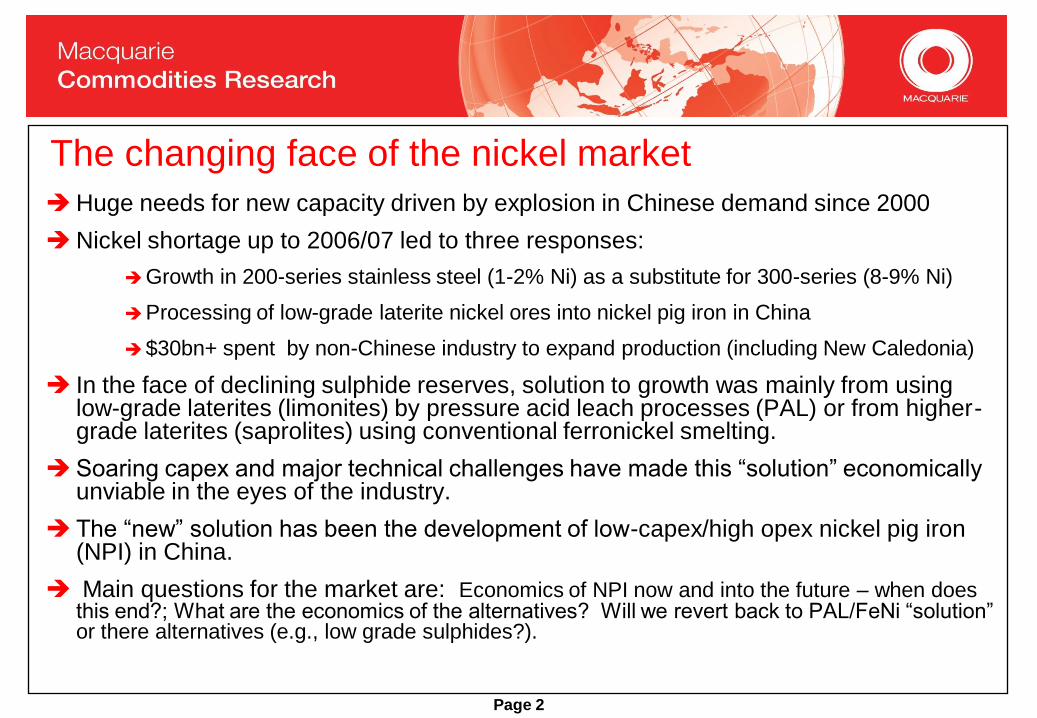
The changing face of the nickel market
Huge needs for new capacity driven by explosion in Chinese demand since 2000
Nickel shortage up to 2006/07 led to three responses:
Growth in 200-series stainless steel (1-2% Ni) as a substitute for 300-series (8-9% Ni)
Processing of low-grade laterite nickel ores into nickel pig iron in China
$30bn+ spent by non-Chinese industry to expand production (including New Caledonia)
In the face of declining sulphide reserves, solution to growth was mainly from using low-grade laterites (limonites) by pressure acid leach processes (PAL) or from higher-grade laterites (saprolites) using conventional ferronickel smelting.
Soaring capex and major technical challenges have made this “solution” economically unviable in the eyes of the industry.
The “new” solution has been the development of low-capex/high opex nickel pig iron (NPI) in China.
Main questions for the market are: Economics of NPI now and into the future – when does this end?; What are the economics of the alternatives? Will we revert back to PAL/FeNi “solution” or there alternatives (e.g., low grade sulphides?).
Page 2
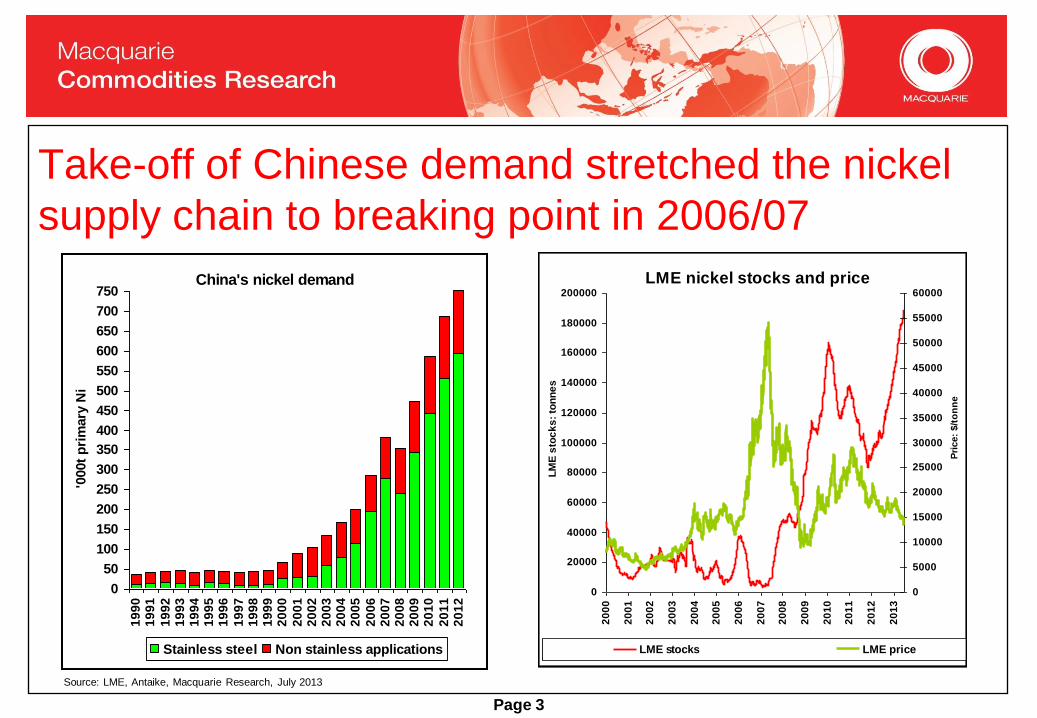
Take-off of Chinese demand stretched the nickel
supply chain to breaking point in 2006/07
China's nickel demand
0
50
100
150
200
250
300
350
400
450
500
550
600
650
700
750
19
90
19
91
19
92
19
93
19
94
19
95
19
96
19
97
19
98
19
99
20
00
20
01
20
02
20
03
20
04
20
05
20
06
20
07
20
08
20
09
20
10
20
11
20
12
'000t
pri
mary
Ni
Stainless steel Non stainless applications
Page 3
Source: LME, Antaike, Macquarie Research, July 2013
LME nickel stocks and price
0
20000
40000
60000
80000
100000
120000
140000
160000
180000
200000
20
00
20
01
20
02
20
03
20
04
20
05
20
06
20
07
20
08
20
09
20
10
20
11
20
12
20
13
LM
E s
toc
ks
: to
nn
es
0
5000
10000
15000
20000
25000
30000
35000
40000
45000
50000
55000
60000
Pri
ce:
$/t
on
ne
LME stocks LME price
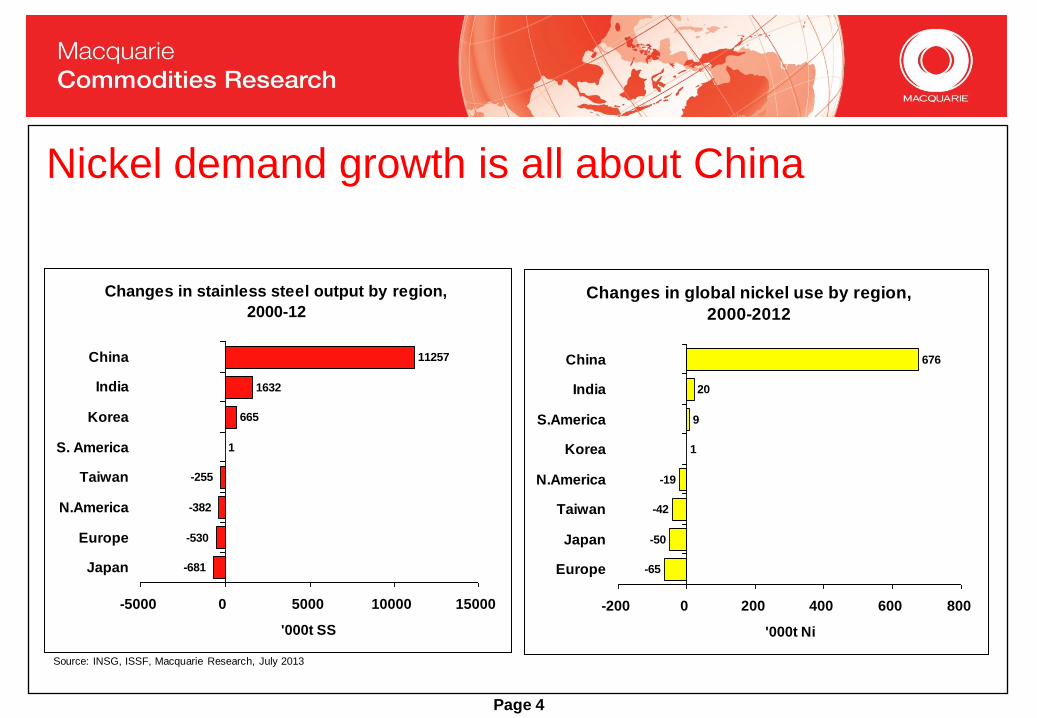
Nickel demand growth is all about China
Changes in stainless steel output by region,
2000-12
-681
-530
-382
-255
1
665
1632
11257
-5000 0 5000 10000 15000
Japan
Europe
N.America
Taiwan
S. America
Korea
India
China
'000t SS
Changes in global nickel use by region,
2000-2012
-65
-50
-42
-19
1
9
20
676
-200 0 200 400 600 800
Europe
Japan
Taiwan
N.America
Korea
S.America
India
China
'000t Ni
Source: INSG, ISSF, Macquarie Research, July 2013
Page 4
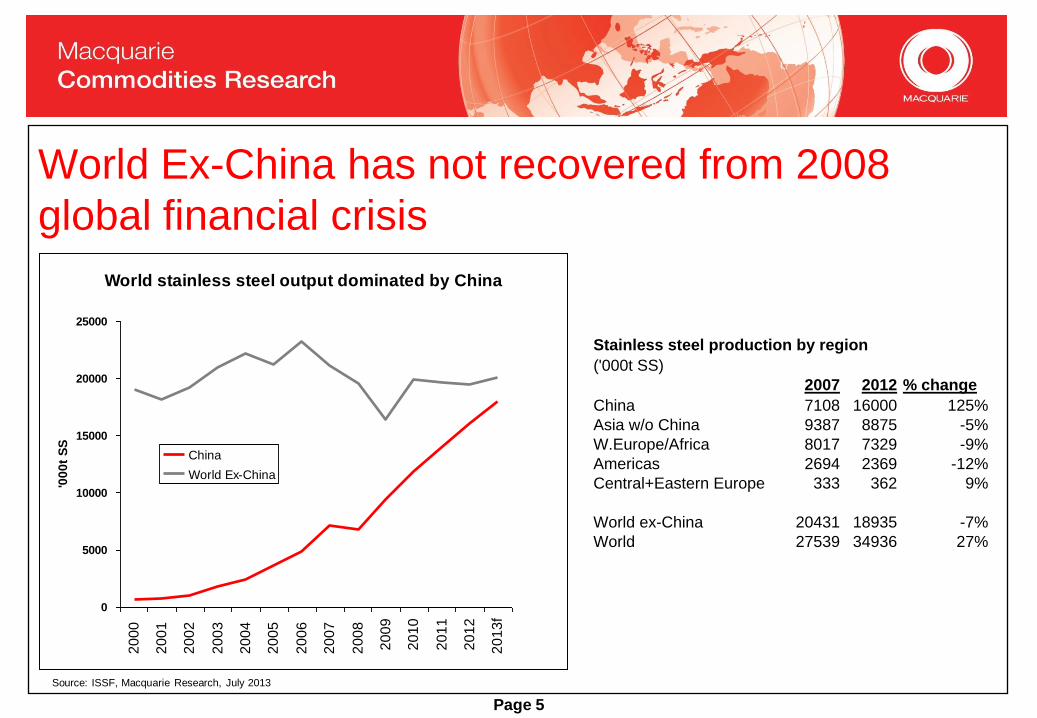
World Ex-China has not recovered from 2008
global financial crisis
World stainless steel output dominated by China
0
5000
10000
15000
20000
25000
20
00
20
01
20
02
20
03
20
04
20
05
20
06
20
07
20
08
20
09
20
10
20
11
20
12
20
13
f
'00
0t
SS
China
World Ex-China
Stainless steel production by region
('000t SS)
2007 2012 % change
China 7108 16000 125%
Asia w/o China 9387 8875 -5%
W.Europe/Africa 8017 7329 -9%
Americas 2694 2369 -12%
Central+Eastern Europe 333 362 9%
World ex-China 20431 18935 -7%
World 27539 34936 27%
Source: ISSF, Macquarie Research, July 2013
Page 5

Primary nickel supply has also been all about China since
2008 – surge in supply too much for market
7 -1 3 12 13 18 7 8
103
62 64
102 86 926850
1820
49
1 256
-37
-103
27
76
55
-7
-110
-90
-70
-50
-30
-10
10
30
50
70
90
110
130
150
170
190
2000
2001
2002
2003
2004
2005
2006
2007
2008
2009
2010
2011
2012
2013F
'000t
ni
China Rest of world Total
YoY growth in nickel production
Source: INSG, Macquarie Research, July 2013
Page 6

The short term – still awful with more cuts needed – LME
stocks up 51kt in 2012 and 46kt in 2013 YTD
LME nickel stocks and prices over the past year -
surplus!
13000
14000
15000
16000
17000
18000
19000
Ju
l-1
2
Au
g-1
2
Sep
-12
Oc
t-1
2
No
v-1
2
Dec
-12
Ja
n-1
3
Fe
b-1
3
Ma
r-1
3
Ap
r-1
3
Ma
y-1
3
Ju
n-1
3
LM
E c
as
h p
ric
e:
$/t
100000
110000
120000
130000
140000
150000
160000
170000
180000
190000
LM
E s
toc
ks
: to
nn
es
LME price LME stocks
Page 7
Source: LME, Antaike, Macquarie Research, July 2013
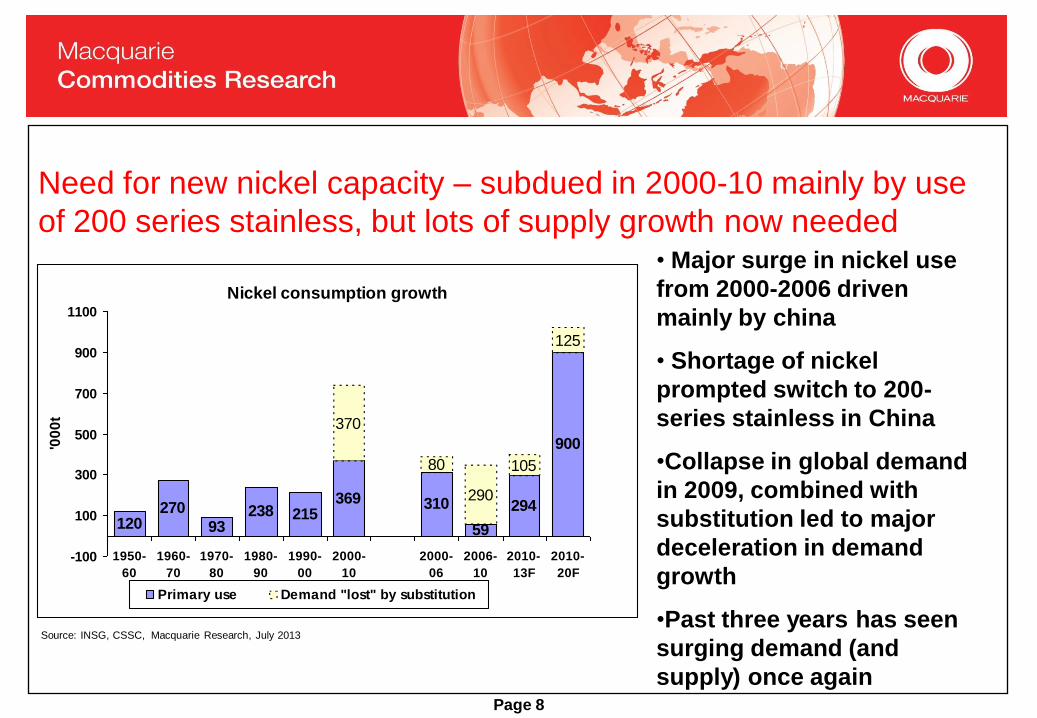
Need for new nickel capacity – subdued in 2000-10 mainly by use
of 200 series stainless, but lots of supply growth now needed • Major surge in nickel use
from 2000-2006 driven
mainly by china
• Shortage of nickel
prompted switch to 200-
series stainless in China
•Collapse in global demand
in 2009, combined with
substitution led to major
deceleration in demand
growth
•Past three years has seen
surging demand (and
supply) once again
Source: INSG, CSSC, Macquarie Research, July 2013
Nickel consumption growth
120270
93238 215
369 310
59
294
900
370
80
290
105
125
-100
100
300
500
700
900
1100
1950-
60
1960-
70
1970-
80
1980-
90
1990-
00
2000-
10
2000-
06
2006-
10
2010-
13F
2010-
20F
'00
0t
Primary use Demand "lost" by substitution
Page 8
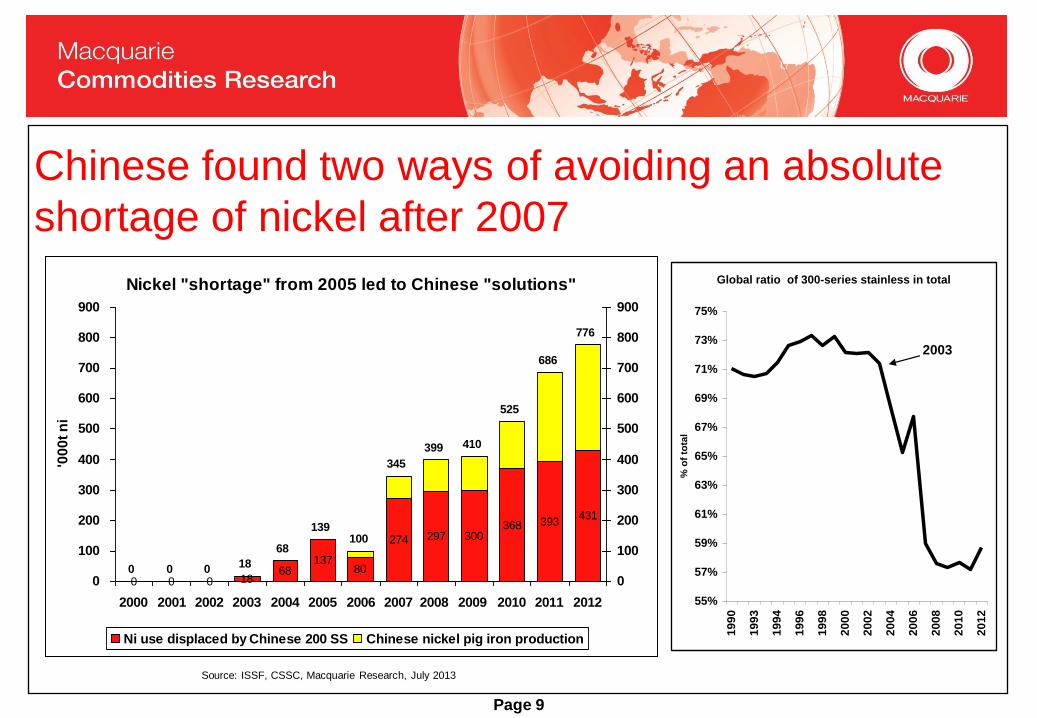
Chinese found two ways of avoiding an absolute
shortage of nickel after 2007
Source: ISSF, CSSC, Macquarie Research, July 2013
Nickel "shortage" from 2005 led to Chinese "solutions"
0 0 0 1868
13780
274 297 300368 393
431
0 0 0 18
68
139100
345
399 410
525
686
776
0
100
200
300
400
500
600
700
800
900
2000 2001 2002 2003 2004 2005 2006 2007 2008 2009 2010 2011 2012
'00
0t
ni
0
100
200
300
400
500
600
700
800
900
Ni use displaced by Chinese 200 SS Chinese nickel pig iron production
Page 9
Global ratio of 300-series stainless in total
55%
57%
59%
61%
63%
65%
67%
69%
71%
73%
75%
19
90
19
93
19
94
19
96
19
98
20
00
20
02
20
04
20
06
20
08
20
10
20
12
% o
f to
tal
2003
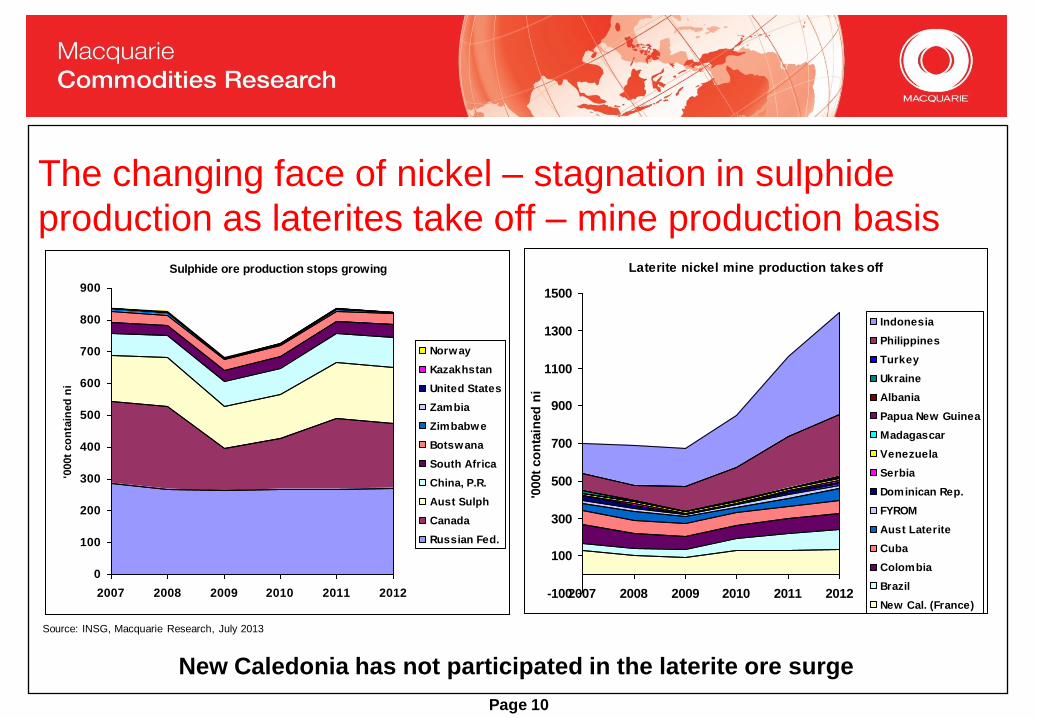
The changing face of nickel – stagnation in sulphide
production as laterites take off – mine production basis
Page 10
Source: INSG, Macquarie Research, July 2013
Laterite nickel mine production takes off
-100
100
300
500
700
900
1100
1300
1500
2007 2008 2009 2010 2011 2012
'000t
co
nta
ined
ni
Indonesia
Philippines
Turkey
Ukraine
Albania
Papua New Guinea
Madagascar
Venezuela
Serbia
Dominican Rep.
FYROM
Aust Laterite
Cuba
Colombia
Brazil
New Cal. (France)
Sulphide ore production stops growing
0
100
200
300
400
500
600
700
800
900
2007 2008 2009 2010 2011 2012
'000t
co
nta
ined
ni
Norway
Kazakhstan
United States
Zambia
Zimbabwe
Botswana
South Africa
China, P.R.
Aust Sulph
Canada
Russian Fed.
New Caledonia has not participated in the laterite ore surge

The growing role of Indonesia and the Philippines
Source: Philippines Mines and Geosciences Bureau, INSG, GTIS, Macquarie Research, July 2013
Mine production overstates the actual impact due to massive ore stocking in China and
also >50% of ore from Philippines not being used as nickel, but iron ore
Page 11
Indonesia and Philippines share in global mine
production
5%
10%
15%
20%
25%
30%
2007 2008 2009 2010 2011 2012
% o
f w
orl
d m
ine p
rod
ucti
on
Nickel ore production in Indonesia and the
Philippines
-100
100
300
500
700
900
1100
2007 2008 2009 2010 2011 2012'0
00t
co
nta
ined
nic
kel
New Caledonia Indonesia Philippines
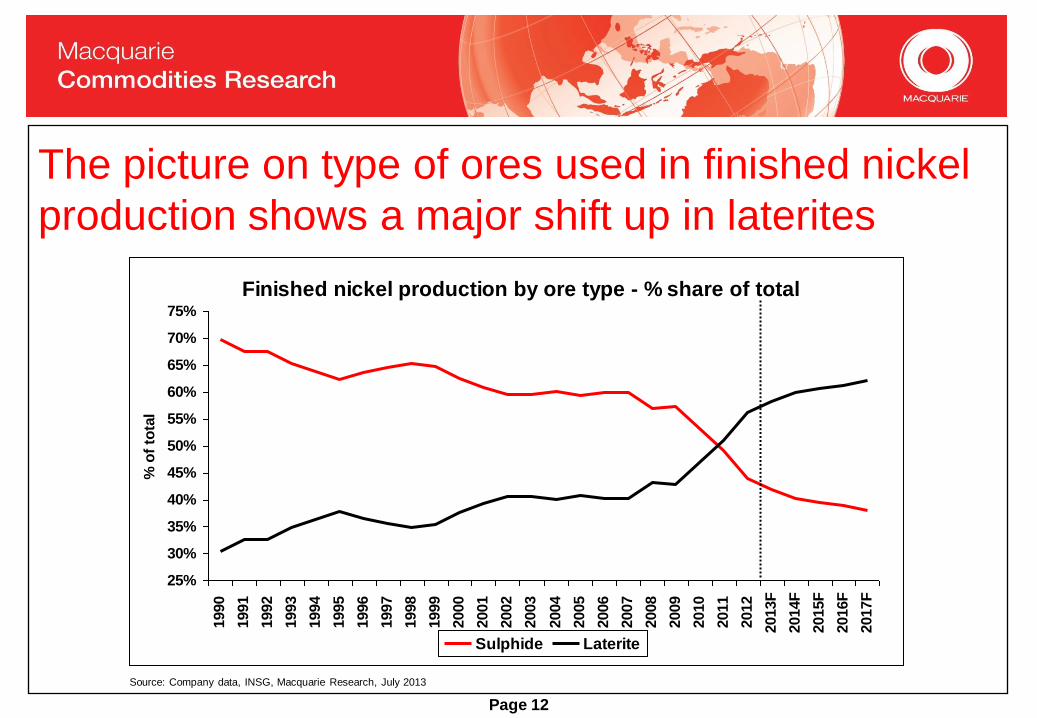
The picture on type of ores used in finished nickel
production shows a major shift up in laterites
Finished nickel production by ore type - % share of total
25%
30%
35%
40%
45%
50%
55%
60%
65%
70%
75%
1990
1991
1992
1993
1994
1995
1996
1997
1998
1999
2000
2001
2002
2003
2004
2005
2006
2007
2008
2009
2010
2011
2012
2013F
2014F
2015F
2016F
2017F
% o
f to
tal
Sulphide Laterite
Page 12
Source: Company data, INSG, Macquarie Research, July 2013
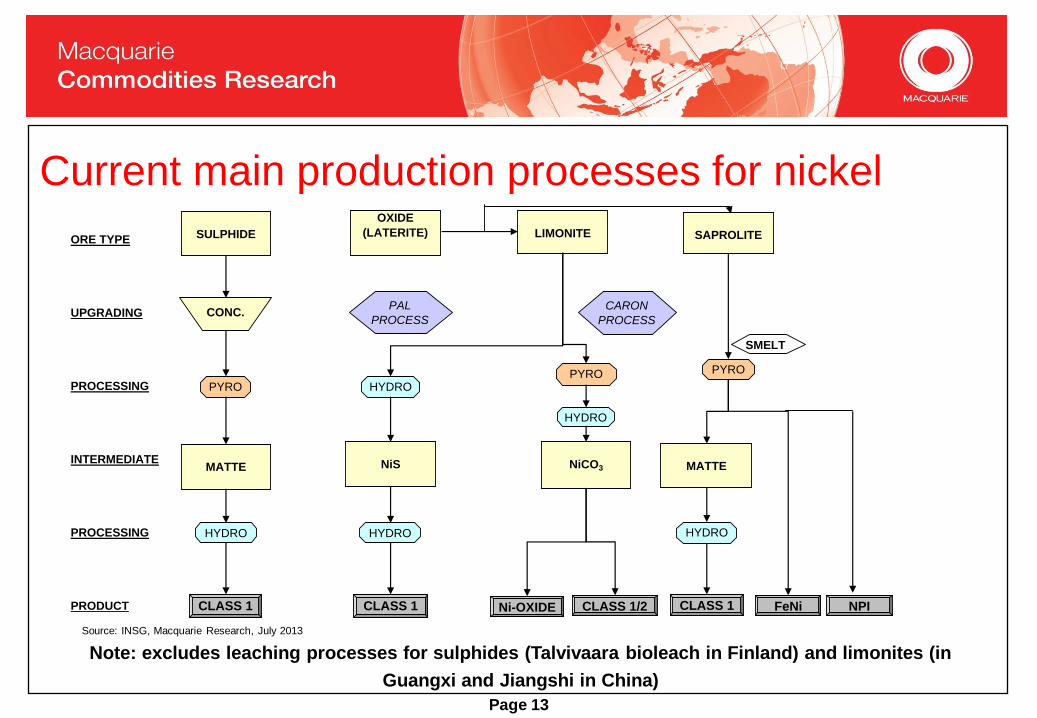
Current main production processes for nickel
Note: excludes leaching processes for sulphides (Talvivaara bioleach in Finland) and limonites (in
Guangxi and Jiangshi in China) Page 13
ORE TYPE
UPGRADING
PROCESSING
INTERMEDIATE
PROCESSING
PRODUCT
SULPHIDE
OXIDE
(LATERITE) LIMONITE SAPROLITE
CONC.
PYRO HYDROPYRO
HYDRO
PYRO
MATTE NiS NiCO3 MATTE
HYDRO HYDRO HYDRO
CLASS 1 FeNiCLASS 1 CLASS 1 Ni-OXIDE CLASS 1/2
SMELT
PAL
PROCESS
CARON
PROCESS
NPI
Source: INSG, Macquarie Research, July 2013

Our estimates and forecasts of nickel production
by process route
Finished nickel production by main process
0
500
1000
1500
2000
2500
1988
1989
1990
1991
1992
1993
1994
1995
1996
1997
1998
1999
2000
2001
2002
2003
2004
2005
2006
2007
2008
2009
2010
2011
2012
2013F
2014F
2015F
2016F
2017F
'000t
Ni
Sulphide - conventional Sulphide bioheapleach Laterite - ferronickel Laterite - Caron
Laterite - PAL Other laterite Laterite - nickel pig iron
Page 14
Source: Company data, INSG, Macquarie Research, July 2013
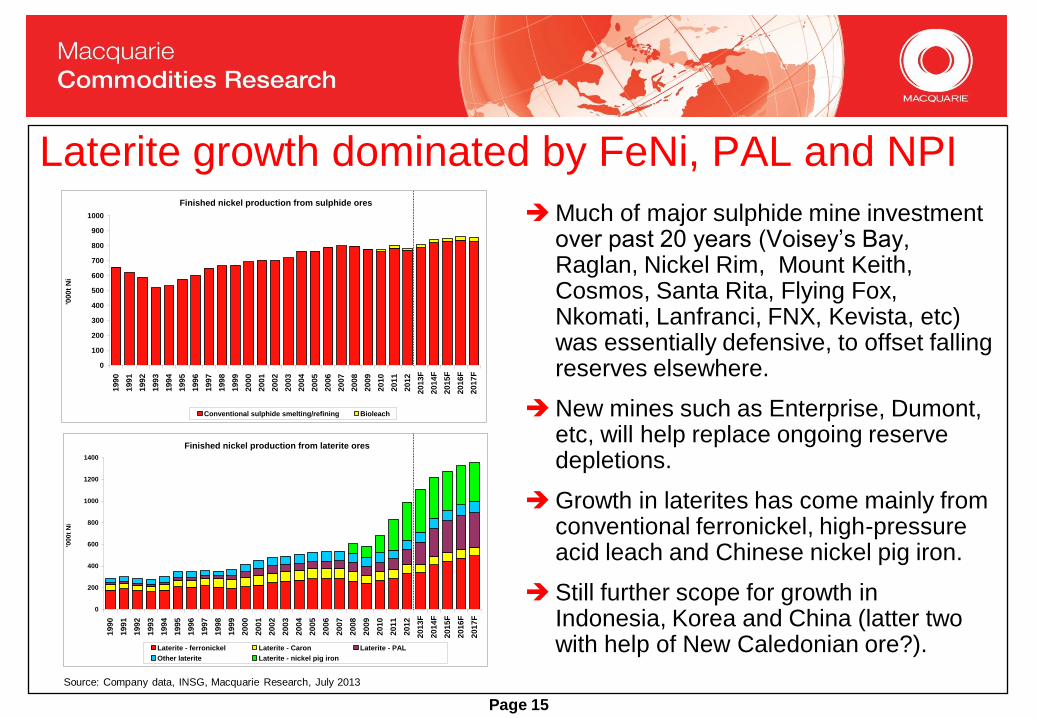
Laterite growth dominated by FeNi, PAL and NPI
Much of major sulphide mine investment over past 20 years (Voisey’s Bay, Raglan, Nickel Rim, Mount Keith, Cosmos, Santa Rita, Flying Fox, Nkomati, Lanfranci, FNX, Kevista, etc) was essentially defensive, to offset falling reserves elsewhere.
New mines such as Enterprise, Dumont, etc, will help replace ongoing reserve depletions.
Growth in laterites has come mainly from conventional ferronickel, high-pressure acid leach and Chinese nickel pig iron.
Still further scope for growth in Indonesia, Korea and China (latter two with help of New Caledonian ore?).
Page 15
Source: Company data, INSG, Macquarie Research, July 2013
Finished nickel production from sulphide ores
0
100
200
300
400
500
600
700
800
900
1000
19
90
19
91
19
92
19
93
19
94
19
95
19
96
19
97
19
98
19
99
20
00
20
01
20
02
20
03
20
04
20
05
20
06
20
07
20
08
20
09
20
10
20
11
20
12
20
13
F
20
14
F
20
15
F
20
16
F
20
17
F
'000
t N
i
Conventional sulphide smelting/refining Bioleach
Finished nickel production from laterite ores
0
200
400
600
800
1000
1200
1400
19
90
19
91
19
92
19
93
19
94
19
95
19
96
19
97
19
98
19
99
20
00
20
01
20
02
20
03
20
04
20
05
20
06
20
07
20
08
20
09
20
10
20
11
20
12
20
13
F
20
14
F
20
15
F
20
16
F
20
17
F
'00
0t
Ni
Laterite - ferronickel Laterite - Caron Laterite - PAL
Other laterite Laterite - nickel pig iron
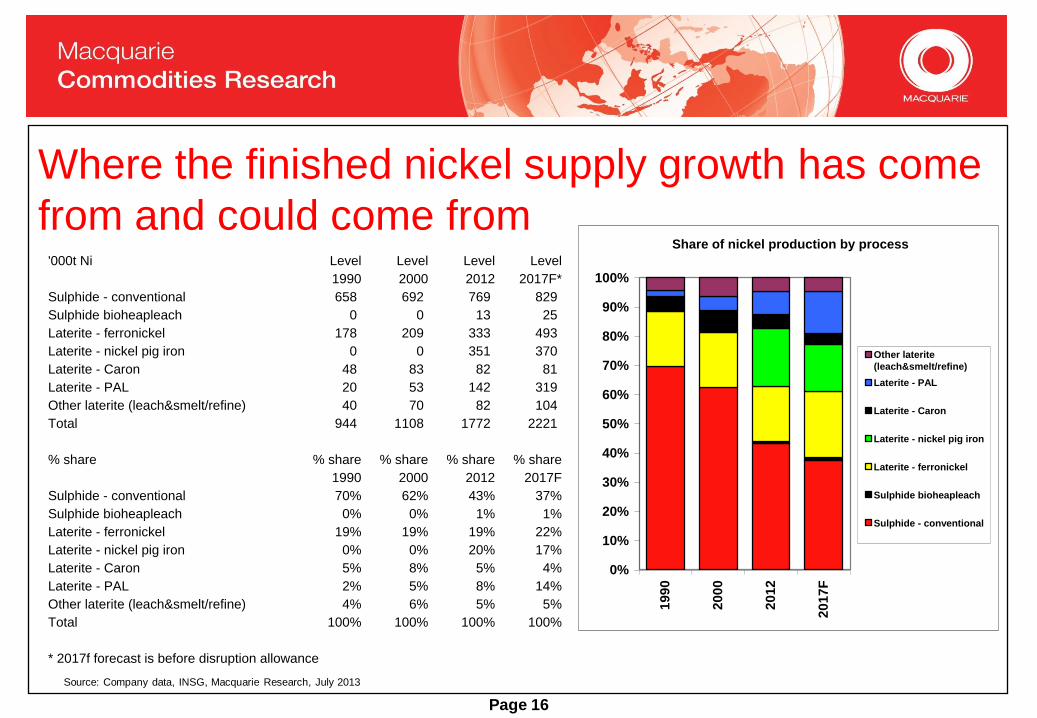
Where the finished nickel supply growth has come
from and could come from
Page 16
Source: Company data, INSG, Macquarie Research, July 2013
'000t Ni Level Level Level Level
1990 2000 2012 2017F*
Sulphide - conventional 658 692 769 829
Sulphide bioheapleach 0 0 13 25
Laterite - ferronickel 178 209 333 493
Laterite - nickel pig iron 0 0 351 370
Laterite - Caron 48 83 82 81
Laterite - PAL 20 53 142 319
Other laterite (leach&smelt/refine) 40 70 82 104
Total 944 1108 1772 2221
% share % share % share % share % share
1990 2000 2012 2017F
Sulphide - conventional 70% 62% 43% 37%
Sulphide bioheapleach 0% 0% 1% 1%
Laterite - ferronickel 19% 19% 19% 22%
Laterite - nickel pig iron 0% 0% 20% 17%
Laterite - Caron 5% 8% 5% 4%
Laterite - PAL 2% 5% 8% 14%
Other laterite (leach&smelt/refine) 4% 6% 5% 5%
Total 100% 100% 100% 100%
* 2017f forecast is before disruption allowance
Share of nickel production by process
0%
10%
20%
30%
40%
50%
60%
70%
80%
90%
100%
19
90
20
00
20
12
20
17
F
Other laterite
(leach&smelt/refine)
Laterite - PAL
Laterite - Caron
Laterite - nickel pig iron
Laterite - ferronickel
Sulphide bioheapleach
Sulphide - conventional

Strong growth ahead for FeNi and PAL…but that
has been the case for some time now!
Ferronickel production by producer
-50
50
150
250
350
450
550
2000
2001
2002
2003
2004
2005
2006
2007
2008
2009
2010
2011
2012
2013F
2014F
2015F
2016F
2017F
'000t
Ni
0%
5%
10%
15%
20%
25%
Onca P uma
B arro A lto
Ko niambo
Kwangyang
P rist ina
Kavadarci
Laryma
P o bugsko ye
Lo mo do N iquel
P rato po lis
N iqualandia
P o malaa
Oheyama
H achino he
H yuga
C erro M ato so
D o niambo
F alco ndo
% o f wo rld to tal
PAL production by producer
0
50
100
150
200
250
300
350
2000
2001
2002
2003
2004
2005
2006
2007
2008
2009
2010
2011
2012
2013F
2014F
2015F
2016F
2017F
'000t
Ni
0%
2%
4%
6%
8%
10%
12%
14%
16%
% s
hare
of
wo
rld
pro
du
cti
on
Moa Bay*
Ambatovy
Ramu River*
Taganito*
Coral Bay*
Ravensthorpe*
Cawse*
Bulong
Murrin Murrin
VNC
% of world supply
* intermediate
product only
Page 17
Source: Company data, INSG, Macquarie Research, July 2013

Stainless industry getting lots more nickel and
(mainly free) iron units now
Source: Company data, INSG, Macquarie Research, July 2013
Page 18
Nickel-iron units for the stainless steel industry
0
200
400
600
800
1000
1200
1400
19
90
19
91
19
92
19
93
19
94
19
95
19
96
19
97
19
98
19
99
20
00
20
01
20
02
20
03
20
04
20
05
20
06
20
07
20
08
20
09
20
10
20
11
20
12
20
13
F
20
14
F
20
15
F
20
16
F
20
17
F
'000t
Ni
30%
35%
40%
45%
50%
55%
60%
65%
% o
f all
ni
used
by s
tain
less s
teel
FeNi NPI Purchased SS scrap FeNi/NPI/SSS ni as % all of all ni in SS

NPI accounted for major share of nickel used in China in
2012 – replacement for scrap use in ROW
Chinese nickel use by type
17%
38%
7%
38%Ni in scrap
NPI
FeNi
Metal/utility/oxide
Nickel use ex-China by type
40%
0%
18%
42%
Ni in scrap
NPI
FeNi
Metal/utility/oxide
Source: INSG, Macquarie Research, July 2013
Page 19
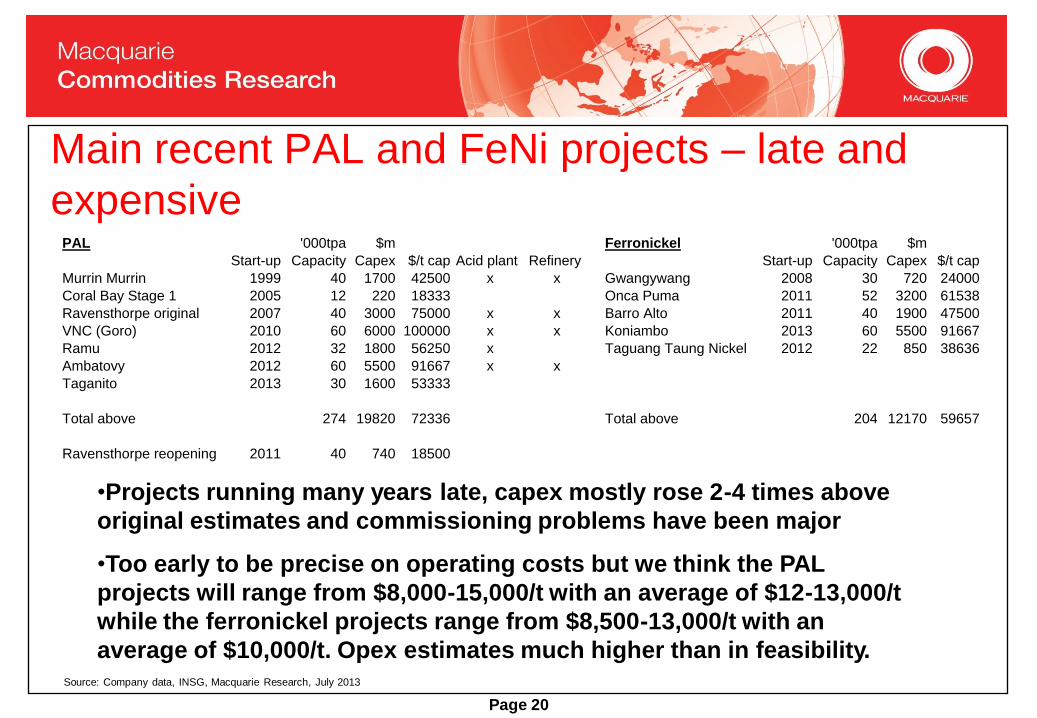
Main recent PAL and FeNi projects – late and
expensive PAL '000tpa $m Ferronickel '000tpa $m
Start-up Capacity Capex $/t cap Acid plant Refinery Start-up Capacity Capex $/t cap
Murrin Murrin 1999 40 1700 42500 x x Gwangywang 2008 30 720 24000
Coral Bay Stage 1 2005 12 220 18333 Onca Puma 2011 52 3200 61538
Ravensthorpe original 2007 40 3000 75000 x x Barro Alto 2011 40 1900 47500
VNC (Goro) 2010 60 6000 100000 x x Koniambo 2013 60 5500 91667
Ramu 2012 32 1800 56250 x Taguang Taung Nickel 2012 22 850 38636
Ambatovy 2012 60 5500 91667 x x
Taganito 2013 30 1600 53333
Total above 274 19820 72336 Total above 204 12170 59657
Ravensthorpe reopening 2011 40 740 18500
•Projects running many years late, capex mostly rose 2-4 times above
original estimates and commissioning problems have been major
•Too early to be precise on operating costs but we think the PAL
projects will range from $8,000-15,000/t with an average of $12-13,000/t
while the ferronickel projects range from $8,500-13,000/t with an
average of $10,000/t. Opex estimates much higher than in feasibility.
Page 20
Source: Company data, INSG, Macquarie Research, July 2013
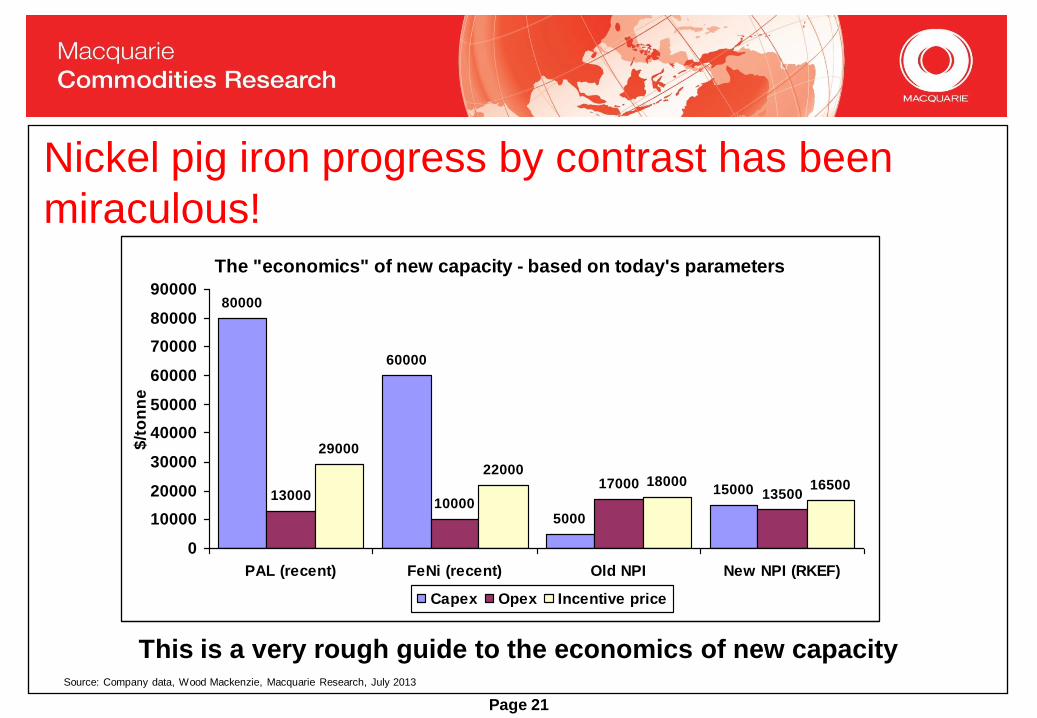
Nickel pig iron progress by contrast has been
miraculous! The "economics" of new capacity - based on today's parameters
80000
60000
5000
150001300010000
1700013500
29000
2200018000 16500
0
10000
20000
30000
40000
50000
60000
70000
80000
90000
PAL (recent) FeNi (recent) Old NPI New NPI (RKEF)
$/t
on
ne
Capex Opex Incentive price
This is a very rough guide to the economics of new capacity
Page 21
Source: Company data, Wood Mackenzie, Macquarie Research, July 2013
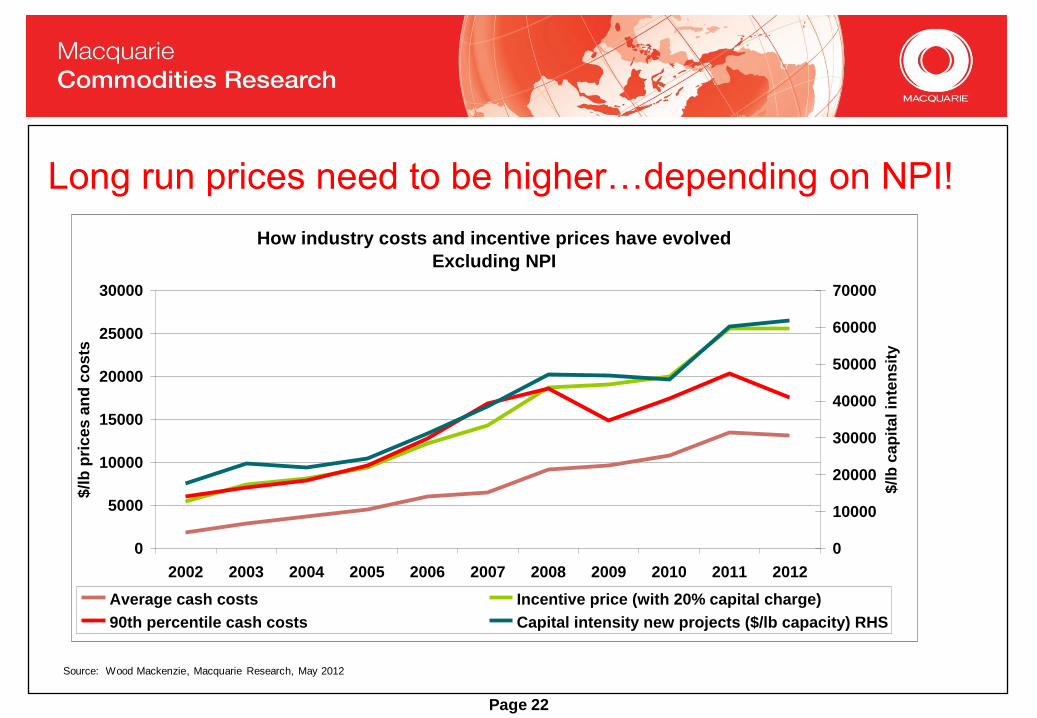
Long run prices need to be higher…depending on NPI!
Page 22
Source: Wood Mackenzie, Macquarie Research, May 2012
How industry costs and incentive prices have evolved
Excluding NPI
0
5000
10000
15000
20000
25000
30000
2002 2003 2004 2005 2006 2007 2008 2009 2010 2011 2012
$/l
b p
rices a
nd
co
sts
0
10000
20000
30000
40000
50000
60000
70000
$/lb
ca
pit
al in
ten
sit
y
Average cash costs Incentive price (with 20% capital charge)
90th percentile cash costs Capital intensity new projects ($/lb capacity) RHS
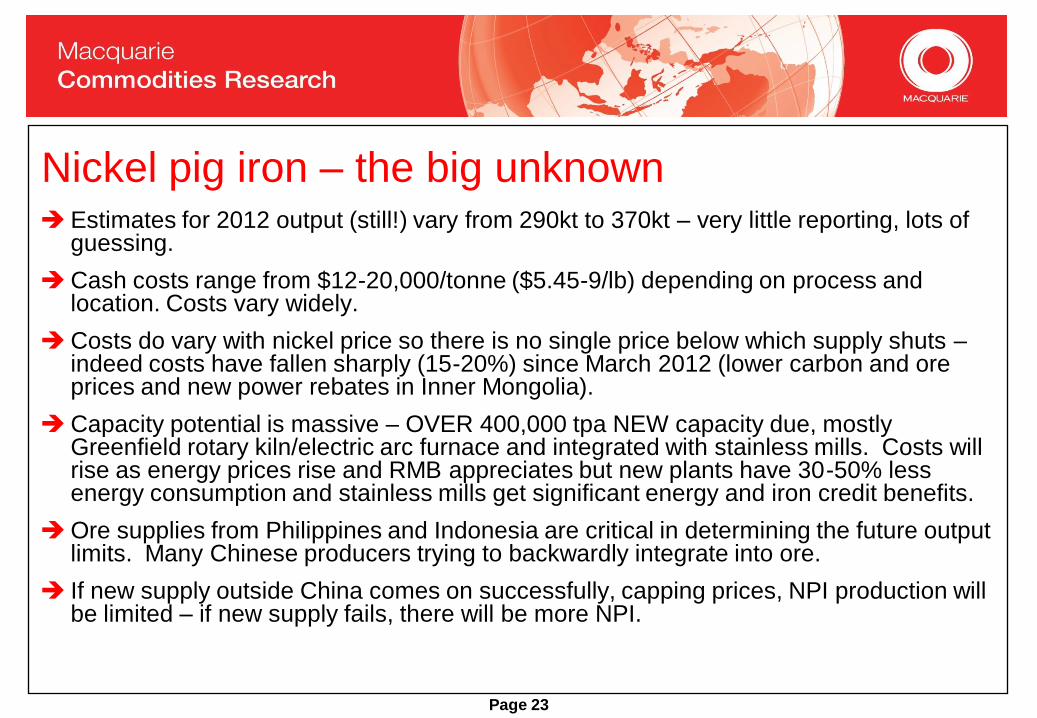
Nickel pig iron – the big unknown Estimates for 2012 output (still!) vary from 290kt to 370kt – very little reporting, lots of
guessing.
Cash costs range from $12-20,000/tonne ($5.45-9/lb) depending on process and location. Costs vary widely.
Costs do vary with nickel price so there is no single price below which supply shuts – indeed costs have fallen sharply (15-20%) since March 2012 (lower carbon and ore prices and new power rebates in Inner Mongolia).
Capacity potential is massive – OVER 400,000 tpa NEW capacity due, mostly Greenfield rotary kiln/electric arc furnace and integrated with stainless mills. Costs will rise as energy prices rise and RMB appreciates but new plants have 30-50% less energy consumption and stainless mills get significant energy and iron credit benefits.
Ore supplies from Philippines and Indonesia are critical in determining the future output limits. Many Chinese producers trying to backwardly integrate into ore.
If new supply outside China comes on successfully, capping prices, NPI production will be limited – if new supply fails, there will be more NPI.
Page 23
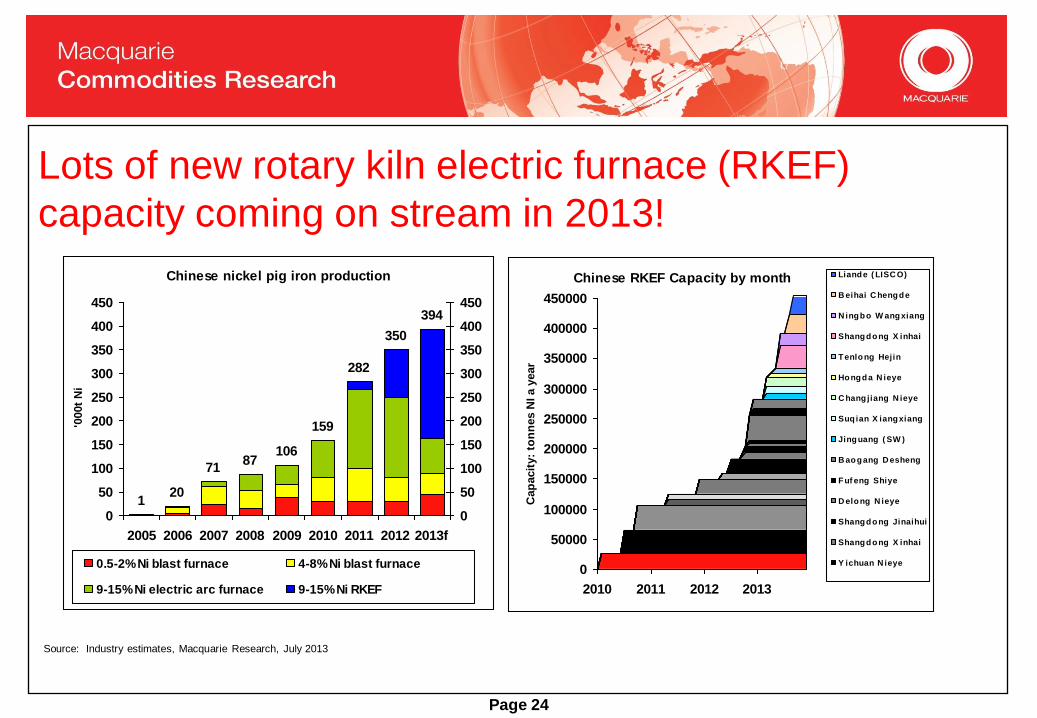
Lots of new rotary kiln electric furnace (RKEF)
capacity coming on stream in 2013!
Source: Industry estimates, Macquarie Research, July 2013
Page 24
Chinese RKEF Capacity by month
0
50000
100000
150000
200000
250000
300000
350000
400000
450000
2010 2011 2012 2013
Cap
acit
y:
ton
nes N
I a y
ear
Liande ( LISC O)
B eihai C hengde
N ingbo W angxiang
Shangdong X inhai
Tenlong Hejin
Hongda N ieye
C hang jiang N ieye
Suq ian X iangxiang
Jinguang ( SW )
B aogang D esheng
Fuf eng Shiye
D elong N ieye
Shangdong Jinaihui
Shangdong X inhai
Y ichuan N ieye
Haigan Keji
Tsingshan Sij i
Shangai Haihe
Tsingshan
C hangq ing
B eihai C hengde
N ingbo W anxiang
D elong N ieye
Shangdong Jinaihui
Shangdong X inhai
Tsingshan D ingxin
Chinese nickel pig iron production
120
7187
106
159
282
350
394
0
50
100
150
200
250
300
350
400
450
2005 2006 2007 2008 2009 2010 2011 2012 2013f
'000t
Ni
0
50
100
150
200
250
300
350
400
450
0.5-2% Ni blast furnace 4-8% Ni blast furnace
9-15% Ni electric arc furnace 9-15% Ni RKEF
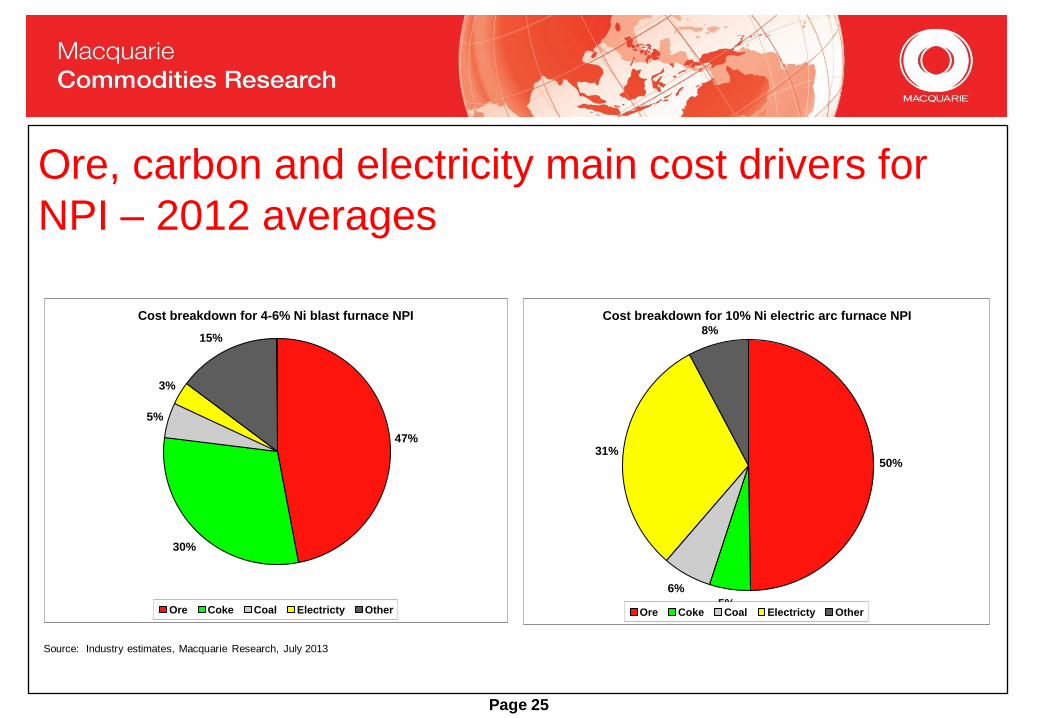
Ore, carbon and electricity main cost drivers for
NPI – 2012 averages
Cost breakdown for 4-6% Ni blast furnace NPI
47%
30%
5%
3%
15%
Ore Coke Coal Electricty Other
Cost breakdown for 10% Ni electric arc furnace NPI
50%
5%
6%
31%
8%
Ore Coke Coal Electricty Other
Source: Industry estimates, Macquarie Research, July 2013
Page 25

NPI costs for electric furnace producers – big differences in costs
according to location and furnace types – costs fall as raw material
and power costs fall
Page 26
Source: SMM, Macquarie Research, July 2013
12000
14000
16000
18000
20000
22000
24000
Jan
-10
Mar-
10
May-1
0
Ju
l-10
Sep
-10
No
v-1
0
Jan
-11
Mar-
11
May-1
1
Ju
l-11
Sep
-11
No
v-1
1
Jan
-12
Mar-
12
May-1
2
Ju
l-12
Sep
-12
No
v-1
2
Jan
-13
Mar-
13
May-1
3
$/lb
ex-V
At
Price: 8-13% NPICosts: 10% Ni - CoastalCosts: 10% Ni - Inner Mongolia
12000
14000
16000
18000
20000
22000
24000
Jan
-10
Mar-
10
May-1
0
Ju
l-10
Sep
-10
No
v-1
0
Jan
-11
Mar-
11
May-1
1
Ju
l-11
Sep
-11
No
v-1
1
Jan
-12
Mar-
12
May-1
2
Ju
l-12
Sep
-12
No
v-1
2
Jan
-13
Mar-
13
May-1
3
$/lb
ex-V
AT
Price: 8-13% NPICosts: 12% Ni - ConventionalCosts: 12% Ni - RKEF

Low Ni NPI blast furnace producers still profitable
12000
14000
16000
18000
20000
22000
Jan
-10
Mar-
10
May-1
0
Ju
l-10
Sep
-10
No
v-1
0
Jan
-11
Mar-
11
May-1
1
Ju
l-11
Sep
-11
No
v-1
1
Jan
-12
Mar-
12
May-1
2
Ju
l-12
Sep
-12
No
v-1
2
Jan
-13
Mar-
13
May-1
3
$/lb
ex-V
AT
Price: 4-6% NPI
Costs: 6% Ni in blast furnace
20000
22000
24000
26000
28000
30000
32000
Jan
-10
Mar-
10
May-1
0
Ju
l-10
Sep
-10
No
v-1
0
Jan
-11
Mar-
11
May-1
1
Ju
l-11
Sep
-11
No
v-1
1
Jan
-12
Mar-
12
May-1
2
Ju
l-12
Sep
-12
No
v-1
2
Jan
-13
Mar-
13
May-1
3
$/lb
ex-V
AT
Price: 1.5-2% NPI
Costs: 1.7% Ni in blast furnace
Source: SMM, Macquarie Research, July 2013
Page 27

Cost of ore from Indonesia has plunged in 2013
Indonesia ore price plunges in 2013
$/ wet tonne for 1.8% Ni in dry ore
25
30
35
40
45
50
55
60
Oc
t-1
2
No
v-1
2
De
c-1
2
Ja
n-1
3
Fe
b-1
3
Ma
r-1
3
Ap
r-1
3
Ma
y-1
3
$/t
on
ne
CIF FOB
Ore cost in making one tonne of nickel in 10%
Ni pig iron
2500
3000
3500
4000
4500
5000
5500
Oc
t-1
2
No
v-1
2
De
c-1
2
Ja
n-1
3
Fe
b-1
3
Ma
r-1
3
Ap
r-1
3
Ma
y-1
3
$/t
on
ne
CIF FOB
Source: NPI producers, Macquarie Research, July 2013
Page 28

Key factors in NPI Indonesian ore ban planned for end-2013. No-one thinks this will happen!
Quotas and taxes more likely? 20% export tax (adds 35-40c/lb to costs if
passed on…but it was not!) from May 2012…maybe higher?
Longer term cost pressures – breakeven for NPI could rise from $12,000-
17,000/t currently to $19,000-25,000/lb over next 4-5 years as ore costs,
electricity costs rise and RMB appreciates?
Competition for higher-grade ore (1.8%+Ni) will intensify as more RKEF
comes on and high grade reserves deplete – price of these ores could
rise sharply.
Still unclear how long the resources can last at current rates.
We don’t think ore supply from Indonesia to China will stop in 2014 – it will
become (a lot) more expensive and there will probably be some NPI capacity
built in Indonesia from 2015 onwards.
Page 29
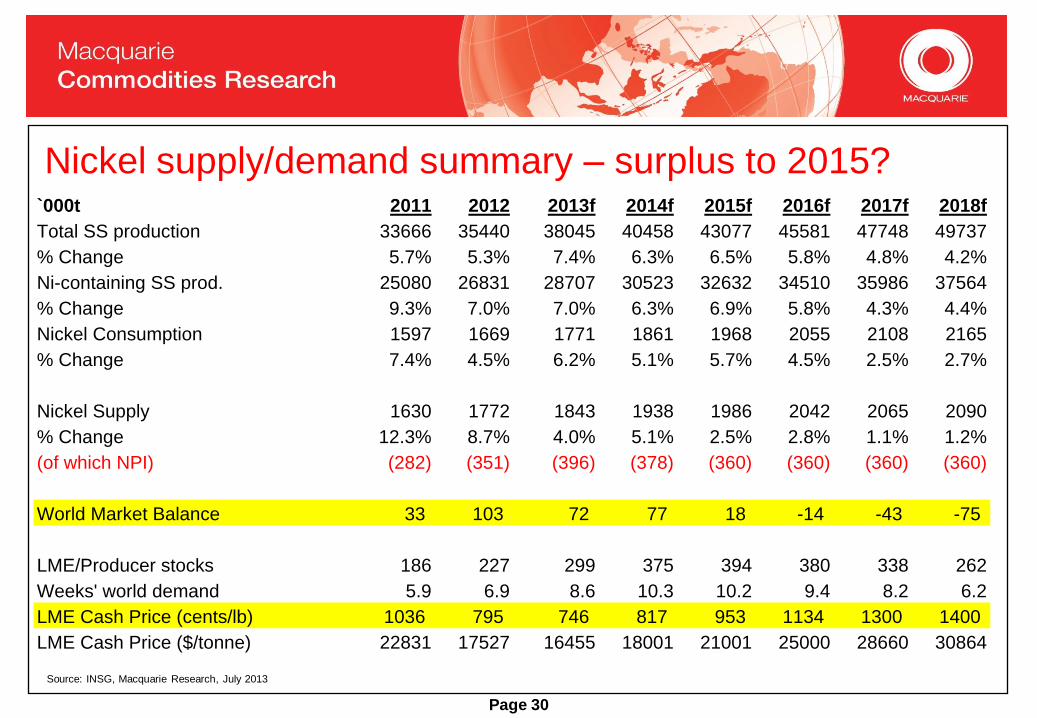
Page 30
Nickel supply/demand summary – surplus to 2015?
Source: INSG, Macquarie Research, July 2013
`000t 2011 2012 2013f 2014f 2015f 2016f 2017f 2018f
Total SS production 33666 35440 38045 40458 43077 45581 47748 49737
% Change 5.7% 5.3% 7.4% 6.3% 6.5% 5.8% 4.8% 4.2%
Ni-containing SS prod. 25080 26831 28707 30523 32632 34510 35986 37564
% Change 9.3% 7.0% 7.0% 6.3% 6.9% 5.8% 4.3% 4.4%
Nickel Consumption 1597 1669 1771 1861 1968 2055 2108 2165
% Change 7.4% 4.5% 6.2% 5.1% 5.7% 4.5% 2.5% 2.7%
Nickel Supply 1630 1772 1843 1938 1986 2042 2065 2090
% Change 12.3% 8.7% 4.0% 5.1% 2.5% 2.8% 1.1% 1.2%
(of which NPI) (282) (351) (396) (378) (360) (360) (360) (360)
World Market Balance 33 103 72 77 18 -14 -43 -75
LME/Producer stocks 186 227 299 375 394 380 338 262
Weeks' world demand 5.9 6.9 8.6 10.3 10.2 9.4 8.2 6.2
LME Cash Price (cents/lb) 1036 795 746 817 953 1134 1300 1400
LME Cash Price ($/tonne) 22831 17527 16455 18001 21001 25000 28660 30864
In conclusion – on the medium term
The laterite “revolution” has arrived – it is built on the shaky ground of low-cost
Indonesian ore/Chinese NPI and VERY high-cost non-Chinese PAL/FeNi
capacity
Failure of major Greenfield projects outside China and massive rises in
construction costs of non-Chinese Greenfield projects likely to deter future
investment
Next two years will be challenging for the nickel industry – unless the
Indonesians ban ore exports in 2014
Growing deficits by mid-decade will lead to need for new capacity…new
capacity needs prices significantly above $22,000/t ($10/lb)
Huge reliance on Indonesian ore to feed RFEF plants in China – unlikely to
stay as “cheap” as it is today?
Page 31
Important disclosures:
Recommendation definitions
Macquarie - Australia/New Zealand
Outperform – return > 3% in excess of benchmark return
Neutral – return within 3% of benchmark return
Underperform – return > 3% below benchmark return
Benchmark return is determined by long term nominal GDP growth plus 12
month forward market dividend yield
Macquarie – Asia/Europe
Outperform – expected return >+10%
Neutral – expected return from -10% to +10%
Underperform – expected <-10%
Macquarie First South - South Africa
Outperform – return > 10% in excess of benchmark return
Neutral – return within 10% of benchmark return
Underperform – return > 10% below benchmark return
Macquarie - Canada
Outperform – return > 5% in excess of benchmark return
Neutral – return within 5% of benchmark return
Underperform – return > 5% below benchmark return
Macquarie - USA
Outperform – return > 5% in excess of benchmark return
Neutral – return within 5% of benchmark return
Underperform – return > 5% below benchmark return
Volatility index definition* This is calculated from the volatility of historic price
movements.
Very high–highest risk – Stock should be expected
to move up or down 60-100% in a year – investors
should be aware this stock is highly speculative.
High – stock should be expected to move up or down
at least 40-60% in a year – investors should be aware
this stock could be speculative.
Medium – stock should be expected to move up or
down at least 30-40% in a year.
Low–medium – stock should be expected to move up
or down at least 25-30% in a year.
Low – stock should be expected to move up or down
at least 15-25% in a year.
* Applicable to Australian/NZ stocks only
Recommendation – 12 months
Note: Quant recommendations may differ from
Fundamental Analyst recommendations
Financial definitions
All "Adjusted" data items have had the following adjustments
made:
Added back: goodwill amortisation, provision for catastrophe
reserves, IFRS derivatives & hedging, IFRS impairments &
IFRS interest expense
Excluded: non recurring items, asset revals, property revals,
appraisal value uplift, preference dividends & minority
interests
EPS = adjusted net profit /efpowa*
ROA = adjusted ebit / average total assets
ROA Banks/Insurance = adjusted net profit /average total
assets
ROE = adjusted net profit / average shareholders funds
Gross cashflow = adjusted net profit + depreciation
*equivalent fully paid ordinary weighted average number of
shares
All Reported numbers for Australian/NZ listed stocks are
modelled under IFRS (International Financial Reporting
Standards).
Recommendation proportions – For quarter ending 31 March 2013
AU/NZ Asia RSA USA CA EUR
Outperform 45.12% 53.24% 50.00% 40.70% 62.98% 43.30% (for US coverage by MCUSA, 10.55% of stocks covered are investment banking clients)
Neutral 41.52% 28.01% 41.43% 55.01% 32.60% 34.10% (for US coverage by MCUSA, 9.05% of stocks covered are investment banking clients)
Underperform 13.36% 18.74% 8.57% 4.29% 4.42% 22.60% (for US coverage by MCUSA, 0.00% of stocks covered are investment banking clients)
Page 32
Page 33
Company Specific Disclosures:
Important disclosure information regarding the subject companies covered in this report is available at www.macquarie.com/research/disclosures.
Analyst Certification:
The views expressed in this research accurately reflect the personal views of the analyst(s) about the subject securities or issuers and no part of the compensation of the analyst(s) was, is, or will be
directly or indirectly related to the inclusion of specific recommendations or views in this research. The analyst principally responsible for the preparation of this research receives compensation based on
overall revenues of Macquarie Group Ltd ABN 94 122 169 279 (AFSL No. 318062) (MGL) and its related entities (the Macquarie Group) and has taken reasonable care to achieve and maintain
independence and objectivity in making any recommendations.
General Disclaimers:
Macquarie Securities (Australia) Ltd; Macquarie Capital (Europe) Ltd; Macquarie Capital Markets Canada Ltd; Macquarie Capital Markets North America Ltd; Macquarie Capital (USA) Inc; Macquarie
Capital Securities Ltd and its Taiwan branch; Macquarie Capital Securities (Singapore) Pte Ltd; Macquarie Securities (NZ) Ltd; and Macquarie First South Securities (Pty) Limited; Macquarie Capital
Securities (India) Pvt Ltd; Macquarie Capital Securities (Malaysia) Sdn Bhd; Macquarie Securities Korea Limited and Macquarie Securities (Thailand) Ltd are not authorized deposit-taking institutions for
the purposes of the Banking Act 1959 (Commonwealth of Australia), and their obligations do not represent deposits or other liabilities of Macquarie Bank Limited ABN 46 008 583 542 (MBL) or MGL.
MBL does not guarantee or otherwise provide assurance in respect of the obligations of any of the above mentioned entities. MGL provides a guarantee to the Monetary Authority of Singapore in respect
of the obligations and liabilities of Macquarie Capital Securities (Singapore) Pte Ltd for up to SGD 35 million. This research has been prepared for the general use of the wholesale clients of the
Macquarie Group and must not be copied, either in whole or in part, or distributed to any other person. If you are not the intended recipient you must not use or disclose the information in this research in
any way. If you received it in error, please tell us immediately by return e-mail and delete the document. We do not guarantee the integrity of any e-mails or attached files and are not responsible for any
changes made to them by any other person. MGL has established and implemented a conflicts policy at group level (which may be revised and updated from time to time) (the "Conflicts Policy") pursuant
to regulatory requirements (including the FSA Rules) which sets out how we must seek to identify and manage all material conf licts of interest. Nothing in this research shall be construed as a solicitation
to buy or sell any security or product, or to engage in or refrain from engaging in any transaction. In preparing this research, we did not take into account your investment objectives, financial situation or
particular needs. Before making an investment decision on the basis of this research, you need to consider, with or without the assistance of an adviser, whether the advice is appropriate in light of your
particular investment needs, objectives and financial circumstances. There are risks involved in securities trading. The price of securities can and does fluctuate, and an individual security may even
become valueless. International investors are reminded of the additional risks inherent in international investments, such as currency fluctuations and international stock market or economic conditions,
which may adversely affect the value of the investment. This research is based on information obtained from sources believed to be reliable but we do not make any representation or warranty that it is
accurate, complete or up to date. We accept no obligation to correct or update the information or opinions in it. Opinions expressed are subject to change without notice. No member of the Macquarie
Group accepts any liability whatsoever for any direct, indirect, consequential or other loss arising from any use of this research and/or further communication in relation to this research. Clients should
contact analysts at, and execute transactions through, a Macquarie Group entity in their home jurisdiction unless governing law permits otherwise.
Disclaimer: The information contained in this e-mail is confidential and has been furnished to you solely for your use. You may not disclose, reproduce or distribute the information in any way. Macquarie
does not guarantee the integrity of this e-mail or attached files.
Macquarie Capital (USA) Inc. affiliate research reports and affiliate employees are not subject to the disclosure requirements of FINRA rules. Any persons receiving this report directly from Macquarie
Capital (USA) Inc. and wishing to effect a transaction in any security described herein should do so with Macquarie Capital (USA) Inc. In Germany, this research is issued and/or distributed by Macquarie
Capital (Europe) Limited, Niederlassung Deutschland, which is authorised and regulated by the UK Financial Services Authority and in Germany by BaFin.
Macquarie salespeople, traders and other professionals may provide oral or written market commentary or trading strategies to our clients that reflect opinions which are contrary to the opinions
expressed in this research. Macquarie Research produces a variety of research products including, but not limited to, fundamental analysis, macro-economic analysis, quantitative analysis, and trade
ideas. Recommendations contained in one type of research product may differ from recommendations contained in other types of research, whether as a result of differing time horizons, methodologies,
or otherwise.
Country-Specific Disclaimers:
Australia: In Australia, research is issued and distributed by Macquarie Securities (Australia) Ltd (AFSL No. 238947), a participating organisation of the Australian Securities Exchange. New Zealand: In
New Zealand, research is issued and distributed by Macquarie Securities (NZ) Ltd, a NZX Firm. Canada: In Canada, research is prepared, approved and distributed by Macquarie Capital Markets Canada
Ltd, a participating organisation of the Toronto Stock Exchange, TSX Venture Exchange & Montréal Exchange. Macquarie Capital Markets North America Ltd., which is a registered broker-dealer and
member of FINRA, accepts responsibility for the contents of reports issued by Macquarie Capital Markets Canada Ltd in the United States and sent to US persons. Any person wishing to effect
transactions in the securities described in the reports issued by Macquarie Capital Markets Canada Ltd should do so with Macquarie Capital Markets North America Ltd. The Research Distribution Policy of
Macquarie Capital Markets Canada Ltd is to allow all clients that are entitled to have equal access to our research. United Kingdom: In the United Kingdom, research is issued and distributed by
Macquarie Capital (Europe) Ltd, which is authorised and regulated by the Financial Services Authority (No. 193905). Germany: In Germany, research is issued and distributed by Macquarie Capital
(Europe) Ltd, Niederlassung Deutschland, which is authorised and regulated in the United Kingdom by the Financial Services Authority (No. 193905). France: In France, research is issued and distributed
by Macquarie Capital (Europe) Ltd, which is authorised and regulated in the United Kingdom by the Financial Services Authority (No. 193905). Hong Kong & Mainland China: In Hong Kong, research is
issued and distributed by Macquarie Capital Securities Ltd, which is licensed and regulated by the Securities and Futures Commission. In Mainland China, Macquarie Securities (Australia) Limited
Shanghai Representative Office only engages in non-business operational activities excluding issuing and distributing research. Only non-A share research is distributed into Mainland China by Macquarie
Capital Securities Ltd. Japan: In Japan, research is Issued and distributed by Macquarie Capital Securities (Japan) Limited, a member of the Tokyo Stock Exchange, Inc., Osaka Securities Exchange Co.
Ltd. (Financial Instruments Firm, Kanto Financial Bureau (kin-sho) No. 231, a member of Japan Securities Dealers Association and The Financial Futures Association of Japan and Japan Investment
Advisers Association). India: In India, research is issued and distributed by Macquarie Capital Securities (India) Pty Ltd., 92, Level 9, 2 North Avenue, Maker Maxity, Bandra Kurla Complex, Bandra (East),
Mumbai – 400 051, India, which is a SEBI registered Stock Broker having membership with National Stock Exchange of India Limited (INB231246738) and Bombay Stock Exchange Limited
(INB011246734). Malaysia: In Malaysia, research is issued and distributed by Macquarie Capital Securities (Malaysia) Sdn. Bhd. (Company registration number: 463469-W) which is a Participating
Organisation of Bursa Malaysia Berhad and a holder of Capital Markets Services License issued by the Securities Commission. Taiwan: Information on securities/instruments that are traded in Taiwan
is distributed by Macquarie Capital Securities Ltd, Taiwan Branch, which is licensed and regulated by the Financial Supervisory Commission. No portion of the report may be reproduced or quoted by the
press or any other person without authorisation from Macquarie. Nothing in this research shall be construed as a solicitation to buy or sell any security or product. Research Associate(s) in this report who
are registered as Clerks only assist in the preparation of research and are not engaged in writing the research. Thailand: In Thailand, research is produced with the contribution of Kasikorn Securities
Public Company Limited, issued and distributed by Macquarie Securities (Thailand) Ltd. Macquarie Securities (Thailand) Ltd. is a licensed securities company that is authorized by the Ministry of Finance,
regulated by the Securities and Exchange Commission of Thailand and is an exchange member of the Stock Exchange of Thailand. Macquarie Securities (Thailand) Limited and Kasikorn Securities Public
Company Limited have entered into an exclusive strategic alliance agreement to broaden and deepen the scope of services provided to each parties respective clients. The strategic alliance does not
constitute a joint venture. The Thai Institute of Directors Association has disclosed the Corporate Governance Report of Thai Listed Companies made pursuant to the policy of the Securities and Exchange
Commission of Thailand. Macquarie Securities (Thailand) Ltd does not endorse the result of the Corporate Governance Report of Thai Listed Companies but this Report can be accessed at:
http://www.thai-iod.com/en/publications.asp?type=4. South Korea: In South Korea, unless otherwise stated, research is prepared, issued and distributed by Macquarie Securities Korea Limited , which is
regulated by the Financial Supervisory Services. Information on analysts in MSKL is disclosed at http://dis.kofia.or.kr/fs/dis2/fundMgr/DISFundMgrAnalystPop.jsp?companyCd2=A03053&pageDiv=02.
South Africa: In South Africa, research is issued and distributed by Macquarie First South Securities (Pty) Limited, a member of the JSE Limited. Singapore: In Singapore, research is issued and
distributed by Macquarie Capital Securities (Singapore) Pte Ltd (Company Registration Number: 198702912C), a Capital Markets Services license holder under the Securities and Futures Act to deal in
securities and provide custodial services in Singapore. Pursuant to the Financial Advisers (Amendment) Regulations 2005, Macquarie Capital Securities (Singapore) Pte Ltd is exempt from complying with
sections 25, 27 and 36 of the Financial Advisers Act. All Singapore-based recipients of research produced by Macquarie Capital (Europe) Limited, Macquarie Capital Markets Canada Ltd, Macquarie First
South Securities (Pty) Limited and Macquarie Capital (USA) Inc. represent and warrant that they are institutional investors as defined in the Securities and Futures Act. United States: In the United States,
research is issued and distributed by Macquarie Capital (USA) Inc., which is a registered broker-dealer and member of FINRA. Macquarie Capital (USA) Inc, accepts responsibility for the content of each
research report prepared by one of its non-US affiliates when the research report is distributed in the United States by Macquar ie Capital (USA) Inc. Macquarie Capital (USA) Inc.’s affiliate’s analysts are
not registered as research analysts with FINRA, may not be associated persons of Macquarie Capital (USA) Inc., and therefore may not be subject to FINRA rule restrictions on communications with a
subject company, public appearances, and trading securities held by a research analyst account. Information regarding futures is provided for reference purposes only and is not a solicitation for purchases
or sales of futures. Any persons receiving this report directly from Macquarie Capital (USA) Inc. and wishing to effect a transaction in any security described herein should do so with Macquarie Capital
(USA) Inc. Important disclosure information regarding the subject companies covered in this report is available at www.macquarie.com/research/disclosures, or contact your registered representative at 1-
888-MAC-STOCK, or write to the Supervisory Analysts, Research Department, Macquarie Securities, 125 W.55th Street, New York, NY 10019.
© Macquarie Group
Page 34