THE NEXT GENERATION OF RETAIL NEXT GENERATION OF RETAIL We often look at what is impacting the...
10
July 2016 RETAIL INDUSTRY INSIGHTS FOR TODAY’S RETAILERS AND CPGS THE NEXT GENERATION OF RETAIL
Transcript of THE NEXT GENERATION OF RETAIL NEXT GENERATION OF RETAIL We often look at what is impacting the...
July 2016
RETAIL INDUSTRY INSIGHTS FOR TODAY’S RETAILERS AND CPGS
THE NEXT GENERATION OF RETAIL

© 2016 Interactions Consumer Experience Marketing, Inc. | www.interactionsmarketing.com1
THE NEXT GENERATION OF RETAILWe often look at what is impacting the future of retail, but in this exclusive Retail Perceptions report from
Interactions, the global leader in experiential marketing for retailers and brands, we look at who is going to
have the greatest impact on the retail industry. Generation Z, the group born after Millennials, now makes up
25 percent of the entire U.S. population, making them larger than any other living group. This cohort of
constantly-connected, multitasking, technologically-savvy do-gooders is getting ready to turn the retail industry
on its head.
Over 70 percent of parents say their Generation Z children influence buying decisions about apparel and
family meals. Beyond influencing family decisions, thanks to their own allowances and jobs, Generation Z already
possess $44 billion in spending power. By 2020, Generation Z will make up 40 percent of the population in the
world’s biggest markets, including the U.S., Europe, China, India, Brazil and Russia.*
From the in-store experience to shopping online to the power of social media, the proprietary findings in
Interactions’ The Next Generation of Retail reveal the habits, preferences and influences Generation Z already
has on the retail industry.
*Sources Forbes, Strategy&
METHODOLOGY AND DEMOGRAPHICSIn May 2016, Interactions Marketing collaborated with Peanut Labs, a global sampling platform that offers users direct access to tens of millions of consumers and business professionals to conduct a representative sampling of 2,011 members of Generation Z, specifically those between the ages of 14 and 19 years old. The proprietary findings in this report detail their shopping habits, preferences, and serve as a guide map for retailers to engage and interact with the world’s fastest growing consumer group.
23% NORTHEAST
25% WEST
22% MIDWEST
29% SOUTH
51% Female
49% Male
Age
14 9%
15 8%
16 15%
17 15%
18 26%
19 27%

© 2016 Interactions Consumer Experience Marketing, Inc. | www.interactionsmarketing.com 2
GENERATION Z: SHOPPER DIAGNOSTIC
55% say their parents
give them an
allowance
52% have
part time jobs
Habits and preferences of today’s teenagers
28% Under $50
33% $50-$100
24% $101-$200
11% $201-$400 4%
Over $400
Weekly Spending Money
They are decisive on where they spend money each week
Food ...............................................80%Clothing ........................................67%Experiences with friends ......47%Music/books/magazines ....41%Electronics ...................................40%Beauty products ......................37% Car or transportation ............32%Savings ..........................................30%Jewelry ..........................................20%Contribute to charity ...............7%
Only19% say they currently find out about
new products via text notifications
from retailers
89% consider themselves
price-conscious shoppers
62% prefer to spend their money on an experience over purchasing
something material
Receiving text messages is the #1 preferred method
for communicating with retailers and brands
1. Text2. Images3. Email4. Video5. In person at the store
3
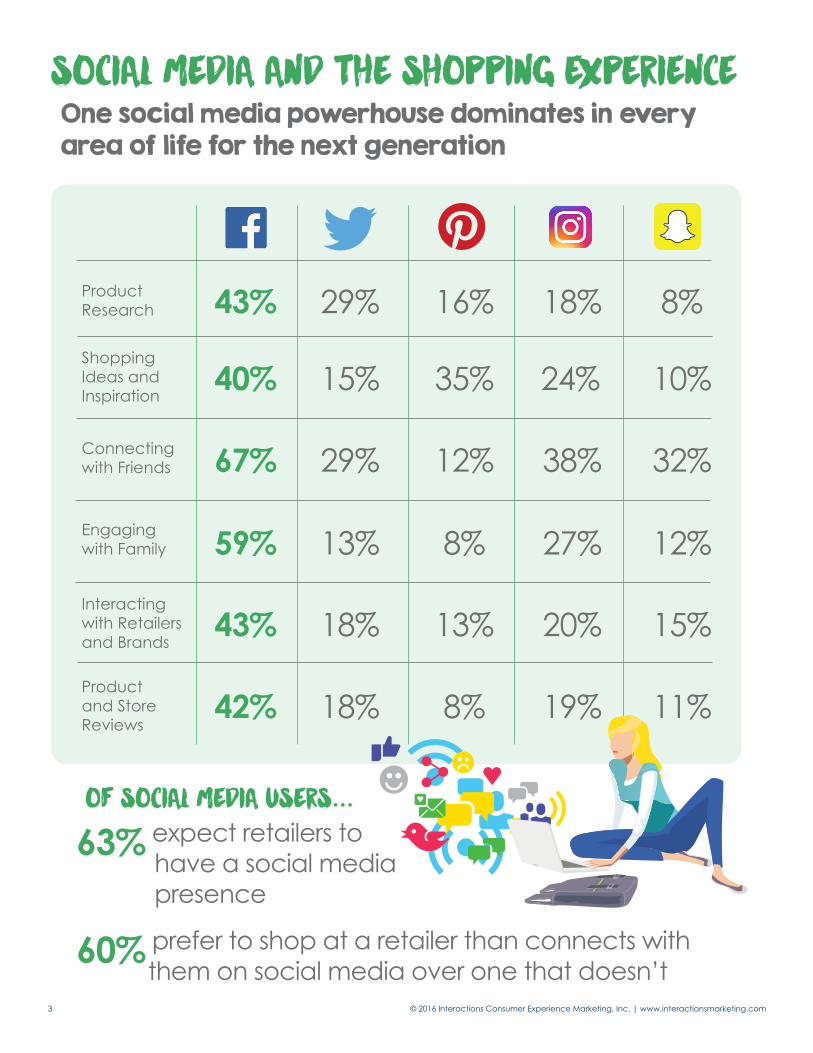
SOCIAL MEDIA AND THE SHOPPING EXPERIENCE
63% expect retailers to have a social media presence
60% prefer to shop at a retailer than connects with them on social media over one that doesn’t
© 2016 Interactions Consumer Experience Marketing, Inc. | www.interactionsmarketing.com
One social media powerhouse dominates in every area of life for the next generation
Product Research
Shopping Ideas and Inspiration
Connecting with Friends
Engaging with Family
Interacting with Retailers and Brands
Product and Store Reviews
43% 29% 16% 18% 8%
40% 15% 35% 24% 10%
67% 29% 12% 38% 32%
59% 13% 8% 27% 12%
43% 18% 13% 20% 15%
42% 18% 8% 19% 11%
OF SOCIAL MEDIA USERS . . .

© 2016 Interactions Consumer Experience Marketing, Inc. | www.interactionsmarketing.com 4
77% browse social media to look for ideas on what products to purchase
82% say that opinions of others on social media have led them to shop at a retailer they had never shopped at before
The popularity of researching product information
on a retailer’s website (56%) is nearly identical
to researching on social media (58%) Which
means your presence on social channels is just as important, if
not more than your website. With social you have a platform to post, respond and react 24/7.
What Gen Z prefers RETAILERS share on social media
78% New products 62% Discounts/promotions/ coupons 50% New trends 46% Upcoming in-store special events 24% Online events (e.g. chat with the experts) 19% Product information – (how a product is made or where materials are sourced) 16% Employee recommendations 15% Information on charities the retailer supports 11% Company personality/ company culture
THE POWER OF SOCIAL MEDIAHow social influences shopping behaviors
VSWhat GEN Z will share on social media
65% Product Quality Reviews46% Positive customer service experiences33% Product availability 30% Discounts/ promotions 28% Negative customer service experiences 23% Diversity of products 18% Special events
69% have visited a retailer’s store as the result of that retailer’s social media post

© 2016 Interactions Consumer Experience Marketing, Inc. | www.interactionsmarketing.com6
IN-STORE SHOPPING EXPERIENCEEven with the world at their fingertips, Generation Z prefers shopping in store
77% prefer unique
products over popular ones
64% would rather shop
in-store than online 1. A clean store
75% prefer to shop at retailers that provide an engaging in-store experience
Top 5 Components of an In-Store Shopping Experience
62% prefer to have questions answered by store associates over reading product displays
67% prefer shopping at a retailer that offers self-checkout over one that doesn’t
2. Friendly and knowledgeable store associates
3. A positive checkout experience
4. The use of technology in the shopping experience
5. Availability of customer feedback channels

© 2016 Interactions Consumer Experience Marketing, Inc. | www.interactionsmarketing.com 7
Top 5 Factors in Making
a Purchase 1. Price2. Quality3. Brand name4. Social responsibility of brand/retailer5. Environmentally friendly product
IN-STORE SHOPPING EXPERIENCE IN-STORE VS. ONLINEBricks trump clicks for overall experience as well as category-specific purchases
WHERE GENERATION Z PREFERS TO SHOP
80% browse in store when unsure of
what to purchase
Online
In-store 21%
79%
32%
68%
42%58%
34%
66%
41%
59%40%
60%
49%
51%57%
43%

© 2016 Interactions Consumer Experience Marketing, Inc. | www.interactionsmarketing.com8
LOCAL, BUT NOT SO LOYALGeneration Z appreciates community, but will their devotion become extinct?
While 59% prefer to shop at local retailers over big box retailers, 72% would be more willing to shop at national chains if they had more of a local presence in their community.
Generation Z shoppers say they’ll gladly switch where they shop and what brands they buy:
81% will switch from their favorite brand if they find a similar product at a higher quality
72% will switch from their favorite brand if they find a similar product for a lower price
47% have stopped purchasing their favorite brand after finding out they didn’t produce environmentally friendly products
79% say their preference is for a quality product, not
necessarily a name-brand item
SHOP LOCAL

© 2016 Interactions Consumer Experience Marketing, Inc. | www.interactionsmarketing.com 9
TECHNOLOGY, TRUST AND RETAIL
67% check store apps on a regular basis outside of shopping to see if there are any discounts
83% trust product information shared by other shoppers more than they
trust marketing advertisements
59% avoid shopping at retailers that
have been hit by security
breaches and
78% trust retailers to keep
their personal information safe
75% would rather shop at a retailer
that accepts mobile
payments over one
that doesn’t
51% Look for the best price
16% Compare with other products
15.5% Want the highest quality product
15.5% Read product reviews
68% research before purchasing at
least half of the time
75% check a store’s app while they’re shopping for special offers before finalizing purchases

This document is the result of primary research performed by Interactions Consumer Experience Marketing, Inc. Interactions’ methodologies provide for objective fact-based research and represent the best analysis available at the time of publication. Unless otherwise noted, the entire contents of this publication are copyrighted by Interactions and may not be reproduced, distributed, archived or transmitted in any means without prior written consent by Interactions.
Interactions is the global leader in innovative retail solutions and experiential marketing for retailers and brands.
Our workforce of more than 45,000 associates creates and produces nearly 3 million consumer events every year.
Interactions’ integrated sales and marketing programs engage shoppers in-store and outdoor, provide insights into shopper behavior and customer service, and enable retailers and brands to make smarter business decisions and drive significant sales increases.
Founded in 1988, the company has offices around the globe and operates in North America, Europe, South Africa, Australia and Asia.
For more information, visit interactionsmarketing.com.
This primary research was conducted in May 2016 by Interactions with a representative sample of males and females ages 14 to 19 across all geographies, income levels and ethnicities within the United States. For more information on how to make this data work for you, visit www.interactionsmarketing.com.
About Us
Contact Us:
Interactions9555 Chesapeake Drive, Suite 100 San Diego, CA 92123858-581-8718hello@interactionsmarketing.comwww.interactionsmarketing.com/retailperceptions