![[INFOGRAPHIC] Standard Deviation Measurements of Methyal Isocyanate](https://static.fdocuments.in/doc/165x107/58ed63961a28aba1408b46eb/infographic-standard-deviation-measurements-of-methyal-isocyanate.jpg)
[INFOGRAPHIC] Standard Deviation Measurements of Methyal Isocyanate

The Next Evolution of
Isocyanate SamplingASSET™ EZ4-NCO Dry Sampler
Volume 30.33
pg. 11 ILLICIT BATH SALTS
IN URINE
pg. 24
PESTICIDE DETERMINATION IN ORANGES
Supel QuE QuEChERS
pg. 3

sigma-aldrich.com/analytical
Reporter 30.3 |2Reporter
Reporter is published five times a year by
Supelco, 595 North Harrison Road, Bellefonte,
PA 16823-0048.
Table of Contents
Industrial Hygiene
Sampling and Analysis of Isocyanates ...3
Environmental – Air
Formaldehyde and Acetaldehyde Determination in Air ..........................................5
Pharmaceutical
New Ascentis Express 5 micron: Faster HPLC Separations without Backpressure Concerns ....................................7
Clinical and Forensic
Spice Cannabinoids – Impact of Mobile Phase Additives on LC-MS Sensitivity .....8
Illicit Bath Salts in Urine – LC-MS Characterization ................................................11
Fractionation of Serum Metabolome into Phospholipids and Other Metabolites ...14
VOCs in Exhaled Breath as Cancer Biomarkers ...........................................17
General Labware
Why Use Certified Vials? ...............................19
Food and Beverage Analysis
Polar Ingredients in Beverages .................20
Methylimidazoles in Caramel Colored Carbonated Beverages ..................................22
Improved Determination of Pesticides in Oranges .............................................................24
Chromatographic Purification
Removal of Detergents from Biological Product Matrices ...............................................26
Cover Photo: New ASSET EZ4-NCO: A significant advance in
industrial hygiene monitoring for work place
exposure to isocyanates.
Volume 30.3
The Next Evolution of Isocyanate Sampling
Dear Colleague:
Since the 1930’s, our lives have changed for the better with the commercialization of
polyurethane materials. Polyurethanes are used in paints, coatings, adhesives, fibers and
spray foam applications, to name a few. They have also replaced metal and plastic parts;
increased the life of mechanical equipment and reduced downtimes. Their many valuable
physical properties such as abrasion resistance, weather resistance, tear resistance; oil and
solvent resistance, electrical properties and flexibility have given us a better quality of life.
Due to the wide range of uses of polyurethane materials, employees who manufacture,
convert, or apply these materials are at risk for exposure to isocyanate compounds.
Isocyanates are a family of highly reactive, low molecular weight chemicals used in the
production of polyurethane materials and are known to cause respiratory disorders
such as asthma, irritation of the mucous membranes, skin inflammation and even death.
Current sampling methods are inadequate to truly estimate workplace exposure of these
compounds, due to incomplete derivatization of particles, field desorption, low capacity,
poor shelf-life and stability, and inability to truly assess exposure during an eight-hour
work shift.
Our new and innovative ASSET™ EZ4-NCO Dry Sampler for Isocyanates solves many issues
of existing sampling devices. In 2011, we partnered with the inventors of the sampler, Drs.
Gunnar Skarping and Marianne Dalene from the Institutet För Kemisk Analys Norden AB
(IFKAN) in Hasselholm, Sweden. The ASSET EZ4-NCO sampler complies with ISO 17734-
1: Determination of organonitrogen compounds in air using LC-MS Part 1: Isocyanates using
dibutylamine derivatives. It is fully validated, easy-to-use and provides the ultimate sensitivity
not capable with other sampling devices. We offer a full complement of calibration
standards, deuterated internal standards, chemicals and analytical columns to support the
ASSET Sampler.
We invite you to learn more about our innovative ASSET EZ4-NCO Dry Sampler by scanning
the QR Code below or visiting sigma-aldrich.com/asset.
Kind regards,
Kristen Schultz
Air Monitoring Product Manager
Supelco
Kristen Schultz
Air Monitoring
Product Manager
sigma-aldrich.com/analytical
Visit us on the web at
sigma-aldrich.com/thereporter
3Order: 800-325-3010 (U.S.) 814-359-3441 (Global)
Analysis of Isocyanates Using the ASSET™ EZ4-NCO Dry SamplerJamie Brown, Emily Barrey, Olga Shimelis and Kristen Schultz
Introduction
Isocyanates are used as a raw material to produce a number of
products such as automotive paints, rigid and spray foam insulation
and furniture, to name a few. Personal exposure can occur while the
products made with isocyanates are being applied, or when the
materials are removed by grinding or thermal degradation. Workers
who are exposed to these compounds are at risk for respiratory
disorders and asthma. The highly reactive nature of the isocyanate
compounds and the low occupational exposure limits put high
demands on both sampling and analytical techniques for monitoring
of isocyanates in air.
The most common devices for sampling isocyanates are impingers
and impregnated filters. Impingers are the least desired for personal
sampling due to the risk of exposure to solvent vapors during
sampling. There are also other issues such as glass breakage and
difficulty shipping the needed reagents before and after sampling.
Existing impregnated filter devices are safer for the worker to wear
but have their own known issues, such as:
Incomplete derivatization of particle bound analytes
Insufficient capacity and/or breakthrough resulting in
underestimation of isocyanate concentration
Limited range of isocyanate compounds
Field reagent addition and/or desorption necessary/
recommended
Unstable reagents and limited shelf-life
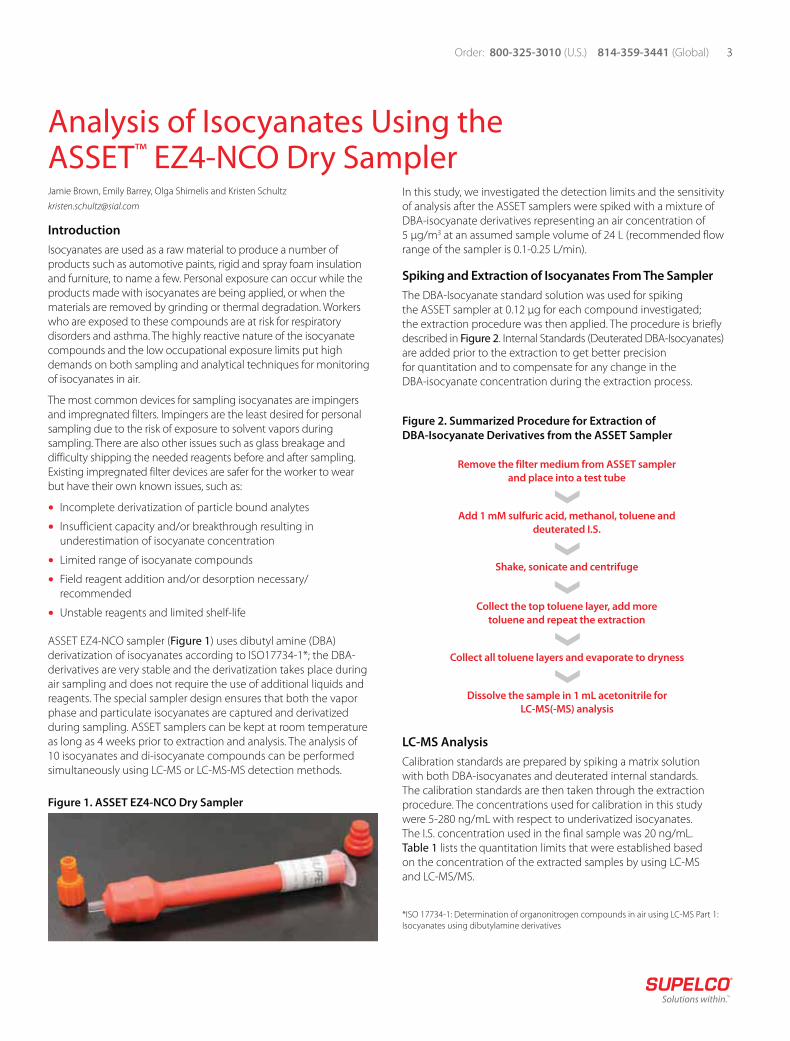
ASSET EZ4-NCO sampler (Figure 1) uses dibutyl amine (DBA)
derivatization of isocyanates according to ISO17734-1*; the DBA-
derivatives are very stable and the derivatization takes place during
air sampling and does not require the use of additional liquids and
reagents. The special sampler design ensures that both the vapor
phase and particulate isocyanates are captured and derivatized
during sampling. ASSET samplers can be kept at room temperature
as long as 4 weeks prior to extraction and analysis. The analysis of
10 isocyanates and di-isocyanate compounds can be performed
simultaneously using LC-MS or LC-MS-MS detection methods.
Figure 1. ASSET EZ4-NCO Dry Sampler
In this study, we investigated the detection limits and the sensitivity
of analysis after the ASSET samplers were spiked with a mixture of
DBA-isocyanate derivatives representing an air concentration of
5 μg/m3 at an assumed sample volume of 24 L (recommended flow
range of the sampler is 0.1-0.25 L/min).
Spiking and Extraction of Isocyanates From The Sampler
The DBA-Isocyanate standard solution was used for spiking
the ASSET sampler at 0.12 μg for each compound investigated;
the extraction procedure was then applied. The procedure is briefly
described in Figure 2. Internal Standards (Deuterated DBA-Isocyanates)
are added prior to the extraction to get better precision
for quantitation and to compensate for any change in the
DBA-isocyanate concentration during the extraction process.
Figure 2. Summarized Procedure for Extraction of
DBA-Isocyanate Derivatives from the ASSET Sampler
Remove the filter medium from ASSET sampler
and place into a test tube
Add 1 mM sulfuric acid, methanol, toluene and
deuterated I.S.
Shake, sonicate and centrifuge
Collect all toluene layers and evaporate to dryness
Collect the top toluene layer, add more
toluene and repeat the extraction
Dissolve the sample in 1 mL acetonitrile for
LC-MS(-MS) analysis
LC-MS Analysis
Calibration standards are prepared by spiking a matrix solution
with both DBA-isocyanates and deuterated internal standards.
The calibration standards are then taken through the extraction
procedure. The concentrations used for calibration in this study
were 5-280 ng/mL with respect to underivatized isocyanates.
The I.S. concentration used in the final sample was 20 ng/mL.
Table 1 lists the quantitation limits that were established based
on the concentration of the extracted samples by using LC-MS
and LC-MS/MS.
*ISO 17734-1: Determination of organonitrogen compounds in air using LC-MS Part 1:
Isocyanates using dibutylamine derivatives

sigma-aldrich.com/analytical
Reporter 30.3 |4 Industrial Hygiene
Table 1. Limits of Quantitation for LC-MS and LC-MS/MS Methods
Compound MS (ng/mL) MS/MS (ng/mL)
ICA 5.00 1.000
MIC 25.00 3.000
EIC 15.00 4.000
PIC 10.00 10.000
PhI 3.00 0.400
HDI 2.00 0.500
2,6-TDI 3.00 0.030
2,4-TDI 3.00 0.030
IPDI-1 4.00 0.400
IPDI-2 4.00 0.400
MDI 3.00 2.000
Figure 3. Chromatogram of DBA Standard
(equivalent 0.20 μg/mL each underivatized monomer)
column: Ascentis® Express C18, 15 cm x 4.6 mm, 2.7 μm particles (53829-U)
mobile phase: (A) 5:95 acetonitrile:water w/ 0.05% formic acid; (B) 95:5 acetonitrile:water w/ 0.05% formic acid
gradient: 40% to 70% B in 3 min; 70% to 90% B in 2 min; hold at 90% for 6 min, 90% to 40% in 0.1 min, hold at 40% for 3.9 min
flow rate: 1 mL/min
column temp.: 35 °C
detector: AB3200 QTrap MS, ESI(+), SIM
injection: 2 μL
1. Isocyanic acid (ICA)
2. Methyl isocyanate (MIC)
3. Ethyl isocyanate (EIC)
4. Propyl isocyanate (PIC)
5. Phenyl isocyanate (PhI)
2 4 6 8 10 12 14Min
0.0
1.0e6
2.0e6
3.0e6
4.0e6
5.0e6
6.0e6
7.0e6
8.0e6
1
2 3
4
5
6
7
8
9
10
11
6. Hexylmethylene diisocyanate (HDI)
7. 2,6-Toluene diisocyanate (2,6-TDI)
8. 2,4-Toluene diisocyanate (2,4-TDI)
9. Isophorone diisocyanate (isomer 1) (IPDI-1)
10. 4,4’-Methylenediphenyl diisocyanate (MDI)
11. Isophorone diisocyanate (isomer 2) (IPDI-2)
Recoveries
Overall, the recoveries for spiked filter sample with the DBA
derivatives were consistent ranging 77.9-125% with RSD’s <16%
for MS and averages of 95.0-117% with RSD’s < 9% for MS/MS
analytical methods. Spiking the sampler with 0.12 μg of each
isocyanate-derivative would equate to 5 μg/m3 air concentration
if a 24 liter air sample was taken.
Table 2. Average Recovery (%RSD) from 0.12 μg Spiked
Sampler (n=3)
Compound MS (ng/mL) MS/MS (ng/mL)
ICA** 98% (5) 117% (1)
MIC 101% (2) 97% (3)
EIC 95% (5) 95% (3)
PIC 78% (15) 102% (8)
PhI 95% (4) 100% (4)
HDI 125% 116% (2)
2,6-TDI 108% (13) 101% (4)
2,4-TDI 107% (6) 102% (4)
IPDI-1 102% (4) 103% (5)
IPDI-2 102% (4) 100% (2)
MDI 89% (13) 111% (9)
** Recoveries were corrected for a small amount of ICA found in the filter blank sample.
Conclusions
We investigated the performance of the LC-MS and LC-MS-MS methods
in the analysis of isocyanates using the new ASSET™ EZ4-NCO Dry
Sampler. We found that the analytical method can successfully reach
the quantitation limit for most isocyanates of 5 ng/mL in the final
sample when LC-MS-MS analysis was used and the quantitation limit
of 10 ng/mL when LC-MS analysis was used. These numbers can
translate, respectively, to 0.21 μg/m3 and 0.42 μg/m3 in air if a 24 liter air
sample was taken. Both LC-MS and LC-MS-MS analysis gave reasonably
low LOQs for the method. All 11 compounds were well-resolved
chromatographically using a 15 cm Ascentis Express C18 column.
The acceptable recoveries for the isocyantes demonstrated the overall
efficient performance of the extraction and analytical method.
Featured Products
Description Qty. Cat. No.
Sampling Device
ASSET EZ4-NCO Dry Sampler 10
50
5027-U
5028-U
Analytical Column
Ascentis Express C18,15 cm x 4.6 mm, 2.7 μm particles 1 53829-U
Analytical Standards (in acetonitrile:methanol, 99:1, varied conc)
DBA Isocyanate Mix 6 x 1 mL 40141-UIsocyanic acid-di-n-butylamine (ICA-DBA), 1 μg/mL
Ethyl isocyanate-di-n-butylamine (EIC-DBA), 1 μg/mL
Hexamethylene diisocyanate-2(di-n-butylamine) (HDI-2(DBA)), 1 μg/mL
Isophorone isocyanate-2(di-n-butyl amine) isomer 1 (IPDI-2(DBA)), 1 μg/mL
Isophorone isocyanate-2(di-n-butyl amine) isomer 2 (IPDI2-2(DBA)), 0.4 μg/mL
4,4'-Methylenediphenyl diisocyanate-2(di-n-butylamine) (4,4'-MDI-2(DBA)), 1 μg/mL
Methyl isocyanate-di-n-butylamine (MIC-DBA), 1 μg/mL
Phenyl isocyanate-di-n-butylamine (PhI-DBA), 1 μg/mL
Propyl isocyanate-di-n-butylamine (PIC-DBA), 1 μg/mL
2,4-Toluene diisocyanate-di-n-butylamine (2,4-TDI-2(DBA)), 1 μg/mL
2,6-Toluene diisocyanate-2(di-n-butylamine) (2,6-TDI-2(DBA)), 1 μg/mL
d9-DBA Isocyanate Internal Standard Mix 6 x 1 mL 40142-UIsocyanic acid-di-n-butylamine-d9 (ICA-DBA- d9), 1 μg/mL
Ethyl isocyanate-di-n-butylamine-d9 (EIC-DBA-d9), 1 μg/mL
Hexamethylene diisocyanate-2(di-n-butylamine-d9) (HDI-2(DBA-d9)), 1 μg/mL
Isophorone diisocyanate-2(di-n-butylamine-d9) isomer 1 (IPDI-2(DBA-d9)), 1 μg/mL
Isophorone diisocyanate-2(di-n-butylamine-d9) isomer 2 (IPDI2-2(DBA-d9)), 0.28 μg/mL
4,4-Methylenediphenyl diisocyanate-2(di-n-butylaine-d9) (4,4'-MDI-2(DBA-d9)), 1 μg/mL
Methyl isocyanate-di-n-butylamine-d9 (MIC-DBA-d9), 1 μg/mL
Phenyl isocyanate-di-n-butylamine-d9 (PhI-DBA-d9), 1 μg/mL
Propyl isocyanate-di-n-butylamine-d9 (PIC-DBA-d9), 1 μg/mL
2,4-Toluene diisocyanate-2(di-n-butylamine-d9) (2,4-TDI-2(DBA-d9)), 1 μg/mL
2,6-Toluene diisocyanate-2(di-n-butylamine-d9) (2,6-TDI-2(DBA-d9)), 1 μg/mL
DBA Isocyanates Mix Kit 2 x 1 mL 40143-UIncludes 1 mL of 40141-U and 1 mL of 40142-U listed above
5Order: 800-325-3010 (U.S.) 814-359-3441 (Global)
Formaldehyde and Acetaldehyde Determination in Air Using Fully Automated On-Line Desorption and Analysis of DNPH Cartridges
Introduction
Airborne aldehydes and ketones are collected by passing air through
a cartridge containing 2,4-dinitrophenylhydrazine (DNPH). Carbonyl
compounds react with the DNPH to form hydrazones, which are
immobilized on the cartridge. These compounds can be easily eluted
from the cartridge with acetonitrile and analyzed by HPLC with UV
detection. Traditionally, this analysis including the workup contains
a series of manual steps, which can become time-consuming and
could incur experimental error.
Method
In the discussed study, a required amount of air to be tested is
passed through a Supelco® LpDNPH S10 cartridge. The manual
desorption process is detailed as follows: Each cartridge is placed into
a vacuum manifold and acetonitrile is used to elute the derivatized
aldehyde or ketone from the cartridge. The extract is collected
into a 5 mL volumetric flask and the flow of acetonitrile is stopped
when 5 mL has been collected. This is performed by eye, checking
that the top of the meniscus has reached the 5 mL mark. The volume
of extract collected is critical as the concentration of the derivatized
product will be dependent on the volume collected. The extract
is then shaken to ensure that the solution is adequately mixed
and subsequently filtered using a 0.2 micron PTFE filter, and a
portion of this solution is then pipetted into a vial for HPLC
analysis by UV detection.
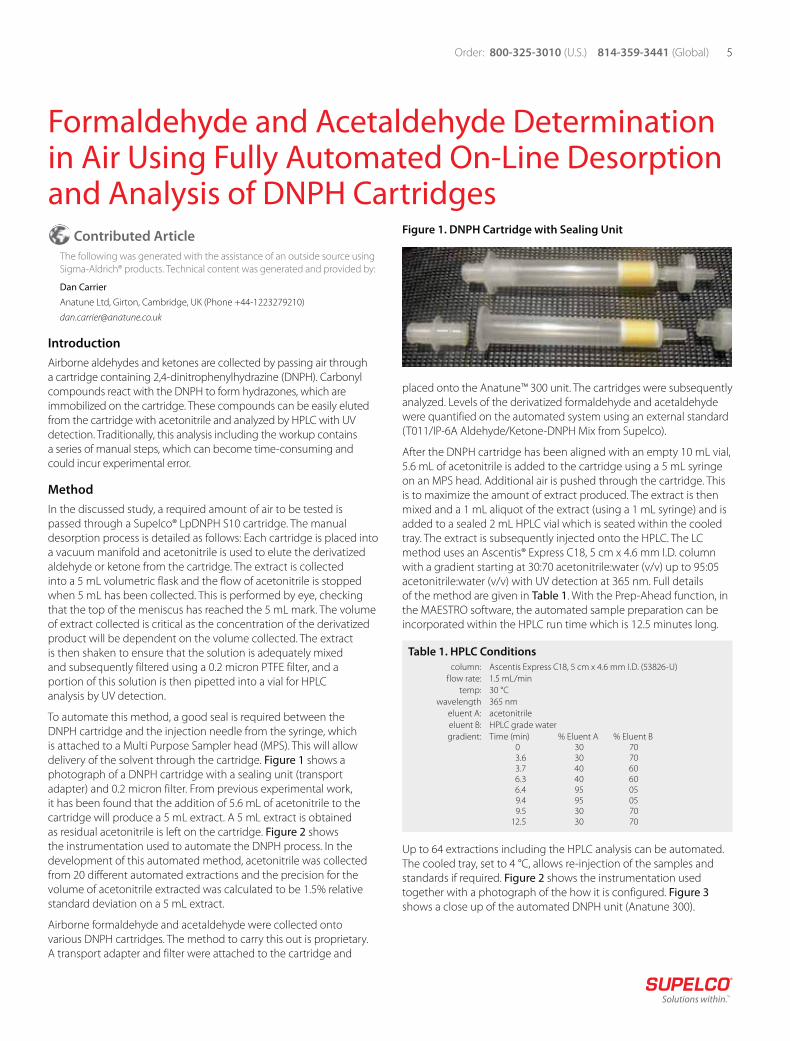
To automate this method, a good seal is required between the
DNPH cartridge and the injection needle from the syringe, which
is attached to a Multi Purpose Sampler head (MPS). This will allow
delivery of the solvent through the cartridge. Figure 1 shows a
photograph of a DNPH cartridge with a sealing unit (transport
adapter) and 0.2 micron filter. From previous experimental work,
it has been found that the addition of 5.6 mL of acetonitrile to the
cartridge will produce a 5 mL extract. A 5 mL extract is obtained
as residual acetonitrile is left on the cartridge. Figure 2 shows
the instrumentation used to automate the DNPH process. In the
development of this automated method, acetonitrile was collected
from 20 different automated extractions and the precision for the
volume of acetonitrile extracted was calculated to be 1.5% relative
standard deviation on a 5 mL extract.
Airborne formaldehyde and acetaldehyde were collected onto
various DNPH cartridges. The method to carry this out is proprietary.
A transport adapter and filter were attached to the cartridge and
placed onto the Anatune™ 300 unit. The cartridges were subsequently
analyzed. Levels of the derivatized formaldehyde and acetaldehyde
were quantified on the automated system using an external standard
(T011/IP-6A Aldehyde/Ketone-DNPH Mix from Supelco).
After the DNPH cartridge has been aligned with an empty 10 mL vial,
5.6 mL of acetonitrile is added to the cartridge using a 5 mL syringe
on an MPS head. Additional air is pushed through the cartridge. This
is to maximize the amount of extract produced. The extract is then
mixed and a 1 mL aliquot of the extract (using a 1 mL syringe) and is
added to a sealed 2 mL HPLC vial which is seated within the cooled
tray. The extract is subsequently injected onto the HPLC. The LC
method uses an Ascentis® Express C18, 5 cm x 4.6 mm I.D. column
with a gradient starting at 30:70 acetonitrile:water (v/v) up to 95:05
acetonitrile:water (v/v) with UV detection at 365 nm. Full details
of the method are given in Table 1. With the Prep-Ahead function, in
the MAESTRO software, the automated sample preparation can be
incorporated within the HPLC run time which is 12.5 minutes long.
Table 1. HPLC Conditions
column: Ascentis Express C18, 5 cm x 4.6 mm I.D. (53826-U)
flow rate: 1.5 mL/min
temp: 30 °C
wavelength 365 nm
eluent A: acetonitrile
eluent B: HPLC grade water
gradient: Time (min) % Eluent A % Eluent B 0 30 70 3.6 30 70 3.7 40 60 6.3 40 60 6.4 95 05 9.4 95 05 9.5 30 70 12.5 30 70
Up to 64 extractions including the HPLC analysis can be automated.
The cooled tray, set to 4 °C, allows re-injection of the samples and
standards if required. Figure 2 shows the instrumentation used
together with a photograph of the how it is configured. Figure 3
shows a close up of the automated DNPH unit (Anatune 300).
Contributed Article
The following was generated with the assistance of an outside source using
Sigma-Aldrich® products. Technical content was generated and provided by:
Dan Carrier
Anatune Ltd, Girton, Cambridge, UK (Phone +44-1223279210)
Figure 1. DNPH Cartridge with Sealing Unit

sigma-aldrich.com/analytical
Reporter 30.3 |6 Environmental – Air
Figure 2. Anatune 300 Instrument
Figure 3. Closeup of the Automated DNPH Unit (Anatune 300)
Results
Figure 4 shows an example chromatogram of 0.075 ppm formaldehyde
and acetaldehyde standard. Formaldehyde elutes at 3.7 minutes and
acetaldehyde at 5.3 minutes. Six replicate injections of the 5 ppm
standard were performed giving a percent relative standard deviation
of 1.2% for formaldehyde and 1.3% for acetaldehyde. Levels of
formaldehyde and acetaldehyde in the sample were consistent with
the manual method. Figure 5 shows an example chromatogram of a
sample containing formaldehyde and acetaldehyde. Table 2 shows
the results obtained from five different sampled DNPH cartridges
for formaldehyde and acetaldehyde using the automated process.
Levels calculated from injecting an external 0.075 ppm standard of
formaldehyde and acetaldehyde.
Table 2. Formaldehyde and Acetaldehyde Results for Samples
Using the Automated Process Describedin the Methods Section
Sample Description Formaldehyde (ppm) Acetaldehyde (ppm)
Sample A-1 0.95 0.45
Sample A-2 0.91 0.49
Sample B-1 0.85 0.44
Sample B-2 0.85 0.44
Sample C-1 0.61 0.38
Sample C-2 0.61 0.37
Sample D-1 0.76 0.46
Sample D-2 0.75 0.45
Sample E-1 0.80 0.43
Sample E-2 0.79 0.43
Conclusion
Automating the extraction of LpDNPH S10 cartridges and putting
it in-line with the HPLC analysis will significantly reduce manual
labor using this technique and this will improve reproducibility
of the method by reducing potential experimental errors by
the operator. The automation and unattended operation of
the method leads to high throughput for determining airborne
formaldehyde and acetaldehyde.
Featured Products
Description Qty. Cat. No.
Ascentis® Express C18, 5 cm x 4.6 mm I.D., 2.7 μm particles 1 53826-U
LpDNPH S10 Cartridge 10 21026-U
Acetonitrile, CHROMASOLV®, gradient grade 1 34851
Water, for HPLC 1 95304
T011/IP-6A Aldehyde/Ketone-DNPH Mix 1 47285-U
Figure 4. 0.075 ppm Formaldehyde and Acetaldehyde Standard
Figure 5. Example Chromatogram of a Sample Containing
Formaldehyde and Acetaldehyde
1. Formaldehyde-DNPH
2. Acetaldehyde-DNPH
Min0 2 4 6
12
Min0 2 4 6
1
2
1. Formaldehyde-DNPH
2. Acetaldehyde-DNPH
7Order: 800-325-3010 (U.S.) 814-359-3441 (Global)
Ascentis® Express 5 micron: A Fused-Core® Particle HPLC Column for Faster HPLC Separations with No Backpressure ConcernsWayne K. Way and Carmen T. Santasania
Ascentis Express 5 micron columns provide a new choice for
improving the performance of traditional HPLC systems. Based
on Fused-Core particle technology, Ascentis Express provides the
benefits of high speed and high efficiencies without the concerns
of smaller particle columns. Due to the high efficiencies at low
backpressures, Ascentis Express 5 micron can benefit conventional
HPLC users with no drawbacks.
The new Fused-Core particle consists of a 3.3 μm solid core and a
0.6 μm porous shell. A major benefit of the Fused-Core particle is the
small diffusion path (0.6 μm) compared to conventional fully porous
particles. The short diffusion path reduces axial dispersion of solutes
and minimizes peak broadening. In fact, Ascentis Express 5 micron
columns are able to achieve greater speed and efficiency than any
other 5 micron particle based column. This means that Ascentis
Express 5 micron becomes the standard column for all of your
5 micron based methods.
Beyond the new standard column for all 5 micron based methods,
Ascentis Express 5 micron is an excellent choice for bioanalytical
LC/MS methods. The Ascentis Express 5 micron excels under high
flow rates and the high throughput demands of these methods.
Furthermore, the large particle format provides an extremely rugged
HPLC column. Available in 17 dimensions from 2 cm x 2.1 mm I.D. to
25 cm x 4.6 mm I.D. and two introductory phases, C18 and F5, the
conversion of current methods is seamless.
0.5 μm
1.7 μm2.7 μm Solid Core
0.6 μm
3.3 μm~5 μm Solid Core
Experimental Conditions
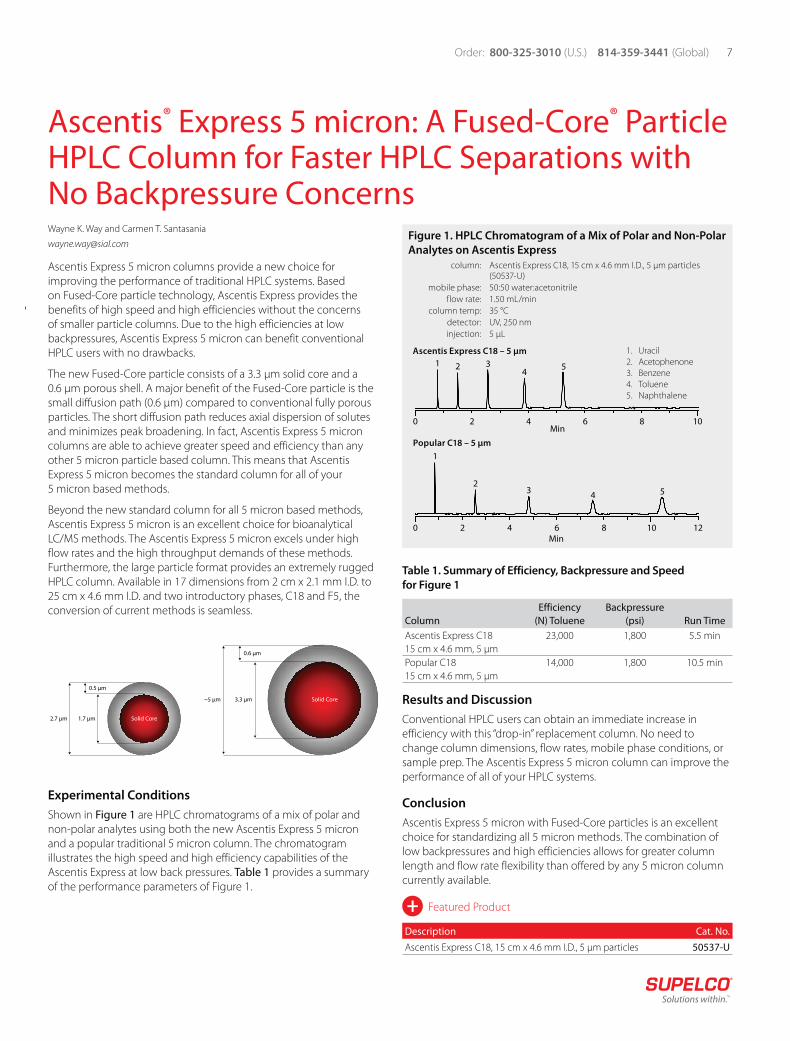
Shown in Figure 1 are HPLC chromatograms of a mix of polar and
non-polar analytes using both the new Ascentis Express 5 micron
and a popular traditional 5 micron column. The chromatogram
illustrates the high speed and high efficiency capabilities of the
Ascentis Express at low back pressures. Table 1 provides a summary
of the performance parameters of Figure 1.
Table 1. Summary of Efficiency, Backpressure and Speed
for Figure 1
Column
Efficiency
(N) Toluene
Backpressure
(psi) Run Time
Ascentis Express C18
15 cm x 4.6 mm, 5 μm
23,000 1,800 5.5 min
Popular C18
15 cm x 4.6 mm, 5 μm
14,000 1,800 10.5 min
Results and Discussion
Conventional HPLC users can obtain an immediate increase in
efficiency with this “drop-in” replacement column. No need to
change column dimensions, flow rates, mobile phase conditions, or
sample prep. The Ascentis Express 5 micron column can improve the
performance of all of your HPLC systems.
Conclusion
Ascentis Express 5 micron with Fused-Core particles is an excellent
choice for standardizing all 5 micron methods. The combination of
low backpressures and high efficiencies allows for greater column
length and flow rate flexibility than offered by any 5 micron column
currently available.
Figure 1. HPLC Chromatogram of a Mix of Polar and Non-Polar
Analytes on Ascentis Express
column: Ascentis Express C18, 15 cm x 4.6 mm I.D., 5 μm particles (50537-U)
mobile phase: 50:50 water:acetonitrile
flow rate: 1.50 mL/min
column temp: 35 °C
detector: UV, 250 nm
injection: 5 μL
1. Uracil
2. Acetophenone
3. Benzene
4. Toluene
5. Naphthalene
0 2 4 6 8 10Min
1 2 34
5
1
23
4 5
0 2 4 6 8 10 12Min
Ascentis Express C18 – 5 μm
Popular C18 – 5 μm
Featured Product
Description Cat. No.
Ascentis Express C18, 15 cm x 4.6 mm I.D., 5 μm particles 50537-U

sigma-aldrich.com/analytical
Reporter 30.3 |8 Clinical and Forensic
Topics in LC-MS, Part 2 (Part 1 in Reporter 30.2. Can be accessed at sigma-aldrich.com/thereporter)
Impact of Mobile Phase Additives on LC-MS Sensitivity, Demonstrated using Spice Cannabinoids as Test CompoundsXiaoning Lu, Craig Aurand, and David S. Bell
The article stresses the importance of using the highest quality solvents
and reagents, along with high efficiency HPLC columns and effective
sample prep methods, to provide the best MS data.
Introduction
Part 1 of our Topics in LC-MS published in Reporter 30.2 looked
at leveraging column selectivity in developing robust LC-MS
methods.1 Here, Part 2 examines the important role of mobile phase
components, specifically the ionic modifiers. In this article, the LC-MS/
MS optimization for analysis of spice cannabinoids is demonstrated
using a range of mobile phase additives for increased analyte response
and selectivity. A four-pronged approach leveraging HPLC column
selectivity, solvent purity, effective sample prep, and reference
standards, was used to develop a method to rapidly isolate and
identify spice cannabinoids from plasma.
Background
Optimized mobile phases for LC-UV methods are not necessarily
transferable to methods employing MS detection. Usually when
developing LC-UV methods the main consideration is achieving
adequate retention and resolution of the analytes while maintaining
low UV background. However, for LC methods using electrospray
ionization (ESI) detection, one not only has to consider retention
and resolution, but also how the mobile phase components impact
ionization. LC-ESI mobile phase components also must be volatile, so
they are efficiently vaporized in the ESI source of the MS inlet, and free
of impurities that can contribute to the background, reduce sensitivity
by forming adducts, or otherwise impact the sensitivity and overall
quality of the MS experiment. Typical mobile phase modifiers used in
LC-MS include ammonium formate and ammonium acetate buffers
and formic, acetic, and trifluoroacetic acids.
Spice Cannabinoids: Current Analytical Interest
Synthetic cannabinoids (Spice, Figure 1) are a relatively new type
of designer drug used as a pseudo-legal means to get a cannabis-
type high.2 In early 2011, the US Drug Enforcement Agency (DEA)
placed several of the most popular synthetic cannabinoids such as
JWH-018 and JWH-073 on their Schedule 1 list, making the
possession or consumption of these compounds illegal. However,
new synthetic cannabinoids are continually being introduced as
suppliers tweak the molecular structures.
The ability to rapidly and reliably identify the continually changing
population of these compounds in the blood or urine of suspected
users is a significant analytical challenge facing forensic chemists.
Study of the Mobile Phase Ionic Modifier on MS Signal
Method development employed screening the various
Ascentis® Express phases. The Ascentis Express F5 gave the best
resolution of the five spice cannabinoids under isocratic conditions.
It was, therefore, used for the experiments to determine which
mobile phase modifiers enabled the highest ESI-MS response
for the five spice cannabinoids. Mobile phases comprising 5 mM
ammonium acetate, 5 mM ammonium formate, 0.05% acetic acid,
or 0.05% formic acid in 50:50 water:acetonitrile were evaluated for
chromatographic resolution along with ESI-MS response.
Impact of Solvents and Additives on Resolution and
Relative Response
Figure 2 shows the resulting chromatograms of the additive study.
Resolution of the five compounds was obtained under each of the
four conditions tested. Elution orders were comparable except for
one compound, JWH-200, which had longer retention under the
acidic conditions. (This is possibly due to the known ion exchange
character of the F5 and the basic nature of the morpholine functional
group of JWH-200. Further experiments are required to fully elucidate
the retention mechanism.)
Figure 1. Representative Spice Compounds
JWH-073 metabolite JWH-250
JWH-200 JWH-073 JWH-018
O
N
CH3
OH
OCH3
N
CH3
O
N
N
O
O
O
N
CH3
O
N
CH3

9Order: 800-325-3010 (U.S.) 814-359-3441 (Global)
Regarding analyte response, the formate systems gave higher analyte
response than the acetate systems, with the ammonium formate
conditions giving the overall best results when retention of JWH-200
is taken into account (Table 1). Although coelution was not a problem
in this example, for LC-MS separations it is generally advisable to select
a method based on analyte response rather than chromatographic
resolution when analytes are readily discriminated by specific MS/MS
transitions, as is the case with these spice compounds.
Table 1. Relative Response (Peak Height) in ESI(+) Mode of the
Spice Compounds under Different Mobile Phase Conditions
5 mM
Ammonium
Formate
5 mM
Ammonium
Acetate
0.05%
Formic
Acid
0.05%
Acetic
Acid
1. JWH-073
metabolite
1 0.28 0.97 0.81
2. JWH-200 1 0.27 0.23 (no elution)
3. JWH-250 1 0.61 1.20 1.02
4. JWH-073 1 0.35 1.08 0.90
5. JWH-018 1 0.38 1.21 0.99
Adduct Formation and Solvent Purity
Adduct formation is also an important consideration when
optimizing LC-MS methods for sensitivity. Adduct formation of
the target analyte, primarily with sodium and potassium in ESI(+),
can sacrifice the formation of target protonated analyte ions, thus
decreasing the overall sensitivity of the method and complicating
the spectrum. Previous studies have discussed the adduct formation
phenomenon in detail, stressing the importance of using solvents
and eluent additives that are free of unwanted ions, a quality
hallmark of the LC-MS CHROMASOLV® line for mass spectrometry
from Fluka.3 This study employed solvents from the newest member
of the CHROMASOLV line, LC-MS Ultra CHROMASOLV, which is
intended for UHPLC and UHPLC-MS analysis because the solvents
are additionally free of particulates.
Analysis of Spice Compounds in Plasma Samples
The optimized MS method on standards was then used on a spiked
plasma sample. Endogenous proteins and phospholipids were first
removed using HybridSPE®-Phospholipid. (Details of the sample
preparation method and mechanism of the HybridSPE-Phospholipid
can be found in reference 4.) Figure 3 shows the resulting LC-MS/
MS chromatogram of the five spice compounds extracted from
plasma and resolved on the Ascentis® Express F5 column.
Summary
Special consideration of mobile phase components must be made
when optimizing methods for LC-MS applications. Using the socially
problematic spice cannabinoids as the test case, the study reported
here demonstrates the impact of various mobile phase modifiers on
the separation, with the formate modifiers outperforming acetate in
terms of MS signals (or sensitivity) and chromatographic resolution.
This study is prime example of the benefit of using high-purity
CHROMASOLV solvents with the HybridSPE-Phospholipid plates
for effective sample cleanup, Ascentis Express UHPLC columns
for rapid, efficient separations, and Cerilliant standards for reliable
characterization and quantification of analytes in biological matrices.
Figure 2. LC-MS/MS Resolution and Response of Spice
Cannabinoids with Various Ionic Mobile Phase Additives
column: Ascentis® Express F5, 5 cm x 2.1 mm, 2.7 μm (53567-U)
mobile phase: (50:50) acetonitrile:water containing various ionic additives as shown in figure
flow rate: 0.3 mL/min
temp.: 35 °C
pressure (column): 1296 psi (89.4 bar)
detector: MS, ESI(+), MRM, m/z 344/155 (JWH-073 metabolite), 385/155 (JWH-200), 336/121 (JWH-250), 328/155 (JWH-073), and 342/155 (JWH-018)
injection: 2 μL
sample: 5 ng/mL each compound in 50/50 water:methanol
system: Agilent 1100 HPLC, 3200 QTrap (AB/Sciex)
1. JWH-073 metabolite
2. JWH-200
3. JWH-250
4. JWH-073
5. JWH-018
Min
A. 5 mM ammonium acetate
(A) 10 mM ammonium acetate in water, pH 6.8
(unadjusted); (B) acetonitrile; (50:50; A:B)
B. 5 mM ammonium formate
(A) 10 mM ammonium formate in water, pH 6.8
(unadjusted); (B) acetonitrile; (50:50; A:B)
C. 0.05% formic acid
(A) 0.1% formic acid in water, pH 2.7 (unadjusted);
(B) acetonitrile; (50:50; A:B)
D. 0.05% acetic acid
(A) 0.1% acetic acid in water, pH 3.3 (unadjusted);
(B) acetonitrile; (50:50; A:B)
1 23
4 5
20 4 6
0
12
3 45
2 4 6
1
0 2 4 6
2
3
4 5
1
3
4 5
2
20 4 6

sigma-aldrich.com/analytical
Reporter 30.3 |10 Clinical and Forensic
References
1. Brandes, Hillel. Topics in LC-MS, Part 1. Leveraging Column Selectivity. Supelco
Reporter, 2012, 30.2, 13-15.
2. DrugFacts: Spice (Synthetic Marijuana). http://www.drugabuse.gov/publications/
drugfacts/spice-synthetic-marijuana (accessed June 11, 2012).
3. Köhling, Rudolf. Selective adduct formation in electrospray ionisation with alkali
citrates. Analytix (Fluka), 2008, 4, 4-5.
4. Aurand, Craig. Understanding, Visualizing, and Reducing the Impact of
Phospholipid-Induced Ion Suppression in LC-MS. Supelco Reporter, 2012, 30.2,
10-12.
Featured Products
Description Cat. No.
Ascentis Express F5, 5 cm x 2.1 mm, 2.7 μm particles 53567-U
HybridSPE®-Phospholipid, 96-well Plate, bed wt. 50 mg,
volume 2 mL
575656-U
Acetonitrile, LC-MS Ultra CHROMASOLV®, tested for
UHPLC-MS
14261
Water, LC-MS Ultra CHROMASOLV, tested for UHPLC-MS 14263
Ammonium acetate, eluent additive for LC-MS 73594
Ammonium formate, eluent additive for LC-MS 55674
Formic acid, eluent additive for LC-MS 56302
Acetic acid, eluent additive for LC-MS 49199
Cerilliant Certified Reference Standards *
JWH-018, 100 μg/mL (Cerilliant) S-025
JWH-073, 100 μg/mL (Cerilliant) S-027
JWH-073 3-Hydroxybutyl metabolite, 100 μg/mL (Cerilliant) S-037
Spice Cannabinoid Mix, 100 μg/mL of each:
JWH-250, JWH-200, (±)-CP 47, 497, (±)-CP 47, 497 C8
Homologue, HU-211 (Cerilliant)
S-038
*To order Cerilliant analytical standards, visit cerilliant.com
Our complete offering of solvents, reagents, and other consumables
to maximize speed and sensitivity in bioanalysis can be found at
sigma-aldrich.com/bioanalysis.
Fig 3. LC-MS/MS Analysis of Spice Compounds from Plasma
on Ascentis® Express F5 after SPE using HybridSPE-
Phospholipid
Conditions same as Figure 2, Panel B except as follows:
sample/matrix: rabbit plasma, unfiltered K2-EDTA, spiked with spice cannabinoids (5 ng/mL each)
SPE: HybridSPE-Phospholipid, 96-well plate (575656-U)
sample addition: to each well add 100 μL plasma, followed by a 300 μL of 1% formic acid in acetonitrile, agitate on orbital shaker for two minutes
elution: attach collection plate and apply vacuum at 10” Hg for four minutes
Min0
2
3
4
5
1
2 4 6
1. JWH-073 metabolite
2. JWH-200
3. JWH-250
4. JWH-073
5. JWH-018
Quality exceeding your expectations
LC-MS Ultra Solvents and Additives Designed for UHPLC
For more information, request the LC-MS Ultra CHROMASOLV Solvents
and Additives Brochure (OUX) or visit
sigma-aldrich.com/uhplc
11Order: 800-325-3010 (U.S.) 814-359-3441 (Global)
Isolation and LC-MS Characterization of Illicit Bath Salts in UrineCraig Aurand
Introduction
With the rapid development of unregulated designer and synthetic
compounds, the field of illicit drug testing has recently been
met with a changing environment. Of most concern has been
the development of a class of phenethylamine and cathinone
compounds being marketed as “bath salts,” “transposed consumption,”
“jewelry cleaner,” or “plant food”. Though sold as “not for human
consumption,” these compounds are reported to generate
stimulating effects similar to that of methamphetamine, heroin,
and 3,4-methylenedioxymethamphetamine (MDMA also known as
ecstasy).1,2 For a period of time, these compounds could be acquired
legally through the internet and head shops due to a lack of direct
legal control. In the US, both state and local governments have
instituted bans on the sale of these bath salt compounds.2 Forensic
testing facilities often experience difficulty in testing these compounds
due to the fact that they are not detected under normal ELISA testing
methods; additional more specific LC-MS methods are necessary. The
challenge for LC-MS detection of these particular bath salts resides
in three sets of isobaric compounds, which require chromatographic
resolution for positive confirmation and quantitation. For example, in
Figure 1, both butylone and ethylone have the same monoisotopic
mass, making these compounds indistinguishable, even when using
time of flight mass spectrometry (TOF-MS).
Figure 1. Structure of the Bath Salt Analytes
Butylone
O
O
O
CH3
NHCH3
Methylone
O
O
O
CH3
NH CH3
Ethylone
O
O
O
NH
CH3
CH3
O
CH3
NH
CH3
CH3
Mephedrone
O
CH3
NHCH3
OCH3
Methedrone
O
O
O
N
CH3
3,4-Methylenedioxypyrovalerone
(MDP V)
O
NHCH3
CH3F
O
NHCH3
CH3
F
4-Fluoromethcathinone 3-Fluoromethcathinone
O
NHCH3
CH3
Buphedrone
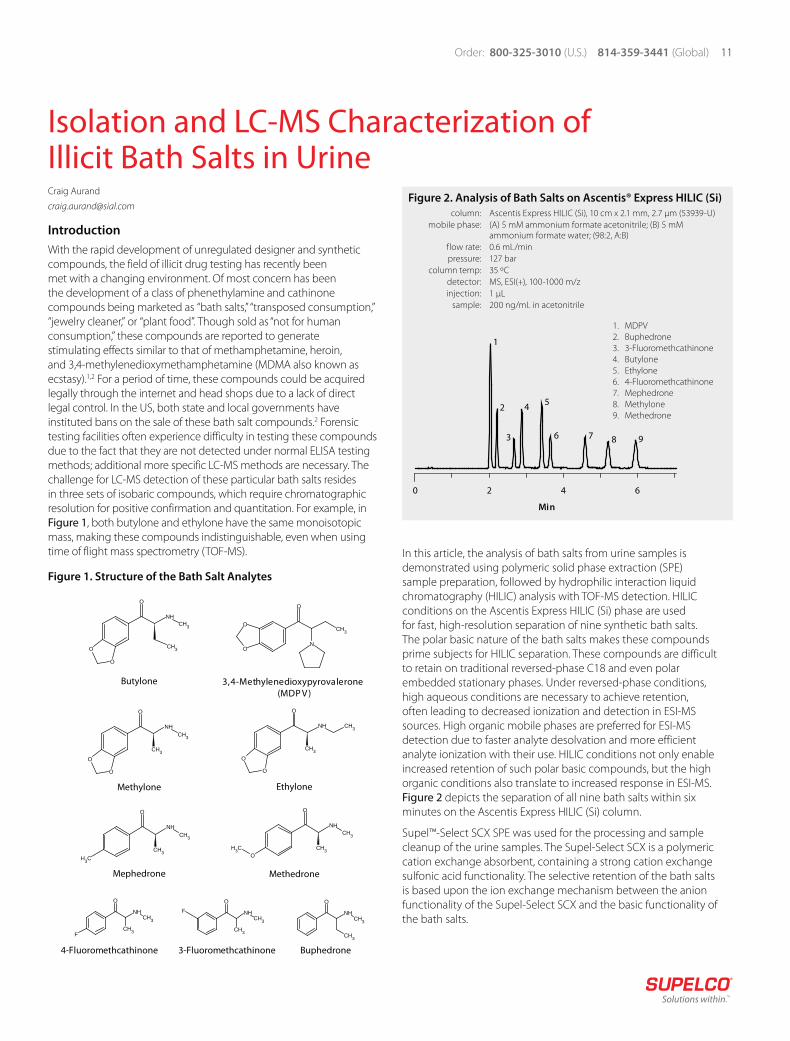
Figure 2. Analysis of Bath Salts on Ascentis® Express HILIC (Si)
column: Ascentis Express HILIC (Si), 10 cm x 2.1 mm, 2.7 μm (53939-U)
mobile phase: (A) 5 mM ammonium formate acetonitrile; (B) 5 mM ammonium formate water; (98:2, A:B)
flow rate: 0.6 mL/min
pressure: 127 bar
column temp: 35 ºC
detector: MS, ESI(+), 100-1000 m/z
injection: 1 μL
sample: 200 ng/mL in acetonitrile
Min
0 2 4 6
1
2
3
45
6 7 8 9
1. MDPV
2. Buphedrone
3. 3-Fluoromethcathinone
4. Butylone
5. Ethylone
6. 4-Fluoromethcathinone
7. Mephedrone
8. Methylone
9. Methedrone
In this article, the analysis of bath salts from urine samples is
demonstrated using polymeric solid phase extraction (SPE)
sample preparation, followed by hydrophilic interaction liquid
chromatography (HILIC) analysis with TOF-MS detection. HILIC
conditions on the Ascentis Express HILIC (Si) phase are used
for fast, high-resolution separation of nine synthetic bath salts.
The polar basic nature of the bath salts makes these compounds
prime subjects for HILIC separation. These compounds are difficult
to retain on traditional reversed-phase C18 and even polar
embedded stationary phases. Under reversed-phase conditions,
high aqueous conditions are necessary to achieve retention,
often leading to decreased ionization and detection in ESI-MS
sources. High organic mobile phases are preferred for ESI-MS
detection due to faster analyte desolvation and more efficient
analyte ionization with their use. HILIC conditions not only enable
increased retention of such polar basic compounds, but the high
organic conditions also translate to increased response in ESI-MS.
Figure 2 depicts the separation of all nine bath salts within six
minutes on the Ascentis Express HILIC (Si) column.
Supel™-Select SCX SPE was used for the processing and sample
cleanup of the urine samples. The Supel-Select SCX is a polymeric
cation exchange absorbent, containing a strong cation exchange
sulfonic acid functionality. The selective retention of the bath salts
is based upon the ion exchange mechanism between the anion
functionality of the Supel-Select SCX and the basic functionality of
the bath salts.

Reporter 30.3 |12
The strong ionic interaction with the analytes enables high organic
wash solvents to be used for displacement of endogenous matrix,
while maintaining retention of the analytes. Elution of the bath salts is
achieved with the addition of a basic organic solvent. Only with these
basic conditions are the bath salts eluted from the Supel™-Select SCX
material. This approach results in a highly clean sample.
Experimental
Urine samples were collected from a volunteer donor and verified
not to contain illicit bath salts. Control water samples, along with
urine samples, were spiked to a level of 100 ng/mL with each target
analyte making up the bath salt mixture. To ensure full ionization of
the analytes, spiked samples were treated with formic acid to a final
concentration of 0.1% formic acid. For comparison purposes, two
separate sample prep techniques were performed prior to LC-MS
analysis: SPE using the Supel-Select SCX and a “dilute and shoot”
technique. The Supel-Select SCX SPE method is detailed in Table 1.
For the dilute and shoot sample, 500 μL of spiked urine was mixed
with 500 μL of acetonitrile and analyzed directly by LC-MS.
Results and Discussion
Table 2 demonstrates the recovery of all nine bath salts for the
control samples and spiked urine sample. Using the external
calibration method, recoveries greater than 65% were observed
for all analytes except MDPV (43.7%). Figure 3 illustrates the
detection of bath salts in the spiked urine sample after SPE sample
cleanup. Notice there are no interfering peaks in the chromatogram,
demonstrating the effectiveness of the SPE sample cleanup.
As a reference, Figure 3 also depicts the monitored bath salt ions
for the blank urine sample. Again, there are no interfering peaks
that could cause irregularities in analyte detection.
Table 1. Sample Preparation Conditions for
Supel-Select SCX Tube
Vacuum manifold was used to pull solvent through cartridge at a rate of 1 drop per 3 seconds.
condition: 1 mL 1% formic acid acetonitrile 1 mL water
load: 1 mL spiked water blank or urine
wash: 1 mL water 1 mL 1% formic acid acetonitrile 1 mL water
elute: 2 mL 10% ammonium hydroxide in acetonitrile
Cartridge eluent was thoroughly mixed via vortex agitation, and a 1 mL aliquot of eluent was evaporated and reconstituted into 0.5 mL of acetonitrile.
Table 2. Analyte Recovery of Nine Bath Salts for the Supel-Select
SCX Processed Samples and Spiked Urine Sample
Sample (100 ng/mL standard)
Supel-Select SCX Calculated
Concentration (ng/mL)
Spiked Urine Calculated
Concentration (ng/mL)
MDVP 79.3 43.7
Buphedrone 90.6 77.4
3-Fluoromethcathinone 76.2 67.4
Butylone 89.5 80.8
Ethylone 88.5 76.6
4-Fluoromethcathinone 83.1 69.1
Mephedrone 86.1 78.2
Methylone 89.1 77.9
Methedrone 89.9 80.3
Figure 3. Spiked Urine Sample After SPE Cleanup, Urine
Blank After SPE Cleanup and Dilute and Shoot Spiked
Urine (Monitored Ions)
sample/matrix: 1 mL urine spiked to 100 ng/mL of bath salt mixture
SPE tube: Supel-Select SCX, 30 mg/1 mL (54240-U)
conditioning: 1 mL 1% formic acid acetonitrile, then 1 mL water
sample addition: 1 mL spiked urine
washing: 1 mL water, 1 mL 1% formic acid in acetonitrile, 1 mL water
elution: 2 mL 10% ammonium hydroxide in acetonitrile
eluate post-treatment: thoroughly mix via vortex agitation, evaporate 1 mL aliquot to dryness, reconstitute in 100 μL water:methanol, 1:1
column: Ascentis® Express HILIC (Si), 10 cm x 2.1 mm, 2.7 μm (53939-U)
mobile phase: (A) 5 mM ammonium formate acetonitrile; (B) 5 mM ammonium formate water; (98:2, A:B)
flow rate: 0.6 mL/min
pressure: 127 bar
column temp: 35 ºC
detector: MS, ESI(+), 100-1000 m/z
injection: 1 μL
sample: 200 ng/mL in acetonitrile
Min
1
2
3
4 5
6
78 9
0 2 4 6
Urine Blank After SPE Cleanup
Monitored Ions
Diluted Spiked Urine (no SPE cleanup)
Monitored Ions
Spiked Urine Sample After SPE Cleanup
Monitored Ions
1. MDPV2. Buphedrone3. 3-Fluoromethcathinone4. Butylone5. Ethylone6. 4-Fluoromethcathinone7. Mephedrone8. Methylone9. Methedrone
Clinical and Forensic
sigma-aldrich.com/analytical

13Order: 800-325-3010 (U.S.) 814-359-3441 (Global)
Common practice for preparation of urine samples is just dilution
with mobile phase prior to analysis. For comparison, an acetonitrile-
diluted urine sample was analyzed directly to show the difference
in analyte detection. Figure 3 illustrates the monitored bath salt
ions for the “dilute and shoot” urine sample. The anticipated peak
response for the dilution sample prep technique should be half that
of the SPE method, but notice in the chromatogram there are no
distinguishable peaks in this sample. Not only is there a significant
amount of matrix interference, but also the high aqueous content
of the mobile phase has diminished the HILIC separation. Solvent
mismatch between the chromatographic system and the injected
sample should always be considered, regardless of HILIC or reversed-
phase chromatographic modes of separation. Sample preparation
using the Supel™-Select SCX not only allows for effective removal of
interfering sample matrix, it also allows for easy analyte exchange
into an organic solvent.
Conclusion
The combination of the ion-exchange SPE with the HILIC separation
provides a novel approach for the testing of problematic bath salt
compounds. The isocratic Ascentis Express HILIC (Si) separation
produces fast resolution of the isobaric compounds, thus, enabling
the accurate quantitation of all nine bath salts. The Supel-Select SCX
sample preparation method allows for efficient urine matrix removal
while maintaining high analyte recovery. By utilizing ion-exchange
mechanisms for sample cleanup, and taking advantage of the unique
selectivity of chromatographic modes such as HILIC, analytical
chemists can greatly improve the selectivity and sensitivity of their
difficult bioanalytical applications.
References
1. Coppola, M.; Mondola, R. Synthetic cathinones: chemistry, pharmacology, and
toxicology of a new class of designer drugs of abuse marketed as “bath salts” or
“plant food.” Toxicology Letters 2012, 211, 144-149.
2. Federal Register Microgram Bulletin; U.S. Department of Justice Drug Enforcement
Administration, Office of Forensic Sciences: Washington, DC, 2011; Vol. 44,
Number 11.
Featured Products
Description Cat. No.
Supel-Select SCX Product
SPE Tube, 30 mg/1 mL, pack of 100 54240-U
Ascentis® Express HPLC Column, 2.7 μm particles
HILIC (Si), 10 cm x 2.1 mm 53939-U
Cerilliant® Certified Reference Standards
MDPV, 1 mg/mL, 1 mL/ampule M-146
Butylone, 1 mg/mL, 1 mL/ampule B-045
Ethylone, 1 mg/mL, 1 mL/ampule E-071
Mephedrone, 1 mg/mL, 1 mL/ampule M-138
Methylone, 1 mg/mL, 1 mL/ampule M-140
Methedrone, 1 mg/mL, 1 mL/ampule M-147
Buphedrone, 1 mg/mL, 1 mL/ampule B-047
3-Fluoromethcathinone, 1 mg/mL, 1 mL/ampule F-016
4-Fluoromethcathinone, 1 mg/mL, 1 mL/ampule F-015
Related Products
Description Cat. No.
Analytical Reagents and Solvents
Formic acid 56302
Ammonium formate, ≥ 99.0% 70221
Ammonium hydroxide solution, TraceSELECT®, ≥ 25% in H2O 09857
Acetonitrile, LC-MS Ultra CHROMASOLV® 14261
Water, LC-MS Ultra CHROMASOLV 14263
Visiprep™ DL Solid Phase Extraction Manifold
12-port Model 57044
24-port Model 57265
Disposable valve liners, PTFE, pack of 100 57059
Vial Kit Low Adsorption (LA), 2 mL
Clear glass, natural PTFE/silicone septa, 9 mm 29651-U
Clear glass, natural PTFE/silicone septa (with slit), 9 mm 29652-U
Amber glass, natural PTFE/silicone septa, 9 mm 29653-U
Amber glass, natural PTFE/silicone septa (with slit), 9 mm 29654-U
Related Information
To learn more about Supel-Select, visit
sigma-aldrich.com/supel-select
To learn more about Ascentis Express HPLC columns, visit
sigma-aldrich.com/express
To learn more about Cerilliant analytical standards, visit
cerilliant.com
To learn more about analytical reagents and solvents, visit
sigma-aldrich.com/analytical_reagents
Did you know . . .
Are your hydrophilic analytes giving you poor retention in reversed-
phase? Let the new Ascentis Express HILIC Guide direct you to
the right HILIC phase for your application and aid in your method
development. Go to sigma-aldrich.com/express and click on
“technical resources” for your free copy.

sigma-aldrich.com/analytical
Reporter 30.3 |14 Clinical and Forensic
The Potential of SPE for Fractionation of Serum Metabolome into Phospholipids and Other Metabolites
Introduction
The high concentration of phospholipids (PLs) in blood serum
is a frequent limitation in metabolomic analysis based on mass
spectrometric detection, mainly owing to their ionization suppression
effects. Thus, PLs mask the detection of less-abundant metabolites
that may be potential biomarkers in clinical applications. This justifies
a fractionation step for their removal when dealing with analysis of
less-abundant metabolites. On the other hand, metabolism of PLs has
been closely associated with different pathologies, such as obesity,
cancer disorders, atherosclerosis, diabetic nephropathy, kidney failure,
arterial hypertension, neurodegenerative and neurological disorders
such as Alzheimer’s and Niemann-Pick’s diseases, metachromatic
leukodystrophy, as well as multiple sclerosis, among others.1 For this
reason, the determination of PLs is of enormous clinical interest.
PL Enrichment vs. Interference Removal
Two important points can be derived from the above discussion:
First, when PLs are the target analytes, it is necessary to isolate
them from other sample components, such as proteins, sugars,
and other small molecules, that interfere with the chromatography
of the PLs. Second, removal of PLs is necessary with MS detection
when they are not the target analytes.
Among the techniques that are used in the clinical field for analyte
enrichment or interference removal, solid-phase extraction (SPE)
is arguably the most popular. This is due to the high efficiency,
easy handling, affordable price, and wide variety of commercially
available sorbents with very different selectivities and particle
compositions from which the analyst can choose. Versatility is
also an important characteristic. One such sorbent that meets
these criteria is HybridSPE®-Phospholipid.
The purpose of this study was to investigate the potential of
HybridSPE-Phospholipid for the selective isolation and characterization
of two serum fractions: one that contains all of the PLs in the sample
(an enrichment application), and one where the PLs are removed to
enable determination of other, non-PL, metabolites (an interference
removal application).
Experimental
An Agilent 1200 Series LC system on-line coupled to an Agilent 6540
UHD QqTOF hybrid accurate mass spectrometer equipped with an
electrospray ionization (ESI) source was the platform for this analysis.
MassHunter Workstation software (Agilent) was used to process raw
MS data, including feature extraction, molecular formula generation,
and database searching.
HybridSPE-Phospholipid Method
Both cartridge and plate formats of the HybridSPE-Phospholipid
possess a top frit that acts as a filter for the physical retention of
precipitated proteins while allowing metabolites to pass through.
The top frit also impedes flow of the sample before vacuum
application. The bed comprises zirconia-coated silica particles
that selectively retain the PLs. The cartridge format was used
in this study with the following protocol:
1. Load 300 μL of serum and 700 μL of 1% (v/v) formic acid in
acetonitrile to the top of the HybridSPE-Phospholipid cartridge
(Supelco Cat. No. 55269-U). The acetonitrile acidified with 1%
formic acid added to the serum not only acts as a precipitation
agent, but also as a modifier to inhibit the interaction of most
acidic compounds with Zr sites on the particles.
2. Vortex cartridge 30 seconds, rest cartridge for 2 minutes.
3. Apply vacuum, collect fraction FA1 (non-retained, flow-through).
4. Add 1 mL of 1% (v/v) formic acid in acetonitrile to the cartridge,
apply vacuum, collect fraction FA2.
5. Add 1 mL pure acetonitrile to the cartridge, apply vacuum,
collect fraction FA3.
6. Add 1 mL of PL elution solvent (methanol, ethanol, or acetonitrile)
containing 5% (v/v) ammonium hydroxide to the cartridge, apply
vacuum, collect PL fraction.
LC-QqTOF MS/MS Analysis of Serum Fractions
All chromatographic parameters are described in Figure 1. A 20 μL
aliquot of the prepared sample was injected into the LC and separated
on a reversed-phase (C18) column. Two different chromatographic
gradient profiles were programmed for independent analysis of
the individual (FA1, FA2, and FA3), combined (FA), and PL fractions.
Accurate mass spectra were acquired in the m/z range 100-1100,
typical for metabolomics experiments, at 3.5 spectra/sec. Analyses
were carried out both in positive and negative ionization modes
with the appropriate continuous internal calibration. Collision energy
was varied from 15 to 30 eV to obtain different MS/MS profiles which
should support PL identification.
Contributed Article
The following was generated with the assistance of an outside source using
Sigma-Aldrich® products. Technical content was generated and provided by:
C. Ferreiro-Vera, F. Priego-Capote, M. D. Luque de Castro
Department of Analytical Chemistry, Annex C-3, Campus of Rabanales,
University of Córdoba, E-14071, Córdoba, Spain, and Institute of Biomedical
Research Maimónides (IMIBIC), Reina Sofía Hospital, University of Córdoba,
E-14071, Córdoba, Spain
Tracy Ascah

15Order: 800-325-3010 (U.S.) 814-359-3441 (Global)
Results and Discussion
The strategy selected for this fractionation approach was based on the
selective retention capability of PLs on the zirconia-coated silica particles
that comprise HybridSPE-Phospholipid, and absence of retention by
those particles of the wide range of basic, neutral, and acidic compounds
(e.g., metabolites) in serum. The packed-bed filter/frit assembly acts as
an effective filter to facilitate the simultaneous removal of both PLs and
precipitated proteins during the extraction process.
The flow-through portion, FA1, together with the two rinsing
solutions, FA2 and FA3, showed total absence of PLs indicating the
HybridSPE-Phospholipid sorbent was very effective at removing PL
interferences. Additionally, both negative and positive ionization
modes showed fractions FA2 and FA3 to be essentially devoid of
molecular entities of any type. This demonstrated an important
feature of the HybridSPE-Phospholipid sorbent: It does not deplete
the sample of compounds other than phospholipids. A caveat,
however, the acetonitrile crash solvent must be acidified with 1%
(v/v) formic acid to inhibit the interaction of most acidic compounds
with Zr sites on the particles.
Elution of PLs from the cartridge was assayed by methanol, ethanol,
or acetonitrile [in all cases the eluent contained 5% (v/v) ammonium
hydroxide as modifier]. Figure 2A shows the Venn diagram of
the molecular entities detected in the eluates using the negative
ionization mode, in which the better performance of methanol as
eluent is clear.
The effective fractionation of PLs and non-PLs metabolites in serum
is shown by the Venn diagram in Figure 2B. The two fractions
had no molecular entities in common. This behavior is corroborated
in Figure 1, which corresponds to the ion chromatograms
extracted from LC-TOF/MS monitoring of lysophosphatidylcholine
(LPC) 18:0 (m/z 568.3619) and arachidonic acid (m/z 320.2351)
in the FA and methanol-eluted fractions in negative ionization
mode. The target PL was not detected in the FA, thus supporting
the highly effective retention of PLs by the HybridSPE-Phospholipid
cartridge. On the other hand, other metabolites elute unretained
with the flow-through sample portion and rinsing solutions,
free from PLs.
107
Methanol FA
6280
Figure 2. Venn Diagrams with the Count of Molecular
Entities Detected
Figure 2A. After selective SPE of PLs and elution with 5% ammonium hydroxide in
methanol, ethanol, or acetonitrile, showing methanol most effective PL eluant
Figure 2B. FA (combined FA1-3) and methanol-eluant PL fractions showing no molecular
entities in common and underscores the selectivity of the method
Figure 1. Extracted Ion Chromatograms from LC–TOF/MS
monitoring of LPC 18:0 (m/z 568.3619) and Arachidonic acid
(m/z 320.2351) in FA and Methanol-Eluted Fractions (negative
ionization mode)
sample/matrix: human serum
SPE tube: HybridSPE®-Phospholipid cartridge
sample addition: 300 μL serum, 700 μL 1% (v/v) formic acid in acetonitrile
elution: FA1: flow-through from sample addition; FA2: 1 mL 1% (v/v) formic acid in acetonitrile; FA3: 1 mL acetonitrile; PL: 1 mL methanol, ethanol, or acetonitrile, each with 5% (v/v) ammonium hydroxide
column: C18, 10 cm x 4.6 mm I.D., 3 μm particles
mobile phase: (A) water; (B) acetonitrile, both containing 0.1% (v/v) formic acid
gradient (FA fractions): 4% B for 2 min, to 100% B in 18 min, held at 100% B for 5 min
gradient (PL fraction): 20% B for 2 min, to 100% B in 16 min, held at 100% B for 7 min
flow rate: 0.8 mL/min
column temp.: 25 ºC
injection: 20 μL
detector: MS
MS conditions: nozzle, capillary and focusing voltage set at ±2 kV, 3.5 kV and 175 V; fragmentor, skimmer and octapole voltages were fixed at 175, 65, and 750 V; nebulizer gas at 40 psi, drying gas flow rate and temperature were 10 L/min and 325 °C
15
Acetonitrile
17 entities
Ethanol
24 entities
Methanol
107 entities
22
2
0
107
0 0

sigma-aldrich.com/analytical
Reporter 30.3 |16 Clinical and Forensic
Conclusion
From these results, it can be concluded that this SPE protocol
using HybridSPE®-Phospholipid followed by LC-MS/MS is useful
for global metabolome analysis by fractionation, here into
non-PL and PL metabolites. Therefore, the multipurpose use
of HybridSPE-Phospholipid cartridges commonly used for
interference removal has been demonstrated.
Complete details on this research and the PLs detected and
confirmed by MS/MS, can be found in the reference.
Reference
1. Ferreiro-Vera, C.; Priego-Capote, F.; Luque de Castro, M. D. Comparison of sample
preparation approaches for phospholipids profiling in human serum by liquid
chromatography–tandem mass spectrometry. J. Chromatogr. A. 2012, 1240,
21-28.
Acknowledgments
The Spanish Ministerio de Ciencia e Innovación (MICINN), FEDER European
Program and Junta de Andalucía are thanked for financial support through projects
CTQ2009-07430 and FQM2010-6420. F.P.C. is also grateful to the MICINN for a
Ramón y Cajal contract (RYC-2009-03921).
Featured Products
Description Qty. Cat. No.
HybridSPE-PL 96-well Plate, 50 mg/well 1
20
575656-U
575657-U
HybridSPE-PL Cartridge, 30 mg/1 mL 100
200
55261-U
55276-U
HybridSPE-PL, Small Volume 96-well plate, 15 mg/well 1
20
52794-U
52798-U
HybridSPE-PL Cartridge, 500 mg/6 mL 30 55267-U
HybridSPE-PL Ultra Cartridge, 30 mg/1 mL 100 55269-U
HybridSPE-PL 96-well Plate Essentials Kit 1 52813-U
96-well plates were not used in this study.
15-40% Off Supelco® General Purpose Capillary GC ColumnsGas chromatography has many applications for which a general
purpose column would be suitable for the separation. Examples
include training/education, screening and simple applications.
Supelco offers a wide selection of general purpose GC columns
with a variety of phases to choose from. Every column is
individually tested to ensure reproducibility.
Through January 31, 2013, receive 15-40% off a wide selection of
general purpose capillary GC columns. Reference promo code
SEE when placing your order.
To view participating geographies/countries, applicable column
phases, and the discount level that is available, visit
sigma-aldrich.com/gc-offers

17Order: 800-325-3010 (U.S.) 814-359-3441 (Global)
Clinical Application of SPME: Analysis of VOCs in Exhaled Breath as Cancer Biomarkers
Introduction
Characteristic odors in breath have long been used as a tool for
medical diagnosis. Familiar examples are diabetes with the odor
of overripe apples, renal diseases with the fishy smell of amines
and ammonia, and dental or liver diseases with the cabbage-like
odor of organic sulfides1. Linus Pauling applied formal science to
the analysis by using gas chromatography (GC) to detect volatile
organic compounds (VOC) in breath.2 More recently, Michael Philips
and his Menssana coworkers focused on determination of breath
compounds that are attracting attention in clinical and toxicological
analysis3. Although breath analysis is of great importance in disease
detection, toxicology, and the study of metabolic processes, its use
by doctors and clinicians as a diagnostic tool is a lost art.
The classes of VOCs that can be present in exhaled breath include
hydrocarbons, alcohols, ketones, aldehydes, esters, and organic
sulfides4. The determination of VOCs in exhaled air requires the
detection of very low concentrations. Hence, the analytical methods
employed must include a preconcentration step. The common
preconcentration methodologies currently utilized for VOCs are
sorption onto an adsorbent and cold trapping.
However, solid phase microextraction (SPME) is a viable alternative
to these methods, as will be shown here. SPME has been widely
used for the determination of volatile organic compounds in
various matrices, including exhaled breath5. Compared to other
preconcentration techniques, SPME is simple, inexpensive, and
solvent-free. It is fully automatable, and no thermal desorption
unit or modifications to the GC instrument are necessary. Compatible
with all GC systems, SPME can be used by practically every laboratory.
The objective of this study was to use SPME with GC-MS analysis
to identify volatile biomarkers of lung cancer.
Experimental
Breath samples were collected from ten healthy volunteers and
twelve patients with lung cancer. Each participant provided via
questionnaire their age, sex, other diseases, medications, smoking
habits, and composition of recent meals. Breath samples were
collected in 1 L Tedlar® bags which were kept at a constant 25 °C.
A gas standard containing the compounds of interest was made
by vaporizing a liquid mixture of the compounds in a glass bulb.
A defined volume of the mixture was transferred into the Tedlar
bag prior to sampling. During extraction, the CAR/PDMS SPME
fiber was introduced into the bag containing breath sample or
gas standards through a septum and exposed for 15 minutes.
Ambient air samples were collected for background. External
calibration was employed. The fiber desorption and sample
analysis (GC-MS) conditions are shown in Figure 1.
Contributed Article
The following was generated with the assistance of an outside source using
Sigma-Aldrich® products. Technical content was generated and provided by:
Bogusław Buszewski, Tomasz Ligor, Joanna Rudnicka
Department of Environmental Chemistry and Bioanalytics, Faculty of Chemistry
Nicolaus Copernicus University, Gagarina 7 St., PL-87-100 Toruń, Poland
Figure 1. GC-MS Analysis of VOC in Breath from Lung Cancer
Patient after SPME Using CAR/PDMS Fibers
SPME Conditions
sample: exhaled breath, 1 L in Tedlar bag
fiber: Carboxen®/Polydimethylsiloxane (CAR/PDMS), 75 μm film (57318)
holder: manual SPME holder (57330-U)
extraction: 15 min at 25 oC
desorption: 1 min at 220 oC
GC-MS Conditions
inj. temp.: 200 oC
oven: 40 oC (2 min), 10 oC/min to 140 oC, 5 oC/min to 270 oC (3 min)
carrier gas: helium, 40 cm/sec, constant
injection: splitless 1 min, then split at 35:1
detector: MS, full scan, m/z 15-220, rate 3.46 scans/sec, EI ion source and transfer line temp: 220 oC
column conditions: GC PLOT column (Q-type), 25 m × 0.25 mm I.D., 3 μm
1. Ethanol
2. Acetonitrile
3. Acetone
4. 2-Propanol
5. Isoprene
6. Pentane
7. Methacrolein
8. Methyl vinyl ketone
9. Ethyl acetate
10. 2-Methylpentane
11. 3-Methylpentane
12. Hexane
13. Toluene
14. Hexanal
15. Limonene

sigma-aldrich.com/analytical
Reporter 30.3 |18 Clinical and Forensic
Results
The linearity, precision, and detection limits for VOCs determination
in human breath are presented in Table 1. The relative standard
deviation (RSD) was in the range of 3.4% to 9.4%. Linear regression
coefficient values (r2) were close to 1. The lowest LOD values
obtained for hydrocarbons varied from 0.3 to 0.49 ppb.
Figure 1 shows a typical GC-MS chromatogram of breath from a
lung cancer patient. Analysis of exhaled air from healthy volunteers
and cancer patients identified seventeen volatile compounds,
mainly hydrocarbons, ketones, aldehydes, and alcohols. Similar
compounds were found in both healthy and cancer patients, except
furan derivatives which are considered to be markers for tobacco
smoking. Statistical tests were applied to distinguish cancer patients
from the healthy control group. The VOC concentration data were
log-transformed and tested for normality using the Shapiro-Wilks
W test, (p<0.05). Full details of the statistical analysis is beyond the
scope of this brief report; however, they are available upon request.
Summarizing: Although there was variation between the patients
and not all patients exhibited the same biomarker pattern, four
compounds stood out statistically from the others: methyl vinyl
ketone, 1-propanol, 2-propanol, and o-xylene. These compounds
showed statistically higher levels in cancer patients compared to the
healthy control group.
Conclusion
This brief report is intended to demonstrate the potential of solid
phase microextraction (SPME) as a clinical research tool, in this
case toward the extraction from human breath of VOCs associated
with lung cancer. By using SPME with GC-MS analysis and applying
rigorous statistical methods, we found the VOC profiles between
a small set of healthy individuals and those diagnosed with lung
cancer were significantly different. These promising findings would
necessarily be followed up with studies on larger populations
for definitive associations. The SPME-GC-MS method presented
here had the requisite linearity and sensitivity, and could be easily
adopted by laboratories as an investigational tool into biomarker
discovery, among many other applications relevant to the clinical
and biochemical fields.
Acknowledgments
This research work was supported by Grant N N 204 026238 (2010-2013).
References
1. Risby T.H. Current status of clinical breath analysis. In Breath Analysis for Clinical
Diagnosis and Therapeutic Monitoring; Amann, A., Smith, D., Eds.; World Scientific:
Singapore, 2005.
2. Pauling, L.; Robinson, A.B.; Teranishi R.; Cary P. Quantitative analysis of urine
vapour and breath by gas-liquid partition chromatography. Proc. Nat. Acad.
Sci. 1971, 68(10), 2374-2376.
3. Phillips, M.; Gleeson, K.; Hughes, J.M.; Greenberg, J.; Cataneo, R.N.; Baker, L.,
McVay, W.P. Volatile organic compounds in breath as markers of lung cancer:
a cross-sectional study. Lancet, 1999, 353 (9168), 1930-1933.
4. Buszewski, B.; Kęsy, M.; Ligor, T.; Amann, A. Human exhaled air analytics:
biomarkers of diseases. Biomed. Chromatogr. 2007, 21, 553-566.
5. Grote C.; Pawliszyn J. Solid phase microextraction for the analysis of human
breath. Anal. Chem. 1997, 69, 587-596.
Featured Products
Description Cat. No.
SPME fiber assembly Carboxen®/Polydimethylsiloxane (CAR/PDMS),
needle size 24 ga, coating 75 μm, for use with manual holder
57318
SPME fiber holder for use with manual sampling 57330-U
Capillary GC Column
Supel™-Q PLOT, 30 m x 0.32 mm I.D. 24242
Standards
For a complete listing of our volatile organic standards, visit
sigma-aldrich.com/standards
96-well plates are also available, but were not used in this study.
Table 1. Validation Parameters for Volatile Organic
Compounds (VOCs)*
CompoundsLinear Range
(ppb) r2 %RSD
LOD
(ppb)
LOQ
(ppb)
Acetone 1.6 - 920.7 0.991 8.9 0.54 1.62
Acetonitrile 2.3 - 234.0 0.996 3.4 0.75 2.25
Ethyl acetate 1.3 - 136.7 0.995 4.6 0.43 1.29
Methyl vinyl ketone 9.9 - 135.6 0.997 8.4 3.30 9.90
3-Methylpentane 1.3- 136.5 0.997 3.3 0.45 1.35
Ethanol 1.0 - 99.8 0.992 4.5 0.33 1.00
2-Methylfuran 1.6 - 165.6 0.999 4.9 0.54 1.63
2-Methylpentane 0.9 - 87.8 0.992 4.5 0.32 0.96
Hexanal 9.9 - 133.9 0.996 6.2 3.30 9.90
Hexane 1.5 - 150.0 0.994 3.4 0.49 1.47
Isoprene 2.6 - 380.2 0.998 3.7 0.87 2.62
Pentane 1.5 - 150.0 0.998 5.2 0.49 1.47
Methacrolein 11.7 - 170.4 0.998 7.2 3.91 11.73
1-Propanol 1.6 - 163.5 0.995 5.1 0.53 1.59
2-Propanol 1.6 - 159.6 0.998 9.4 0.52 1.57
Toluene 1.1 - 114.7 0.991 5.9 0.41 1.11
o-Xylene 1.0 - 100.1 0.994 4.8 0.33 0.99
* Conditions same as Figure 1 except sample is a mixture of VOC standards. n=3.
Bolded compounds had statistical significance.

19Order: 800-325-3010 (U.S.) 814-359-3441 (Global)
Why Use Certified Vials?
Using the right vial is important in any analysis. We realize the
vials, caps, and septa we supply are critical to the success of our
customers. For this reason, we have taken steps to offer certified vials
which are manufactured of the highest quality. Our certified vials
have been tested to meet the high standards our customers require.
The vial, cap, and septa are batch tested to confirm that the quality of
each component will be the same, time after time. Our certified vials,
inserts and closures are designed, engineered, and manufactured for
optimal performance, in HPLC, GCMS, and LCMS.
The vial kits consist of 3 parts.
Vial – Only type 1 borosilicate glass is used to make the certified
products. Tight tolerances on all physical specifications are
controlled to make sure the highest quality is produced each time.
The critical specifications include height, diameter, neck thread
and bottom thickness.
Septa – Our septa are post-baked to provide the lowest levels of
extractables in the industry. The softness (durometer) is measured
for batch-to-batch reproducibility. All bonded septa are measured
to certify bond strength reliability.
Cap – The caps are made from the finest grade of plastic available.
The resin is tested for low levels of contamination. In addition,
fit and dimension of the caps are measured to specification.
Supelco’s certified vials have been selected to assure product
reliability time after time. Our certified vials work with autosamplers
from all major instrument manufacturers, and have the quality and
reproducibility to ensure a successful analysis.
Certified vials are offered in a variety of styles that include
9 mm thread, crimp top, and snap top vials.
For assistance in selecting the correct certified
vial for your autosampler, visit
sigma-aldrich.com/vials
Featured Products
Description Cat. No.
12 x 32 mm Certified Kits with 9 mm Thread, Blue Polypropylene Cap,
Pack of 100
2 mL clear glass, PTFE/silicone septa 29378-U
2 mL clear glass, PTFE/silicone septa with slit 29379-U
2 mL clear glass with graduated marking spot, PTFE/silicone 29381-U
2 mL clear glass with graduated marking spot, PTFE/silicone
with slit
29384-U
2 mL amber glass, PTFE/silicone septa 29385-U
2 mL amber glass with graduated marking spot, PTFE/silicone 29386-U
2 mL amber glass with graduated marking spot, PTFE/silicone
with slit
29387-U
12 x 32 mm Certified Kits with 10/425 Thread, Pack of 100
2 mL clear glass, PTFE/silicone septa, blue polypropylene cap,
screw thread vial
29432-U
2 mL clear glass, PTFE/silicone septa, clear polypropylene cap,
snap ring design
29421-U
12 x 32 mm Certified Vals with 11 mm Crimp Top, Pack of 100
2 mL clear glass 29403-U
2 mL clear glass with graduated marking spot 29404-U
2 mL amber glass 29407-U
2 mL amber glass with graduated marking spot 29408-U
Pittcon 2013The World’s Largest Annual Conference and Exposition
for Laboratory ScienceMarch 17-21 2013, Philadelphia, Pennsylvania
molecules, Pittcon is a must attend event for you. See all the innovations in instrumentation from
leading companies from around the world, learn about the latest techniques used in your industry,
select from over 2,000 technical sessions and over 100 short courses, and participate in networking
opportunities with world renowned scientists. Register by February 18, 2013 at www.pittcon.org
and save 50%! Visit the Sigma-Aldrich Booth #3749.

sigma-aldrich.com/analytical
Reporter 30.3 |20 Food and Beverage Analysis
Determination of Additives in Beverages Using Ascentis® Express ColumnsOlga Shimelis, Hugh Cramer, and Michael D. Buchanan
Introduction
Beverages, such as sodas and energy drinks, can include a number
of polar ingredients, which are easily soluble in the water matrix of
the drinks. These ingredients include sweeteners (sugars and sugar
substitutes), caffeine, vitamin supplements, amino acids, organic
acids, and plant extracts. Because the analytes are already in solution,
there is no need for extensive sample preparation. Dilution followed
by direct injection into an HPLC is typically suitable.
In this article we present two beverage applications using Ascentis
Express HPLC columns. Ascentis Express columns offer faster HPLC
on any system. One benefit is their ability to produce the resolution,
efficiency, and speed on conventional HPLC systems that is associated
with the use of sub-2 micron columns on a UHPLC system, without
generating high backpressure. Column chemistries (RP-Amide
and HILIC) were selected for this article based on their enhanced
performance with polar compounds in comparison to C18.
Analysis of Diet Soda
Artificial sweeteners are often used in drinks in specific combinations
to mimic the sweetness of natural sugars. They contain less energy
than sugar, and are added to maintain the taste without increasing
the caloric value. In addition to sweeteners, sodas can contain
preservatives, which are added to inhibit microbial growth and to
prolong the shelf-life of the drinks. Because artificial sweeteners and
preservatives are both considered additives, they are often regulated.
Therefore, their identities and concentrations should be determined.
Figure 1 shows the HPLC separation of 3 artificial sweeteners
(acesulfame, aspartame, and neotame), two preservatives
(benzoic acid and sorbic acid), and caffeine. In this case, the RP-Amide
column was used. Amide-functional groups in the RP-Amide column
provide different selectivity than alkyl-only phases, such as C18.
The selectivity differences are most noticeable with polar
compounds, like those in this application. The separation of all
major components on the Ascentis Express RP-Amide column
was achieved in less than 1 minute using a conventional HPLC
system with acceptable backpressure (3200 psi/220 bar).
Analysis of Caffeinated Energy Drink
Energy drinks contain a variety of marketable ingredients, such as
sugars, vitamins, and caffeine. Like sodas, they also typically contain
preservatives. The resulting chromatogram from the analysis of an
energy drink on an Ascentis Express HILIC column is shown in Figure 2.
HILIC chromatography is suitable for the retention and separation
of hydrophilic compounds based on differences in their polarities,
whether these analytes are acidic, basic, charged, or neutral. Both
UV and ELSD were used to detect different types of compounds;
the ELSD allowed the detection of the non-UV absorbing sugars.
Figure 1. HPLC Analysis of Artificial Sweeteners, Preservatives,
and Caffeine in a Diet Soda
column: Ascentis Express RP-Amide, 3 cm x 4.6 mm I.D., 2.7 μm particles (53921-U)
mobile phase: (A) 100 mM ammonium acetate, pH 5.6, titrated with acetic acid; (B) water; (C) acetonitrile
gradient: 20% A constant; 5 to 60% C in 1 min; hold at 60% C for 0.1 min
flow rate: 3 mL/min
column temp.: 40 °C
detector: UV at 214 nm
injection: 1 μL
sample: diet soda 100 - 500 μg/mL in buffer
1. Acesulfame
2. Benzoic acid
3. Sorbic acid
4. Caffeine
5. Aspartame
6. Neotame
0 0.2 0.4 0.6 0.8 1.0Min
1
5
23
4
6
Figure 2. HPLC Analysis of Sugars, Vitamins, Preservatives,
and Caffeine in an Energy Drink
column: Ascentis Express HILIC, 10 cm x 3.0 mm I.D., 2.7 μm (53970-U)
mobile phase: (A) 100 mM ammonium acetate, pH 5.0; (B) water; (C) acetonitrile; (9:1:90, A:B:C)
flow rate: 0.6 mL/min
pressure: 815 psi
column temp.: 35 °C
detector: UV, 254 nm or ELSD, 55 °C, 3.5 bar nitrogen
injection: 2 μL commercial energy drink diluted 1:9 in acetonitrile
1. Caffeine
2. Niacinamide (vitamin B3)
3. Pyridoxine hydrochloride (vitamin B6)
4. Benzoic acid
5. Sorbic acid
6. Riboflavin (vitamin B2)
7. Fructose
8. Glucose
9. Sucrose
10. Taurine
0 2 4 6 8
1 5
2
3
46
78
9
10
UV 254 nm detection ELSD detection
Min

21Order: 800-325-3010 (U.S.) 814-359-3441 (Global)
The conditions used an MS-friendly mobile phase, and yielded rapid
analysis (under 2 minutes) and low backpressure (815 psi). Because
of these benefits, a HILIC column should always be considered for
analysis of beverage components.
Conclusion
These brief examples demonstrate the application of two Ascentis®
Express columns for the analysis of beverages. Two column
chemistries, RP-Amide and HILIC, both amenable to the analysis of
polar compounds, were successfully used to resolve several beverage
components, including sugars, vitamins, sweeteners, preservatives,
and caffeine. Ascentis Express columns provided rapid separation
using conventional HPLC systems without the major increase in
backpressure associated with sub-2 micron columns. Selectivity
differences between the two columns can be further employed to
alter elution order and compound retention.
Featured Products
Description Cat. No.
Ascentis Express HPLC Columns, (2.7 μm particles)
RP-Amide, 3 cm x 4.6 mm I.D. 53921-U
HILIC, 10 cm x 3.0 mm I.D. 53970-U
Related Products
Description Cat. No.
Ascentis Express HPLC Columns, 10 cm x 4.6 mm I.D., 2.7 μm particles
C18 53827-U
C8 53837-U
Phenyl-Hexyl 53352-U
RP-Amide 53929-U
ES-Cyano 53491-U
F5 53590-U
HILIC 53979-U
OH5 53776-U
Analytical Standards (Sugars, Vitamins, Sweeteners, Caffeine)
Fructose, 1000 mg PHR1002
Glucose, 1000 mg PHR1000
Sucrose, 1000 mg PHR1001
Taurine, 1000 mg PHR1109
Riboflavin (Vitamin B2), 1000 mg 47861
Nicotinamide, amide derivative of Niacinamide (Vitamin B3),
1000 mg
47865-U
Pyridoxine hydrochloride (Vitamin B6), 1000 mg 47862
Acesulfame K, 1000 mg 47134
Aspertame, 500 mg 47135
Neotame, 100 mg 49777
Benzoic acid, 1000 mg 47849
Sorbic acid, 1000 mg 47845
Caffeine, 100 mg 56396
Analytical Reagents and Solvents
Acetic acid, eluent additive for LC-MS 49199
Ammonium acetate, for HPLC, >99.0% 17836
Acetonitrile, LC-MS CHROMASOLV®, >99.9% 34967
Related Information
To learn more about Sigma-Aldrich solutions for food analysts, visit
sigma-aldrich.com/food
Did you know . . .
Our Ascentis Express HPLC Columns (JHD) and Ascentis Express
HPLC Resource Guide (LRW) brochures fully describe the features
and benefits of Ascentis Express HPLC columns?
20% Off HPLC Accessories
Specify promo code SBV when you order. Offer expires
March 29, 2013, and is not valid in Japan. Discount is
percent off list price.
For more information, visit
sigma-aldrich.com/hplc-accessories
Maximize System Performance with
Easy-to-Use HPLC Accessories

sigma-aldrich.com/analytical
Reporter 30.3 |22 Food and Beverage Analysis
Analysis of Methylimidazoles in Caramel Colored Carbonated BeveragesCraig Aurand and Michael D. Buchanan
Introduction
Caramel colorings are used as additives in a broad range of food and
beverage products to impart a desired color, but have no nutritional
or preservative function. Recently, the potential hazard to humans of
ammonia- and ammonia-sulfite-process caramel colorings was raised,
because they contain the by-product 4-methylimidazole, which is a
potential carcinogen.1 The methylimidazole compounds are difficult to
analyze due to their polar nature and low molecular weight. Traditional
reversed phase techniques are unsuccessful in retaining these small
polar compounds. Therefore, most HPLC methods utilize ion-exchange
resins for analysis. Another common method involves GC analysis
after the analytes first undergo a derivatization step. The purpose
of the work shown in this article was to develop a simple and fast
analytical method to determine the levels of 2-methylimidazole and
4-methylimidazole in caramel colored carbonated beverages.
Experimental
A 16 oz individual plastic container of three popular diet colas were
obtained. 10 mL aliquots of each sample were then placed into separate
40 mL glass vials and shaken vigorously to expunge the dissolved
carbon dioxide. 1 mL aliquots of each degassed sample were then
placed directly into separate 2 mL HPLC autosampler vials. Samples were
analyzed directly with no further sample treatment. For quantitative
purposes, a calibration range was developed for each analyte at levels of
50, 100, 200 and 300 ng/mL. Standards were diluted in acetonitrile.
Due to the ionic nature of the methylimidazoles, peak tailing is an
issue on silica based materials, and low pH conditions are necessary
to help minimize excessive ionic interactions. In this study, the use
of the HILIC chromatographic technique was selected due to its
ability to retain and separate hydrophilic compounds by differences
in polarity, whether the analytes are acidic, basic, charged, or neutral.
In fact, HILIC often provides retention and selectivity that reversed
phase and normal phase techniques lack. Chromatograms of a
calibration standard and the three sample extracts analyzed on an
Ascentis® Express HILIC column are shown in Figures 1-4.
Figure 2. Diet Cola 1
Y-axis enlarged to show detail. Peak IDs and conditions are the same as Figure 1.
Figure 3. Diet Cola 2
Y-axis enlarged to show detail.
Peak IDs and conditions are the same as Figure 1.
Figure 4. Diet Cola 3
Y-axis enlarged to show detail.
Peak IDs and conditions are the same as Figure 1.
0 2 4 6
Min
1
2
1. 4-Methylimidazole
2. 2-Methylimidazole
Min
0 2 4
1
Min
0 2
1
4
Min
0 2
1
4
Figure 1. Standard, Each Analyte at 200 ng/mL in Acetonitrile
column: Ascentis Express HILIC, 10 cm x 2.1 mm I.D., 2.7 μm particles (53939-U)
mobile phase: 2 mM ammonium formate (95:5 acetonitrile:water) pH 4.4 titrated with formic acid
flow rate: 0.6 mL/min
pressure: 130 bar
column temp.: 50 ºC
detector: MS, ESI(+), m/z 50-800
injection: 1 μL

23Order: 800-325-3010 (U.S.) 814-359-3441 (Global)
Did you know . . .
Our Ascentis Express HILIC Guide (T412061, OMI) is a valuable
tool to learn how to achieve faster analysis of polar compounds.
Information about ES-Cyano, F5, HILIC, and OH5 phases are included.
Results and Discussion
The Ascentis® Express HILIC phase was shown to be a suitable
stationary phase, able to provide sufficient retention, plus
good resolution and peak shapes, of 2-methylimidazole and
4-methylimidazole. Even with limited sample preparation
(degassing), no co-eluting interference was observed in the elution
range of either methylimidazole compound under full scan MS
conditions. Interestingly, only 4-methylimidazole was observed
in the three tested diet colas, with each having a slightly different
concentration. Because each manufacturer uses a unique secret
formulation for their cola with a different amount of caramel
coloring from the others, it was expected that each would contain
a distinctive quantity of methylimidazole.
Conclusion
The use of an Ascentis Express HILIC column offers a unique
approach for analysis of the methylimidazole compounds. The direct
analysis technique simplifies the sample workflow, and combined
with HILIC chromatographic conditions, results in a simple and fast
analytical method to determine the levels of 2-methylimidazole and
4-methylimidazole in caramel colored carbonated beverages.
Reference
1. Petition to Bar the Use of Caramel Colorings Produced With Ammonia and
Containing the Carcinogens 2-Methylimidazole and 4-Methylimidazole, Center
for Science in the Public Interest, February 16, 2011.
Featured Products
Description Cat. No.
Ascentis Express HPLC Column (2.7 μm particles)
HILIC, 10 cm x 2.1 mm I.D. 53939-U
Related Products
Description Cat. No.
Ascentis Express HPLC Columns, 10 cm x 4.6 mm I.D., 2.7 μm particles
ES-Cyano 53491-U
F5 53590-U
HILIC 53979-U
OH5 53776-U
Analytical Reagents and Solvents
Ammonium formate, eluent additive for LC-MS 55674
Formic acid, eluent additive for LC-MS 56302
Acetonitrile, LC-MS CHROMASOLV®, >99.9% 34967
Related Information
To learn more about Sigma-Aldrich solutions for food analysts, visit
sigma-aldrich.com/food
NEW! Food and Beverage Analysis BrochureThis 32-page application guide illustrates innovative technologies that can
be leveraged to provide viable customer solutions to simplify sample
preparation and increase speed and sensitivity for many food and beverage
applications, including:
Food Chemistry (carbohydrates, dietary fiber, fats, proteins, antioxidants,vitamins, organic acids, minerals, flavors and fragrances, sweeteners, preservatives, water content, and physical characteristics)
Food Biology (genetically modified organisms and microbial growth)
Food Safety (pesticides, veterinary drugs, mycotoxins/aflatoxins, allergens, dioxins, phytochemicals, heavy metals, phthalates, PAHs, and acrylamides)
Adulterants / Product Dilution
Beverages
To request your copy, visit
sigma-aldrich.com/lit-request
Food and Beverage AnalysisIncrease speed and sensitivity with proven solutions
Food Chemistry
Food Biology
Food Safety
Adulterants
Beverages
Food & Beverage
To learn more about Sigma-Aldrich solutions for food analysts, visit
sigma-aldrich.com/food

sigma-aldrich.com/analytical
Reporter 30.3 |24 Food and Beverage Analysis
Improve Pigment Removal and Decrease Matrix Interferences for Pesticide Determination in Oranges Using Supel QuE Z-Sep/C18 QuEChERS SorbentOlga Shimelis, Emily Barrey, and Jennifer Claus
Introduction
Although pesticides have proven to be invaluable in crop control,
the same toxicity, stability, and mobility that enables them to
effectively kill insects causes detrimental effects in humans and the
environment.6 Worldwide pesticide use in modern agriculture has
led to the manifestation of pesticide residues in the majority of fruits
and vegetables. Because of the deleterious effects associated with
pesticides, authorities have applied maximum residue limits (MRLs)
on many types of produce for environmental and consumer health
protection.3 Implementation of these MRLs has increased pesticide
residue analysis globally.
The current importance of pesticide residue analysis has caused
scientists to seek robust, inexpensive, and straightforward methods
that produce quality results, for an extensive range of analytes and
matrices at low detection limits. The development of the Quick,
Easy, Cheap, Effective, Rugged, Safe (QuEChERS) sample preparation
approach by Anastassiades and Lehotay,4,5 a dispersive SPE method
utilizing bulk SPE material for sample cleanup, provides a method
fitting the aforementioned criteria. Recently the use of Z-Sep
(zirconia-coated silica) in combination with C18 was shown to
enhance sample cleanup for complex matrices.1 The comparison of
Supel™ QuE Z-Sep/C18, PSA/C18, and PSA QuEChERS sorbents, in
terms of color removal and analyte recovery, is described herein for
the cleanup of oranges prior to pesticide analysis.
Experimental
An orange was homogenized with the rind, and 4 replicate samples of
10 grams were weighed into separate 50 mL centrifuge tubes. Three
samples were spiked at 50 ng/g and the fourth was left unspiked.
Ten mL of acetonitrile was added to each tube and the samples were
shaken for 1 minute. Contents of citrate extraction tubes were added to
each sample and the tubes were shaken immediately for an additional
minute. The tubes were then centrifuged at 3200 rpm for 5 minutes.
Separate 0.7 mL aliquots of the acetonitrile layer from each sample were
then transferred into separate cleanup tubes, containing Z-Sep/C18,
PSA/C18, or PSA sorbent. The resulting 12 tubes were shaken for
1 minute and centrifuged at 5000 rpm for 5 minutes. A 0.2 mL aliquot of
the supernatant in each tube was then transferred into an empty 1.5 mL
centrifuge tube. To each tube, 0.2 mL of water was added. Tubes were
centrifuged again at 5000 rpm for 2 minutes. The resulting supernatant
was then transferred to sample vials for analysis. Calibration standards
were prepared in acetonitrile:water (1:1), and were analyzed using
LC-MS/MS, along with the 12 prepared samples.
Results and Discussion
The chromatogram in Figure 1 illustrates the LC-MS/MS analysis of
38 pesticides extracted from a spiked orange sample following
sample cleanup with Z-Sep/C18 sorbent. In this experiment,
Figure 1. LC-MS/MS MRM Transition Chromatograms of a
Spiked Orange Extract after Z-Sep/C18 Cleanup
column: Ascentis® Express C18, 5 cm x 2.1 mm I.D., 2.7 μm particles (53822-U)
mobile phase: (A) 10 mM ammonium acetate in water; (B) 10 mM ammonium acetate in acetonitrile
gradient: hold at 30% B for 1 min; 30% to 80% B in 2 min; hold at 80% B for 4 min; hold at 100% B for 3 min; hold at 30% B for 3 min
flow rate: 0.3 mL/min
pressure: 2730 psi
column temp.: 30 ºC
detector: MS,/MS, ESI positive
1. Methomyl (0.60 min)
2. Trichlorfon (1.22 min)
3. Carbendazim (1.94 min)
4. Aldicarb (2.70 min)
5. Parathion-methyl (5.87 min)
6. Methabenzthiazuron (6.16 min)
7. Naled (6.37 min)
8. Methidathion (6.38 min)
9. Clethodim (6.42 min)
10. Phosmet (6.50 min)
11. Ametryn (6.58 min)
12. Sethoxydim (6.61 min)
13. Anilazine (6.78 min)
14. Fenxehamid (6.94 min)
15. Mecarbam (7.00 min)
16. Oryzalin (7.06 min)
17. Diflunezuron (7.18 min)
18. Fenoxycarb (7.19 min)
19. Iprobenfos (7.21 min)
20. Quinalphos (7.23 min)
21. Edifenphos (7.28 min)
22. Etrimfos (7.33 min)
23. Fenthion (7.34 min)
24. Fenitrothion (7.36 min)
25. Diazinon (7.37 min)
26. Tolclofos (7.52 min)
27. Phorate (7.53 min)
28. Chlorpyrifos-methyl (7.67 min)
29. EPN (7.68 min)
30. Terbufos (8.14 min)
31. Ethion (8.36 min)
32. Lufenuron (8.40 min)
33. Spiromesifen (8.74 min)
34. Octhilinone (8.74 min)
35. Pyraclostrobin (8.75 min)
36. Carbophenothion (8.83 min)
37. Flufenoxuron (9.02 min)
38. Fenpyroximate (9.10 min)
2 4 6 8 10
Min
25Order: 800-325-3010 (U.S.) 814-359-3441 (Global)
use of an Ascentis® Express C18 column yielded the necessary
peak efficiencies to obtain sufficient resolution and elution of all
38 analytes in under 10 minutes, minimizing analysis time and
increasing throughput. The visual comparison of extracts shown in
Figure 2 illustrates that more thorough removal of color is achieved
with Z-Sep/C18 sorbent, as opposed to PSA sorbent. In addition to
reducing matrix interferences, the improved cleanup by Z-Sep/C18
sorbent can decrease column and instrument fouling, leading to an
extended HPLC column life while reducing instrument downtime.
The bar chart in Figure 3 provides a visual comparison of selected
analyte recovery after using Z-Sep/C18, PSA/C18, and PSA sorbents.
Overall, the three methods produced similar recovery values for the
majority of the pesticides tested. The Z-Sep/C18 sorbent provided
recoveries superior for two of the pesticides tested, anilazine and
naled, that were not detectable with PSA/C18 or PSA sorbents due
to matrix effects. For a few pesticides, sethoxidim, clethodim, and
edifenphos, matrix effects showed increased ion suppression in
samples cleaned with PSA sorbent. In addition, carbophenothion
exhibited more matrix enhancement with the PSA sorbent than with
the Z-Sep/C18 sorbent.
Conclusion
Comparison of color removal and analyte recovery for pesticide
residue analysis in orange extracts after the extracts underwent
cleanup with Z-Sep/C18, PSA/C18, or PSA QuEChERS sorbent was
performed. For a number of the pesticides analyzed, results showed
the Z-Sep/C18 sorbent was superior to that of PSA/C18 and PSA
sorbents. Results for the remaining pesticides were similar to those
observed with both PSA/C18 and PSA sorbents, indicating that Z-Sep
does not adversely bind any of the tested analytes. Decreased matrix
effects were also observed with Z-Sep/C18 sorbent as compared to
PSA/C18 and PSA sorbents. Additionally, Z-Sep/C18 sorbent provided
improved color removal over PSA sorbent. These observations
support the fact that Supel™-QuE Z-Sep/C18 has the potential to be
a direct replacement for C18 and PSA phases in current methods.
References
1. Fenik, J.; Tankiewicz, M.; Biziuk, M. Properties and determination of pesticides in
fruits and vegetables. TrAC Trend Anal. Chem. 2011, 30, 814-826.
2. Koesukwiwat, U.; Lehotay, S. J.; Miao, S.; Leepipatpiboon, N. High throughput
analysis of 150 pesticides in fruits and vegetables using QuEChERS and low-
pressure gas chromatography-time-of-flight mass spectrometry. J. Chromatogr
A. 2010, 1217, 6692-6703.
3. USDA, Foreign Agricultural Service, Maximum Residue Limit Database. http://
www.fas.usda.gov/htp/mrl.asp, (accessed 8-Mar-2012).
4. Anastassiades, M; Lehotay, S. J.; Stajhbaher, D.; Schenck, F. J. Fast and easy
multiresidue method employing acetonitrile extraction/partitioning and
“dispersive solid-phase extraction” for the determination of pesticide residues in
produce. J. AOAC Int. 2003, 86, 412-431.
5. Lehotay, S. J. Quick, Easy, Cheap, Effective, Rugged and Safe (QuEChERS)
Ap¬proach for the Determination of Pesticide Residues. Proceedings AOAC
Annual Meeting, St. Louis, MO USA, 2004.
6. Shimelis, O. Analysis of Pesticides in Fruits and Vegetables Using Z-Sep and
Z-Sep+ SPE Sorbents in QuEChERS Method for Sample Cleanup. Pittcon 2012
Oral Presentation, Orlando, FL USA, 2012.
7. EN15662:2008, Foods of Plant Origin - Determination of Pesticide Residues using
GC-MS and/or LC-MS/MS Following Acetonitrile Extraction/Partitioning and Cleanup
by Dispersive SPE - QuEChERS-Method.
8. AOAC Official Method 2007.01, Pesticide Residues in Foods by Acetonitrile
Extraction and Partitioning with Magnesium Sulfate.
Featured Products
Description Qty. Cat. No. Supel-QuE QuEChERS ProductsCitrate extraction tube 50 55227-UZ-Sep/C18 cleanup tube, 2 mL 100 55284-UPSA/C18 cleanup tube, 2 mL 100 55288-UPSA cleanup tube, 2 mL 100 55287-UEmpty centrifuge tube, 50 mL 50 55248-UAscentis Express HPLC Column (2.7 μm particles)C18, 5 cm x 2.1 mm 1 53822-U
Related Products
Description Cat. No. Acetonitrile, LC-MS CHROMASOLV®, >99.9% 34967Water, LC-MS CHROMASOLV 39253
Related Information
To learn more about Sigma-Aldrich® solutions for food analysts, visit
sigma-aldrich.com/food
Figure 2. Visual Comparison of Extracts Cleaned using Z-Sep/
C18 Sorbent (left) and PSA Sorbent (right)
More color
(pigment) removed
0
20
40
60
80
100
120
140Z-Sep/C18PSA/C18PSA
CA
RB
EN
DA
ZIM
FE
NH
EX
AM
ID
AM
ET
RY
N
AN
ILA
ZIN
E
NA
LED
DIF
LUB
EN
ZU
RO
N
FE
NO
XY
CA
RB
FE
NP
YR
OX
IMA
TE
SE
TH
OX
YD
IM
SP
IRO
ME
SIF
EN
OC
TH
ILIN
ON
E
FLU
FE
NO
XU
RO
N
PH
OS
ME
T
ED
IFE
NP
HO
S
TOLC
LOF
OS
CA
RB
OP
HE
NO
TH
ION
ME
TH
IDA
TIO
N
ALD
ICA
RB
Figure 3. Average Recovery of Selected Pesticides from Spiked
Oranges (n=3)

sigma-aldrich.com/analytical
Reporter 30.3 |26 Chromatographic Purification
Removal of Detergents from Biological Product MatricesJ. Patrick Myers
Most modern biopharmaceutical research and manufacturing requires
the use of one or more detergents. Detergents are amphipathic
molecules having both hydrophilic and hydrophobic properties. These
unique properties are used to alter the interactions between biological
molecules in aqueous solutions.
Detergents are organized into broad classes based on the nature of
the polar, hydrophilic part of the molecule. The classes include ionic
(further broken down into negatively charged anionic and positively
charged cationic), nonionic (uncharged), and zwitterionic (having both
positively and negatively charged groups but with a net charge of zero).
Under the proper conditions, detergents form micelles in water.
A micelle is a three dimensional structure formed when the
concentration of a detergent increases in water beyond the amount
that can form a monolayer on the surface. Micelles are typically
spheres in which the hydrophobic part of the detergent molecules
associate with each other and the hydrophilic parts of the molecules
contact the water. The number of detergent molecules per micelle
(aggregation number) and the range of detergent concentration
above which micelles form (called the critical micelle concentration,
CMC) are properties specific to each particular detergent. The critical
micelle temperature (CMT) is the lowest temperature at which
micelles can form. Below the CMT, detergent molecules exist in
a crystalline form in solution and are not effective. Above the CMT,
detergents form micelles and become effective in disrupting
lipid-lipid interactions.
The molecules that make up biological membranes are also
amphipathic. They are made up of polar “heads” attached to lipophilic,
hydrophobic, “tails”. Stable membranes are formed when the “tails”
of the molecules associate with each other in a bilayer sheet-like
arrangement leaving the polar “heads” to contact the polar, aqueous
milieu on both sides of the membrane. Additional molecules including
proteins and cholesterol embedded in the lipid bi-layer are important
to the flexibility and function of the membrane. The formation of
detergent micelles is important because it allows the dispersion of
water-insoluble, hydrophobic compounds into aqueous solutions. It
also allows the disruption of biological membranes and extraction of
proteins. The disintegration of membranes occurs by disrupting the
lipid-lipid and lipid-protein interactions in the membrane.
In biological research and manufacture of biopharmaceutical
products, detergents are used for many purposes including stabilizing
proteins and nucleic acids during electrophoresis, dissolving
membrane proteins, prevention of nonspecific binding in affinity
purification and immunoassay procedures, control of protein
crystallization and disruption of cell membranes to release membrane
bound and intracellular proteins.
In biopharmaceutical production, the detergent must be removed
from the product in the downstream processing activities. Methods
from removing detergents include gel filtration, size exclusion,
dialysis and hydrophobic adsorption chromatography. Data
presented in Tables 1 and 2 demonstrate that pre-packed, sterile,
endotoxin-free Porozorb™ cartridges can also be used to effectively
remove detergents and other nonpolar, hydrophobic materials
from biological preparations.
Porozorb cartridges are disposable and available in sizes appropriate
for analytical to process scale purification schemes.
The Amberlite™ XAD-4 resin used in Porozorb™ cartridges is a proven
technology that is highly effective in removing various detergents
from cell culture media for biopharmaceutical applications such as
vaccine production. Table 1 shows the capacity of various Porozorb
cartridges for several common detergents used in biopharmaceutical
applications. Table 2 demonstrates the time required to reduce a 0.1%
concentration of one of those detergents, Triton® X-100, in a 10 liter
solution to below detectable levels.
Table 1. Capacity of Porozorb Cartridges for Various Detergents
Calculated Saturation Capacity
Porozorb
Cartridge
Bed Volume
(mL) ID (cm) Length (cm)Triton X-100 (g)/
cartridgeSDS (g)/
cartridge CHAPS (g)/ cartridge
254 250 8 6.55 44 125 78
1004 1000 8 26.2 168.8 462 288
4004 4000 12.71 42.04 504 1400 873.6
* Dried to less than 1% moisture.
Table 2. The time required to reduce detergent in 10 liters of 0.1% Triton X-100 solution to below detection level and breakthrough
volumes. Detergent detected by monitoring the absorbance at 275 nm, with the lowest detectable limit (0.05 = A275) indicating a
positive result.
Flow Rate 3.6 liter/hour Flow Rate 10.3 liter/hour Flow Rate 22.8 liter/hour
Bed Volume
(liter)
Breakthrough Volume
(liter)
Recirculation Time
(hour)
Breakthrough Volume
(liter)
Recirculation Time
(hour)
Breakthrough Volume
(liter)
Recirculation Time
(hour)
250 3 11 <1 6 <1 3
1000 none 9 50 3.5 1 2
4000 none 7 none 2 >40 1.5

27Order: 800-325-3010 (U.S.) 814-359-3441 (Global)
Figure 1. Typical XAD-4 Breakthrough Curve
Breakthrough volume of 4.8 g of XAD-4 resin packed into a 12 mL
SPE cartridge. Mobile phase solution is 0.1% w/v Tergitol® NP9 in
water. Detergent concentration monitored at 254 nm
1.0 2.0 3.0
Min
Figure 2. Disposable Porozorb Cartridges (4 L and 1 L)
References
1. http://www.piercenet.com/browse.cfm?fldID=5558F7E4-5056-8A76-4E55-
4F3977738B63
2. http://wolfson.huji.ac.il/purification/PDF/detergents/ANATRACE_DetergentsUse.pdf
3. Horigome, T. Sugano, H., A rapid method for removal of detergents from protein
solution. Analytical Biochemistry, Volume 130, Issue 2, 15 April 1983, pages
393-396.
4. http://www.rohmhaas.com/ionexchange/pharmaceuticals/detergent_removal.htm
5. Trescec, A.,et al., Removal of Detergent and Solvent from Solvent-Detergent-
treated Immunoglobulins, .Chromatogr. A, 852(1999) 87-91
Featured Products
Description Volume Cat. No.
Porozorb 254 250 mL 57500
Porozorb 1004 1000 mL 57502
Porozorb 4004 4000 mL 57513-U
For more information on our complete offering of products
and services for chromatographic purification, visit
sigma-aldrich.com/purification
The Amberlite™ XAD-4 resin contained in the Porozorb™ cartridge
is cleaned without the use of organics and tested for residues
(FCR 21: 173.65) and organics. Each cartridge is packaged separately,
and is accompanied by a Certificate of Analysis for sterility
and endotoxicity. Sterility testing follows USP XXIII guidelines.
Endotoxicity is tested using a validated LAL kit, with any detectable
level of endotoxin (0.03 EU/mL) indicating a positive test. Porozorb
cartridges can also be packed with a variety of other resins and
media to meet your specific application needs. In addition, we can
provide bulk materials and/or smaller pre-packed devices for method
development through our custom services.
Figure 3. Structure of Hydrophobic Macroreticular Resin Bead
Flow Rate = 50 mL/min

©2012 Sigma-Aldrich Co. LLC. All rights reserved. SAFC, SIGMA-ALDRICH and SUPELCO are trademarks of Sigma-Aldrich Co. LLC, registered in the US and other countries. Ascentis, CHROMASOLV, Hybrid-SPE, Fluka,
TraceSELECT and Carboxen are registered trademarks of Sigma-Aldrich Co. LLC. Fused-Core is a registered trademark of Advanced Materials Technology, Inc. Tedlar is a registered trademark of E.I. duPont de Nemours.
Amberlite is a registered trademark of The Dow Chemical Company. Tergitol is a registered trademark of Union Carbide. Cerilliant is a registered trademark of Cerilliant Corporation. Supel, ASSET, Visiprep and Porozorb are
trademarks of Sigma-Aldrich Co. LLC. PITTCON is a registered trademark of Pittsburgh Conference on Analytical Chemistry and Applied Spectroscopy. Triton is a trademark of The Dow Chemical Company or an affiliated
company of Dow. Anatune is a trademark of Anatune Ltd. Supelco brand products are sold through Sigma-Aldrich, Inc. Purchaser must determine the suitability of the product(s) for their particular use. Additional terms and
conditions may apply. Please see product information on the Sigma-Aldrich website at www.sigmaaldrich.com and/or on the reverse side of the invoice or packing slip.
OIZ
11367-513326 / T212003
1112
Solutions within means digging
deep to find the right solution, and
never sacrificing on quality. Whether
in-stock or highly customized,
proprietary or ordinary, our products
reflect consistent, leading-edge
Supelco performance, and
technical expertise.To learn more, visit
sigma-aldrich.com/analytical
Explore the solutions within.Discover complete application solutions
for unique separation challenges.