The next 15 years Is there a
57
The next 15 years – Is there a “New Normal” ahead? Delaware Investments Presentation © Richard C Marston Wharton School, University of Pennsylvania
Transcript of The next 15 years Is there a

The next 15 years – Is there a “New Normal” ahead? Delaware Investments Presentation
© Richard C Marston
Wharton School, University of Pennsylvania

Outline
1. Is there a “New Normal” ahead for stocks?
2. Is the thirty-year bull market in bonds finally over?
3. Is it possible to avoid the New Normal by diversifying beyond U.S. stocks and bonds?
– Diversifying into fast growing economies
– Diversifying into alternative investments

Bill Gross introduced the “New Normal” too soon – in May 2009
• S&P 500 reached its bottom on March 9, 2009 – just six months after Lehman failed.
• It has been a great cyclical rally ever since then.
• Through September 2016, the S&P 500 is up by 220%
• After a recession, we always experience a sharp cyclical rally

S&P 500 in Last 15 Years, 1999-2016 Source: S&P
600
1000
1400
1800
2200
2000 2004 2009 2014
S&P
50
0 In
dex

Returns after Recession: S&P 500 return in 1st 12 months Source: Investing for a Lifetime (2014), Table 3.3
46.0%
43.4%
32.6%
41.9%
37.3%
59.3%
33.5%
38.5%
49.8%
0% 10% 20% 30% 40% 50% 60% 70%
Jul 53-May 54
Aug 57-Apr 58
Apr 60-Feb 61
Dec 69-Nov 70
Nov 73-Mar 75
Jul 81-Nov 82
Jul 90-Mar 91
Mar 01-Nov 01
Dec 07-Jun 09
Dat
es
of
Re
cess
ion

The true “New Normal”
• Yet Bill Gross may be right that stock returns in the future will not what they have been in the past.
• Future stock returns may not be as high as in the past because growth in the industrial world has slowed down.

Real GDP Growth in Japan Source: IMF, international Financial Statistics
BRICs
4.6% 4.7%
1.0%0.7%
0%
2%
4%
6%
1971-1980 1981-1990 1991-2000 2001-2015
The collapse in growth occurred in Japan 25 years ago

Real GDP Growth in Europe Source: IMF, International Financial Statistics
3.2%
2.5%
2.1%
1.0%
2.7%
2.3%
2.9%
1.1%
0%
1%
2%
3%
4%
1971-1980 1981-1990 1991-2000 2001-2015
Gro
wth
pe
r A
nn
um
France Germany

Real GDP Growth in United States Source: Bureau of Economic Analysis
3.2%3.4%
3.4%
1.8%
0%
1%
2%
3%
4%
1971-1980 1981-1990 1991-2000 2001-2015
Gro
wth
pe
r A
nn
um

Long view of U.S. growth
• U.S. economy grew rapidly in the 19th century – but never as fast as China!
• Slowdown in 1930s depression, then postwar boom that extended until 2000.

U.S. GDP growth since 1870 Source: NIPA, Table 1.1.6 and F 10-16
4.2%
3.1%
1.7%
3.2% 3.2%
1.8%
0%
1%
2%
3%
4%
5%
1870-1913 1913-1929 1930-1940 1946-1972 1972-2000 2001-2015
Perc
ent
per
an
nu
m
Postwar boom

Long view of U.S. growth
• Growth in industrial countries is slowing partly because productivity growth is slowing.
• A major reason for the slowdown in the growth in output per hour is the shift of the economy towards services and away from manufacturing.
• Productivity in most service sectors is way below that in manufacturing or agriculture or mining

Annual Growth in Productivity in Services, 1987-2014 Source: Brookings Institution (WSJ, 10-31-16)
-1.0% -0.5% 0.0% 0.5% 1.0% 1.5%
Legal Services
Hospitals/Residential Care
Eduational Services
Social Assistance
Food Services
Computer Systems/Services
Administrative Services
Accomodation/Hospitality

Two Trends in Manufacturing
• Will examine two trends in manufacturing since 1980:
1. Growth in manufacturing output (adjusted for inflation)
2. Growth in employment in manufacturing

Production and Employment in Manufacturing
Bureau of Labor Statistics and Council of Economic Advisors
50
100
150
200
250
300
1980. 1985. 1990. 1995. 2000. 2005. 2010. 2015
Ind
ex (
19
80
= 1
00
)
Manufacturing Output
Manufacturing Jobs
18.6 million jobs
12.3 million jobs

The true “New Normal”
• Another reason growth is slowing is that the industrial countries are aging.
• That’s particularly true of Japan, Germany and Italy.
• Look at share of population that is 65 years or older.

Share of Population 65 Years or Older Source: Pew Research Center using United Nations data
0% 10% 20% 30% 40%
U.S.
U.K.
France
Italy
Germany
Japan
2050
2010

Stock returns in developed markets
• Stock returns in the developed (or industrial) countries over the last 45 years or the last 30 years have been quite impressive.
• But the last 15 years have been a different story.
• Let’s divide developed markets into three sets of markets: 1. U.S. market represented by the S&P 500 index
2. European portion of the MSCI EAFE index
3. Pacific portion of the EAFE index (Japan, Australasia, Hong Kong, and Singapore)

Stocks in developed markets Sources: S&P and MSCI
Last 15 years
Last 30 years
10.3%
11.4%
4.3%
9.5% 9.4%
2.9%
10.0%
11.5%
3.4%
9.2%
6.9%
1.9%
0%
2%
4%
6%
8%
10%
12%
14%
1970-2015 1986-2015 2001-2015
Ret
urn
pe
r an
nu
m
S&P 500 EAFE Europe Pacific
Last 30 years
Last 15 years

Stock returns in real terms
• Investors in the long run are interested in real (or inflation-adjusted) returns.
• Let’s look at the same returns adjusted by the U.S. inflation rate (since the returns are measured in dollars).
• This chart shows how miserable stock returns have been over the last 15 years.

Stocks in developed markets: real returns Sources: S&P and MSCI
Last 15 years
5.9%
8.4%
2.0%
5.2%
6.5%
0.6%
5.7%
8.5%
1.1%
4.9%
4.0%
-0.4%
-2%
0%
2%
4%
6%
8%
10%
1970-2015 1986-2015 2001-2015
Ret
urn
pe
r an
nu
m
S&P 500 EAFE Europe Pacific
Last 15 years

2) A “New Normal” for bonds?
• Bill Gross talked about a New Normal for stocks.
• But what about bonds? Surely, there is a New Normal ahead for bonds.
• The bull market for bonds has lasted for 30 years.

Figure 3-3 U.S. Inflation and Bond Yields, 1954-2015 Data Source: IMF, International Financial Statistics and Bureau of Labor Statistics
-2%
0%
2%
4%
6%
8%
10%
12%
14%
16%
1954 1964 1974 1984 1994 2004 2014
Pe
r A
nn
um
CPI Inflation 10 yr Treas Yield

Factors influencing interest rates
A. Fiscal deficits
B. Monetary overhang
• Fiscal deficits have been reduced dramatically in last few years.
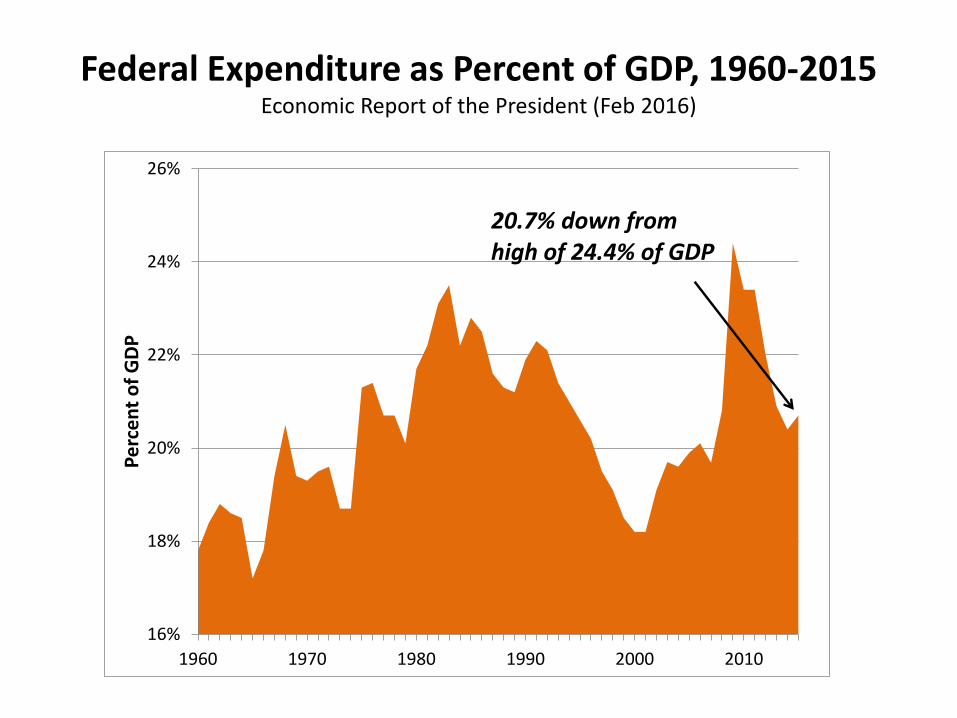
Federal Expenditure as Percent of GDP, 1960-2015 Economic Report of the President (Feb 2016)
16%
18%
20%
22%
24%
26%
1960 1970 1980 1990 2000 2010
Pe
rce
nt
of
GD
P
20.7% down fromhigh of 24.4% of GDP

U.S. Tax Receipts as Percent of GDP, 1960-2015 Economic Report of the President (Feb 2016)
14%
16%
18%
20%
22%
1960 1970 1980 1990 2000 2010
Pe
rce
nt
of
GD
P
18.3% up fromlow of 14.6% of GDP

U.S. Fiscal Deficit as Percent of GDP, 1960-2015 Economic Report of the President (Feb 2016)
-12%
-10%
-8%
-6%
-4%
-2%
0%
2%
4%
1960 1970 1980 1990 2000 2010
Pe
rce
nt
of
GD
P
-2.5% up fromlow of -9.8% of GDP

Factors influencing interest rates
• The election results promise that this favorable trend will not continue.
– Infrastructure spending
– Large tax cuts

B. Monetary overhang
• Federal reserve did heroic work during the financial system – providing massive liquidity to save banking system and bolster economy.
• But legacies:
1. Fed balance sheet has ballooned.
2. So has cash at commercial banks.

Assets on Fed’s Balance Sheet Source: Federal Reserve Board
Federal Reserve H.4.1 Release
Start of QE2
Start of QE3
Start of QE1
$0
$1,000
$2,000
$3,000
$4,000
$5,000
1/5/2005 1/5/2008 1/5/2011 1/5/2014
$ B
illio
ns Other Assets
Loans
Other Securities
U.S. Treasuries
QE2
QE3
QE1

Cash assets at commercial banks
Source: FRB H8 Series
Start of QE2
Start of QE3
Start of QE1
$-
$1,000
$2,000
$3,000
Jan-05 Jan-07 Jan-09 Jan-11 Jan-13 Jan-15
$ B
illio
ns
Start of QE1
Start of QE2
Start of QE3
A “New Normal” for bonds
• Now what?
• Does anyone at the Fed know how to get back to normal?
• Two scenarios for bonds:
1. Good scenario: Interest rates stay low forever. (In that case, real yields stay close to zero).
2. Bad scenario: interest rates rise.
• That surely is a “New Normal” for bonds

3. Is it possible to escape the “New Normal” by diversifying?
• If U.S. stock and bond markets promise lower returns, will diversification help?
1. One possibility is to diversify into countries that are growing much faster than the United States – the emerging markets.
2. Another possibility is to diversify into alternative investments.
• Let’s explore each possibility.

A. Diversifying into emerging markets
• Since 2001, emerging markets have earned the highest stock returns, easily beating the U.S. and other developed stock markets.
• Maybe emerging markets will help investors to escape the New Normal.
• In November 2001, Jim O’Neill of Goldman Sachs introduced the BRICs
• Heralded an impressive decade of high stock returns not only in the BRICs, but emerging markets as a whole.

Figure 9-6 Returns in the BRIC Countries and Emerging Markets as a Whole
Data Source: MSCI
1.2%
14.1%
-5.0%
-16.8%
-4.1%
8.2%6.7%
14.1%12.6%
9.7%
-20%
-10%
0%
10%
20%
Brazil Russia India China MSCI EM
Ret
urn
/An
nu
m
1995-2001 2002-2015

Decade of the “BRICs”
• But then in December 2013, Goldman Sachs published “Emerging Markets: As the Tide Goes Out” which forecast a prolonged slowdown in stock returns in the emerging markets.
• Is it wise to look for salvation there?

Stock Returns in Emerging Markets Source: MSCI EM Index
Emerging markets have faltered over last 5 years
8.3%
16.2%
-4.5%
-10%
-6%
-2%
2%
6%
10%
14%
18%
1991-2000 2001-2010 2011-2015
Ret
urn
pe
r A
nn
um

China has led all emerging markets in growth
• China has grown rapidly for over three and ½ decades.

Real GDP Growth in China, 1979-2013 Source: IMF, international Financial Statistics
BRICs
9.9%
9.0%
10.4%10.0% 9.7%
0%
2%
4%
6%
8%
10%
12%
1979-85 1986-92 1993-99 2000-06 2007-13
Gro
wth
Pe
r A
nn
um

Share of Employment by Sector in China Source: China Statistical Yearbook, 2013
0%
30%
60%
90%
1952 1982 1992 2002 2012
Emp
loym
en
t in
Se
cto
r (%
of
GD
P)
Agriculture
Industry
Services
Key: lots of labor available

Wage Increases in China Source: China Statistical Yearbook, 2013
¥0
¥20,000
¥40,000
¥60,000
¥80,000
1995 2000 2005 2010
Total Wage Bill
Average Wage
Average wage increase = 13.6% per annum
But now wages are rising rapidly

Will China slow down?
• China also confronts an aging problem almost as bad as in Japan, Germany and Italy.
• Consider United Nations projections through 2050.

China’s Working Age Population Relative to Non-Working Age Population
Source: United Nations
1
1.5
2
2.5
3
1980 1990 2000 2010 2020 2030 2040 2050
Wo
rkin
g A
ge/N
on
Wo
rkin
g A
ge

Will China slow down?
• China is beginning to slow down.
– That’s bad news for everyone.
– China has been the growth engine for the world.
• With China slowing, two other BRICs are in even worse shape, Brazil and Russia.

Economic forecasts for emerging markets Source: IMF, July 2016
2015 2016f 2017f
China
India
Brazil
Russia
6.9%
7.6%
-3.8%
-3.7%
6.6%
7.5%
-3.3%
-1.2%
6.2%
7.4%
0.5%
1.0%
Three of the BRICs have slowed down

B. Diversifying into alternative investments
• Hedge funds:
• Surely hedge funds provide an escape from the low returns offered by U.S. stock and bonds.
• Let’s consider how well they have performed in the last 15 years.

Hedge Fund Returns – Too Many Cooks Spoiling the Returns?
HFRI Fund Weighted Hedge Fund Index
Decline in average
returns over time Decline in average
returns over time Decline in average
returns over time
18.2% 18.3%
7.1%
5.7%
3.6%
0%
5%
10%
15%
20%
1990-1994 1995-1999 2000-2004 2005-2009 2010-2015
Ret
urn
pe
r A
nn
um
Decline in average
returns over time

Diversifying into alternative investments
• Hedge funds:
• The increasingly poor performance of hedge funds in last 15 years is perhaps expected.
• After all, the space has been flooded by the influx of new funds. Are there that many arbitrage opportunities to keep 10,000 managers in business?
Diversifying into alternative investments
• Real Estate:
– Over last 20+ years as well as over the last 40+ years, real estate has outperformed U.S. equity.
– Look at REIT index relative to the S&P 500

Table 12-1 NAREIT and stock returns compared
Average Return Standard deviation
1972-2015
NAREIT
S&P 500
12.0%
10.3%
17.1%
15.2%
1992-2015
NAREIT
S&P 500
11.2%
9.0%
19.1%
14.4% Sources: NAREIT and Standard and Poor’s.

Diversifying into alternative investments
• Two caveats about real estate:
1. Real estate is as cyclically sensitive as stocks are.
– It’s true that in the 2000-2001 recession, real estate did not fall with stocks.
– But in the financial crisis, the drop in REITs (65%) was more severe than in stocks (50%).
2. Current values in real estate (“Cap rates”) are high. It’s not a great time to add to this sector.
– On other hand, the outlook is not great in any sector.

Figure 11-4. NAREIT and S&P 500 Returns, 1992-2015 Data Sources: Ibbotson Associates and Zephyr Database
Crushed in financial crisis, but have come back fully
0
500
1000
1500
Dec-91 Dec-97 Dec-03 Dec-09 Dec-15
Ind
ex (
De
c 1
99
1 =
10
0)
NAREIT
S&P 500

Diversifying into alternative investments
• Private equity: – Here we have an alternative investment that has proved
itself time and again.
– Cambridge Associates has reported its private equity series since 1986.
– Returns have been consistently above those of the private equity markets.
• My advice to endowments (and wealthy families) wealthy enough to invest in PE:
Take advantage of excess returns to buck the New Normal in public markets
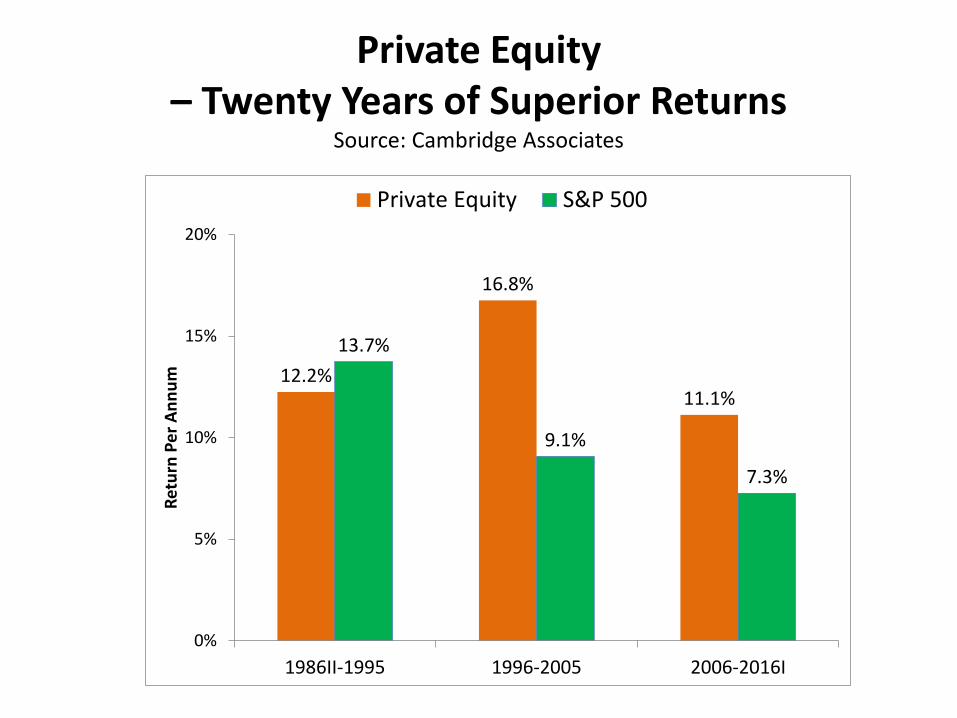
Private Equity – Twenty Years of Superior Returns
Source: Cambridge Associates
12.2%
16.8%
11.1%
13.7%
9.1%
7.3%
0%
5%
10%
15%
20%
1986II-1995 1996-2005 2006-2016I
Ret
urn
Pe
r A
nn
um
Private Equity S&P 500

Diversifying into alternative investments
• So private equity provides an alternative to the New Normal only for large endowments – not for the rest of us.

The bottom line
• Investors face a “New Normal” of diminished returns.
• Economic growth has slowed throughout much of the world, so investment returns are likely to be lower than in the past.

My latest book published by Wiley
Investing for a Lifetime Managing Wealth for the “New Normal”
1) Saving and Investing
2) Choosing a Portfolio
3) Wealth Management
Also see my website
richardcmarston.com