
THE NEWLYWED’S DILEMMA - Research Affiliates NEWLYWED’S DILEMMA Research Affiliates Newsletter...
7
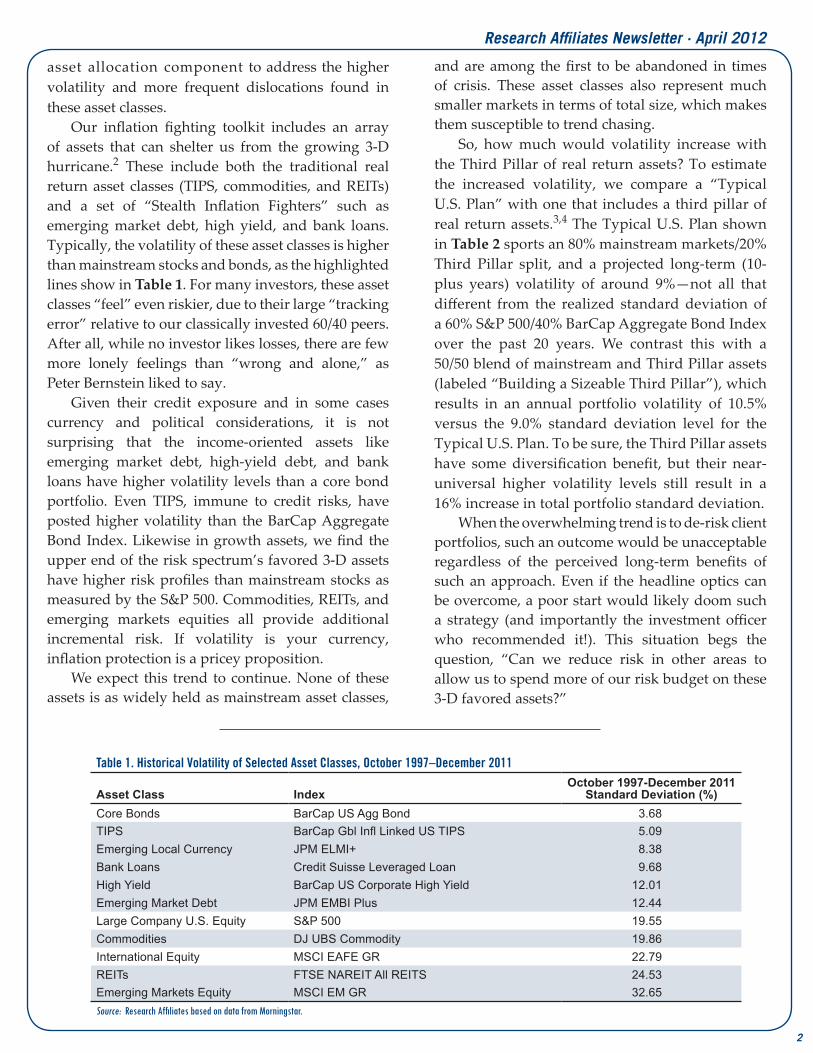
THE NEWLYWED’S DILEMMA Research Affiliates Newsletter · April 2012 620 newport center drive, suite 900 newport beach, ca 92660 usa phone +1 (949) 325-8700 fax +1 (949) 554-0192 [email protected] www.rallc.com MEDIA CONTACTS Tucker Hewes Hewes Communications +1 (212) 207-9451 [email protected] Joel Chernoff Research Affiliates +1 (949) 325-8729 [email protected] continued on page two For most adults, the New Normal of their personal lives starts not long after saying “I do.” The habits, schedules, hobbies, possessions, and even relationships garnered over the past 10 or 20 years must be altered or outright replaced. Married life changes one’s priorities, and priorities change just about everything. Nowhere is this more evident than in the disappearance of free time. Building a new life together, it turns out, is quite the time commitment. For most men, the big game over the weekend is out—replaced by, paraphrasing Will Ferrell in the movie Old School, “a nice lile Saturday” at the Home Depot to buy some wallpaper and flooring. For women, “girls’ night out” becomes a rare treat. Unless the new spouse can find more hours in the day, the discretionary time of our single years fades sharply. Our 3-D Hurricane 1 —the interconnected influence of relentless deficits, soaring debt, and an aging demography—is creating a similar demarcation for investors. Old investing patterns—for example, tracking error to the ubiquitous 60/40 blend of mainstream stocks and bonds, the comfortable reliance on “first-world” developed markets, and conventional cap-weighted indexing—may not fit with our new investment priorities: more effective inflation protection, absolute returns and better Sharpe ratios, a greater emphasis on developing economies and markets, and so forth. In this issue, we explore ways investors can make the break from the “mainstream” investing approaches to which they have become accustomed to approaches that will position them beer for the future. The Volatility of 3-D Hurricane Assets It is a simple fact that mainstream stocks and bonds empirically do a very poor job of hedging against inflation, especially in the early stages of renewed inflation. It is also self- evident that stock and bond yields—especially in the United States—are both well below historical norms. For these reasons, we suggest that most investors begin building a “third pillar” to their stock and bond allocations. The third pillar would encompass a mix of real return investments. We also suggest that investors adopt a tactical ® RAFI ® Managed Assets * *Includes RAFI assets managed or sub-advised by Research Affiliates® or RAFI licensees. 0 $10 $20 $30 $40 $50 $60 $70 4Q05 4Q06 4Q07 4Q08 4Q09 USD in Billions 4Q10 4Q11 1Q12E John West, CFA
Transcript of THE NEWLYWED’S DILEMMA - Research Affiliates NEWLYWED’S DILEMMA Research Affiliates Newsletter...

THE NEWLYWED’S DILEMMA
Research Affiliates Newsletter · April 2012
620 newport center drive, suite 900newport beach, ca 92660 usaphone +1 (949) 325-8700fax +1 (949) 554-0192 [email protected]
MEDIA CONTACTSTucker HewesHewes Communications+1 (212) [email protected]
Joel ChernoffResearch Affiliates+1 (949) [email protected]
continued on page two
4Q05 1Q06 2Q06 3Q06 4Q06 1Q07 2Q07
For most adults, the New Normal of their personal lives starts not long after saying “I do.” The habits, schedules, hobbies, possessions, and even relationships garnered over the past 10 or 20 years must be altered or outright replaced. Married life changes one’s priorities, and priorities change just about everything. Nowhere is this more evident than in the disappearance of free time. Building a new life together, it turns out, is quite the time commitment. For most men, the big game over the weekend is out—replaced by, paraphrasing Will Ferrell in the movie Old School, “a nice little Saturday” at the Home Depot to buy some wallpaper and flooring. For women, “girls’ night out” becomes a rare treat. Unless the new spouse can find more hours in the day, the discretionary time of our single years fades sharply.
Our 3-D Hurricane1—the interconnected influence of relentless deficits, soaring debt, and an aging demography—is creating a similar demarcation for investors. Old investing patterns—for example, tracking error to the ubiquitous 60/40 blend of mainstream stocks and bonds, the comfortable reliance on
“first-world” developed markets, and conventional cap-weighted indexing—may not fit with our new investment priorities: more effective inflation protection, absolute returns and better Sharpe ratios, a greater emphasis on developing economies and markets, and so forth.
In this issue, we explore ways investors can make the break from the “mainstream” investing approaches to which they have become accustomed to approaches that will position them better for the future.
The Volatility of 3-D Hurricane AssetsIt is a simple fact that
mainstream stocks and bonds empirically do a very poor job of hedging against inflation, especially in the early stages of renewed inflation. It is also self-evident that stock and bond yields—especially in the United States—are both well below historical norms. For these reasons, we suggest that most investors begin building a “third pillar” to their stock and bond allocations. The third pillar would encompass a mix of real return investments. We also suggest that investors adopt a tactical
®
RAFI® Managed Assets*
*Includes RAFI assets managed or sub-advised by Research Affiliates® or RAFI licensees.
0
$10
$20
$30
$40
$50
$60
$70
4Q05 4Q06 4Q07 4Q08 4Q09
USD in Billions
4Q10 4Q11 1Q12E
John West, CFA
Research Affiliates Newsletter · April 2012
asset allocation component to address the higher volatility and more frequent dislocations found in these asset classes.
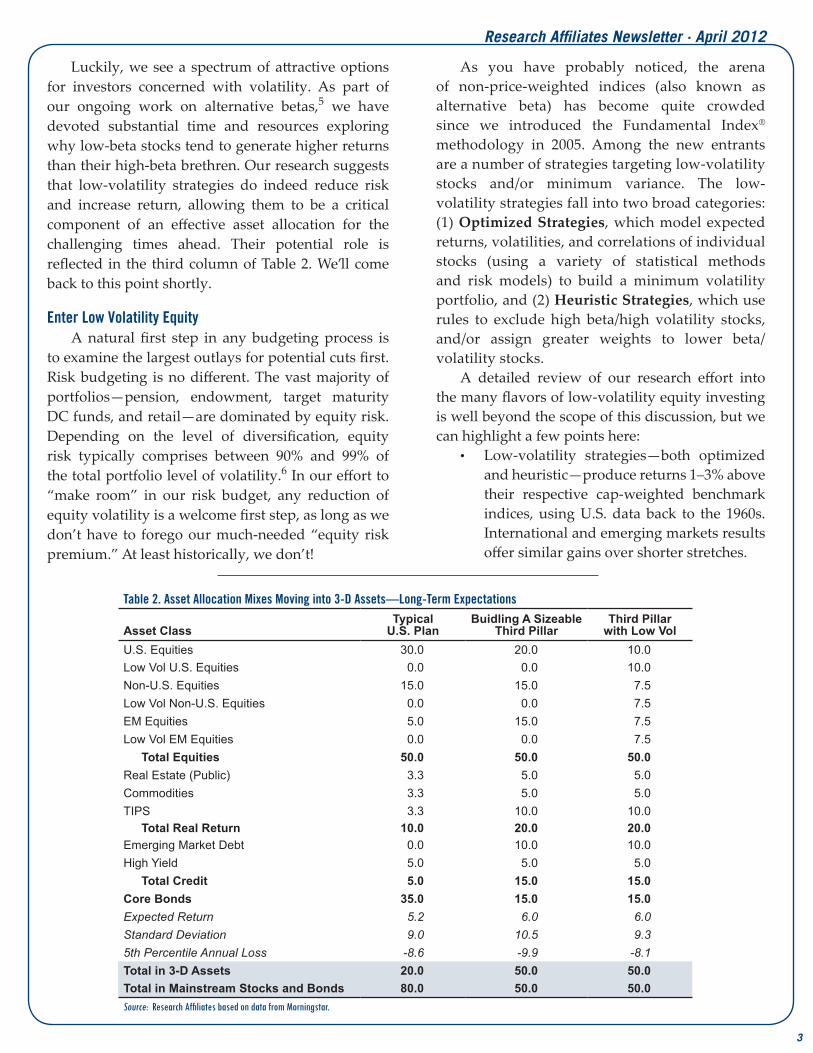
Our inflation fighting toolkit includes an array of assets that can shelter us from the growing 3-D hurricane.2 These include both the traditional real return asset classes (TIPS, commodities, and REITs) and a set of “Stealth Inflation Fighters” such as emerging market debt, high yield, and bank loans. Typically, the volatility of these asset classes is higher than mainstream stocks and bonds, as the highlighted lines show in Table 1. For many investors, these asset classes “feel” even riskier, due to their large “tracking error” relative to our classically invested 60/40 peers. After all, while no investor likes losses, there are few more lonely feelings than “wrong and alone,” as Peter Bernstein liked to say.
Given their credit exposure and in some cases currency and political considerations, it is not surprising that the income-oriented assets like emerging market debt, high-yield debt, and bank loans have higher volatility levels than a core bond portfolio. Even TIPS, immune to credit risks, have posted higher volatility than the BarCap Aggregate Bond Index. Likewise in growth assets, we find the upper end of the risk spectrum’s favored 3-D assets have higher risk profiles than mainstream stocks as measured by the S&P 500. Commodities, REITs, and emerging markets equities all provide additional incremental risk. If volatility is your currency, inflation protection is a pricey proposition.
We expect this trend to continue. None of these assets is as widely held as mainstream asset classes,
and are among the first to be abandoned in times of crisis. These asset classes also represent much smaller markets in terms of total size, which makes them susceptible to trend chasing.
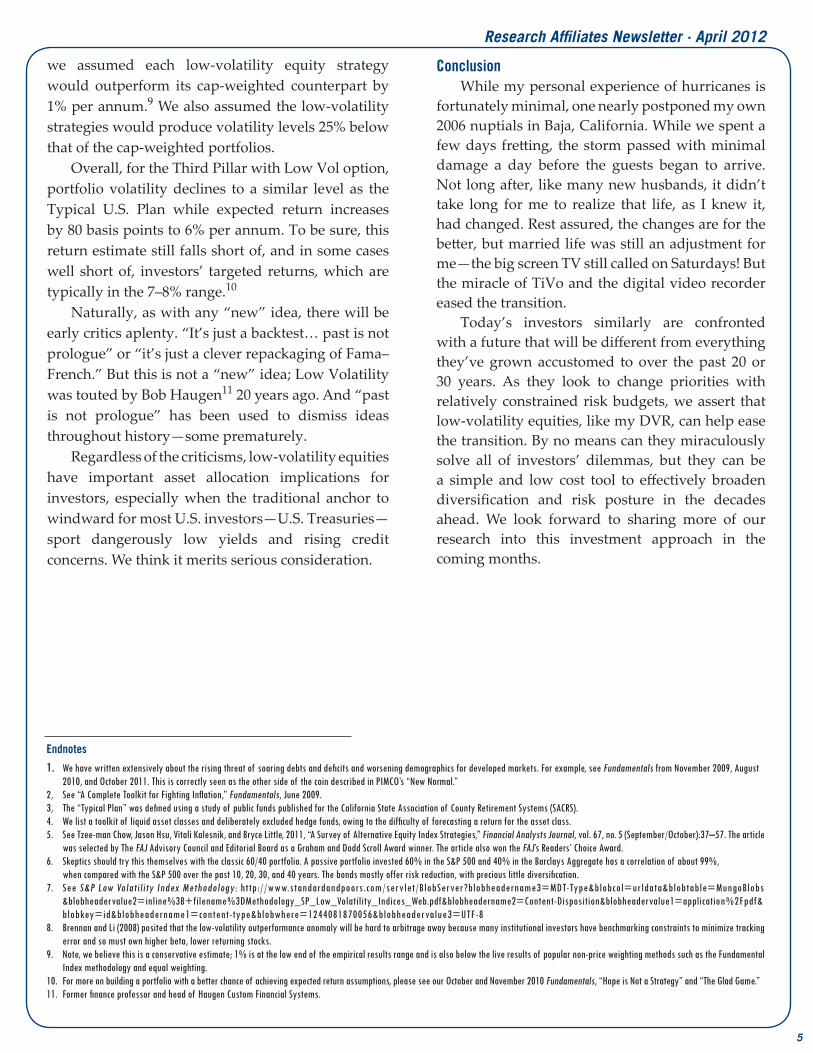
So, how much would volatility increase with the Third Pillar of real return assets? To estimate the increased volatility, we compare a “Typical U.S. Plan” with one that includes a third pillar of real return assets.3,4 The Typical U.S. Plan shown in Table 2 sports an 80% mainstream markets/20% Third Pillar split, and a projected long-term (10-plus years) volatility of around 9%—not all that different from the realized standard deviation of a 60% S&P 500/40% BarCap Aggregate Bond Index over the past 20 years. We contrast this with a 50/50 blend of mainstream and Third Pillar assets (labeled “Building a Sizeable Third Pillar”), which results in an annual portfolio volatility of 10.5% versus the 9.0% standard deviation level for the Typical U.S. Plan. To be sure, the Third Pillar assets have some diversification benefit, but their near-universal higher volatility levels still result in a 16% increase in total portfolio standard deviation.
When the overwhelming trend is to de-risk client portfolios, such an outcome would be unacceptable regardless of the perceived long-term benefits of such an approach. Even if the headline optics can be overcome, a poor start would likely doom such a strategy (and importantly the investment officer who recommended it!). This situation begs the question, “Can we reduce risk in other areas to allow us to spend more of our risk budget on these 3-D favored assets?”
Table 1. Historical Volatility of Selected Asset Classes, October 1997–December 2011
Asset Class IndexOctober 1997-December 2011
Standard Deviation (%)Core Bonds BarCap US Agg Bond 3.68TIPS BarCap Gbl Infl Linked US TIPS 5.09Emerging Local Currency JPM ELMI+ 8.38Bank Loans Credit Suisse Leveraged Loan 9.68High Yield BarCap US Corporate High Yield 12.01Emerging Market Debt JPM EMBI Plus 12.44Large Company U.S. Equity S&P 500 19.55Commodities DJ UBS Commodity 19.86International Equity MSCI EAFE GR 22.79REITs FTSE NAREIT All REITS 24.53Emerging Markets Equity MSCI EM GR 32.65Source: Research Affiliates based on data from Morningstar.
2
3
Research Affiliates Newsletter · April 2012
Luckily, we see a spectrum of attractive options for investors concerned with volatility. As part of our ongoing work on alternative betas,5 we have devoted substantial time and resources exploring why low-beta stocks tend to generate higher returns than their high-beta brethren. Our research suggests that low-volatility strategies do indeed reduce risk and increase return, allowing them to be a critical component of an effective asset allocation for the challenging times ahead. Their potential role is reflected in the third column of Table 2. We’ll come back to this point shortly.
Enter Low Volatility EquityA natural first step in any budgeting process is
to examine the largest outlays for potential cuts first. Risk budgeting is no different. The vast majority of portfolios—pension, endowment, target maturity DC funds, and retail—are dominated by equity risk. Depending on the level of diversification, equity risk typically comprises between 90% and 99% of the total portfolio level of volatility.6 In our effort to “make room” in our risk budget, any reduction of equity volatility is a welcome first step, as long as we don’t have to forego our much-needed “equity risk premium.” At least historically, we don’t!
As you have probably noticed, the arena of non-price-weighted indices (also known as alternative beta) has become quite crowded since we introduced the Fundamental Index® methodology in 2005. Among the new entrants are a number of strategies targeting low-volatility stocks and/or minimum variance. The low-volatility strategies fall into two broad categories: (1) Optimized Strategies, which model expected returns, volatilities, and correlations of individual stocks (using a variety of statistical methods and risk models) to build a minimum volatility portfolio, and (2) Heuristic Strategies, which use rules to exclude high beta/high volatility stocks, and/or assign greater weights to lower beta/volatility stocks.
A detailed review of our research effort into the many flavors of low-volatility equity investing is well beyond the scope of this discussion, but we can highlight a few points here:
• Low-volatility strategies—both optimized and heuristic—produce returns 1–3% above their respective cap-weighted benchmark indices, using U.S. data back to the 1960s. International and emerging markets results offer similar gains over shorter stretches.
Table 2. Asset Allocation Mixes Moving into 3-D Assets—Long-Term Expectations
Asset ClassTypical
U.S. PlanBuidling A Sizeable
Third PillarThird Pillar
with Low VolU.S. Equities 30.0 20.0 10.0Low Vol U.S. Equities 0.0 0.0 10.0Non-U.S. Equities 15.0 15.0 7.5Low Vol Non-U.S. Equities 0.0 0.0 7.5EM Equities 5.0 15.0 7.5Low Vol EM Equities 0.0 0.0 7.5
Total Equities 50.0 50.0 50.0Real Estate (Public) 3.3 5.0 5.0Commodities 3.3 5.0 5.0TIPS 3.3 10.0 10.0
Total Real Return 10.0 20.0 20.0Emerging Market Debt 0.0 10.0 10.0High Yield 5.0 5.0 5.0
Total Credit 5.0 15.0 15.0Core Bonds 35.0 15.0 15.0Expected Return 5.2 6.0 6.0Standard Deviation 9.0 10.5 9.35th Percentile Annual Loss -8.6 -9.9 -8.1Total in 3-D Assets 20.0 50.0 50.0Total in Mainstream Stocks and Bonds 80.0 50.0 50.0Source: Research Affiliates based on data from Morningstar.

4
Research Affiliates Newsletter · April 2012
• Both Optimized and Heuristic approaches show very tightly clustered risk reduction, averaging about 25% less volatility than the cap-weighted benchmark (e.g., reducing volatility from 16% for the S&P 500 to about 12% for a low-volatility strategy).
• Nearly all methods tested produced sizeable tracking errors (8–10%) to cap weighting.
We can validate these findings by examining the published results of the S&P Low Volatility series, a heuristic-based approach that selects low beta stocks and weights them by the inverse of beta.7 Launched in 2011 with data backfilled to various start dates, Standard and Poor’s has a U.S., a non-U.S., and emerging market variant of the low volatility strategy.
As Table 3 shows, the S&P Low Volatility indices are consistent with our simulated research results. For the U.S. market, the S&P 500 Low Volatility Index produced an annualized return of 10.5% versus 9.3%. This 1.2% percentage point excess return was accompanied by a 25% reduction in portfolio volatility (12.5% versus 16.6%). The non-U.S. and emerging markets low-volatility strategies produced even better risk-adjusted results. And, consistent with our research, the tracking errors for all of these indices are very large—9% to 11%.8
Of course, the traditional backtesting caveats apply to these results, especially in the case of low volatility strategies spanning a decade dominated by the bookend bear markets of the Tech Bubble and Global Financial Crisis. On the opposite side of the ledger, the excess returns for the low-volatility strategies are very similar to other non-price-weighted indices over the same time periods. If such disparate weighting methods as the Fundamental Index methodology and equal weighting produce similar excess returns,
then an excess return from weighting by the inverse of volatility should have a similar expected result. Shocking to the casual observer, high-vol and low-vol both beat the market, by comparable margins, as long as the portfolio weights are indifferent to price!
Of course, we are comparing paper portfolios that do not reflect the real friction of transaction costs and market impact. In the real world, these costs are significant and investors should take steps to minimize them. Therefore, an efficient low-volatility equity portfolio ought to:
• maximize liquidity, • minimize turnover, and • maintain some semblance of economic
representation. In addition to these portfolio attributes, the
construction methodology should be easy to understand and replicate, given the proclivity of passive investors for simple and transparent solutions. Our research has indicated that the current low-volatility indices all fall short on one or more of these goals, so they arguably cannot be used as core strategies.
Putting it TogetherA 25% reduction in equity volatility is
meaningful. If we can save that much with our dominant total portfolio risk contributor, we should have the risk budget to include higher-risk real return asset classes, right? The answer is “yes,” as we show in the third column of Table 2 (Third Pillar with Low Vol). Here, we replace half of each equity exposure with a comparable low-volatility exposure. Consistent with our empirical findings,
Table 3. Results of S&P Family of Low Volatility Indices through February 29, 2012
IndexAnnualized Return (%)
Standard Deviation (%)
Excess Return (%)
Risk Reduction
Tracking Error (%) Inception
S&P 500 Low Vol 10.46 12.50 1.19 25% 10.0 Dec-90S&P 500 9.27 16.56 S&P BMI International Developed Low Vol 10.70 13.20 4.86 27% 9.1 Jul-91MSCI EAFE 5.84 18.16 S&P BMI Emerging Markets Low Vol 11.95 20.19 3.81 32% 11.5 Oct-97MSCI EM 8.14 29.59 Source: Research Affiliates based on data from Bloomberg.
5
Research Affiliates Newsletter · April 2012
we assumed each low-volatility equity strategy would outperform its cap-weighted counterpart by 1% per annum.9 We also assumed the low-volatility strategies would produce volatility levels 25% below that of the cap-weighted portfolios.
Overall, for the Third Pillar with Low Vol option, portfolio volatility declines to a similar level as the Typical U.S. Plan while expected return increases by 80 basis points to 6% per annum. To be sure, this return estimate still falls short of, and in some cases well short of, investors’ targeted returns, which are typically in the 7–8% range.10
Naturally, as with any “new” idea, there will be early critics aplenty. “It’s just a backtest… past is not prologue” or “it’s just a clever repackaging of Fama–French.” But this is not a “new” idea; Low Volatility was touted by Bob Haugen11 20 years ago. And “past is not prologue” has been used to dismiss ideas throughout history—some prematurely.
Regardless of the criticisms, low-volatility equities have important asset allocation implications for investors, especially when the traditional anchor to windward for most U.S. investors—U.S. Treasuries—sport dangerously low yields and rising credit concerns. We think it merits serious consideration.
ConclusionWhile my personal experience of hurricanes is
fortunately minimal, one nearly postponed my own 2006 nuptials in Baja, California. While we spent a few days fretting, the storm passed with minimal damage a day before the guests began to arrive. Not long after, like many new husbands, it didn’t take long for me to realize that life, as I knew it, had changed. Rest assured, the changes are for the better, but married life was still an adjustment for me—the big screen TV still called on Saturdays! But the miracle of TiVo and the digital video recorder eased the transition.
Today’s investors similarly are confronted with a future that will be different from everything they’ve grown accustomed to over the past 20 or 30 years. As they look to change priorities with relatively constrained risk budgets, we assert that low-volatility equities, like my DVR, can help ease the transition. By no means can they miraculously solve all of investors’ dilemmas, but they can be a simple and low cost tool to effectively broaden diversification and risk posture in the decades ahead. We look forward to sharing more of our research into this investment approach in the coming months.
Endnotes
1. We have written extensively about the rising threat of soaring debts and deficits and worsening demographics for developed markets. For example, see Fundamentals from November 2009, August 2010, and October 2011. This is correctly seen as the other side of the coin described in PIMCO’s “New Normal.”2, See “A Complete Toolkit for Fighting Inflation,” Fundamentals, June 2009.3, The “Typical Plan” was defined using a study of public funds published for the California State Association of County Retirement Systems (SACRS).4. We list a toolkit of liquid asset classes and deliberately excluded hedge funds, owing to the difficulty of forecasting a return for the asset class. 5. See Tzee-man Chow, Jason Hsu, Vitali Kalesnik, and Bryce Little, 2011, “A Survey of Alternative Equity Index Strategies,” Financial Analysts Journal, vol. 67, no. 5 (September/October):37–57. The article was selected by The FAJ Advisory Council and Editorial Board as a Graham and Dodd Scroll Award winner. The article also won the FAJ’s Readers’ Choice Award.6. Skeptics should try this themselves with the classic 60/40 portfolio. A passive portfolio invested 60% in the S&P 500 and 40% in the Barclays Aggregate has a correlation of about 99%, when compared with the S&P 500 over the past 10, 20, 30, and 40 years. The bonds mostly offer risk reduction, with precious little diversification.7. See S&P Low Volatility Index Methodology: http://www.standardandpoors.com/servlet/BlobServer?blobheadername3=MDT-Type&blobcol=urldata&blobtable=MungoBlobs &blobheadervalue2=inline%3B+filename%3DMethodology_SP_Low_Volatility_Indices_Web.pdf&blobheadername2=Content-Disposition&blobheadervalue1=application%2Fpdf& blobkey=id&blobheadername1=content-type&blobwhere=1244081870056&blobheadervalue3=UTF-8 8. Brennan and Li (2008) posited that the low-volatility outperformance anomaly will be hard to arbitrage away because many institutional investors have benchmarking constraints to minimize tracking error and so must own higher beta, lower returning stocks. 9. Note, we believe this is a conservative estimate; 1% is at the low end of the empirical results range and is also below the live results of popular non-price weighting methods such as the Fundamental Index methodology and equal weighting.10. For more on building a portfolio with a better chance of achieving expected return assumptions, please see our October and November 2010 Fundamentals, “Hope is Not a Strategy” and “The Glad Game.”11. Former finance professor and head of Haugen Custom Financial Systems.

6
Research Affiliates Newsletter · April 2012
FTSE RAFI® Equity Index Series*
TOTAL RETURN AS OF 3/31/12 BLOOMBERG TICKER YTD 12 MONTH ANNUALIZED
3 YEARANNUALIZED
5 YEARANNUALIZED
10 YEAR
ANNUALIZED10 YEAR
VOLATILITYFTSE RAFI® All World 30001 TFRAW3 11.17% -3.91% 24.83% 1.47% 9.31% 19.18%
MSCI All Country World2 GDUEACWF 12.02% -0.19% 21.38% 0.34% 5.86% 17.49%FTSE RAFI® Developed ex US 10003 FRX1XTR 10.58% -9.98% 19.90% -2.12% 8.02% 20.50%
MSCI World ex US Large Cap4 MLCUWXUG 10.24% -5.99% 17.56% -2.38% 6.09% 18.63%FTSE RAFI® Developed ex US Mid Small5 TFRDXUSU 11.83% -5.17% 27.34% 1.67% 13.77% 18.93%
MSCI World ex US Small Cap6 GCUDWXUS 13.72% -7.02% 25.85% -1.74% 10.56% 20.58%FTSE RAFI® Emerging Markets7 TFREMU 14.26% -9.03% 26.31% 7.78% 20.73% 24.96%
MSCI Emerging Markets8 GDUEEGF 14.14% -8.52% 25.42% 4.97% 14.47% 24.46%FTSE RAFI® 10009 FR10XTR 11.36% 4.96% 30.16% 2.90% 6.11% 18.28%
Russell 100010 RU10INTR 12.90% 7.86% 24.03% 2.19% 4.53% 16.18%S&P 50011 SPTR 12.59% 8.54% 23.42% 2.01% 4.12% 15.96%
FTSE RAFI® US 150012 FR15USTR 13.82% -0.45% 36.64% 5.11% 10.25% 22.81%Russell 200013 RU20INTR 12.44% -0.18% 26.90% 2.13% 6.45% 21.07%
FTSE RAFI® Europe14 TFREUE 10.36% -13.06% 19.05% -3.98% 7.40% 23.26%MSCI Europe15 GDDLE15 10.81% -6.94% 18.34% -3.39% 5.98% 20.81%
FTSE RAFI® Australia16 FRAUSTR 9.05% -4.62% 27.10% 4.00% 14.60% 23.04%S&P/ASX 20017 ASA51 9.53% -5.90% 27.09% 2.96% 14.27% 23.57%
FTSE RAFI® Canada18 FRCANTR 8.87% -9.15% 28.72% 6.47% 13.98% 21.58%S&P/TSX 6019 TX60AR 6.52% -12.57% 22.21% 4.37% 12.27% 21.81%
FTSE RAFI® Japan20 FRJPNTR 10.83% -0.52% 13.48% -3.68% 6.25% 17.26%MSCI Japan21 GDDLJN 11.35% 0.42% 12.09% -5.07% 4.07% 16.96%
FTSE RAFI® UK22 FRGBRTR 7.80% 1.15% 23.85% -2.96% 6.25% 20.19%MSCI UK23 GDDLUK 7.64% 1.10% 22.37% -2.31% 5.61% 18.27%
*To see the complete series, please go to: http://www.ftse.com/Indices/FTSE_RAFI_Index_Series/index.jsp.
Russell Fundamental Index® Series*
TOTAL RETURN AS OF 3/31/12 BLOOMBERG TICKER YTD 12 MONTH ANNUALIZED
3 YEARANNUALIZED
5 YEARANNUALIZED
10 YEAR
ANNUALIZED10 YEAR
VOLATILITYRussell Fundamental Global Index Large Company24 RUFGLTU 11.36% -1.17% 23.49% 2.35% 9.49% 17.86%
MSCI All Country World Large Cap25 MLCUAWOG 11.85% 0.28% 20.63% 0.39% 5.33% 17.17%Russell Fundamental Developed ex US Index Large Company26 RUFDXLTU 10.59% -8.09% 18.23% -0.97% 9.61% 18.91%
MSCI World ex US Large Cap27 MLCUWXUG 10.24% -5.99% 17.56% -2.38% 6.09% 18.63%Russell Fundamental Developed ex US Index Small Company28 RUFDXSTU 13.44% -2.08% 25.94% 1.12% 13.13% 18.54%
MSCI World ex US Small Cap6 GCUDWXUS 13.72% -7.02% 25.85% -1.74% 10.56% 20.58%Russell Fundamental Emerging Markets29 RUFGETRU 15.33% -6.80% 28.61% 9.26% 20.24% 24.71%
MSCI Emerging Markets8 GDUEEGF 14.14% -8.52% 25.42% 4.97% 14.47% 24.46%Russell Fundamental US Index Large Company30 RUFUSLTU 11.44% 6.93% 27.00% 3.66% 6.80% 16.78%
Russell 100010 RU10INTR 12.90% 7.86% 24.03% 2.19% 4.53% 16.18%S&P 50011 SPTR 12.59% 8.54% 23.42% 2.01% 4.12% 15.96%
Russell Fundamental US Index Small Company31 RUFUSSTU 13.92% 0.86% 35.85% 6.30% 10.97% 21.52%Russell 200013 RU20INTR 12.44% -0.18% 26.90% 2.13% 6.45% 21.07%
Russell Fundamental Europe32 RUFEUTE 11.59% -10.67% 20.11% -1.68% 10.30% 22.29%MSCI Europe15 GDDLE15 10.81% -6.94% 18.34% -3.39% 5.98% 20.81%
*To see the complete series, please go to: http://www.russell.com/indexes/data/Fundamental/About_Russell_Fundamental_indexes.asp.
Fixed Income/Alternatives
TOTAL RETURN AS OF 3/31/12 BLOOMBERG TICKER YTD 12 MONTH ANNUALIZED
3 YEARANNUALIZED
5 YEARANNUALIZED
10 YEAR
ANNUALIZED10 YEAR
VOLATILITYRAFI® Bonds Investment Grade Master33 1.88% 10.26% 13.15% 7.78% 6.89% 6.07%
ML Corporate Master34 C0A0 2.44% 9.07% 13.59% 6.76% 6.61% 6.24%RAFI® Bonds High Yield Master35 4.98% 8.67% 24.43% 10.29% 9.75% 10.93%
ML Corporate Master II High Yield BB-B36 H0A4 4.42% 6.23% 20.08% 7.10% 8.03% 9.83%RAFI® US Equity Long/Short37 -1.31% -7.82% 13.48% 0.96% 4.40% 11.71%
1-Month T-Bill38 GB1M 0.01% 0.04% 0.08% 0.98% 1.72% 0.49%FTSE RAFI® Global ex US Real Estate39 FRXR 13.58% -11.56% 27.24% — — —
FTSE EPRA/NAREIT Global ex US40 EGXU 15.53% -4.25% 24.01% — — —FTSE RAFI® US 100 Real Estate41 FRUR 12.52% 6.43% 49.54% — — —
FTSE EPRA/NAREIT United States42 UNUS 10.87% 12.42% 43.25% — — —Citi RAFI® Sovereign Developed Markets Bond Index Master43 CRFDMU 1.45% 5.77% 7.14% 6.70% 8.89% 7.96%
Merrill Lynch Global Governments Bond Index II44 W0G1 -0.64% 5.50% 6.41% 6.83% 7.89% 7.31%Citi RAFI® Sovereign Emerging Markets Local Currency Bond Index Master45 CRFELMU 7.13% — — — — —
JPMorgan GBI-EM Global Diversified46 JGENVUUG 8.30% — — — — —
Performance Update
®

7
Research Affiliates Newsletter · April 2012
®
©2012 Research Affiliates, LLC. The material contained in this document is for general information purposes only. It relates only to a hypothetical model of past performance of the Fundamental Index® strategy itself, and not to any asset management products based on this index. No allowance has been made for trading costs or management fees which would reduce investment performance. Actual results may differ. This material is not intended as an offer or a solicitation for the purchase and/or sale of any security or financial instrument, nor is it advice or a recommendation to enter into any transaction. This material is based on information that is considered to be reliable, but Research Affiliates® and its related entities (collectively “RA”) make this information available on an “as is” basis and make no warranties, express or implied regarding the accuracy of the information contained herein, for any particular purpose. RA is not responsible for any errors or omissions or for results obtained from the use of this information. Nothing contained in this material is intended to constitute legal, tax, securities, financial or investment advice, nor an opinion regarding the appropriateness of any investment. The general information contained in this material should not be acted upon without obtaining specific legal, tax or investment advice from a licensed professional. Indexes are not managed investment products, and, as such cannot be invested in directly. Returns represent back-tested performance based on rules used in the creation of the index, are not a guarantee of future performance and are not indicative of any specific investment. Research Affiliates, LLC, is an investment adviser registered under the Investment Advisors Act of 1940 with the U.S. Securities and Exchange Commission (SEC).
The RAFI® US Equity Long/Short Index is calculated by Dow Jones Indexes, the marketing name and a licensed trademark of CME Group Index Services LLC (“CME Indexes”). “Dow Jones Indexes” is a service mark of Dow Jones Trademark Holdings LLC (“Dow Jones”). The RAFI® US Investment Grade Bond Index and RAFI® US High Yield Bond Index is calculated by ALM Research Solutions, LLC. in conjunction with Research Affiliates, LLC. All rights and interests in the RAFI® US Investment Grade Bond Index and the RAFI® US High Yield Bond Index vest in Research Affiliates, LLC. All rights in and to the Research Affiliates, LLC Fundamental Index® concept used in the calculation of the RAFI® US Investment Grade Bond Index and the RAFI® US High Yield Bond Index vest in Research Affiliates, LLC. The above RAFI® indexes are not sponsored or promoted by CME Indexes, ALM Research Solutions, LLC or their respective affiliates.
Neither CME Indexes, ALM Solutions, nor Research Affiliates, LLC make any warranties, express or implied, to any of their customers nor anyone else regarding the accuracy or completeness of any data related to the RAFI® US Equity Long/Short Index, RAFI® US Investment Grade Bond Index, or the RAFI® US High Yield Bond Index. All information is provided for information purposes only. Neither CME Indexes, ALM Solutions, LLC, nor Research Affiliates, LLC accept any liability for any errors or any loss arising from the use of information in this publication.
Russell Investments is the source and owner of the Russell Index data contained or reflected in this material and copyrights related thereto. Russell Investments and Research Affiliates, LLC have entered into a strategic alliance with respect to the Russell Fundamental Indexes. Subject to Research Affiliates, LLC’s intellectual property rights in certain content, Russell Investments is the owner of all copyrights related to the Russell Fundamental Indexes. Russell Investments and Research Affiliates, LLC jointly own all trademark and service mark rights in and to the Russell Fundamental Indexes. Research Affiliates, LLC is the owner of the trademarks, service marks, patents and copyrights related to the Fundamental Index and the Fundamental Index methodology. The presentation may contain confidential information and unauthorized use, disclosure, copying, dissemination, or redistribution is strictly prohibited. This is a presentation of Research Affiliates, LLC. Russell Investments is not responsible for the formatting or configuration of this material or for any inaccuracy in Research Affiliates’ presentation thereof.
The trade names Fundamental Index®, RAFI®, the RAFI logo, and the Research Affiliates® corporate name and logo are registered trademarks and are the exclusive intellectual property of RA. Any use of these trade names and logos without the prior written permission of RA is expressly prohibited. RA reserves the right to take any and all necessary action to preserve all of its rights, title and interest in and to these marks. Fundamental Index® concept, the non-capitalization method for creating and weighting of an index of securities, is patented and patent-pending proprietary intellectual property of RA. (US Patent No. 7,620,577; 7,747,502; 7,792,719; 7,778,905; and 8,005,740; Patent Pending Publ. Nos. US-2007-0055598-A1, US-2008-0288416-A1, US-2010-0191628, US-2010-0262563, WO 2005/076812, WO 2007/078399 A2, WO 2008/118372,EPN 1733352, and HK1099110).
The views and opinions expressed are those of the author and not necessarily those of Research Affiliates, LLC. The opinions are subject to change without notice.
Definition of Indices: (1) The FTSE RAFI® All World 3000 Index is a measure of the largest 3,000 companies, selected and weighted using fundamental factors; (sales, cash flow, dividends, book value), across both developed and emerging markets. (2) The MSCI All Country World Index is a free float-adjusted market capitalization weighted index that is designed to measure the equity market performance of developed and emerging markets. (3) The FTSE RAFI® Developed ex US 1000 Index is a measure of the largest 1000 non U.S. listed, developed market companies, selected and weighted using fundamental factors; (sales, cash flow, dividends, book value). (4) The MSCI World ex US Large Cap Index is a free float-adjusted market capitalization weighted index that is designed to measure the equity market performance of developed markets, excluding the United States. (5) The FTSE RAFI® Developed ex US Mid Small Index tracks the performance of small and mid-cap companies domiciled in developed international markets (excluding the United States), selected and weighted based on the following four fundamental measures of firm size: sales, cash flow, dividends and book value. (6) The MSCI World ex US Small Cap Index is a free float-adjusted market capitalization weighted index that is designed to measure the equity market performance of small cap developed markets, excluding the United States. (7) The FTSE RAFI® Emerging Markets Index comprises the largest 350 Emerging Market companies selected and weighted using fundamental factors (sales, cash flow, dividends, book value). (8) The MSCI Emerging Markets Index is an unmanaged, free-float-adjusted cap-weighted index designed to measure equity market performance of emerging markets. (9) The FTSE RAFI® 1000 Index is a measure of the largest 1,000 U.S. listed companies, selected and weighted using fundamental factors; (sales, cash flow, dividends, book value).(10) The Russell 1000 Index is a market-capitalization-weighted benchmark index made up of the 1,000 highest-ranking U.S. stocks in the Russell 3000. (11) The S&P 500 Index is an unmanaged market index that focuses on the large-cap segment of the U.S. equities market. (12) The FTSE RAFI® US 1500 Index is a measure of the 1,001st to 2,500th largest U.S. listed companies, selected and weighted using fundamental factors; (sales, cash flow, dividends, book value).(13) The Russell 2000 is a market-capitalization weighted benchmark index made up of the 2,000 smallest U.S. companies in the Russell 3000. (14) The FTSE RAFI® Europe Index is comprised of all European companies listed in the FTSE RAFI® Developed ex U.S. 1000 Index, which in turn is comprised of the largest 1,000 non U.S. listed developed market companies, selected and weighted using fundamental factors; (sales, cash flow, dividends, book value).(15) The MSCI Europe Index is a free-float adjusted market capitalization weighted index that is designed to measure the equity market performance of the developed markets in Europe.(16) The FTSE RAFI® Australia Index is comprised of all Australian companies listed in the FTSE RAFI® Developed ex U.S. 1000 Index, which in turn is comprised of the largest 1,000 non U.S. listed developed market companies, selected and weighted using fundamental factors; (sales, cash flow, dividends, book value).(17) The S&P/ASX 200 Index, representing approximately 78% of the Australian equity market, is a free-float-adjusted, cap-weighted index. (18) The FTSE RAFI® Canada Index is comprised of all Canadian companies listed in the FTSE RAFI® Developed ex U.S. 1000 Index, which in turn is comprised of the largest 1,000 non U.S. listed developed market companies, selected and weighted using fundamental factors; (sales, cash flow, dividends, book value).(19) The S&P/Toronto Stock Exchange (TSX) 60 is a cap-weighted index consisting of 60 of the largest and most liquid (heavily traded) stocks listed on the TSX, usually domestic or multinational industry leaders. (20) The FTSE RAFI® Japan Index is comprised of all Japanese companies listed in the FTSE RAFI® Developed ex U.S. 1000 Index, which in turn is comprised of the largest 1,000 non U.S. listed developed market companies, selected and weighted using fundamental factors; (sales, cash flow, dividends, book value).(21) The MSCI Japan Index is an unmanaged, free-float-adjusted cap-weighted index that aims to capture 85% of the publicly available total market capitalization of the Japanese equity market. (22) The FTSE RAFI® UK Index is comprised of all UK companies listed in the FTSE RAFI® Developed ex U.S. 1000 Index, which in turn is comprised of the largest 1,000 non U.S. listed developed market companies, selected and weighted using fundamental factors; (sales, cash flow, dividends, book value).(23) The MSCI UK Index is an unmanaged, free-float-adjusted cap-weighted index that aims to capture 85% of the publicly available total market capitalization of the British equity market. (24) The Russell Fundamental Global Index Large Company is a measure of the largest companies, selected and weighted using fundamental factors; (adjusted sales, retained cash flow, dividends + buybacks), across both developed and emerging markets.(25) The MSCI All Country World Large Cap Index is a free float-adjusted market capitalization weighted index that is designed to measure the equity market performance of developed and emerging markets.(26) The Russell Fundamental Developed ex US Large Company is a subset of the Russell Fundamental Developed ex US Index, and is a measure of the largest non-U.S. listed developed country companies, selected and weighted using fundamental factors; (adjusted sales, retained cash flow, dividends + buybacks).(27) The MSCI World ex US Large Cap Index is a free float-adjusted market capitalization weighted index that is designed to measure the equity market performance of large cap-developed markets, excluding the United States.(28) The Russell Fundamental Developed ex US Index Small Company is a subset of the Russell Fundamental Developed ex US Index, and is a measure of small non-U.S. listed developed country companies, selected and weighted using fundamental factors; (adjusted sales, retained cash flow, dividends + buybacks).(29) The Russell Fundamental Emerging Markets Index is a measure of Emerging Market companies, selected and weighted using fundamental factors; (adjusted sales, retained cash flow, dividends + buybacks).(30) The Russell Fundamental U.S. Index Large Company is a subset of the Russell Fundamental US Index, and is a measure of the largest U.S. listed companies, selected and weighted using fundamental measures; (adjusted sales, retained cash flow, dividends + buybacks). (31) The Russell Fundamental US Index Small Company is a subset of the Russell Fundamental US Index, and is a measure of U.S. listed small companies, selected and weighted using fundamental measures; (adjusted sales, retained cash flow, dividends + buybacks).(32) The Russell Fundamental Europe Index is a measure of European companies, selected and weighted using fundamental factors; (adjusted sales, retained cash flow, dividends + buybacks).(33) The RAFI® Bonds Investment Grade Master Index is a U.S. investment-grade corporate bond index comprised of non-zero fixed coupon debt with maturities ranging from 1 to 30 years issued by publicly traded companies. The issuers held in the index are weighted by a combination of four measures of their fundamental size—sales, cash flow, dividends, and book value of assets.(34) The Merrill Lynch U.S. Corporate Master Index is representative of the entire U.S. corporate bond market. The index includes dollar-denominated investment-grade corporate public debt issued in the U.S. bond market. (35) The RAFI® Bonds High Yield Master is a U.S. high-yield corporate bond index comprised of non-zero fixed coupon debt with maturities ranging from 1 to 30 years issued by publicly traded companies. The issuers held in the index are weighted by a combination of four measures of their fundamental size—sales, cash flow, dividends, and book value of assets. (36) The Merrill Lynch Corporate Master II High Yield BB-B Index is representative of the U.S. high yield bond market. The index includes domestic high-yield bonds, including deferred interest bonds and payment-in-kind securities. Issues included in the index have maturities of one year or more and have a credit rating lower than BBB-/Baa3, but are not in default. (37) The RAFI® US Equity Long/Short Index utilizes the Research Affiliates Fundamental Index® (RAFI®) methodology to identify opportunities that are implemented through long and short securities positions for a selection of U.S. domiciled publicly traded companies listed on major exchanges. Returns for the index are collateralized and represent the return of the strategy plus the return of a cash collateral yield. (38) The 1-Month T-bill return is calculated using the Bloomberg Generic 1-month T-bill. The index is interpolated based off of the currently active U.S. 1 Month T-bill and the cash management bill closest to maturing 30 days from today. (39) The FTSE RAFI® Global ex US Real Estate Index comprises 150 companies with the largest RAFI fundamental values selected from the constituents of the FTSE Global All Cap ex U.S. Index that are classified by the Industry Classification Benchmark (ICB) as Real Estate.(40) The FTSE EPRA/NAREIT Global ex US Index is a free float-adjusted index, and is designed to represent general trends in eligible listed real estate stocks worldwide, excluding the United State. Relevant real estate activities are defined as the ownership, trading and development of income-producing real estate.(41) The FTSE RAFI® US 100 Real Estate Index comprises of the 100 U.S. companies with the largest RAFI fundamental values selected from the constituents of the FTSE USA All Cap Index that are classified by the Industry Classification Benchmark (ICB) as Real Estate.(42) The FTSE EPRA/NAREIT United States Index is a free float-adjusted index, is a subset of the EPRA/NARIET Global Index and the EPRA/NAREIT North America Index and contains publicly quoted real estate companies that meet the EPRA Ground Rules. EPRA/NARIET Index series is seen as the representative benchmark for the real estate sector.(43) The Citi RAFI® Sovereign Developed Markets Bond Index Series seeks to reflect exposure to the government securities of a universe of 23 developed markets. By weighting components by their fundamentals, the indices aim to represent each country’s economic footprint and proxies for its ability to service debt.(44) The Merrill Lynch Global Government Bond Index II tracks the performance of investment grade sovereign debt publicly issued and denominated in the issuer’s own domestic market and currency.(45) The Citi RAFI® Sovereign Emerging Markets Local Currency Bond Index Series seeks to reflect exposure to the government securities of a universe of 14 emerging markets. By weighting components by their fundamentals, the indices aim to represent each country’s economic footprint and proxies for its ability to service debt.(46) The JPMorgan GBI-EM Diversified Index seeks exposure to the local currency sovereign debt of over 15 countries in the emerging markets.
Source: All index returns are calculated using total return data from Bloomberg and FactSet. Returns for all single country strategies and Europe regional strategies are in local currency. All other returns are in USD.


![The Dilemma [Chapter 1: The Dilemma , Exponential Future]](https://static.fdocuments.in/doc/165x107/58eeb6841a28ab38788b4593/the-dilemma-chapter-1-the-dilemma-exponential-future.jpg)


