The New York times. (New York, N.Y.) (New York, NY) 1919 ...
Upload
rodney-roseCategory
view
213download
0
The New Trend of Travel Demand The New Trend of Travel Demand ModelModel
Lessons learned from the New York Best Lessons learned from the New York Best Practice ModelPractice Model
Kuo-Ann ChiaoKuo-Ann ChiaoDirector of Technical ServicesDirector of Technical Services
New York Metropolitan Transportation CouncilNew York Metropolitan Transportation Council

Many years ago at NYMTC….. We used a Mainframe computer to run our travel demand model
The problem was..When there was a problem,
Even we took apart the computer,

OrDig a hole on the floor,
It was very difficult to find out what was the problem,AndWhere was the problem..

The old fashion computer print outs did not help us too much

NYBPM Study Area
• 20,000,000 population20,000,000 population• 100 population segments100 population segments• 4,000 Transportation Analysis Zones 4,000 Transportation Analysis Zones • 4 time periods4 time periods• 6 trip purposes6 trip purposes• 10 motorized modes10 motorized modes• 4 urban types4 urban types

Location Distribution 1997 Household Travel Survey
A joint project between NYMTC and NJTPA
Location-based 11,000
households 28,000 people 118,000 trips

Uni-directional coding & Ramps
Highway Network
Very large network (52,794 links in 28 county 3 state NY metro area)
4,950 High-level facilities26,385 Arterials10,694 Centroid and external connectors10,765 Other
Unidirectional / dualized codingConflated the network geographyGIS Street Network – TIGER (or LION) Developed in TransCAD SoftwareSOV, HOV2, HOV3+, taxi, truck, other commercial Classified by 21 Primary Link Types for capacities, initial speeds and VDF’s

Link Attributes

Zones System–Census Tract Based
BPM zone boundaries

Transit NetworkTransit Network
Extremely detailed transit coding based on information from MTA and NJ TransitDeveloped in TransCAD 4.0 Each route variation coded as a distinct route:
100 NYC subway routes900 Commuter rail routes2,300 bus routes73,000 transit stops.50 ferry routesIncludes sidewalk network in Manhattan Walk access/egress linksPark - and - Ride

Transit Network

Highlights of NYBPMHighlights of NYBPM
Micro-Simulation choice modelsPopulation synthesis and intra-household travel interactionsJourney-based travel units modeledNon-motorized (pre-mode choice)Mode-Destination Choice (nested logit)Stop frequency and location sub-modelFull multi-modal analysis / assignment

Route-Deviation ConceptRoute-Deviation Concept
Someone give me an example of how do you come to the office today.

Route-Deviation ConceptRoute-Deviation Concept
Origini
Destinjdij
Stopkdik dkj
A journey reflects the real travel characteristics It also reduces the number of trip purposes needed
Trip
JourneJourneyy

General Modeling StructureGeneral Modeling Structure
Journey Generation
Mode & Destination
Time of Day
Assignment
Mic
ro-S
imula
tion

Journey GenerationJourney Generation
Journey Generation
Mode & Destination
Time of Day
Assignment
Synthetic Population
Auto Ownership
Journey Frequency
Socio-Economic Targets
Accessibility
Seed PUMS
LUM
5-Percent Census Public Use Microdata Sample (PUMS) Files

WorkersNon-
WorkersChildren
Man
dato
ryM
aint
enan
ceD
iscr
etio
nary
Work
School
At Work
M
M
M
SchoolSchoolUniversity University
Intra-Household Interaction
Indi
vidu
al T
ime-
Spa
ce C
onst
rain
t
D
D
D
Journey Frequency ModelJourney Frequency Model

Mode & DestinationMode & Destination
Journey Generation
Mode & Destination
Time of Day
Assignment
Pre-Mode
Mot.Dest.
Stop Frequency
Lan
d U
se A
ttra
ctors
LOS
Skim
s
Density
NM Dest.
Mode
Stop Location

Pre-mode Choice: Nested StructurePre-mode Choice: Nested Structure
Non-motorizedMode
MotorizedMode
Destination Choice
Drive AloneTransit/
Shared RideTaxi
Purpose-specific
attractions
Density of attractions

Mode & Destination ChoiceMode & Destination Choice
Pre-Mode Choice
DestinationDestination
Stop Frequency
Motorized
DetailedSub-Mode
ChainUtility
Non-Motorized
Mode
Stop Location
Non-Motor
Mode
Stop-Density
Accessibility
TotalActivityControl

Stop Frequency by PurposeStop Frequency by Purpose
0%10%20%30%40%50%60%70%80%90%
Work-low
Work-med
Work-high
School Univ Atwork
Maint Discr
No stops Outbound Return Both

Stop Frequency by ModeStop Frequency by Mode
0%
10%
20%
30%
40%
50%
60%
70%
80%
Drivealone
Sharedride
Transit Commutrail
Taxi Schoolbus
Other
No stops Outbound Return Both

Stop Distribution by DurationStop Distribution by Duration
0%
10%
20%
30%
40%
50%
60%
70%
80%
< 1 h 1-2 h 2-3 h 3-4 h 4-5 h > 5 h
Activity duration, hours

Mode & Destination ChoiceMode & Destination Choice
Pre-Mode Choice
DestinationDestination
Stop Frequency
Motorized
DetailedSub-Mode
ChainUtility
Non-Motorized
Mode
Stop Location
Non-Motor
Mode
Stop-Density
Accessibility
TotalActivityControl

Stop-Frequency Choice Model
Choice Alternatives Structural Dimensions Utility Components
0 -
No
sto
ps
1 -
Ou
tbo
un
d
2 -
Ret
urn
3 -
Bo
th
Work
School
University
Maintenance
Discretionary
. . . . . . . . .
Journey Purpose
Person Type
WorkSchool
UniversityMaintenance
Discretionary
At Work
Worker
Non-Worker
Child
Income
Car Sufficiency
Mode
SOV, Taxi HOV
Transit
Journey Distance
Stop-Location(Density) Log-Sum
HouseholdComposition
Other JourneysJourney Purpose

At Work
Stop-Location Choice Model
Choice Alternatives Structural Dimensions Utility Components
5 miles
5 miles
20%
Journey Purpose
Person Type
WorkSchool
University
Maintenance
Discretionary
Worker
Non-Worker
Child
Mode
SOV, Taxi HOV
Transit
Journey Leg
Outbound Return
Stop Density (Size)
CombinedImpedance
Route Deviation
Stop Activity
WorkSchool
University
Maintenance
Discretionary
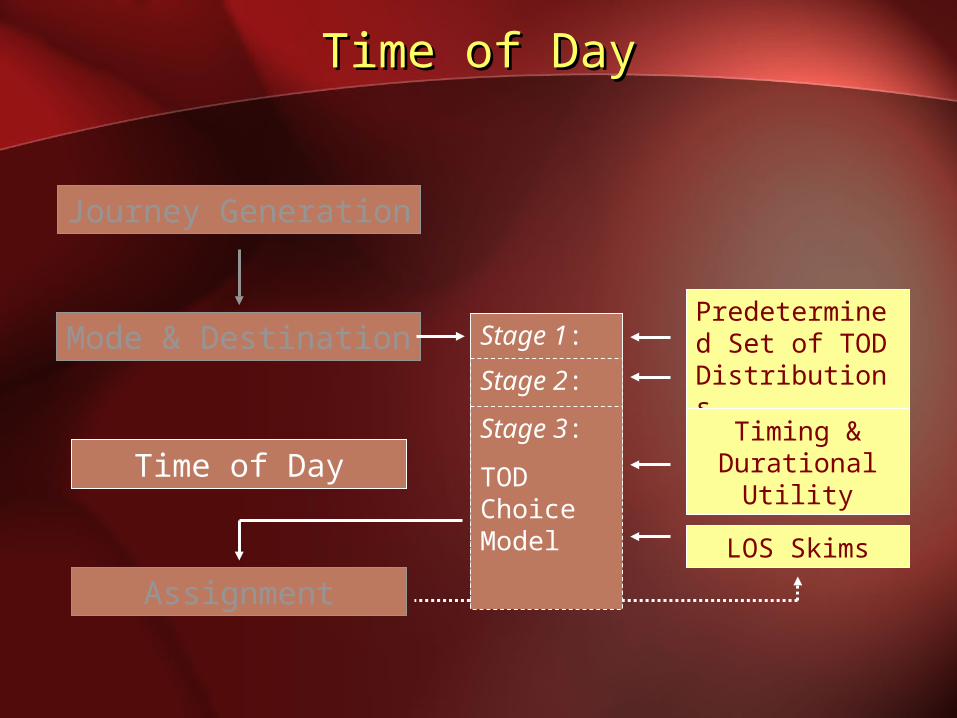
Time of DayTime of Day
Journey Generation
Mode & Destination
Time of Day
Assignment
Stage 1:
Journey Split by Legs and Periods
Stage 2:
(Current)Journey Split by Trips and Periods LOS Skims
Predetermined Set of TOD Distributions
Stage 3:
TOD Choice Model
Timing & Durational
Utility

calibrationn : the act of checking or adjusting (by comparison with a standard) the accuracy of an estimated coefficients.
validationn : the act of finding or testing the truth of something
Stages of CalibrationStages of Calibrationand Validation Sourcesand Validation Sources
Disaggregate Calibration
by PurposeAggregate Calibration
Of Destination Choice
Aggregate Calibration
Of Mode Shares
Highway and Transit
Assignment
Household Survey
Household Survey; PUMS
Household Survey; PUMS
Traffic Counts; Screenline Database; MATRIX; HPMS

Fractional ProbabilityFractional Probability
Tour
Destination 1 (0.15)
Destination 2 (0.75)
Destination 3 (0.10)
Mode 1 (0.05)
Mode 2 (0.03)
Mode 3 (0.07)
Mode 1 (0.15)
Mode 2 (0.25)
Mode 3 (0.35)
Mode 1 (0.05)
Mode 2 (0.02)
Mode 3 (0.03)

Micro-SimulationMicro-Simulation
Tour
Destination 1 (0.15)
Destination 2
Destination 3 (0.10)
Mode 1 (0.15)
Mode 2 (0.25)
Mode 3
X
X
XX

Aspects of Micro-Simulation Aspects of Micro-Simulation for NYBPM Processingfor NYBPM Processing
Nearly 9 million households in base yearJourney productions file over 500 Meg
Mode destination choice stops model processes over 25 million paired journeys by 8 trip purposes
Output files over 300 Meg
6 highway classes and 4 transit trip tables for each of 4 time periods
Combined file size about 2.5 Gig
Hardware: 4 GB RAM / Dual Processor / 1.5 Ghz / 120+ GB Hard Drive
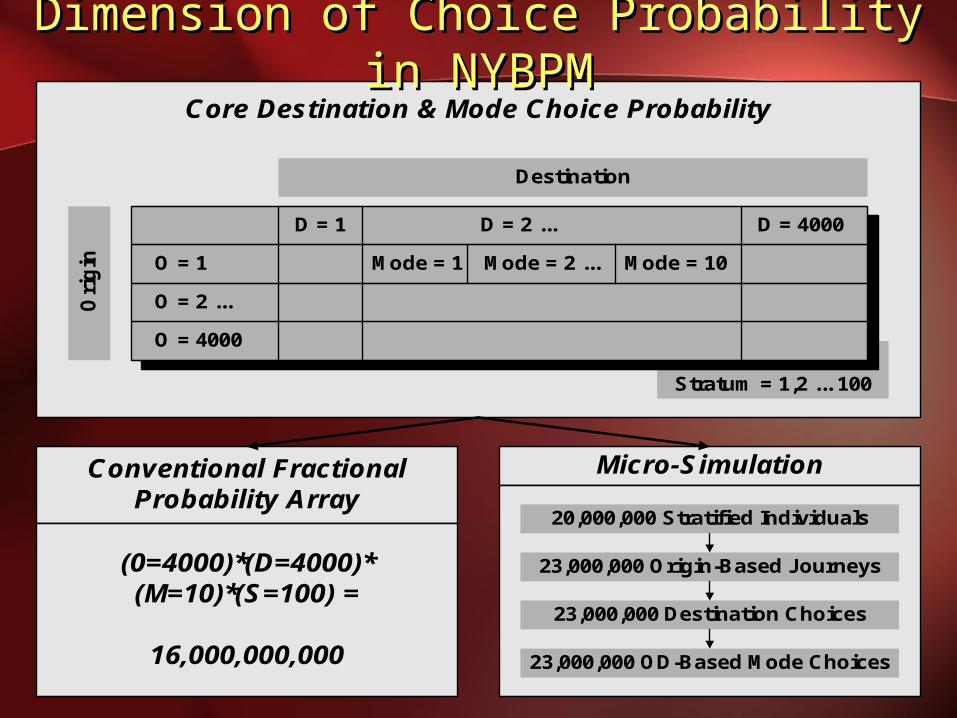
Stratum = 1,2 ... 100
Core Destination & Mode Choice Probability
Destination
Ori
gin Mode = 1O = 1 Mode = 2 ... Mode = 10
O = 2 ...
O = 4000
D = 1 D = 4000D = 2 ...
Conventional FractionalProbability Array
Micro-Simulation
(0=4000)*(D=4000)*(M=10)*(S=100) =
16,000,000,000
20,000,000 Stratified Individuals
23,000,000 Origin-Based Journeys
23,000,000 Destination Choices
23,000,000 OD-Based Mode Choices
Dimension of Choice Probability in Dimension of Choice Probability in NYBPMNYBPM

Processing Time For BPM Model RunProcessing Time For BPM Model Run
STEP BPM PROCEDURE HOURS
1 CREATE NEW SCENARIO 10 min.
2 RUN HIGHWAY NETWORK BUILDER 15 min. 5 min.
3 NETPREP .20 min. 4 min.
4 HIGHWAY PRESKIMS 12 hrs. 5 hrs 30 min.
5 TRANSIT NETWORK DATABASE & SKIMS 48 hrs. 12 hrs 6 min.
6 ACCESSIBILITY INDICIES 2 hrs. 26 min.
7 HOUSEHOLD AUTO JOURNEY (HAJ) 1 hrs. 4 min.
8 MODE DESTINATION STOPS CHOICE (MDSC) 18 hrs. 9 hrs 45 min.
9 TRUCKS/COMMERCIAL VEHICLES MODEL 2 hrs.
10 EXTERNAL MODEL 5 min.
11 PRE-ASSIGNMENT PROCESSING/TIME OF DAY (PAP) 1 hrs.
12 HIGHWAY ASSIGNMENT 16 hrs.
13 TRANSIT ASSIGNMENT 72 hrs. 42 hrs 40 min.
TOTAL 173 hrs 78 hrs(>7 days) (3 days)
6 hrs 43 min.
current improvements

Status of On-Going ImprovementsSpeed up the running time
Software EngineeringMemory Handling
allocated the memory only once, using a flag to determine if the memory had already been allocated
memory could be allocated in one block
Input/Output
Remove messages (one per 33 million lines in the HAJ trip file) to the screen, reduced processing time from 22 minutes to 20 seconds
Parameter Passing
Passing information of a pointer to a structure rather than an entire structure (e.g., the memory used to call about 260,000 times of one function with 92 bytes could be reduced significantly by passing a pointer to the structure that only requires 4 bytes)
In-lining Function Calls
Very short functions that are called frequently can cause bottlenecks (function consists of just a few lines (e.g., Calling a function, which was being called between 300,000 to 600,000 times, was taking up 10% of the total program time. In-lining the function reduced it to 0.3% of the total program time)
Additional optimization
Hardware optimization

BPM Structure –“GUI” for User Documentation

Applications of BPM at NYMTCApplications of BPM at NYMTC
Conformity Analysis
Regional Transportation Plan
Congestion Management Systems
Testing Scenarios for emission reduction strategies
Request for Data Manipulation and Runs from other agencies

Applications of BPM .. ProjectsApplications of BPM .. Projects
Tappan Zee BridgeGowanus ExpresswayBronx Arterial NeedsBruckner Sheriden ExpresswayLong Island East Side StudyCanal Area Transportation StudyLower Manhattan Development CorporationSouthern Brooklyn Transportation StudyRegional Freight Plan StudyHackensack Meadowland Development Corp.

Model UpdateModel Update
Study of Post 9/11 Travel Pattern Changes New Set of Socioeconomic and Demographic ForecastsCollection of 2002 traffic and transit dataUpdated 2002 base year Model


Model Improvements
Better Highway -Transit Connection
Improve transit models
Integrate BPM with the Land Use Model
Web Applications
Model output analysis
Model runs
Distributed Process
Better GUI (flowchart-based, on-line help & document)
More project applications
BPM User’s Group Support & Meetings

Advisory CommitteeAdvisory Committee
Patrick T. Decorla-Souza, Federal Highway Administration
Frederick W. Ducca, Federal Highway Administration
Ron Jensen-Fisher, Federal Transit Administration
Elaine Murakami, Federal Highway Administration
Bruce Spear, Federal Highway Administration
John Thomas, Environmental Protection Agency
T. Keith Lawton, Metro, Portland, Oregon
Charles Purvis, Metropolitan Transportation Commission
David Zavattero, Chicago Area Transportation Study
Arnim H. Meyburg, Cornell University
The Late Eric Paas, Duke University
Frank Spielberg, S. G. Associates

That’s it for today Thanks