

The new norm: oil risk aversion, financial co-movements ... · Antonio Merino. Repsol Chief...
31
Antonio Merino. Repsol Chief Economist and Director Economic Research “The new norm: oil risk aversion, financial co-movements and fundamentals” London, UK May 13-14, 2013 6th Annual Crude Oil Summit New Supply, New Demand and the New World Order
-
Upload
truongdang -
Category
Documents
-
view
215 -
download
0
Transcript of The new norm: oil risk aversion, financial co-movements ... · Antonio Merino. Repsol Chief...

Antonio Merino. Repsol Chief Economist and Director Economic Research
“The new norm: oil risk aversion, financial co-movements and
fundamentals”
London, UK
May 13-14, 2013
6th Annual Crude Oil Summit
New Supply, New Demand and the New World Order

2
Discussion points
• A turning point in oil price formation: The break-up of the oil prices-
inventories relationship
• Explaining the 2004 changes: Surprises in the fundamentals and Oil as
an Asset Class
• The crisis 2008 – 2009: Tail events, co-movements and risk aversion
• 2013: Are we going back to fundamentals?
• Some final remarks

3
Discussion points
• A turning point in oil price formation: The break-up of the oil prices-
inventories relationship
• Explaining the 2004 changes: Surprises in the fundamentals and Oil as
an Asset Class
• The crisis 2008 – 2009: Tail events, co-movements and risk aversion
• 2013: Are we going back to fundamentals?
• Some final remarks

4 Source: EIA, NYMEX and Repsol Economic Research Department
A turning point in oil price formation Crude Oil Prices Evolution
Brent and WTI Crude Oil Prices Daily Evolution
0
20
40
60
80
100
120
140
160Jan-9
2
Oct-
92
Jul-9
3
Apr-
94
Jan-9
5
Oct-
95
Jul-9
6
Apr-
97
Jan-9
8
Oct-
98
Jul-9
9
Apr-
00
Jan-0
1
Oct-
01
Jul-0
2
Apr-
03
Jan-0
4
Oct-
04
Jul-0
5
Apr-
06
Jan-0
7
Oct-
07
Jul-0
8
Apr-
09
Jan-1
0
Oct-
10
Jul-1
1
Apr-
12
Jan-1
3
US
$ p
er
barr
el
Brent Crude Oil
WTI Crude Oil

0
20
40
60
80
100
120
140
160
2300 2400 2500 2600 2700 2800 2900
US
$/B
bl
Stocks in million barrels
Jan-92 → Dec-00
5 Source: EIA, NYMEX and Repsol Economic Research Department
A turning point in oil price formation The break-up of the oil prices-inventories relationship
WTI Crude Oil Price vs. OECD Petroleum Industry Stocks

0
20
40
60
80
100
120
140
160
2300 2400 2500 2600 2700 2800 2900
US
$/B
bl
Stocks in million barrels
Jan-01 → Jun-04
Jan-92 → Dec-00
6 Source: EIA, NYMEX and Repsol Economic Research Department
A turning point in oil price formation The break-up of the oil prices-inventories relationship
WTI Crude Oil Price vs. OECD Petroleum Industry Stocks
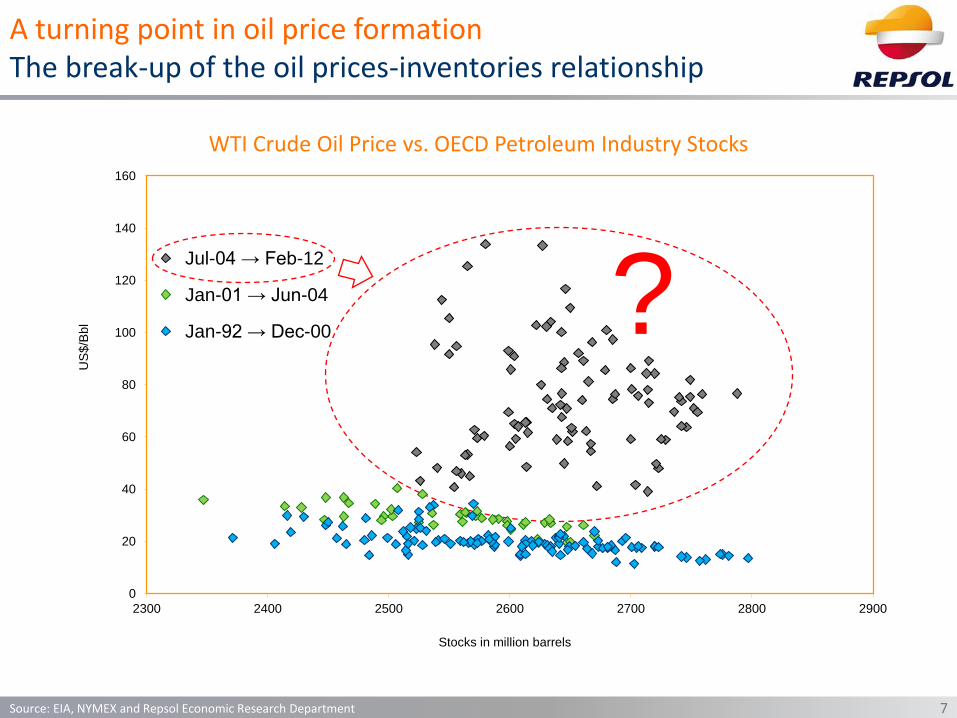
7 Source: EIA, NYMEX and Repsol Economic Research Department
WTI Crude Oil Price vs. OECD Petroleum Industry Stocks
A turning point in oil price formation The break-up of the oil prices-inventories relationship
?
0
20
40
60
80
100
120
140
160
2300 2400 2500 2600 2700 2800 2900
US
$/B
bl
Stocks in million barrels
Jul-04 → Feb-12
Jan-01 → Jun-04
Jan-92 → Dec-00

8
Discussion points
• A turning point in oil price formation: The break-up of the oil prices-
inventories relationship
• Explaining the 2004 changes: Surprises in the fundamentals and Oil as
an Asset Class
• The crisis 2008 – 2009: Tail events, co-movements and risk aversion
• 2013: Are we going back to fundamentals?
• Some final remarks

9 Source: EIA, NYMEX and Repsol Economic Research Department
WTI Crude Oil Price vs. OECD Petroleum Industry Stocks
Explaining the 2004 changes The break-up of the oil prices-inventories relationship

10
Non-OPEC Supply Annual Growth Surprises: Final Data - First Forecast
Explaining the 2004 changes: Surprises in the fundamentals Non-OPEC production → Unfulfilled expectations
Source: International Energy Agency (IEA) and Repsol Economic Research Department
0.50
0.30
-0.30
-1.10
-0.90
-1.20 -1.22
20
02
20
03
20
04
20
05
20
06
20
07
20
08
20
09
20
10
20
11
20
12
20
13
Mill
ion B
arr
els
per
day
1.16 0.98 0.73 -0.08 0.35 0.22 -0.21
Actual YoY increment
Diference between final data and first forecast

10
14
18
22
26
30
341
97
11
97
21
97
31
97
41
97
51
97
61
97
71
97
81
97
91
98
01
98
11
98
21
98
31
98
41
98
51
98
61
98
71
98
819
89
19
90
19
91
19
92
19
93
19
94
19
95
19
96
19
97
19
98
19
99
20
00
20
01
20
02
20
03
20
04
20
05
20
06
20
07
20
08
20
09
20
10
20
11
20
12
Mill
ion B
bl/d
Core OPEC Others OPEC
MAX OPEP-10 Production 2005 = 29.3 Million Bbl/d
11
OPEC Crude Oil Production: Core and not Core Countries
Explaining the 2004 changes: Surprises in the fundamentals OPEC Countries have not increased supply since the 70’s
Source: Enerdata, International Energy Agency (IEA) and Repsol Economic Research Department

Fuente: Thomson Reuters y Dirección de Estudios y Análisis del Entorno de Repsol
Profitability Index of different asset class
12
Explaining the 2004 changes: Oil as an asset class Oil began to be considered a financial asset
Source: Thomson Reuters and Repsol Economic Research Department
0
100
200
300
400
500
Jan-0
0
Jul-0
0
Jan-0
1
Jul-0
1
Jan-0
2
Jul-0
2
Jan-0
3
Jul-0
3
Jan-0
4
Jul-0
4
Jan-0
5
Jul-0
5
Jan-0
6
Jul-0
6
Jan-0
7
Jul-0
7
Jan-0
8
Jul-0
8
Jan-0
9
Jul-0
9
Jan-1
0
Jul-1
0
Jan-1
1
Jul-1
1
Jan-1
2
Jul-1
2
Jan-1
3
Index (
2000 =
100)
WTI
CRB
S&P 500 Total return

13
Discussion points
• A turning point in oil price formation: The break-up of the oil prices-
inventories relationship
• Explaining the 2004 changes: Surprises in the fundamentals and Oil as
an Asset Class
• The crisis 2008 – 2009: Tail events, co-movements and risk aversion
• 2013: Are we going back to fundamentals?
• Some final remarks

14 Source: EIA, NYMEX and Repsol Economic Research Department
WTI Crude Oil Price vs. OECD Petroleum Industry Stocks
The crisis 2008-2009: Tail events, co-movements and risk aversion The greatest economic downturn since 29’s crisis

65
70
75
80
85
90
95
100
105
110
1 4 7
10
13
16
19
22
25
28
31
34
37
40
43
46
49
52
meses desde el máximo
Crisis 2008 (índice abril 2008 = 100)
Crisis 1929 (índice junio 1929 = 100)
60
65
70
75
80
85
90
95
100
105
1 4 7
10
13
16
19
22
25
28
31
34
37
40
43
46
49
52
meses desde el máximo
Crisis 2008 (índice abril 2008 = 100)
Crisis 1929 (índice junio 1929 = 100)
2008 Crisis (Apr 2008 = 100)
1929 Crisis (Jun 1929 = 100)
Months from max
15 Source: Voxeu.org and Repsol Economic Research Department
Global Trade
The crisis 2008-2009: Tail events, co-movements and risk aversion The greatest economic downturn since 29’s crisis

The crisis 2008-2009: Tail events, co-movements and risk aversion The backstop to a worst economic crisis: Federal Reserve action
16
S&P 500 Index
Source: Datastream y Dirección de Estudios y Análisis del Entorno de Repsol
650
850
1,050
1,250
1,450
1,650
Ja
n-0
3
Ju
l-0
3
Ja
n-0
4
Ju
l-0
4
Ja
n-0
5
Ju
l-0
5
Ja
n-0
6
Ju
l-0
6
Ja
n-0
7
Ju
l-0
7
Ja
n-0
8
Ju
l-0
8
Ja
n-0
9
Ju
l-0
9
Ja
n-1
0
Ju
l-1
0
Ja
n-1
1
Ju
l-1
1
Ja
n-1
2
Ju
l-1
2
Ja
n-1
3
Ju
l-1
3
Po
ints
S&P 500

The crisis 2008-2009: Tail events, co-movements and risk aversion The backstop to a worst economic crisis: Federal Reserve action
17 Source: Datastream y Dirección de Estudios y Análisis del Entorno de Repsol
700
1,100
1,500
1,900
2,300
2,700
3,100
3,500
650
850
1,050
1,250
1,450
1,650
Ja
n-0
3
Ju
l-0
3
Ja
n-0
4
Ju
l-0
4
Ja
n-0
5
Ju
l-0
5
Ja
n-0
6
Ju
l-0
6
Ja
n-0
7
Ju
l-0
7
Ja
n-0
8
Ju
l-0
8
Ja
n-0
9
Ju
l-0
9
Ja
n-1
0
Ju
l-1
0
Ja
n-1
1
Ju
l-1
1
Ja
n-1
2
Ju
l-1
2
Ja
n-1
3
Ju
l-1
3
Bill
ion
US
D
Po
ints
S&P 500
FED total assets
S&P 500 Index and Federal Reserve total assets

18 Source: Thomson Reuters and Repsol Economic Research Department
250 Days Moving Correlation: Brent, S&P500 and Exchange Rate, daily changes
The crisis 2008-2009: Tail events, co-movements and risk aversion Systemic risk… everything is “co-movement” since Lehman
-0.6
-0.4
-0.2
0.0
0.2
0.4
0.6
0.8
Jan-9
4
Sep-9
4
Ma
y-9
5
Jan-9
6
Sep-9
6
Ma
y-9
7
Jan-9
8
Sep-9
8
Ma
y-9
9
Jan-0
0
Sep-0
0
Ma
y-0
1
Jan-0
2
Sep-0
2
Ma
y-0
3
Jan-0
4
Sep-0
4
Ma
y-0
5
Jan-0
6
Sep-0
6
Ma
y-0
7
Jan-0
8
Sep-0
8
Ma
y-0
9
Jan-1
0
Sep-1
0
Ma
y-1
1
Jan-1
2
Sep-1
2
Ma
y-1
3
S&P 500 and Exchange Rate EUR/USD
S&P 500 and Brent

19
Discussion points
• A turning point in oil price formation: The break-up of the oil prices-
inventories relationship
• Explaining the 2004 changes: Surprises in the fundamentals and Oil as
an Asset Class
• The crisis 2008 – 2009: Tail events, co-movements and risk aversion
• 2013: Are we going back to fundamentals?
• Some final remarks

20 Source: EIA, NYMEX and Repsol Economic Research Department
WTI Crude Oil Price vs. OECD Petroleum Industry Stocks
0
20
40
60
80
100
120
140
160
2300 2400 2500 2600 2700 2800 2900
US
$/B
bl
Stocks in million barrels
Apr-09 → Feb-12
Aug-08 → Mar-09
Jul-04 → Jul-08
Jan-01 → Jun-04
Jan-92 → Dec-00
2013: Are we going back to fundamentals? A new level for oil prices-inventories relationship

21 Source: International Energy Agency (IEA) and Repsol Economic Research Department
2013: Are we going back to fundamentals? Non-OPEC is delivering new production
Non-OPEC Supply Annual Growth Surprises: Final Data - First Forecast
0.50
0.30
-0.30
-1.10
-0.90
-1.20 -1.22
0.29
0.84
-0.24
-0.40
0.40
20
02
20
03
20
04
20
05
20
06
20
07
20
08
20
09
20
10
20
11
20
12
20
13
Mill
ion B
arr
els
per
day
1.16 0.98 0.93 1.24 1.100.73 -0.08 0.35 0.22 -0.21 0.14 0.60
Actual YoY increment

2013: Are we going back to fundamentals? Ultimately technically recoverable resources are increasing
22
Ultimately technically recoverable resources and cumulative production
Source: IEA (WEO 2008 & WEO 2012) and Repsol Economic Research Department
-1222
-1128
-2000 -1000 0 1000 2000 3000 4000 5000 6000
WE
O 2
012
WE
O 2
008
Billion barrels
-1222
-1128
1653
1241
1400
805
2840
2085
-2000 -1000 0 1000 2000 3000 4000 5000 6000
WE
O 2
012
WE
O 2
008
Billion barrels
Cumulative Prod. @ t-1
P1 @ t-1
Conventional Oil
Unconventional
OTHER POTENTIALLY
RECOVERABLE VOLUMES

23 Source: IEA (WEO 2008 & WEO 2012) and Repsol Economic Research Department
Ultimately technically recoverable resources and cumulative production
2013: Are we going back to fundamentals? Ultimately technically recoverable resources are increasing
-1222
-1128
1653
1241
-2000 -1000 0 1000 2000 3000 4000 5000 6000
WE
O 2
012
WE
O 2
008
Billion barrels
-1222
-1128
1653
1241
1400
805
2840
2085
-2000 -1000 0 1000 2000 3000 4000 5000 6000
WE
O 2
012
WE
O 2
008
Billion barrels
Cumulative Prod. @ t-1
P1 @ t-1
Conventional Oil
Unconventional
OTHER POTENTIALLY
RECOVERABLE VOLUMES

24 Source: IEA (WEO 2008 & WEO 2012) and Repsol Economic Research Department
Ultimately technically recoverable resources and cumulative production
2013: Are we going back to fundamentals? Ultimately technically recoverable resources are increasing
-1222
-1128
1653
1241
1400
805
2840
2085
-2000 -1000 0 1000 2000 3000 4000 5000 6000
WE
O 2
012
WE
O 2
008
Billion barrels
Cumulative Prod. @ t-1
P1 @ t-1
Conventional Oil
Unconventional
OTHER POTENTIALLY
RECOVERABLE VOLUMES
-1222
-1128
1653
1241
1400
805
2840
2085
-2000 -1000 0 1000 2000 3000 4000 5000 6000
WE
O 2
012
WE
O 2
008
Billion barrels
Cumulative Prod. @ t-1
P1 @ t-1
Conventional Oil
Unconventional
OTHER POTENTIALLY
RECOVERABLE VOLUMES

25 Source: Bloomberg and Repsol Economic Research Department
2013: Are we going back to fundamentals? Markets’ View: no so worried about the long term oil supply
Changes in the Future Market Crude Oil Price Perspectives
10
30
50
70
90
110
130
150
Ja
n-0
2
Ja
n-0
3
Ja
n-0
4
Ja
n-0
5
Ja
n-0
6
Ja
n-0
7
Ja
n-0
8
Ja
n-0
9
Ja
n-1
0
Ja
n-1
1
Ja
n-1
2
Ja
n-1
3
Ja
n-1
4
Ja
n-1
5
Ja
n-1
6
Ja
n-1
7
Ja
n-1
8
Ja
n-1
9
US
$ p
er
ba
rre
l
Historic Price
@ 7/5/2013
@ 7/1/2013
@ 7/5/2012
@ 7/5/2011
@ 1/5/2009
@ 1/6/2008
@ 1/1/2003

26 Source: IEA and Repsol Economic Research Department
Global Petroleum Demand Growth Rates Evolution by periods
2013: Are we going back to fundamentals? Global petroleum demand growing less
1.36%1.50%
-1.16%
0.95%0.80%
2000-2003 2004-2007 2008-2009 2010-2012 2013-2035

27 Source: IMF and Repsol Economic Research Department
2013: Are we going back to fundamentals? There are significant uncertainties about economic growth…
Global Economic Growth Revisions by IMF
3.0
3.2
3.4
3.6
3.8
4.0
4.2
4.4
4.6A
pr-
11
Ma
y-1
1
Ju
n-1
1
Ju
l-1
1
Aug-1
1
Se
p-1
1
Oct-
11
No
v-1
1
De
c-1
1
Ja
n-1
2
Fe
b-1
2
Ma
r-1
2
Ap
r-1
2
Ma
y-1
2
Ju
n-1
2
Ju
l-1
2
Aug-1
2
Se
p-1
2
Oct-
12
No
v-1
2
De
c-1
2
Ja
n-1
3
Fe
b-1
3
Ma
r-1
3
Ap
r-1
3
% Y
oY
Gro
wth
Rate
2012 Global Economic Growth Forecast
2013 Global Economic Growth Forecast

28 Fuente: Thomson Reuters Datastream , Oxford Economics y Dirección de Estudios y Análisis del Entorno de Repsol
Central Bank Total Assets Evolution and Projections
? ?
0
10
20
30
40
50
60
70
De
c-0
8
Ma
r-0
9
Jun-0
9
Sep-0
9
De
c-0
9
Ma
r-1
0
Jun-1
0
Sep-1
0
De
c-1
0
Ma
r-1
1
Jun-1
1
Sep-1
1
De
c-1
1
Ma
r-1
2
Jun-1
2
Sep-1
2
De
c-1
2
Ma
r-1
3
Jun-1
3
Sep-1
3
De
c-1
3
Ma
r-1
4
Jun-1
4
Sep-1
4
De
c-1
4
% P
IB
Fed
BCE
BOE
BOJ
2013: Are we going back to fundamentals? Growth and expectations are driven by Central Banks actions…
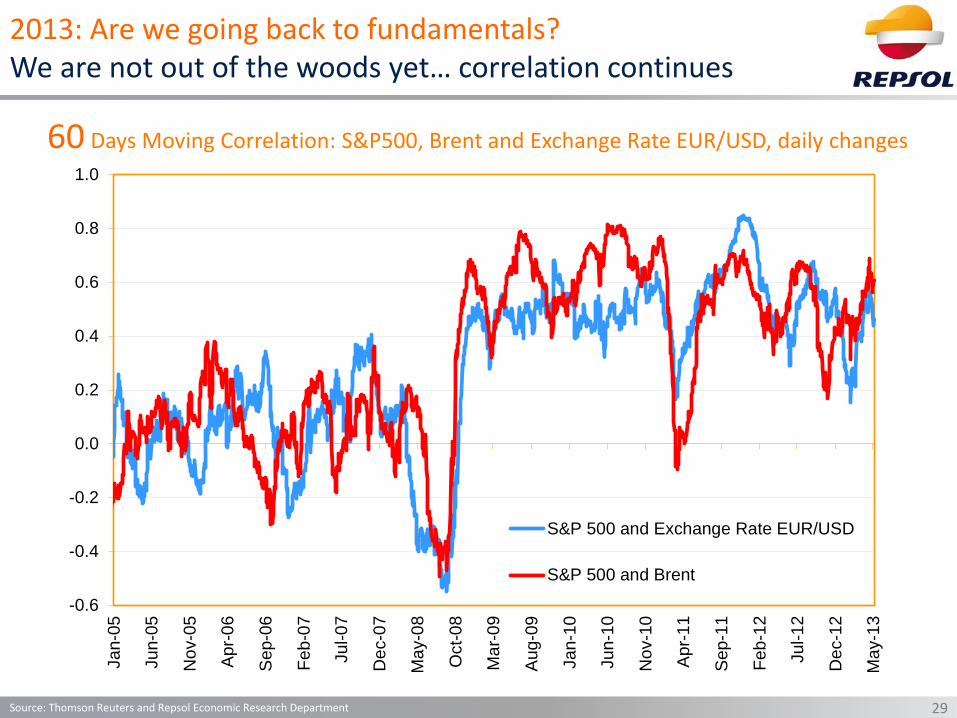
2013: Are we going back to fundamentals? We are not out of the woods yet… correlation continues
29 Source: Thomson Reuters and Repsol Economic Research Department
60 Days Moving Correlation: S&P500, Brent and Exchange Rate EUR/USD, daily changes
-0.6
-0.4
-0.2
0.0
0.2
0.4
0.6
0.8
1.0
Jan-0
5
Jun-0
5
No
v-0
5
Apr-
06
Sep-0
6
Feb
-07
Jul-0
7
De
c-0
7
Ma
y-0
8
Oct-
08
Ma
r-0
9
Aug-0
9
Jan-1
0
Jun-1
0
No
v-1
0
Apr-
11
Sep-1
1
Fe
b-1
2
Jul-1
2
De
c-1
2
Ma
y-1
3
S&P 500 and Exchange Rate EUR/USD
S&P 500 and Brent

30
Some final remarks
• Long term expectation about scarcity drove prices and investment in “Financial Oil” from 2004 to 2008
• After the 2008 crisis: Tail event fears and Co-movements ruled the scene and Quantitative Easing was the Central Banks prescription
• Are we going back to an oil price formation mechanism based on fundamentals, geopolitical and short term expectations?
• Long term supply worries have clearly been reduced although new production increases are limited to the US up to now.
• Regarding demand, less growth than before the crisis but big changes in sentiment link to tail event fears and monetary policy response…
• We continue living under the influence of increasing Central Bank balance-sheets, and market fears about when these expansionary measures are going to be reversed explain why we are still in a co-movements situation…


