International Fixed Income Topic IB: Fixed Income Basics - Risk.
Upload
duonghuongCategory
view
219download
0
The New Fixed Income Environment
0
The New Fixed Income Environment BMO Mutual Funds: Fixed Income Platform

The New Fixed Income Environment
1
Table Of Contents
A Whole New World 2
The Current Yield Environment 3
Fixed Income Provides Safety & Income 4
The Need for a more Active Approach 6
Fixed Income Lineup 9
Spotlight: Introducing BMO’s Core Bond Funds 10
For more information on BMO Mutual Funds products, please visit us at: http://www.bmo.com/mutualfunds

The New Fixed Income Environment
2
A Whole New World
FIXED INCOME PLATFORM
BROAD RANGE OF FIXED INCOME SOLUTIONS
GLOBAL FIXED INCOME
BMO World Bond Fund Annual
YTM: 1.97% | Duration: 6.07 yrs BMO Emerging Markets Bond Fund Monthly | Variable
YTM: 5.19% | Duration: 6.50 yrs BMO Global Strategic Bond Fund Monthly | 3.5¢
YTM: 6.40% | Duration: 5.10 yrs
HIGH YIELD FIXED INCOME
BMO High Yield Bond Fund Monthly | 4.5¢
YTM: 7.00% | Duration: 2.90 yrs
BMO U.S. High Yield Bond Fund Monthly | 4¢
YTM: 6.31% | Duration: 4.45 yrs BMO Floating Rate Income Fund Monthly | Variable
YTM: 5.21% | Duration: 0.93 yrs
SHORT TERM FIXED INCOME
BMO Money Market Fund BMO U.S. Dollar Money Market Fund BMO Short-Term Income Class BMO Mortgage & S/T Income Fund Monthly | Variable
YTM: 1.79% | Duration: 2.41 yrs BMO Laddered Corporate Bond Fund Monthly | Variable
YTM: 1.96% | Duration: 2.53 yrs
CORE FIXED INCOME
BMO Bond Fund Monthly | Variable
YTM: 2.53% | Duration: 7.06 yrs BMO Core Bond Fund Monthly | Variable
YTM: n/a | Duration: n/a BMO Core Plus Bond Fund Monthly | Variable
YTM: n/a | Duration: n/a BMO Target Yield ETF Portfolio Monthly | 2.5¢
YTM: 3.00% | Duration: 4.40 yrs
STR
ATEG
ICAL
LY D
ESIG
NED
TO
FILL
YOU
R IN
VEST
MEN
T NE
EDS
Actively managed fixed income strategies have become even more important today as a result of the changing Canadian fixed income landscape. A low yielding environment combined with limited price appreciation has meant opportunities in the Canadian bond market are shrinking. Investors who have succeeded with broad bond market exposure (‘beta’) alone may find it difficult to generate the same risk-adjusted returns going forward. In today’s new world, active fixed income strategies are needed to exploit all of the opportunities that exist within the fixed income universe.
The BMO Mutual Funds Fixed Income product suite is designed to allow investors to optimally build a fixed income portfolio.
The bond map illustrates the bond market across the full spectrum of our fixed income fund lineup.
Our funds invest in a wide range of asset classes including government bonds and foreign bonds from both developed and emerging economies, as well as investment grade and high yield corporate bonds.
Source: BMO GAM, September 30th 2014
The New Fixed Income Environment
3
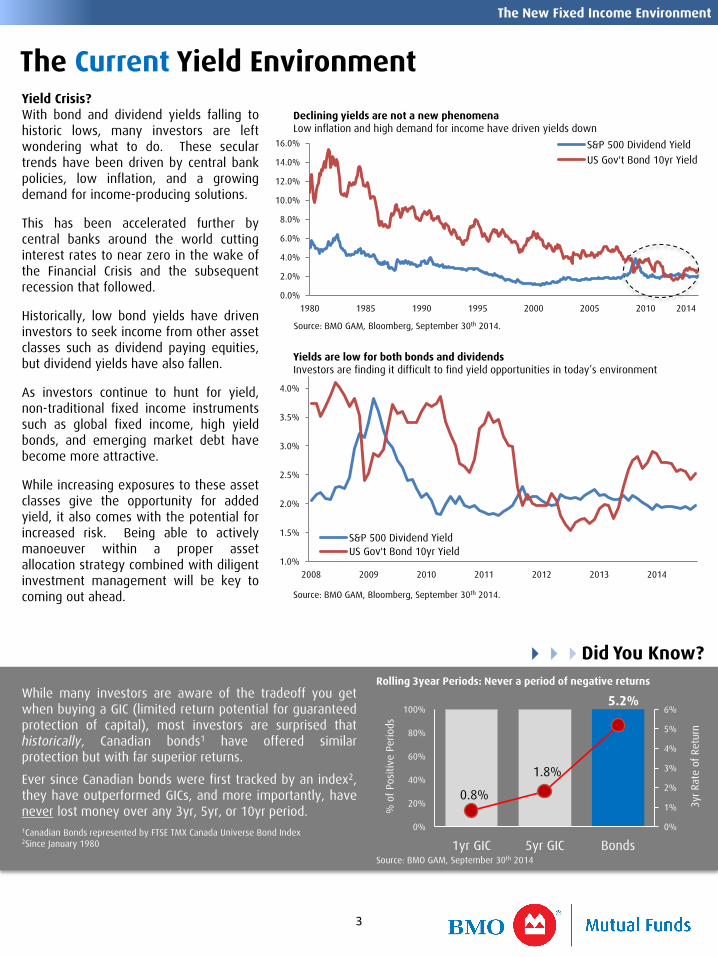
Yield Crisis? With bond and dividend yields falling to historic lows, many investors are left wondering what to do. These secular trends have been driven by central bank policies, low inflation, and a growing demand for income-producing solutions. This has been accelerated further by central banks around the world cutting interest rates to near zero in the wake of the Financial Crisis and the subsequent recession that followed. Historically, low bond yields have driven investors to seek income from other asset classes such as dividend paying equities, but dividend yields have also fallen. As investors continue to hunt for yield, non-traditional fixed income instruments such as global fixed income, high yield bonds, and emerging market debt have become more attractive. While increasing exposures to these asset classes give the opportunity for added yield, it also comes with the potential for increased risk. Being able to actively manoeuver within a proper asset allocation strategy combined with diligent investment management will be key to coming out ahead.
The Current Yield Environment
1.0%
1.5%
2.0%
2.5%
3.0%
3.5%
4.0%
2008 2009 2010 2011 2012 2013 2014
S&P 500 Dividend YieldUS Gov't Bond 10yr Yield
0.0%
2.0%
4.0%
6.0%
8.0%
10.0%
12.0%
14.0%
16.0%
1980 1985 1990 1995 2000 2005 2010
S&P 500 Dividend YieldUS Gov't Bond 10yr Yield
2014
Declining yields are not a new phenomena Low inflation and high demand for income have driven yields down
Yields are low for both bonds and dividends Investors are finding it difficult to find yield opportunities in today’s environment
Source: BMO GAM, Bloomberg, September 30th 2014.
Source: BMO GAM, Bloomberg, September 30th 2014.
While many investors are aware of the tradeoff you get when buying a GIC (limited return potential for guaranteed protection of capital), most investors are surprised that historically, Canadian bonds1 have offered similar protection but with far superior returns.
Ever since Canadian bonds were first tracked by an index2, they have outperformed GICs, and more importantly, have never lost money over any 3yr, 5yr, or 10yr period. 1Canadian Bonds represented by FTSE TMX Canada Universe Bond Index 2Since January 1980
0.8%
1.8%
5.2%
0%
1%
2%
3%
4%
5%
6%
0%
20%
40%
60%
80%
100%
1yr GIC 5yr GIC Bonds
3yr R
ate
of R
etur
n
% o
f Pos
itive
Per
iods
Rolling 3year Periods: Never a period of negative returns
Source: BMO GAM, September 30th 2014
Did You Know?
The New Fixed Income Environment
4
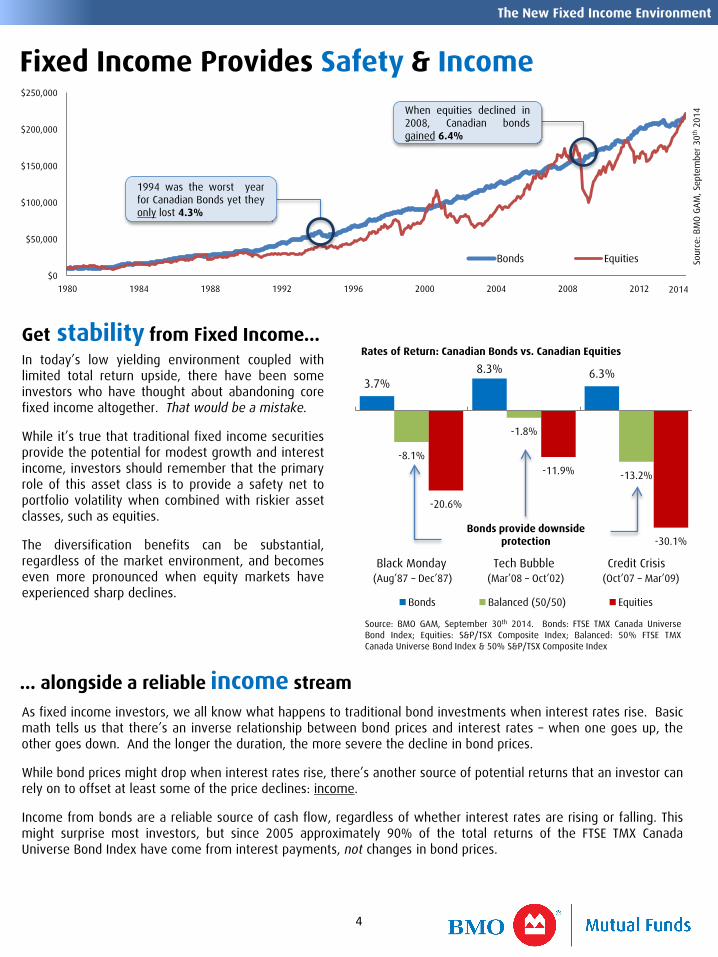
$0
$50,000
$100,000
$150,000
$200,000
$250,000
1980 1984 1988 1992 1996 2000 2004 2008 2012
Bonds Equities
When equities declined in 2008, Canadian bonds gained 6.4%
2014
Fixed Income Provides Safety & Income
3.7% 8.3% 6.3%
-8.1%
-1.8%
-13.2%
-20.6%
-11.9%
-30.1%
Black Monday Tech Bubble Credit Crisis
Bonds Balanced (50/50) Equities
(Aug’87 – Dec’87) (Mar’08 – Oct’02) (Oct’07 – Mar’09)
Bonds provide downside protection
In today’s low yielding environment coupled with limited total return upside, there have been some investors who have thought about abandoning core fixed income altogether. That would be a mistake. While it’s true that traditional fixed income securities provide the potential for modest growth and interest income, investors should remember that the primary role of this asset class is to provide a safety net to portfolio volatility when combined with riskier asset classes, such as equities. The diversification benefits can be substantial, regardless of the market environment, and becomes even more pronounced when equity markets have experienced sharp declines.
Get stability from Fixed Income… Rates of Return: Canadian Bonds vs. Canadian Equities
1994 was the worst year for Canadian Bonds yet they only lost 4.3%
Source: BMO GAM, September 30th 2014. Bonds: FTSE TMX Canada Universe Bond Index; Equities: S&P/TSX Composite Index; Balanced: 50% FTSE TMX Canada Universe Bond Index & 50% S&P/TSX Composite Index
Sour
ce: B
MO
GAM
, Sep
tem
ber 3
0th 2
014
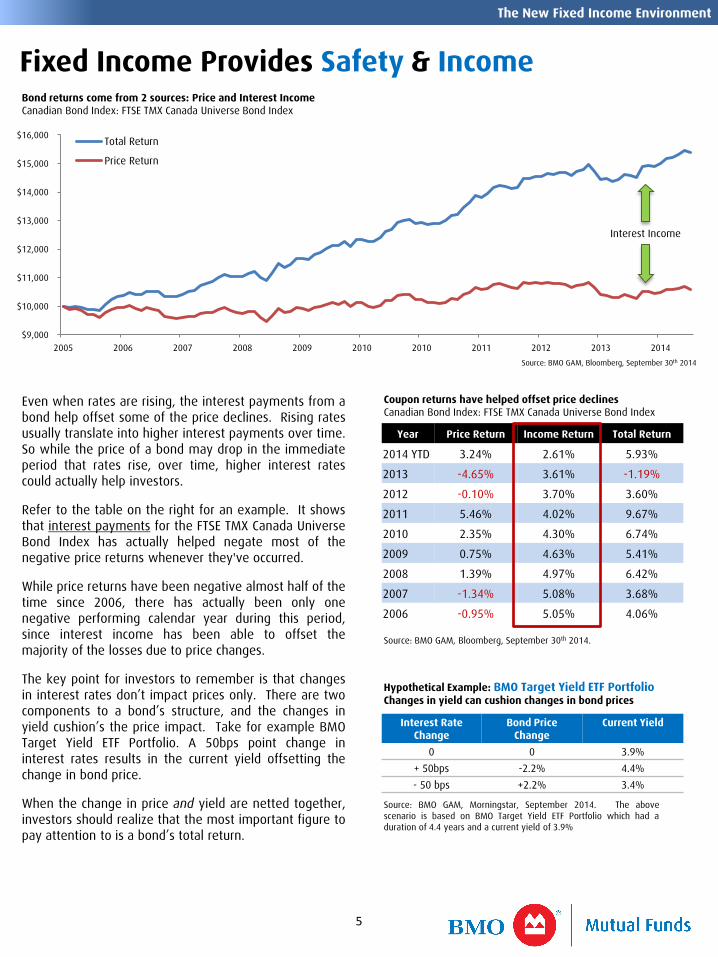
… alongside a reliable income stream As fixed income investors, we all know what happens to traditional bond investments when interest rates rise. Basic math tells us that there’s an inverse relationship between bond prices and interest rates – when one goes up, the other goes down. And the longer the duration, the more severe the decline in bond prices. While bond prices might drop when interest rates rise, there’s another source of potential returns that an investor can rely on to offset at least some of the price declines: income. Income from bonds are a reliable source of cash flow, regardless of whether interest rates are rising or falling. This might surprise most investors, but since 2005 approximately 90% of the total returns of the FTSE TMX Canada Universe Bond Index have come from interest payments, not changes in bond prices.
The New Fixed Income Environment
5
$9,000
$10,000
$11,000
$12,000
$13,000
$14,000
$15,000
$16,000
2005 2006 2007 2008 2009 2010 2010 2011 2012 2013 2014
Total Return
Price Return
Even when rates are rising, the interest payments from a bond help offset some of the price declines. Rising rates usually translate into higher interest payments over time. So while the price of a bond may drop in the immediate period that rates rise, over time, higher interest rates could actually help investors. Refer to the table on the right for an example. It shows that interest payments for the FTSE TMX Canada Universe Bond Index has actually helped negate most of the negative price returns whenever they've occurred. While price returns have been negative almost half of the time since 2006, there has actually been only one negative performing calendar year during this period, since interest income has been able to offset the majority of the losses due to price changes. The key point for investors to remember is that changes in interest rates don’t impact prices only. There are two components to a bond’s structure, and the changes in yield cushion’s the price impact. Take for example BMO Target Yield ETF Portfolio. A 50bps point change in interest rates results in the current yield offsetting the change in bond price. When the change in price and yield are netted together, investors should realize that the most important figure to pay attention to is a bond’s total return.
Coupon returns have helped offset price declines Canadian Bond Index: FTSE TMX Canada Universe Bond Index
Bond returns come from 2 sources: Price and Interest Income Canadian Bond Index: FTSE TMX Canada Universe Bond Index
Interest Rate Change
Bond Price Change
Current Yield
0 0 3.9% + 50bps -2.2% 4.4% - 50 bps +2.2% 3.4%
Hypothetical Example: BMO Target Yield ETF Portfolio Changes in yield can cushion changes in bond prices
Source: BMO GAM, Bloomberg, September 30th 2014.
Source: BMO GAM, Morningstar, September 2014. The above scenario is based on BMO Target Yield ETF Portfolio which had a duration of 4.4 years and a current yield of 3.9%
Year Price Return Income Return Total Return
2014 YTD 3.24% 2.61% 5.93%
2013 -4.65% 3.61% -1.19%
2012 -0.10% 3.70% 3.60%
2011 5.46% 4.02% 9.67%
2010 2.35% 4.30% 6.74%
2009 0.75% 4.63% 5.41%
2008 1.39% 4.97% 6.42%
2007 -1.34% 5.08% 3.68%
2006 -0.95% 5.05% 4.06%
Source: BMO GAM, Bloomberg, September 30th 2014
Interest Income
Fixed Income Provides Safety & Income

The New Fixed Income Environment
6
Yield Curve Roll Down Each year as a bond nears maturity it will start to ‘roll down’ the curve towards lower yields. Active managers can search for these bonds that are positioned at the steeper parts of the yield curve and benefit as a bond moves from a higher yielding term to a shorter term while still carrying its original coupon. This can act as a partial buffer in a rising interest rate environment as the roll down effect offsets some of the negative impacts of rising yields on bond prices. Reliance on Credit Agencies The pricing of individual bonds are heavily influenced by its assigned credit rating. While credit rating agencies are used by all managers, most only use these ratings as a starting point, or an input into their own proprietary credit research. While this additional analysis is done in the hope of uncovering mispriced fixed income securities, it can also identify securities that are deteriorating and have not been downgraded by rating agencies.
The general role of all active managers is to find ways to exploit market inefficiencies with an eye to lower volatility and enhance total returns. Not only are they attempting to add value in the process, but they’re also looking to reduce volatility and minimize specific risks associated with individual securities that can occur when following a benchmark. Now more than ever has the need for active management in the fixed income world been more evident. With today’s near-zero rate environment, which has resulted in low yields across the curve, investors seeking to generate income from traditional Canadian bond holdings can find it difficult, especially with the limited opportunities for price appreciation in the markets.
The Need For a More Active Approach
Off-the-run bonds Some of the most liquid bonds in the market are ‘benchmark’ bonds, which are securities with specific terms such as 2yr, 5yr, 10yr, and 30yr issues. However, when a specific bond no longer qualifies as a benchmark bond, and a new bond with the same term is issued, it becomes known as an ‘off-the-run’ bond. These bonds are generally issued with higher yields at the cost of slightly less liquidity. Active managers can exploit the difference in yields between the two bonds by buying the higher yielding off-the-run bonds resulting in excess yield with the same credit quality at the cost of non-material liquidity. Foreign Bonds The Canadian fixed income market makes up only a small fraction of the opportunities available around the world. By expanding the investable universe to include international sovereign bonds, foreign investment grade and high yield bonds, emerging market debt, and the ability to gain exposure through a variety of derivatives, active managers have an even wider variety of sources to generate strong performance and to diversify a portfolio.
Faith, Trust, and Pixie Dust… Take advantage of market inefficiencies:
Yield Curve Roll Down Example
0.0%
0.5%
1.0%
1.5%
2.0%
2.5%
3.0%
3.5%
4.0%
4.5%
5.0%
0 1 Yr 2 Yr 3 Yr
A
B C
A 3 year Treasury r
B Rates a 2.07% rate on 3 year Treasuries
C
3-year U.S. Treasury starts at 1.07%
Rates rise by 100bps, implying a 2.07% rate on 3-year U.S. Treasuries
However, as a 3-year bond ages to 2-years to maturity, its yield would fall to 1.58%. This would result in less price deterioration (approximately half of the yield increase)
Source: BMO GAM, September 30 2014
$1 trillion
$55 trillion
Source: Bloomberg, March 2014 in $C. Includes government & investment grade corporate bonds, inflation linked bonds, high yield bonds, and EM local debt)
Relative size of the Canadian Fixed Income Market

The New Fixed Income Environment
7
Federal 56%
Benchmark Weightings The composition of any bond market is based on the sum of all the issuances in the market. In Canada, the fixed income allocation that results from this phenomena is eerily similar to our equity market, as it’s very concentrated in a few select sectors. Government bonds make up over 70% of the Canadian bond market, but given the context of the low yielding environment we’re in, this might not necessarily be the optimal allocation for the end investor.
Sector Allocation Identifying opportunistic sectors can in most cases produce superior returns over the long term. And while investors normally associate this with equities, the same thinking applies with fixed income. And much like equities, what’s doing well one year in the fixed income markets doesn’t necessarily mean success in the following year. The ability for a manager to actively overweight an undervalued area of the market and completely remove exposure to more risky sectors increases the chances to outperform the broad market. Security Selection Within the fixed income market, there exists a wide variety of securities with different characteristics (coupons, quality, duration, etc…). This is especially true given the context of the current fixed income environment - since the Credit Crisis in 2008, there has been a material increase in the level of risk in the market (particularly with bank capital, corporate bonds, and within the European government bond markets). Identifying individual fixed income securities that are expected to generate optimal risk-adjusted returns are just another tool that can add value to a portfolio.
FTSE TMX Canada
Universe Bond
Gov’t 70%
Corp. 30%
Municipal 2%
Provincial 42%
Source: BMO GAM, June 30th 2014
Growth (15% probability)
Sluggish (70% probability)
Recession (15% probability)
Canadian Federal Bonds -0.9% 2.3% 7.0%
Canadian Corporate Bonds 1.6% 3.9% 2.6%
Credit Breakdown of the Canadian Bond Index
Furthermore, as illustrated by the table above, the return possibilities across the spectrum of Canadian fixed income sectors, especially for Canadian Federal Bonds, run fairly wide. Ultimately, this allows an active manager to exploit and opportunistically allocate across sectors to reduce the concentration risk that exists within the benchmark.
Source: CIBC Capital Markets
Calendar Year Returns of various Fixed Income Sectors
Source: BMO GAM, Morningstar, September 2014. CDN Govt Bonds: FTSE TMX Canada Government Bond Index; CDN ST Bonds: FTSE TMX Canada Short-Term Bond Index; CDN LT Bonds: FTSE TMX Canada Long Term Bond Index; CDN Bonds: FTSE TMX Canada Universe Bond Index; CDN IG Corps: FTSE TMX Canada All Corp Bond Index; Global Bonds: Barclays Capital Global Aggregate Bond Index; EM Bonds: JPM EMBI Global Diversified Bond Index; High Yield: BofA ML Master II Index. All returns in $CAD
2007 2008 2009 2010 2011 2012 2013 2014 YTD
CDN Govt Bonds4.4%
Global Bonds31.1%
High Yield
33.8%
High Yield9.2%
CDN Govt Bonds10.2%
EMBonds14.8%
High Yield
14.6%
EMBonds18.6%
CDN ST Bonds4.1%
EMBonds10.0%
CDN IG Corps16.3%
CDN IG Corps7.3%
EMBonds10.0%
High Yield
13.0%
Global Bonds3.9%
High Yield
12.1%
CDN Bonds3.7%
CDN Govt Bonds9.0%
EMBonds10.2%
CDN Bonds6.7%
CDN Bonds9.7%
CDN IG Corps6.2%
CDN ST Bonds1.7%
Global Bonds9.3%
CDN IG Corps1.8%
CDN ST Bonds8.6%
CDN Bonds5.4%
CDN Govt Bonds6.5%
Global Bonds8.3%
CDN Bonds3.6%
EMBonds1.1%
CDN Govt Bonds8.2%
Global Bonds-7.1%
CDN Bonds6.4%
CDN ST Bonds4.5%
EMBonds6.4.%
CDN IG Corps8.2%
CDN Govt Bonds2.6%
CDN IG Corps0.8%
CDN Bonds8.0%
EMBonds-10.0%
CDN IG Corps0.2%
CDN Govt Bonds1.6%
CDN ST Bonds3.6%
High Yield7.0%
Global Bonds2.0%
CDN Bonds-1.2%
CDN IG Corps7.6%
High Yield
-13.3%
High Yield-7.9%
Global Bonds-9.2%
Global Bonds0.0%
CDN ST Bonds4.7%
CDN ST Bonds2.0%
CDN Govt Bonds-2.0%
CDN ST Bonds2.8%
The Need For a More Active Approach

The New Fixed Income Environment
8
0.00
0.50
1.00
1.50
2.00
2.50
3 Mo 6 Mo 1 Yr 2 Yr 3 Yr 5 Yr 7 Yr 10 Yr
5.4%
2.4%
-0.6% -3.6%
-6.6%
-9.7%
-0.5 0.0 0.5 1.0 1.5 2.0
Hypothetical impact of changing rates on a bond portfolio’s total return
Change in interest rates (%)
Source: BMO GAM, September 2014. The bond portfolio is represented by the FTSE TMX Canada Universe Bond Index.
The need for income is still here and is something that likely wont change for the foreseeable future. However, we’re now more than five years removed from the Credit Crisis in 2008 and economic growth has been positive and monetary easing policies around the world have made money cheap. These are all factors that should have pushed interest rates higher, yet rates still remain low. Given the context of this new world, the overarching theme within fixed income going forward should be to tactically allocate portfolios to areas that have the best chance of producing superior results. Sitting still in an aggregate bond strategy that’s fully exposed to today’s low yielding environment, along with the inherent duration risk that exists in the markets isn’t necessarily something that will yield a successful outcome. Instead, a good allocation of quality and credit, taking advantage of non-traditional tools not easily accessible in the physical market such as currencies, derivatives, and overlay strategies, all within tactically selected sectors is likely the more effective approach to portfolio management.
The Road Ahead
If you expect further tightening on longer dated bonds, you could overweight your portfolio across the longer end of the curve
Source: BMO GAM
An example of a flattening yield curve
October 1st 2014
October 15th 2014
Yiel
d (%
)
Time to Maturity
Duration Management Active fixed income managers can change the overall duration of their portfolios relative to a benchmark to increase yield and to reduce volatility. Increasing the duration of the portfolio has the effect of increasing the yield of a portfolio (assuming a normal upward-sloping yield curve). Furthermore, when interest rates are expected to rise, managers have the ability to reduce the interest rate exposure of their portfolio by shortening duration, which has the effect of offsetting the price declines of the underlying bonds. Yield Curve Positioning The yield curve at any given time reflects the range of yields that investors of a particular bond can expect over various terms of maturity. Over the term of a bond, changes in interest rate outlook, due to fundamental or technical factors, can change the yield curve in a number of ways:
• If interest rates change by the same amount for all terms of bonds (very rare), the yield curve is said to have had a parallel shift.
• When the difference between short and long term interest rates increases, the yield curve is said to steepen.
• When the difference between short and long term rates decreases, the yield curve is said to flatten.
Normally the yield curve slopes upwards, where short-term rates are lower than long term rates, but there have been times when the yield curve “inverts” or flips due to drastic changes in market outlook. When this happens, long term interest rates can be lower than short-term rates. The yield curve provides the market’s unbiased outlook. If the investors’ view differs, savvy investors can make calls in their bond portfolio to take advantage of the shape of the yield curve
The Need For a More Active Approach

The New Fixed Income Environment
9
BMO Emerging Markets Bond Fund
BMO Global Strategic Bond Fund
BMO High Yield Bond Fund
BMO U.S. High Yield Bond Fund
BMO Floating Rate Income Fund
OBJECTIVE
An emerging market bond fund with exposure to both hard & local currencies to generate absolute total return
A tactical global bond fund that invests in investment grade & high yield bonds and emerging market debt to generate income and total return
A broad high yield bond fund that invests in the U.S. & Canada to generate interest income and total return
A U.S. high yield bond fund that seeks to generate a high level of interest income and absolute total return
A high yield fixed income fund with ultra low duration designed for rising interest rate environments
INCEPTION DATE
August 2013
November 2008 January 1999 June 2008 July 2005
PORTFOLIO MANAGER
Tere Alvares Canida Curtis Mewbourne Lori Marchildon Lori Marchildon Lori Marchildon
CATEGORY High Yield Fixed Income
High Yield Fixed Income High Yield Fixed Income High Yield Fixed Income High Yield Fixed Income
RISK LEVEL Low-to-Medium
Low-to-Medium Low-to-Medium Low-to-Medium Low-to-Medium
DISTRIBUTION Monthly | Variable
Monthly | 3.5¢ Monthly | 4.5¢ Monthly | 4.0¢ Monthly | Variable
BMO Bond Fund
BMO Core Bond Fund
BMO Core Plus Bond Fund
BMO Target Yield ETF Portfolio
BMO World Bond Fund
OBJECTIVE
A Canadian bond fund which has a primary objective of capital preservation
A core Canadian bond fund that blends the importance of capital preservation and maximizing total return
An unconstrained core Canadian bond fund with the ability to use a variety of tools to maximize total return
A core global bond fund that targets risk adjusted yields by using a variety of ETFs
A global bond fund that invests primarily in sovereign debt to generate total return
INCEPTION DATE
May 1988
November 2014 November 2014 April 2012 August 1993
PORTFOLIO MANAGER
Denis Senécal
Denis Senécal Denis Senécal Robert Bechard Robert Bechard
CATEGORY Canadian Fixed Income
Canadian Fixed Income Canadian Fixed Income Global Fixed Income Global Fixed Income
RISK LEVEL Low
Low Low Low Low-to-Medium
DISTRIBUTION Monthly | Variable
Monthly | Variable Monthly | Variable Monthly | 2.4¢ Annual
BMO has Fixed Income Covered
BMO Money Market Fund
BMO U.S. Dollar Money Market Fund
BMO Short-Term Income Class
BMO Mortgage & S/T Income Fund
BMO Laddered Corporate Bond Fund
INCEPTION DATE
May 1988
October 1998 November 2000 July 1974 April 2012
PORTFOLIO MANAGER
Denis Senécal
Peter Arts
Denis Senécal Denis Senécal Rob Bechard
CATEGORY Canadian Money Market
U.S. Money Market Canadian S/T Fixed Income Canadian S/T Fixed Income Canadian S/T Fixed Income
RISK LEVEL Low
Low Low Low Low
0% - 25% High Yield
BMO gives you access to the fixed income world with fantastic choices, opportunities and expertise
75% - 100% CDN Inv. Grade FGN Inv. Grade
EM Debt
0% - 15% High Yield
85% - 100% CDN Inv. Grade FGN Inv. Grade
EM Debt
0% - 10% High Yield
90% - 100% CDN Inv. Grade
0% - 10% Global High Yield
90% - 100% U.S. High Yield
0% - 10% U.S. High Yield
90% - 100% Floating Rate Loans
100% Sovereign Bonds
0% - 30% CDN High Yield
70% - 100% U.S. High Yield
100% Emerging Market
Bonds
0% - 25% High Yield
75% - 100% CDN Inv. Grade FGN Inv. Grade
0% - 100% U.S. Inv. Grade
High Yield
0% - 35% Emerging Market
Bonds
Short-Term Fixed Income
Core Fixed Income
Non-Traditional Fixed Income

The New Fixed Income Environment
10
ACTIVE FIXED INCOME
Multi-Strategy Philosophy: • Bottom-up, value oriented buy-and-hold
process • Top-down views on the macroeconomic
environment • Extensive use of fundamental and
technical credit analysis • Emphasizes diversification of ‘layers’ • Diligent portfolio management
Additionally, there is a strong emphasis on risk management through the use of a proprietary risk management system which allows the team to identify, measure and manage risks that impact the value of the portfolio on a regular basis.
BMO Asset Management’s fixed income team actively employs a multi-strategy approach with the goal of minimizing volatility, enhancing portfolio yield and taking advantage of market opportunities.
SPOTLIGHT: BMO’S CORE FIXED INCOME SOLUTIONS
BMO BOND FUND
BMO CORE PLUS
BOND FUND
BMO CORE BOND FUND
BMO Bond Fund A core Canadian bond fund investing in traditional fixed income instruments.
Capital preservation and providing a stable level of interest income are the main objectives of this strategy.
BMO Core Plus Bond Fund A flexible core Canadian bond fund with the ability to invest in foreign bonds, emerging market debt, and high yield bonds to enhance yield and provide diversification benefits.
Providing a high level of interest income and total return are the main objectives of this strategy.
BMO Core Bond Fund A core Canadian bond fund that invests in both traditional and non-traditional fixed income instruments.
Capital preservation and providing a high level of interest income are the main objectives of this strategy.
In an ever expanding fixed income world, the case for fixed income diversification has become an even more important tool for investors. When constructing a fixed income portfolio and analyzing the resulting risk-return characteristics over a meaningful period of time, it becomes clear how non-traditional fixed income asset classes can work in tandem to build better portfolios.
When analyzed independently, non-traditional fixed income asset classes, such as high yield bonds, emerging market debt, and floating rate loans, to name a few, can bring a sizeable amount of risk as stand-alone investments. Only when combined with more traditional and other non-traditional fixed income holdings can the benefits of diversification begin to take hold, resulting in lower overall volatility while maintaining much of the upside potential.
Diversification
0.90
0.95
1.00
1.05
1.10
1.15
10/01/14 10/02/14 10/03/14 10/04/14 10/05/14 10/06/14 10/07/14 10/08/14 10/09/14 10/10/14 10/11/14 10/12/14 10/13/14 10/14/14 10/15/14 10/16/14 10/17/14 10/18/14 10/19/14 10/20/14 10/21/14
Emerging Market Debt
High Yield Bonds
Investment Grade Corporate Bonds
Global Bonds
Canadian Bonds
Short-Term Bonds
Long Term Bonds
POTENTIAL RISK
POTE
NTI
AL R
ETUR
N
Floating Rate Loans
The Fixed Income Continuum The risk-return characteristics across fixed income
FOR ILLUSTRATIVE PUPROSES ONLY
The New Fixed Income Environment
11
Come in to your local BMO branch and speak to one of our trusted financial professionals to find out more. For more information on BMO Mutual Funds products, please visit us at: http://www.bmo.com/mutualfunds
This report is for informational purposes only and is not and should not be construed as, professional advice to any individual. Individuals should contact their BMO representative for professional advice regarding their personal circumstances and/or financial position. The information contained in this report is based on material believed to be reliable, but BMO Financial Group cannot guarantee the information is accurate or complete.
BMO Mutual Funds are offered by BMO, a financial services firm and a separate legal entity from Bank of Montreal. Commissions, trailing commissions, management fees and expenses may be associated with mutual fund investments. Please read the prospectus of the mutual fund before investing. The indicated rates of return are the historical annual compounded total returns including changes in unit value and reinvestment of all distributions and do not take into account sales, redemption, distribution or optional charges or income taxes payable by any unit holder that would have reduced returns. Mutual funds are not guaranteed, their values change frequently and past performance may not be repeated.
All logos and trademarks of other companies are the property of those respective companies. ® “BMO (M-bar roundel symbol)” is a registered trade-mark of Bank of Montreal, used under licence.