The New Economic Geography: an overview COST Action IS1104 Urbino 18-19 Settembre 2012.
43
The New Economic Geography: an overview COST Action IS1104 Urbino 18-19 Settembre 2012
-
Upload
bartholomew-montgomery -
Category
Documents
-
view
215 -
download
0
Transcript of The New Economic Geography: an overview COST Action IS1104 Urbino 18-19 Settembre 2012.

The New Economic Geography:an overview
COST Action IS1104Urbino 18-19 Settembre 2012

2
Outline
• Introduction• Krugman’s cookbook: main ingredients of NEG
models• Krugman’s story: self-reinforcing
agglomeration• NEG Families, modifications and extensions• Research questions

3
INTRODUCTIONSection I

4
Fujita and Krugman:• “The defining issue of the new economic
geography is how to explain the formation of a large variety of economic agglomeration (or concentration) in geographical space. Agglomeration or the clustering of economic activity occurs at many geographical levels, having a variety of compositions.

5
• For example, one type of agglomeration arises when small shops and restaurants are clustered in a neighborhood.
• Other types of agglomeration can be found in the formation of cities, all having different sizes, ranging from New York to Little Rock; in the emergence of a variety of industrial districts; or in the existence of strong regional disparities within the same country.
• At the other extreme of the spectrum lies the core-periphery structure of the global economy corresponding to the North-South dualism.

6
• It is also important to notice that all this types of agglomeration at different levels are embedded in a larger economy, altogether forming a complex system.” (Fujita and Krugman, 2004, Papers in Regional Science)

7
• The aim of the Action is to provide a better understanding of the EU as a complex, multi-level, evolving geographical system, taking duly into account the dynamic processes occuring within such a system and to develop improved strategies for EU regional policies

8

9
NEG Central question
• How does the spatial distribution of industrial activity look like in the long-run?
1. Equally distributed among regions2. Agglomerated in one region3. Unevenly distributed over the regions

10
KRUGMAN’S COOOKBOOK: MAIN INGREDIENTS OF NEG MODELS
Section II

11
1. General Equilibrium Model (2 x 2 x 2)• 2 symmetric and spatially homogeneous regions• 2 sectors (M)anufacturing and (A)gricultureA perfect competion ; M imperfect competition • Two factors of production (mobile and
immobile)• Full interdependence across (goods and labour)
markets

12
2. Increasing returns and imperfect competition• Dixit-Stiglitz monopolistic competition• No interaction / identical firms• Product differentiation/market segmentation• Production technology: a fixed component
determines decreasing average cost• Price: constant mark-up over marginal costs • Larger production implies higher profit

13
3. Consumer’s preferences• Cobb-Douglas preferences across M and A
goods (fixed shares of income allocated to each sector)
• CES preferences across M varieties (love for variety)
• Cheaper and/or more numerous goods increase welfare

14
4. Distance and trade• Iceberg transport costs (Samuelson, 1952, Economic
Journal)• Transport cost: exogenous parameter that increases price
at destination• For notational convenience «trade freeness parameter
(between 0 and 1)» • Trade is beneficial because it allows access to other
regional markets• However, location is also important since profits are higher
where the local market is bigger (lower transport costs)

15
5. Factor mobility• Induced by differentials in factor rewards (wages,
profits)• The dynamic process of migration/relocation is
gradual over time and adaptive • Typically in continuous time• Link between short and long-run analysis• Migration determines the long term spatial allocation
of economic activities (the regional shares; whereas the overall amount of productive factors is given)

16
KRUGMAN’S STORY: SELF REINFORCING AGGLOMERATION
Section III

17

18
Pivotal: Size of local market for a single firm depends:
• Overall market size in the region (increases it)• Number of firms in the region (reduces it)

19
Thought experiment one factor unit (i.e. manufacturing workers) and the
corresponding firm move from region 1 to region 21. Overall size of the market in 1 increases - • Market-access or market-size effect (agglomeration force):
monopolistic firms locate in the largest market where average production cost is lower and factor rewards are higher
2. Number of firms increases in 1 as well -• Cost of living effect (agglomeration force): the local production
increases and goods are cheaper• Market crowding or market competition effect (spreading
force): firms locate in regions with less competitors

20
Self-reinforcing process 1
• Demand linked circular causality
Production shifting
Expenditure shifting
Production shifting
Expenditure shifting
The productive factor and its owner move together:

21
Self-reinforcing process 2
• Cost-linked circular causality
Cost of living
shifting
Production shifting
Cost of living
shifting
Production shifting
The productive factor and its owner move together

22
Stabilizing force
productive factor
migrates to region 1
Increase in the
number of firms
lower factor
rewards
The productive factor shifts
back in Region 2
• Competion between firms

23
If agglomeration forces exceed dispersion forces. This leads to full agglomeration
If dispersion forces exceed agglomeration forces this leads to symmetric distribution

24
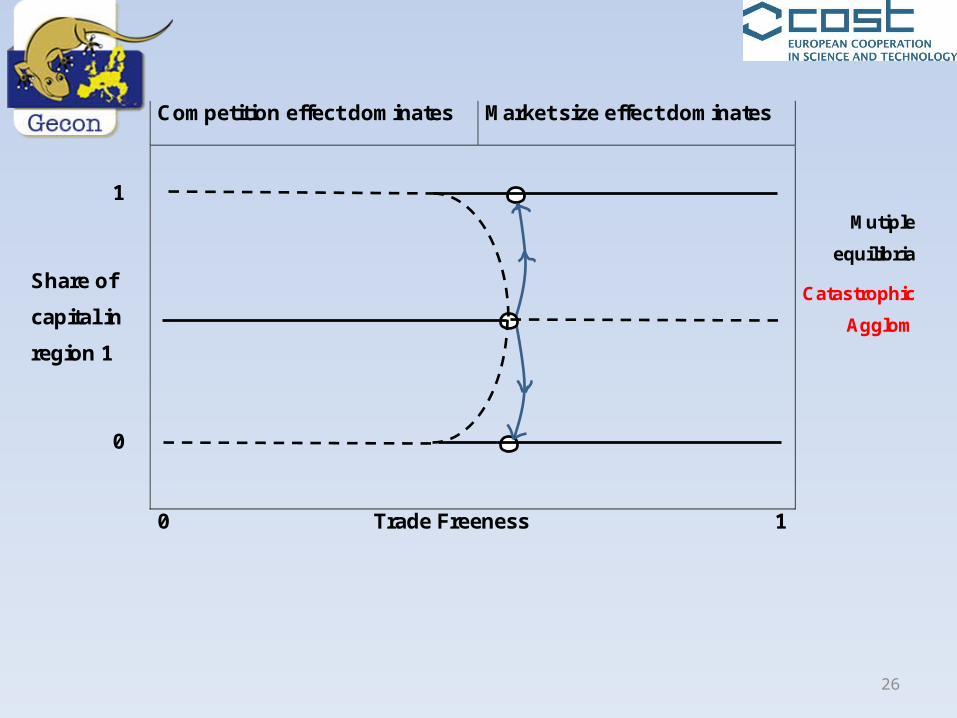
Competition effect dominates Market size effect dominates
1
Share of
capital in
region 1
0
0 Trade Freeness 1

25
Competition effect dominates Market size effect dominates
1
Share of
capital in
region 1
0
Multiple
equilibria
0 Trade Freeness 1
z
26
Competition effect dominates Market size effect dominates
1
Share of
capital in
region 1
0
Mutiple
equilibria
Catastrophic
Agglom
0 Trade Freeness 1

27
Competition effect dominates Market size effect dominates
1
Share of
capital in
region 1
0
Multiple
equilibria
Catastrophic
Agglom.
Endogen.
Asymmetr.
0 Trade Freeness 1

28
Competition effect dominates Market size effect dominates
1
Share of
capital in
region 1
0
Multiple
equilibria
Catastrophic
Agglom.
Endogen.
Asymmetr.
History
matters
0 Trade Freeness 1

29
Competition effect dominates Market size effect dominates
1
Share of
capital in
region 1
0
Multiple
equilibria
Catastrophic
Agglom.
Endogen.
Asymmetr.
History
matters
Irreversibil.
Hysteresis
0 Trade Freeness 1

30
NEG FAMILIES, MODIFICATIONS AND EXTENSIONS
Section IV

31
• NEG families: differentiated according to which factor is interregionally mobile
• Main NEG Variants: most used in the literature• Non exhaustive taxonomy of existing
modifications and extensions

32
NEG Families• Core-Periphery (CP) model (Krugman, 1991, JPE) mobile factor: manufacturing workers immobile factor: agricultural workerstechnology: M workers both variable and fixed component• Footloose entrepreneur (FE) model (Forslid & Ottaviano, 2003, JEG)mobile factor: entrepreneurs/human capitalimmobile factor: unskilled workersproduction technology: entrepreneur only fixed component (simpler)• Footloose capital (FC) model (Martin & Rogers, 1995, JIE)mobile factor: physical capital immobile factor: workerstechnology : physical capital enters only fixed component (simpler)no circular causality (much simpler)

33
NEG main variants• Constructed capital (CC) model (Baldwin, 1999, EER) - mobile or immobile endogenous physical capital - circular causality via capital construction and destructionmay lead to growth (growth poles / growth sinks)• Vertical linkages (VL) model (Venables, 1996, IER)- intermediate manufacturing goods enter in production- circular causality via demand and supply linkages (supplier of intermediate inputs locate in larger output markets / firms locate where the number of supplier of intermediate inputs is larger and production costs lower) • Global and local spillovers (GS and LS) models (Martin & Ottaviano, 1999,
EER; Baldwin, Martin and Ottaviano, 2001, JE Growth)- variants of the CC model that allow for endogeous growth- local spillovers are a dispersion force

34
Taxonomy of extensions 1
Regions
asymmetric
dis-homogeneous (first nature
features)
n > 2 Regions
Spatial structure
Unidimensional (equidistant,
racetrack)
continuous space
Differentiated trade costs
Network structure
Manufacture
Cournot Competition
Heterogeneous firms
Structure of the Economy
Sophisticated modelling of labour market
Transport sector
R&D activities

35
Taxonomy of extensions 1
Regions
asymmetric
dis-homogeneous (first nature
features)
n > 2 Regions
Spatial structure
Unidimensional (equidistant,
racetrack)
continuous space
Differentiated trade costs
Network structure
Manufacture
Cournot Competition
Heterogeneous firms
Structure of the Economy
Sophisticated modelling of labour market
Transport sector
R&D activities

36
Taxonomy of extensions 2
Public policy
government expenditures, taxation and
subsidies
Local goverments competition
welfare analysis
Dynamics
Factors relocation, growth,
demographic changes
Analytical core: processes modelled in continuous time
Discrete time: nonlinear maps
generating complex behaviour
Expectations
myopic
adaptive behavioural rule
Forward looking
Preferences
Upper-tier: quasi-linear
Lower-tier: CES
Upper-tier: CESLower-tier CES
Intertemporal choice

37
Taxonomy of extensions 2
Public policy
government expenditures, taxation and
subsidies
Local goverments competition
welfare analysis
Dynamics
Factors relocation, growth,
demographic change
Analytical core: processes modelled in continuous time
Discrete time: nonlinear maps
generating complex behaviour
Expectations
myopic
Adaptive behavioural rule
Forward looking
Preferences
Upper-tier: quasi-linear
Lower-tier: CES
Upper-tier: CESLower-tier CES
Intertemporal choice

38
RESEARCH QUESTIONSSection V

39
Research topic 1 To represent the economy as a multi-regional Network with more
‘realistic’ features.
Suggested preliminary steps:1. Search for the most suitable analytical framework2. Identification of EU regional specificities (also through data
collection, screening and analysis)3. Identification of the network structure (type of links, strength and
number of connections)4. Implementation of a specific software for the discovery of the
network nature and statistical properties5. Simulation exercises and comparison with real data

40
Research topic 2 To model more elaborated firm relocation decisions (in NEG models very
simplistic).
Improvements (drawing also from contributions by Dawid; Zou):1. Can we learn something from the behavioural literature on
strategic swithching in (financial) markets (chartist vs fundamentalists, discrete choice models, replicator dynamics, experiment on learning, new experiments on spatial decisions)?
2. Can we learn something from the much more elaborate modelling of IO (strategic interaction, heterogeneous firm, continuous space)?
3. Can we incorporate financial markets and its role in the firm (re-)location decision?

41
Research topic 3
To identify determinants of regional attractiveness not included in NEG models.
• for a firm several factors (such as local government quality, crime rates, access to credit, legislation, degree of scholarization of the workforce and so on) may affect relocation.
• Similarly, factors different from wages or remunerations that may affect workers and human capital migration are various (provision of public servicies, housing prices, amenities, work environment, and so on)
• These indicators can be very useful for a better understanding of the distribution of economic activities.

42
Research topic 4
Literature reviews: • To provide an exhaustive taxonomy of the NEG
literature.• To compare old and new approaches to
geographical economics

43
Thank you for your att enti on!