
Facoltà di Architettura PSICOLOGIA DELLA PERCEZIONE L06 a.a. 2001/02 prof. Walter Gerbino.

Sede amministrativa: UNIVERSITA’ DEGLI STUDI DI PADOVA
DIPARTIMENTO DI PSICOLOGIA GENERALE
SCUOLA DI DOTTORATO IN SCIENZE PSICOLOGICHE
INIDIRIZZO DI PERCEZIONE E PSICOFISICA
CICLO XXII
The neural correlates of grasping actions:
observation and execution
DIRETTORE DELLA SCUOLA: CH.MA PROF.SSA CLARA CASCO
COORDINATORE DI INDIRIZZO: CH.MO PROF. UMBERTO CASTIELLO
SUPERVISORE: CH.MO PROF. UMBERTO CASTIELLO
DOTTORANDO: LUCA TURELLA
DATA CONSEGNA TESI 1 Febbraio 2010

2

3
TITLE PAGE...................................................................................... 1
TABLE OF CONTENTS................................................................... 3
CHAPTER 1
GENERAL INTRODUCTION
1.1 The neural underpinnings of action observation .............................................. 9
1.2 Monkey AOS ................................................................................................... 10
1.2.1 Ventral premotor cortex: region F5 and mirror neurons ................... 11
1.2.2 Inferior parietal lobule: region PF/PFG and mirror neurons ............. 16
1.2.3 STS and biological motion responding neurons ............................... 19
1.2.4 Extending the boundary of the AOS and the ‘mirror’ system:
monkey studies ..................................................................................
21
1.3 The Human Action Observation System ......................................................... 25
1.3.1 Human ‘extended’ AOS .................................................................... 28
1.3.2 Human ‘mirror’ system ..................................................................... 32
1.4 Summary .......................................................................................................... 34
1.5 The present research ........................................................................................ 35
Table of contents

4
CHAPTER 2
GENERAL METHODS
2.1 Participants’ characteristics ............................................................................. 37
2.2 Stimuli .............................................................................................................. 37
2.3 Procedures and task ......................................................................................... 38
2.4 Data acquisition ............................................................................................... 38
2.5 Pre-processing of fMRI data ............................................................................ 38
2.6 Measures of interest ......................................................................................... 39
2.7 fMRI data analysis ........................................................................................... 40
2.8 Localization of activated brain regions ............................................................ 40
CHAPTER 3
INVESTIGATING THE NEURAL CIRCUIT UNDERLYING THE OBSERVATION OF GRASPING MOVEMENTS: A STUDY ON MULTIPLE SCLEROSIS PATIENTS
Abstract .................................................................................................................. 43
3.1 Introduction ...................................................................................................... 41
3.2 Materials and Methods ..................................................................................... 42
3.2.1 Participants ........................................................................................ 43
3.2.2 Stimuli ............................................................................................... 44
3.2.3 Procedures ......................................................................................... 45
3.2.4 Data analysis ..................................................................................... 45
3.3 Results .............................................................................................................. 46
3.4 Discussion ….................................................................................................... 48

5
CHAPTER 4
EXPLORING THE NEURAL CIRCUIT UNDERLYING THE OBSERVATION OF GRASPING MOVEMENTS: THE EFFECT OF ACTION TRANSITIVITY
Abstract .................................................................................................................. 53
4.1 Introduction ...................................................................................................... 54
4.2 Methods ........................................................................................................... 55
4.2.1 Participants ........................................................................................ 55
4.2.2 Stimuli ............................................................................................... 55
4.2.3 Procedures and task ........................................................................... 57
4.2.3.1 AOS localiser ..................................................................... 57
4.2.3.2 Main experiment ................................................................ 58
4.2.4 Data analysis ..................................................................................... 61
4.2.4.1 AOS localiser ..................................................................... 61
4.2.4.2 Main experiment ................................................................ 61
4.3 Results .............................................................................................................. 61
4.3.1 AOS localiser .................................................................................... 61
4.3.2 Main experiment ............................................................................... 62
4.4 Discussion ........................................................................................................ 63
4.4.1 Right Posterior Temporal Sulcus ...................................................... 63
4.4.2 Anterior Intraparietal Sulcus ............................................................. 65

6
CHAPTER 5
THE ‘MIRROR’ SYSTEM IN HUMANS
Abstract .................................................................................................................. 67
5.1 Introduction ...................................................................................................... 68
5.2 Materials and Methods ..................................................................................... 68
5.2.1 Participants ........................................................................................ 68
5.2.2 Apparatus .......................................................................................... 68
5.2.3 Stimuli ............................................................................................... 69
5.2.3.1 Action Observation ............................................................ 69
5.2.3.2 Action Execution ................................................................ 70
5.2.4 Procedures and task ........................................................................... 70
5.2.4.1 Action Observation ............................................................ 70
5.2.4.2 Action Execution ................................................................ 71
5.2.5 Data analysis ..................................................................................... 71
5.2.5.1 Action Observation ............................................................ 72
5.2.5.2 Action Execution ................................................................ 72
5.2.5.3 Conjunction analysis .......................................................... 72
5.3 Results .............................................................................................................. 73
5.3.1 Action Observation ........................................................................... 73
5.3.2 Action Execution ............................................................................... 74
5.3.3 Conjunction analysis ......................................................................... 75
5.4 Discussion ........................................................................................................ 76

7
CHAPTER 6
THE RESPONSE OF THE HUMAN VENTRAL PREMOTOR ‘MIRROR’ REGION TO THE TYPE OF OBSERVED AGENT
Abstract .................................................................................................................. 77
6.1 Introduction ...................................................................................................... 78
6.2 Materials and Methods …................................................................................. 79
6.2.1 Participants ........................................................................................ 79
6.2.2 Stimuli ............................................................................................... 79
6.2.3 Procedures and task ........................................................................... 80
6.2.4 Data analysis ..................................................................................... 80
6.3 Results .............................................................................................................. 81
6.4 Discussion ........................................................................................................ 82
CHAPTER 7
GENERAL CONCLUSIONS
7.1 Conclusive remarks ......................................................................................... 85
ACKNOWLEDGEMENTS .............................................................. 89
REFERENCES .................................................................................. 91

8
Appendix A ........................................................................................ 105
Appendix B ......................................................................................... 107
Appendix C ........................................................................................ 110
Appendix D ........................................................................................ 112

9
1.1 The neural underpinnings of action observation
The discovery of ‘mirror’ neurons (di Pellegrino, Fadiga, Fogassi, Gallese, &
Rizzolatti, 1992), visuomotor neurons responding both to the observation and the
execution of grasping action, had a great impact on the study of the motor system and
on neuroscience in general. The possibility that the motor system is not merely involved
in motor planning and execution, but it might play an important role in cognitive
processing, led to a complete rethinking of its role within the brain.
Since the discovery of mirror neurons there has been a great deal of speculation
regarding the existence of a similar system in humans and the functions it may serve.
Reasonable proposals have suggested that they mediate action observation and
understanding (Rizzolatti, Fogassi, & Gallese, 2001). Whereas, intriguing, but more
speculative proposals suggest that they mediate imitation (Iacoboni, 2005),
understanding of intention (Iacoboni et al., 2005), speech processing (Rizzolatti &
Craighero, 2004), music processing and misperception of emotion in music (Gridley &
Hoff, 2006, Molnar-Szakacs & Overy, 2006), empathy (Leslie, Johnson-Frey, &
Grafton, 2004), cigarette addiction (Pineda & Oberman, 2006), and sexual preference
(Ponseti et al., 2006). However, at present, compelling experimental evidence for the
possible involvement of the ‘mirror’ system in any one of these functions is relatively
weak.
The present thesis aims at investigating the functional role and the peculiar
properties of the cerebral areas involved in observing actions. In the following sections,
1. General introduction

10
I shall provide an overview of the neural substrates underlying action observation
termed as Action Observation System (AOS) in both non-human primates and humans.
Then I shall report on a series of human neuroimaging studies which have been
designed as to better characterize the human AOS.
1.2 Monkey AOS
Single-cell recording studies have classically defined the AOS as comprehending
three areas (Keysers & Perrett, 2004; Rizzolatti & Craighero, 2004): the superior
temporal sulcus (STS) in the temporal cortex (Perrett et al., 1989; Perrett, Mistlin,
Harries, & Chitty, 1990; Jellema & Perrett, 2006), area F5 in the premotor cortex (di
Pellegrino et al., 1992; Gallese, Fadiga, Fogassi, & Rizzolatti, 1996; Rizzolatti, Fadiga,
Fogassi, & Gallese, 1996a; Umiltà, et al., 2001) and area PF/PFG in the inferior parietal
cortex (Gallese, Fadiga, Fogassi, & Rizzolatti, 2002; Fogassi et al., 2005; Rozzi, Ferrari,
Bonini, Rizzolatti, & Fogassi, 2008; see Figure 1.1 for an anatomical localization within
macaque monkey brain).
Figure 1.1. Monkeys AOS. Illustration of the location of area F5 in ventral premotor cortex, area PF/PFG of the inferior parietal lobule and the superior temporal sulcus (STS) together with their anatomical connections (arrows) shown on a lateral view of the macaque brain. Abbreviations: a, arcuate sulcus; c, central sulcus; ip, intraparietal sulcus; s, sylvian sulcus. (Modified from Keysers & Perrett, 2004).

11
In the next sections, I shall describe the particular features of the neurons studied
within each of these areas. Then I shall introduce the latest findings demonstrating the
involvement of additional areas in action observation which fall outside the classically
defined AOS.
1.2.1 Ventral premotor cortex: region F5 and mirror neurons
Region F5 is located within the ventral premotor cortex (see Figures 1.1 and 1.2 for
localization) and it is involved in the control of hand and/or mouth movements
(Rizzolatti et al., 1988).
Firing of neurons within F5 is correlated with specific goal-related motor acts
performed using either hands or the mouth, such as grasping, tearing, holding,
manipulating. The execution of a simple movement involving exactly the same muscles,
but for a different aim, fails to activate these neurons.
As the present thesis is related to grasping actions, I shall further describe only those
neurons responding to actions performed using the hand. Within this category of motor
acts, the most represented category is grasping and most neurons are selective for one
type of grip: e.g., precision grip, finger prehension or whole hand prehension.
A recent study (Belmalih et al., 2009) demonstrated that region F5 comprehends
three architectonically distinct subregions, probably corresponding to functionally
different areas (see Figure 1.2). Two of these sub-regions are located within the inferior
postarcuate bank, one more posteriorly (F5p) and the other more anteriorly (F5a). The
third sub-region occupies most of the postarcuate convexity (F5c).

12
Figure 1.2. Parcellation of region F5. Cytoarchitectonic parcellation of the agranular frontal cortex (areas indicated with F and arabic numbers) and of the parietal lobe (areas indicated with P and progressive letters). The enlargement of the frontal region (rectangle on the right) shows the parcellation of area F5 buried within the arcuate sulcus. Abbreviations: intraparietal sulcus. AIP, anterior intraparietal area; IP, intraparietal sulcus; LIP, lateral intraparietal area; MIP, medial intraparietal area; POs, parieto-occipital sulcus; As, superior arcuate sulcus; Ai inferior arcuate sulcus; C, central sulcus; Ca, calcarine fissure; CG, cingulate cortex; FEF, frontal eye field; L, lateral sulcus; Lu, lunate sulcus; P, principal sulcus; STS, superior temporal sulcus. (Modified from Rizzolatti & Fabbri-Destro, 2008).
Neurons within all the sub-regions of F5 share the same motor properties, but some
of them also show visual properties. Up to now, two categories of visuo-motor neurons
have been described in F5:
(i) ‘canonical’ neurons, responding to the sight of graspable objects, mainly present in
area F5p (see Figure 1.2; Murata et al., 1997; Raos, Umiltá, Murata, Fogassi &
Gallese, 2006). Please note that given the focus of the present thesis on action
observation ‘canonical’ neurons will not be discussed at great length;
(ii) ‘mirror’ neurons, which are mainly reported in area F5c (see Figure 1.2, di
Pellegrino et al., 1992; Gallese et al., 1996; Rizzolatti et al., 1996a; Umiltà et al.,
2001). The peculiarity of mirror neurons is that they discharge both when the
monkey performs a specific goal-directed hand action and when it observes another
monkey (or the experimenter) performing the same or a very similar action (see
Figure 1.3). It has been proposed that these neurons may match the properties of the
observed action with the representation of the motor acts within the observer’s

13
premotor cortex. For this reason, they were considered as the first evidence of a
system subtending an action observation/execution matching system (di Pellegrino
et al., 1992; Gallese et al., 1996; Rizzolatti et al., 1996a).
Figure 1.3. Visual and motor responses of a mirror neuron in area F5. The panels represent the experimental conditions triggering activation in mirror neurons. A) The neuron discharges during observation of a grasping movement done by the experimenter and B) during monkey grasping movements. (Modified from Fabbri-Destro & Rizzolatti, 2008).
Mirror neurons show different levels of congruence between the properties of the
representation of the executed and the observed actions. In some cases (i.e. ‘strictly
congruent’ neurons), a response is elicited while executing a specific motor act and
while observing only the same action both in terms of goal (e.g. grasping) and means
(e.g. precision grip). In other cases (i.e. ‘broadly congruent’ neurons), cells are active
when the observed action possesses the same goal (e.g. grasping) achieved either using
the same or a different mean (e.g. both precision grip and whole hand prehension). This
A
B

14
seems to suggest that there are two levels of possible matching between the observed
and the executed action: one linked to both the goal and the means of the observed
action; the other, more abstract, based only on the goal.
In order to have a better comprehension of the role mirror neurons might play some
of their features have to be described. These cells are not active when the action is
executed in absence of an object (i.e. intransitive actions) or during the mere visual
presentation of an object (as ‘canonical neurons’). This means that only object-related
actions (i.e. transitive actions) trigger a discharge within these neurons.
Strong evidence in favour of the claim that mirror neurons are involved in action
understanding came from a study by Umiltà et al. (2001). These authors adopted an
elegant experimental design in order to investigate the properties of the representation
of the observed actions. The procedure took advantage of the fact that mirror neurons
respond only during the observation of transitive actions, but not during the observation
of intransitive ones.
The neurons were tested in two basic conditions (see Figure 1.4). In the first
condition, the monkey was shown a fully visible object-related action (see Figure 1.4A,
‘full vision grasping’ condition). In the second condition, the monkey saw the same
action but with its final part hidden (see Figure 1.4C, ‘hidden grasping’ condition). In
these ‘hidden’ trials, the experimenter performed a reach-to-grasp movement towards an
object placed behind a screen. At the beginning of the trial the object was fully visible,
then was covered by a screen and subsequently grasped by the experimenter.
All mirror neurons responded to the observation of a visible grasping action (‘full
vision grasping’ see Figure 1.4A) and some of them also responded when the final part
of the action was hidden, but the monkey knew that an object was present behind the
partition (‘hidden grasping’ see Figure 1.4C). As already reported, the observation of a

15
fully visible intransitive action (‘full vision pantomime’ see Figure 1.4B) did not
activate the neuron. Finally, the same neuron did not discharge when observing a
mimed action even when the last part of the action was hidden (‘hidden pantomime’ see
Figure 1.4D). This last control condition strongly supports the claim that mirror neurons
might be responsible for understanding the meaning of an action, allowing the
discrimination between transitive and intransitive actions simply relying on previous
information provided by the enviroment.
Figure 1.4. Response of a mirror neuron in the four conditions of the study by Umiltà & colleagues (2001). Mirror neuron responses to action observation in full vision (A and B) and in hidden condition (C and D). The upper panel shows the discharge of the neuron. The lower part of each panel illustrates schematically the experimenter’s action as observed from the monkey’s vantage point. The asterisk indicates the location of a stationary marker attached to the frame. For the hidden conditions the experimenter’s hand started to disappear from the monkey’s vision when crossing this marker. Histograms are aligned with the moment at which the experimenter’s hand was closest to the marker. Histograms bin width = 20 ms. The ordinate is in spike/s. (Modified from Umiltà et al. 2001).
This classical description of mirror neurons should end reporting that they discharge
only when a biological effector (e.g. the hand) interacts with an object; if the actor uses
a tool (e.g. a plier) the neuron does not discharge. But, a recent study by Ferrari, Rozzi
& Fogassi (2005) demonstrated that some mirror neurons respond during the
A B
D C

16
observation of actions performed using tools (e.g. using a plier to take an object). This
was evident only after a long exposure to the observation of the experimenter using a
tool. The motor response of such cells was related to the execution of grasping
movements, because the monkey can not utilize the tool. These ‘tool-responding’ mirror
neurons seem to show that the representation of observed actions might be modified
according to the experience of the monkeys and may incorporate actions which lie
outside the motor repertoire of the monkey. In this case, the proposed matching
mechanism seems to work only in relation to the goal of the action, because the mean
by which this goal is achieved are completely different.
1.2.2 Inferior parietal lobule: region PF/PFG and mirror neurons
Mirror neurons were later discovered in a region of the inferior parietal lobule, area
PF/PFG (see Figure 1.1 for localization). A recent study (Rozzi et al., 2008)
investigated in details the distribution and properties of the neurons within the
subdivisions of the inferior parietal lobule in macaque (PF, PFG, PG). Each subdivision
is characterized by the presence of neurons with specific motor and sensory properties.
For what concerns mirror neurons, they have been found mainly in area PF/PFG and
their general features appear to be very similar to those found within the ventral
premotor cortex. In particular, the majority of these cells present the same pattern of
response as the neurons in F5c. They discharge both for action execution and action
observation. As in F5c there are PF/PFG mirror neurons for hand and mouth action and
there are strictly and broadly congruent neurons.
Fogassi et al. (2005) investigated neurons with motor properties and mirror neurons
of area PF/PFG. The neurons recorded from these areas were tested in two main
conditions (see Figure 1.5). In the first condition, the animal performed a reach-to-grasp
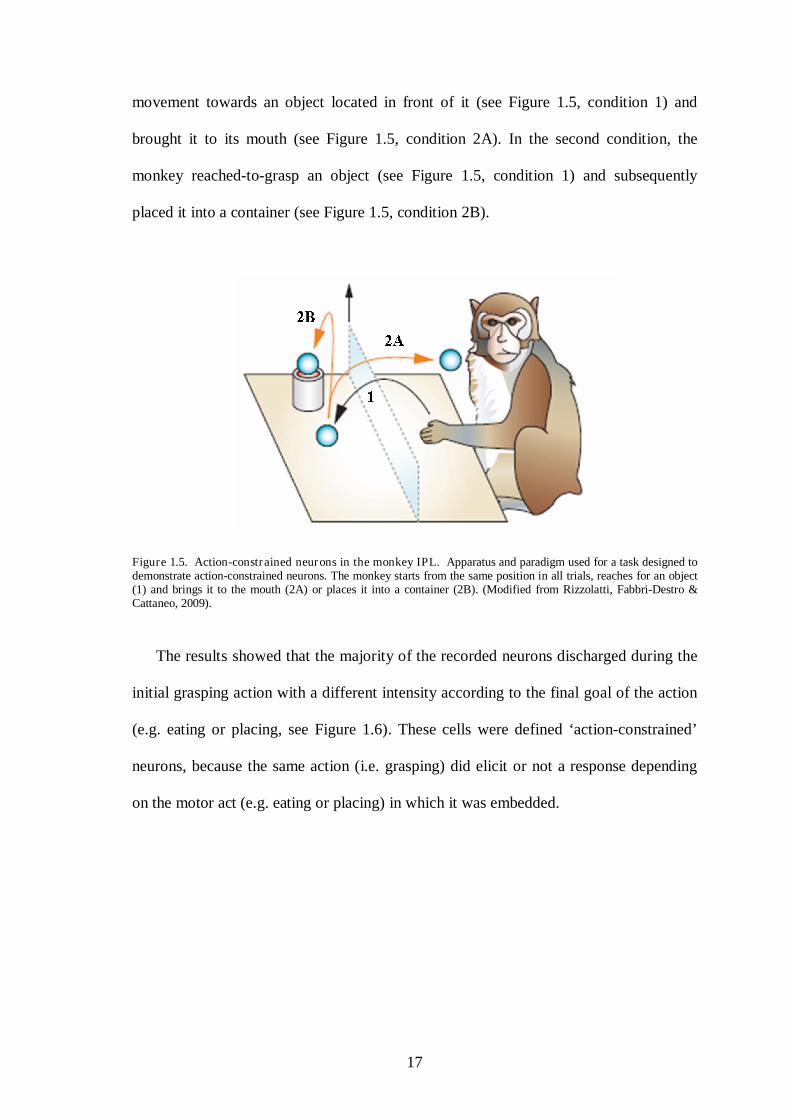
17
movement towards an object located in front of it (see Figure 1.5, condition 1) and
brought it to its mouth (see Figure 1.5, condition 2A). In the second condition, the
monkey reached-to-grasp an object (see Figure 1.5, condition 1) and subsequently
placed it into a container (see Figure 1.5, condition 2B).
Figure 1.5. Action-constrained neurons in the monkey IPL. Apparatus and paradigm used for a task designed to demonstrate action-constrained neurons. The monkey starts from the same position in all trials, reaches for an object (1) and brings it to the mouth (2A) or places it into a container (2B). (Modified from Rizzolatti, Fabbri-Destro & Cattaneo, 2009).
The results showed that the majority of the recorded neurons discharged during the
initial grasping action with a different intensity according to the final goal of the action
(e.g. eating or placing, see Figure 1.6). These cells were defined ‘action-constrained’
neurons, because the same action (i.e. grasping) did elicit or not a response depending
on the motor act (e.g. eating or placing) in which it was embedded.

18
Figure 1.6. Example of motor properties of PF/PFG neurons. Activity of three PFG neurons during the motor task in conditions 2a (grasp to place) and 2b (grasp to eat). Raster histograms are synchronized with the moment at which the monkey touched the object to be grasped. Unit 67 fires during grasping to eat and not during grasping to place. Unit 161 is selective for grasping to place. Unit 158 does not show any task preference. (Modified from Rizzolatti, Fabbri-Destro & Cattaneo, 2009).
Most of these ‘action-constrained’ neurons have mirror properties. Almost all of
them selectively discharge when the monkey observes motor acts embedded in a
specific action (e.g. grasp-to-eat but not grasp-to-place, see Figure 1.7).
Figure 1.7. Example of visual properties of PF/PFG mirror neurons. Visual responses of PFG mirror neurons during the observation of grasping to eat and grasping to place performed by an experimenter. Unit 87 is selective for grasping to eat, unit 39 is selective for grasping to place and unit 80 does not display any task preference. (Modified from Rizzolatti, Fabbri-Destro & Cattaneo, 2009).
The activation of action-constrained mirror neurons seems to code not only a
generic grasp movement, but specific grasps such as ‘grasping for eating’ or ‘grasping

19
for placing’ (see Figure 1.17). This coding implies that when the monkey observes a
grasping action done by another it is able to understand, and maybe predict, what the
individual’s next motor act will be on the basis of the information provided by the
environment. To conclude, the animal is able to comprehend the ‘motor’ intentions
behind the observed motor act based on environmental cues (e.g. presence of the
container in the grasping-to-place condition).
1.2.3 STS and biological motion responding neurons
Single cell recording studies within STS reported on neural populations having
complex response properties (see Figure 1.1 for localization). These experiments
revealed response to visual information related to the shape and posture of the fingers,
hands, arms, legs and torso. In addition face-selective-neurons responding to facial
details such as the shape of the mouth and the direction of gaze were also found
(Desimone, Albright, Gross, & Bruce, 1984; Wachsmuth, Oram, & Perrett, 1994;
Perrett et al., 1989, 1990; Jellema, Backer, Wicker, & Perrett, 2000; Jellema & Perrett,
2006).
Of particular interest for the purpose of this thesis are the STS neurons responding
to different type of goal-directed hand action, such as reaching for grasping, tearing and
manipulating objects (Perrett et al. 1989, 1990; Jellema et al., 2000; Jellema & Perrett,
2006). For instance, some cells discharge to the sight of object-related grasping action,
but not to a pantomime of the same action, or if there is no interaction between the hand
and the object. In this case, the neurons do not respond even when the pantomime is
observed nearby the object. These neurons are also sensitive to the form of the effector
performing the grasping action, not responding to the sight of a tool used to execute a
similar action (Perrett et al. 1989, 1990; Jellema et al., 2000; Jellema & Perrett, 2006).

20
This sensitivity of STS cells to the relation between the biological effector and the
object allow these cells to detect causal relations (Perrett et al., 1989).
Recently, Barraclough, Keith, Xiao, Oram, & Perrett (2009) reported an interesting
property of some cells responding to the observation of grasping and placing actions.
The response of these neurons was modulated by transitivity, i.e. the presence of an
object as the target of the action. These neurons discharge during transitive actions, but
they also respond, but to a lesser extent, during the observation of the pantomime for the
same action (intransitive) (see Figure 1.8).
Figure 1.8. Response of action-selective STS neurons. Responses of the average cell to the preferred action with and without the presence of the object, and when the object is presented alone. SDFs (grey = SEM) is presented alone averaged across cells. SDFs (grey = SEM) from responses of 15 cells, of which 4 preferred grasping actions and 11 preferred placing actions.(Modified from Barraclough et al., 2009)
A final consideration on STS cells is that, although extensively tested, they do not
discharge during action execution of any kind (Keysers & Perrett, 2004).

21
1.2.4 Extending the boundary of the AOS and the ‘mirror’ system:
monkey studies
Recent neuroimaging evidence has indicated that other areas, outside the three AOS
core regions (F5c, PF/PFG, STS), may be part of an ‘extended’ AOS comprehending
prefrontal, premotor, motor, somatosensory and posterior parietal cortices (Raos,
Evangeliou, & Savaki, 2004, 2007; Nelissen, Luppino, Vanduffel, Rizzolatti, & Orban,
2005; Evangeliou, Raos, Galletti, & Savaki, 2009).
Nelissen et al. (2005) used fMRI to map the activation of the anterior part of the
frontal lobe during action observation, and in particular of the regions near the arcuate
sulcus. In addition to F5, other regions involved in action observation were revealed
(areas 45 and 46).
Furthermore these authors applied a region of interest (ROI) analysis to four regions
which were found significantly activated at the level of whole brain analysis. The four
regions were part of area 45, namely area 45B, and the three subregions of F5: F5c, F5p
and F5a (see Figure 1.9A for activation and 1.9B for localization).
Interestingly area F5c, in which mirror neurons are usually found, responded only
when an individual grasped an object, whereas merely seeing a hand alone (detached
from a body) grasping an object did not elicit a response.
The authors suggested that the view of the agent performing the action is necessary
to trigger a response in this area. However, the other three areas 45B, F5p and F5a,
responded both to the observation of a hand alone or of an entire person grasping an
object.

22
Figure 1.9. Activation of the areas near the arcuate sulcus and regions of interest. A) SPMs plotting voxels (coloured red to yellow), which were significantly (P < 0.05, corrected for multiple comparisons) more active when the monkeys viewed actions of the isolated hand compared with viewing their scrambled counterpart (in the group of three monkeys (M1, M3, M5) superimposed on sagittal sections through the left hemisphere of M3, at levels ranging from –23 to –16. B) Schematic representation of the four ROIs on four sagittal sections through M3’s brain at same levels as in A) and B). P, principal sulcus; AI, arcuate sulcus inferior ramus; C, central sulcus; d, dorsal; v, ventral; a, anterior; and p, posterior. In (A), arrows point to local maxima in the arcuate sulcus (arrow 1), area 46 (arrow 2); and 45A (arrow 3). (Modified from Nelissen et al., 2005).
Area F5 seemed to host two different representations of hand action: the first was
more related to the agent acting, requiring visual or context-dependent information; the
second was more abstract and required less visual detailed or context-dependent
properties. This brought to the conclusion that different representations of action, with
different functions, were stored within frontal areas.
Recent studies (Raos et al., 2004, 2007; Evangeliou et al., 2009), using the
deoxyglucose quantitative autoradiographic method, investigated the role of motor and
parietal cortices in hand grasping execution and observation. The main results of these
studies (see Figures 1.10 and 1.11) were that for action observation (in green), and not
only for action execution (in red, see Figures 1.10 and 1.11), widespread activation was
present within motor and parietal regions. Furthermore, a close inspection to the results
concerned with the frontal cortex (see Figure 1.10), permits to observe a widespread
D
A
B

23
recruitment of regions within premotor and motor cortex for action observation. A
finding which supports and extends the finding by Nelissen et al. (2005). In addition,
the approach adopted in these studies allowed the authors (Raos et al., 2007) to define
‘mirror’ areas, as regions recruited both for observation and execution of action (in
yellow, see Figures 1.10 and 1.11). An interesting result is that overlapping activity for
action observation and execution (in yellow in Figure 1.10) was not limited to ‘mirror’
area F5c, but comprehended the entire F5, and other premotor areas such as dorsal
premotor cortex (F2) and primary motor cortex (F1).
Figure 1.10. Quantitative 2D maps of metabolic activity in the lateral-frontal cortex. A) Lateral view of a monkey brain with the central sulcus (Cs) and the posterior bank of the arcuate sulcus (As) unfolded. Dotted lines depict the fundus of the As and that of the Cs. Shaded area indicates the reconstructed cortex. Abbreviations: A, Anterior; D, dorsal; P, posterior; V, ventral. B) Schematic illustration of the geometrically normalized reconstructed cortical field. Black lines correspond to surface landmarks and white lines to cytoarchitectonically identified borders of the labeled cortical areas. C) Red and green represent activations induced by grasping execution and grasping observation, respectively. Yellow stands for activations induced by both execution and observation of the same action. White lines correspond to the surface landmarks and the cytoarchitectonic borders illustrated in B). (Modified from Raos et al., 2007).
A
B
C

24
With respect to the parietal cortex, Evangeliou et al. (2009) demonstrated a
widespread involvement of the superior and the inferior parietal lobuli and intraparietal
cortex during action observation (see Figure 1.11). Results regarding ‘mirror’ activity
seem to point to the direction of a network of parietal regions recruited for both action
perception and action execution, including the ‘mirror’ region PF/PFG discovered using
single cell recording. As evident in Figure 1.11, there is a widespread ‘mirror’ acitivity
within the intraparietal cortex, but also in the superior and inferior parietal lobuli.
Figure 1.11. Quantitative 2D-maps of metabolic activity in the parietal cortex. A) Lateral view of the of a monkey brain. Shaded area indicates the reconstructed cortex around the intraparietal sulcus (IPs), surrounded by the central (Cs) and superior temporal sulci (STs) and the lateral fissure. B) Postero-lateral view of the partially dissected hemisphere of a monkey brain. Shaded area represents the reconstructed medial and lateral banks of the intraparietal cortex. Abbreviations: A, anterior; D, dorsal; P, posterior; V, ventral. C-D) Schematic representation of the geometrically normalized reconstructed cortical field. Black lines correspond to surface landmarks, solid white lines to cytoarchitectonically identified borders of the labeled cortical areas. E-H) Red and green represent activations induced by action execution and action observation, respectively. Yellow stands for activations induced by both execution and observation of the same action. (Modified from Evangeliou et al., 2009).
A
C D
B
E F G H

25
In conclusion, a widespread network of parietal and frontal regions, that we can
term ‘extended’ AOS, is recruited during action observation. A subset of these areas
seems to be recruited for both action observation and execution. These ‘mirror’ regions
are conceptually different from mirror neurons, because overlapping activity found in
neuroimaging studies does not imply necessarily the presence of neurons with
visuomotor properties within a region. It might well be that two separate populations of
neurons, one visual and one motor are intermingled within such area. Another
possibility is that a neural population, or more than one, might be responsible for coding
a common process related to both behaviours.
1.3 The Human Action Observation System
The use of neuroimaging techniques such as functional magnetic resonance imaging
(fMRI) and positron emission tomography (PET) has provided the possibility to map
the cortical areas involved in action observation in humans. The first two neuroimaging
studies which investigated the areas involved in the observation of hand grasping, were
conducted by Rizzolatti’s and Grafton’s groups (Rizzolatti et al., 1996b; Grafton, Arbib,
Fadiga, & Rizzolatti, 1996).
In the first study, Rizzolatti et al. (1996b) used PET to localize brain regions that are
active during the observation and execution of grasping movements. Subjects were
tested under three conditions: in the first condition they observed grasping movements
of common objects performed by the experimenter; in the second condition, they
reached and grasped the same objects. These two conditions were compared with a third
condition consisting in object observation. The contrast between action observation and
object observation revealed that grasp observation activated the left superior temporal
sulcus and the left inferior frontal gyrus.

26
In a second PET study, Grafton et al. (1996) investigated the areas involved in
observation and imagination of grasping movements. In a condition, subjects saw
precision grasping of common objects done by the experimenter. Whereas in a second
condition, subjects imagined themselves grasping the objects without performing any
movement. A third condition consisted in object observation. The contrast between
grasping observation and object observation confirmed the results by Rizzolatti et al.
(1996b). The authors found activation within the left inferior frontal gyrus and the
superior temporal sulcus, but also within the left and right posterior inferior parietal
areas and the right premotor cortex. To sum up, these two studies revealed regions in
humans which have an analogous distribution and similar properties as those described
in monkeys.
The role of each area involved in action observation has been subsequently
investigated in a series of fMRI studies looking at differential loci of activation
depending by the type of observed moving effector (e.g., Buccino et al., 2001; Pelphrey,
Morris, Michelich, Allison, & McCarthy, 2005).
The observation of body part movements (transitive and intransitive actions)
activated the premotor cortex in a somatotopically fashion (Buccino et al., 2001). That
is, different areas coded actions executed by different effectors (i.e. hand, mouth, leg),
following the classical motor organization of Penfield’s Homunculus (see Figure 1.12A,
B, C, D).
Furthermore, seeing an object-related action activates also the posterior parietal
cortex following a somatotopic organization (see Figure 1.12Ab, Bb, Cb, Db). In
general it was proposed that the mirror system in humans is not restricted to mouth (A)
and hand (B) actions, but includes also foot (C). Interestingly, the present results seem
27
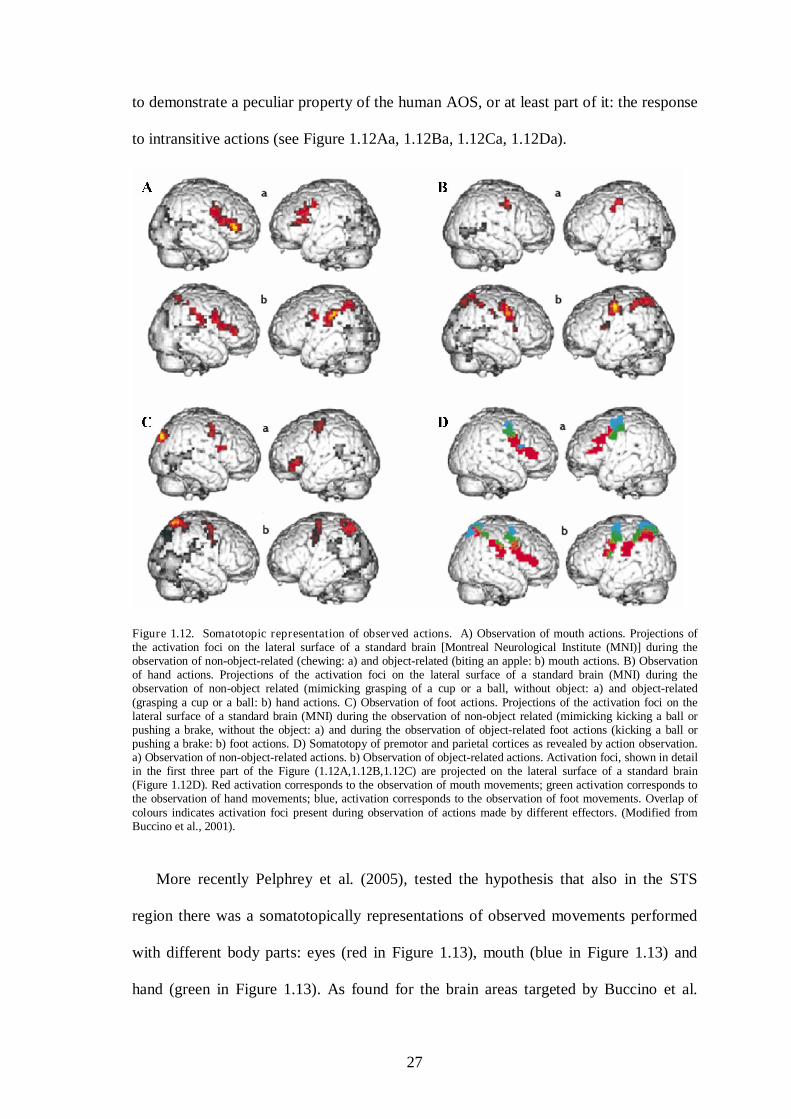
to demonstrate a peculiar property of the human AOS, or at least part of it: the response
to intransitive actions (see Figure 1.12Aa, 1.12Ba, 1.12Ca, 1.12Da).
Figure 1.12. Somatotopic representation of observed actions. A) Observation of mouth actions. Projections of the activation foci on the lateral surface of a standard brain [Montreal Neurological Institute (MNI)] during the observation of non-object-related (chewing: a) and object-related (biting an apple: b) mouth actions. B) Observation of hand actions. Projections of the activation foci on the lateral surface of a standard brain (MNI) during the observation of non-object related (mimicking grasping of a cup or a ball, without object: a) and object-related (grasping a cup or a ball: b) hand actions. C) Observation of foot actions. Projections of the activation foci on the lateral surface of a standard brain (MNI) during the observation of non-object related (mimicking kicking a ball or pushing a brake, without the object: a) and during the observation of object-related foot actions (kicking a ball or pushing a brake: b) foot actions. D) Somatotopy of premotor and parietal cortices as revealed by action observation. a) Observation of non-object-related actions. b) Observation of object-related actions. Activation foci, shown in detail in the first three part of the Figure (1.12A,1.12B,1.12C) are projected on the lateral surface of a standard brain (Figure 1.12D). Red activation corresponds to the observation of mouth movements; green activation corresponds to the observation of hand movements; blue, activation corresponds to the observation of foot movements. Overlap of colours indicates activation foci present during observation of actions made by different effectors. (Modified from Buccino et al., 2001).
More recently Pelphrey et al. (2005), tested the hypothesis that also in the STS
region there was a somatotopically representations of observed movements performed
with different body parts: eyes (red in Figure 1.13), mouth (blue in Figure 1.13) and
hand (green in Figure 1.13). As found for the brain areas targeted by Buccino et al.

28
(2001), it was revealed that different sectors of the STS region codes biological motion
in an effector dependent manner (see Figure1.13).
FIGURE 1.13. Greatest response topography maps in posterior superior temporal sulcus for six single subjects. Each panel represent a single subject. Red voxels exhibited the greatest response to Eyes, blue voxels to Mouth, and green voxels to Hand . (Modified from Pelphrey et al., 2005).
To summarize, an action observation system seems to be present also in humans and
it is composed by at least three groups of areas: a) the superior temporal sulcus, b) the
ventral precentral cortex and the inferior frontal gyrus, c) the posterior parietal cortex.
These regions resemble the three ‘core’ components of the monkey AOS, supporting a
possible homology between the system for the two species.
1.3.1 Human ‘extended’ AOS
A common result stemming from recent fMRI neuroimaging studies (Brass &
Heyes, 2005) is the involvement of areas during action observation which exceeds the
above mentioned ‘core’ regions. These data point to the direction of a human ‘extended’

29
AOS, similar to that uncovered in monkeys, comprehending frontal and parietal regions.
This ‘extended’ AOS includes the following regions: inferior frontal gyrus, ventral and
dorsal premotor cortex, posterior parietal cortex (superior, inferior and intraparietal
cortices) and the superior temporal sulcus (see Figure 1.14).
Figure 1.14. Human ‘extended’ AOS. Areas of activation during movement observation. A schematic, lateral view of the human cortex showing areas that have consistently been found to be active during passive observation of biological motion. (1) the pars triangularis and the pars opercularis of the inferior frontal gyrus, (2) the ventral premotor cortex, (3) the dorsal premotor cortex, (4) the superior parietal lobule and the intraparietal cortex (5) the inferior parietal cortex, and (6) the posterior superior temporal sulcus. (Modified from Brass & Heyes 2005).
A recent series of fMRI studies (Hamilton & Grafton, 2006, 2007, 2008) adopting
‘repetition suppression’ technique has begun to widen our knowledge regarding the
precise role of the different areas characterizing the AOS.
Repetition suppression (RS), also known as ‘fMRI-adaptation’, is based on a trial by
trial reduction of a physiologic response to repeated stimuli. Repetition of a stimulus
often results in a reduction of signal within the brain areas that encode that stimulus.
Suppression occurs when two successive stimuli are represented within the same neural
population, and release from suppression occurs when two successive stimuli are
represented in different populations. Thus, the method assumes the existence of
population coding within brain regions, for which there is extensive evidence in many
parts of the cortex. In summary, RS effects allow to demonstrate regions selective for

30
certain properties of the stimuli or to identify changes within a class of stimuli rather
than between classes of stimuli.
Hamilton & Grafton (2006, 2007, 2008) used this method to identify possible
topologies in the AOS corresponding to different features of a simple hand−object
grasping actions. In Figure 1.15, there is a schematic representation of video-clips used
to test the properties of the AOS in the three studies (see Figure 1.15B, 1.15C, 1.15D)
and of the predicted response and RS effects (see Figure 1.15A, 1.15E).
Figure 1.15. Stimuli and expected RS effects in the three experiments by Hamilton & Grafton (2006, 2007, 2008). In a given sequence, when a stimulus of a specific class, such as an object, is repeated (Row B), there is reduction of fMRI related responses (Row A). Similar effects apply for different types of objects (Row C). The prediction is that different areas will show RS effects for outcomes of actions (Row D) and these can be separated from RS effect (Row E) of lower level features such as trajectory, grip, and means (respectively Rows B, C, D). (Modified from Grafton & Hamilton, 2007).
31
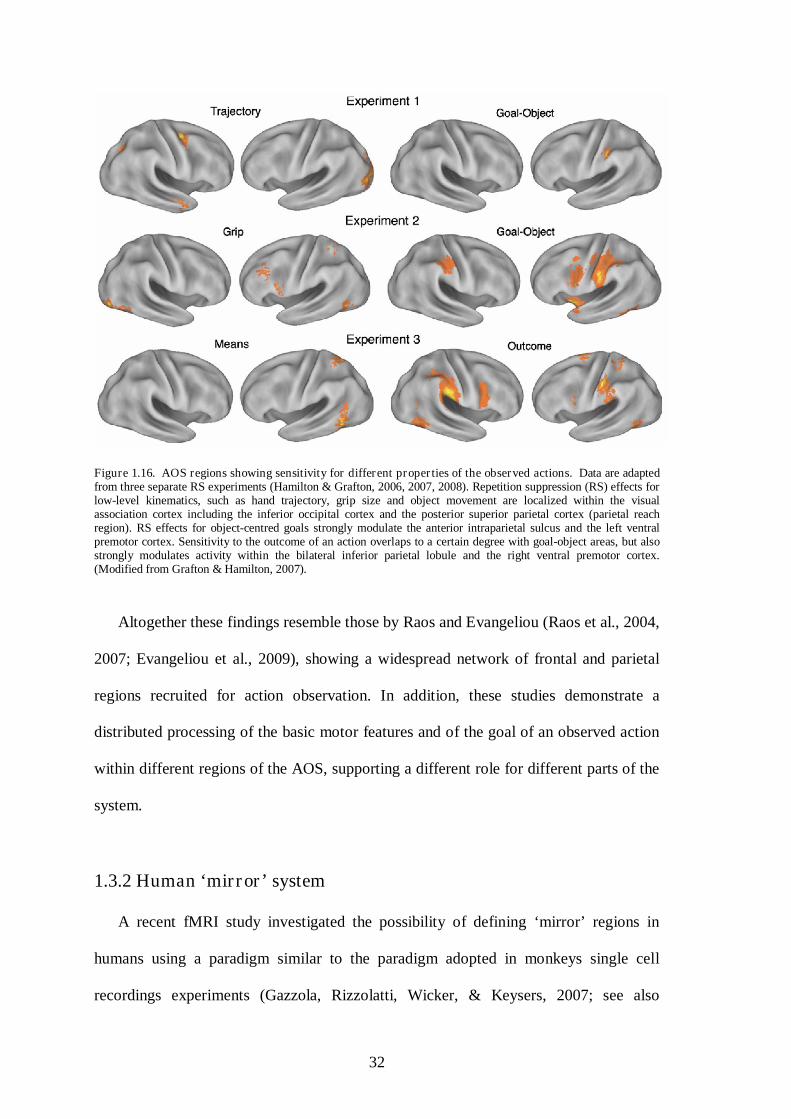
The results of these three studies (Hamilton & Grafton, 2006, 2007, 2008) point to
the direction of a distributed network of areas within the AOS devoted to processing
different features of the observed actions. Specifically, selective processing within the
AOS has been identified for basic perceptual features indicating ‘how’ an observed
action has been performed (e.g., kinematics, type of grip, trajectory) and for its goal
(i.e., ‘what’ has been observed).
In details, it has been demonstrated that in terms of how an observed grasping action
is performed, the coding of its basic kinematic features (e.g., movement trajectories)
might occur within the lateral occipital and the superior precentral sulci (see Figure
1.16, experiment 1). Whereas, the trajectory assumed by the observed hand during
reaching appears to be coded within the inferior and the middle occipital cortices,
together with the middle intraparietal cortex, the supplementary motor area, the middle
frontal gyrus and the inferior frontal gyrus (see Figure 1.16, experiment 2). In terms of
the goal subtending the observed action the suggestion is that the locus of such
processing varies depending on the level of goal complexity. Sensitivity to the goal of a
‘simple’ action (e.g., grasping a cookie) has been identified mainly within the left
intraparietal cortex, but also to a lesser extent within the right intraparietal cortex and
left inferior frontal gyrus (Hamilton & Grafton, 2006, 2007 see Figure 1.16,
Experiments 1 and 2). Sensitivity to the goal of more complex actions, which implies
the modification of the state of an object in order to obtain a change in the environment
(i.e., an outcome), has been associated with activity within the bilateral intraparietal
cortex and the inferior frontal gyrus, particularly within the right hemisphere (Hamilton
& Grafton, 2008, see Figure 1.16, Experiment 3).
32
Figure 1.16. AOS regions showing sensitivity for different properties of the observed actions. Data are adapted from three separate RS experiments (Hamilton & Grafton, 2006, 2007, 2008). Repetition suppression (RS) effects for low-level kinematics, such as hand trajectory, grip size and object movement are localized within the visual association cortex including the inferior occipital cortex and the posterior superior parietal cortex (parietal reach region). RS effects for object-centred goals strongly modulate the anterior intraparietal sulcus and the left ventral premotor cortex. Sensitivity to the outcome of an action overlaps to a certain degree with goal-object areas, but also strongly modulates activity within the bilateral inferior parietal lobule and the right ventral premotor cortex. (Modified from Grafton & Hamilton, 2007).
Altogether these findings resemble those by Raos and Evangeliou (Raos et al., 2004,
2007; Evangeliou et al., 2009), showing a widespread network of frontal and parietal
regions recruited for action observation. In addition, these studies demonstrate a
distributed processing of the basic motor features and of the goal of an observed action
within different regions of the AOS, supporting a different role for different parts of the
system.
1.3.2 Human ‘mirror’ system
A recent fMRI study investigated the possibility of defining ‘mirror’ regions in
humans using a paradigm similar to the paradigm adopted in monkeys single cell
recordings experiments (Gazzola, Rizzolatti, Wicker, & Keysers, 2007; see also
33
Gazzola & Keysers, 2009). Specifically, the authors tested the same subjects in two
tasks: one involving action execution and the other involving observation of the same
action.
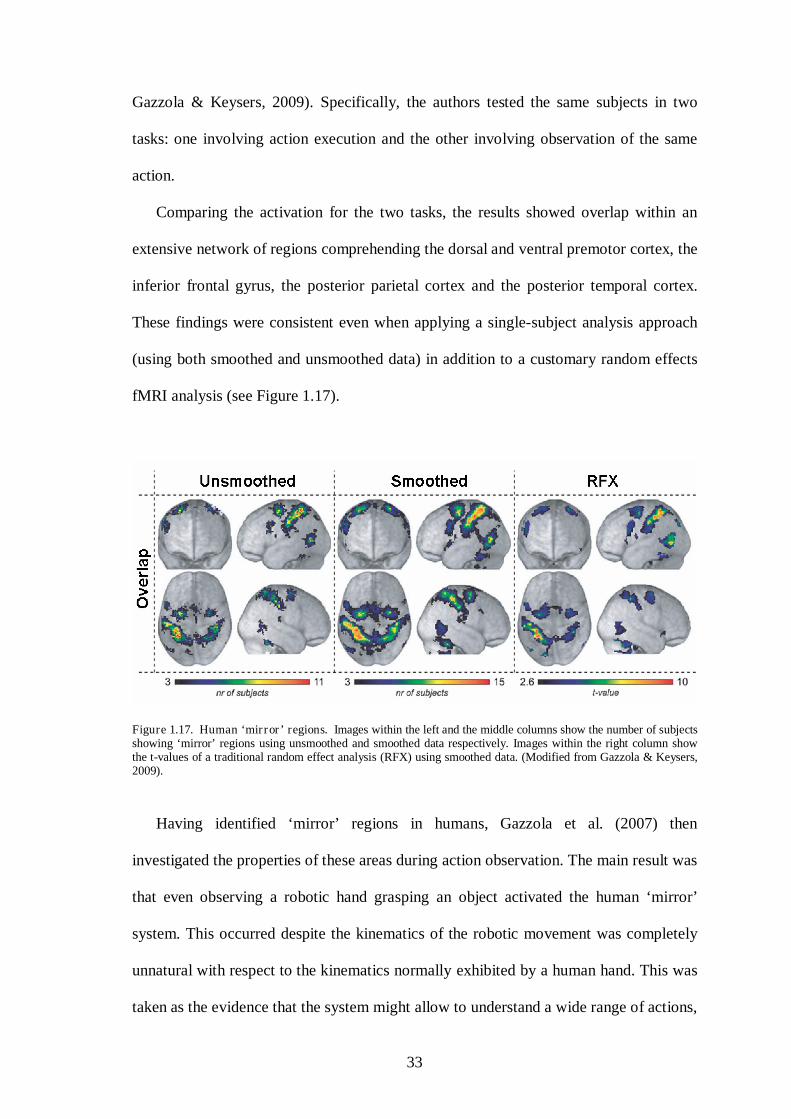
Comparing the activation for the two tasks, the results showed overlap within an
extensive network of regions comprehending the dorsal and ventral premotor cortex, the
inferior frontal gyrus, the posterior parietal cortex and the posterior temporal cortex.
These findings were consistent even when applying a single-subject analysis approach
(using both smoothed and unsmoothed data) in addition to a customary random effects
fMRI analysis (see Figure 1.17).
Figure 1.17. Human ‘mirror’ regions. Images within the left and the middle columns show the number of subjects showing ‘mirror’ regions using unsmoothed and smoothed data respectively. Images within the right column show the t-values of a traditional random effect analysis (RFX) using smoothed data. (Modified from Gazzola & Keysers, 2009).
Having identified ‘mirror’ regions in humans, Gazzola et al. (2007) then
investigated the properties of these areas during action observation. The main result was
that even observing a robotic hand grasping an object activated the human ‘mirror’
system. This occurred despite the kinematics of the robotic movement was completely
unnatural with respect to the kinematics normally exhibited by a human hand. This was
taken as the evidence that the system might allow to understand a wide range of actions,

34
including those performed by non-biological agents. And that at least some regions
within this network may be more sensitive to the goal of an action rather than the means
by which it is achieved. Altogether these findings provide further support the idea that
subsets of the regions characterizing the AOS are recruited for both action execution
and observation (Raos et al., 2004, 2007; Evangeliou et al., 2009).
1.4 Summary
From the above brief literature review it emerges that three cortical regions, STS,
PF/PFG and F5 (Keysers & Perrett, 2004) might be chiefly involved in the processing
of action observation in monkeys, forming the so-called Action Observation System
(AOS). Specifically, STS responds only to the sight of action, whereas PF/PFG and F5
contain mirror neurons, visuomotor neurons which respond to both action execution and
observation.
Recent neuroimaging investigations (Raos et al., 2004, 2007; Nelissen et al., 2005;
Evangeliou et al., 2009) support the idea of an involvement in action observation of
other areas within the parietal (Evangeliou et al., 2009) and the frontal (Raos et al.,
2004, 2007; Nelissen et al., 2005) cortices. These results point to the existence of an
‘extended’ AOS, exceeding the three ‘core’ regions defined using single cell recordings.
In addition, these studies show that ‘mirror’ kind of activity exceeds the regions in
which mirror neurons were discovered using single-cell recordings.
Neuroimaging evidence has shown that an extended AOS, similar to that found in
monkeys, is also present in humans. In details, this ‘extended’ human AOS
comprehends various regions, i.e., the ventral and the dorsal premotor cortices, the
inferior frontal gyrus, the superior temporal sulcus and the posterior parietal cortex.

35
The present research is nested within a novel approach to the investigation of the
AOS in humans which aims to unveil the specific properties of each region within the
system (e.g., Gazzola et al., 2007; Hamilton & Grafton, 2006). In particular, this line of
research tries to assign to different regions specific roles such as the coding of basic
kinematics (‘how’ an action is performed) and action goals (‘what’ has been
performed).
1.5 The present research
The present thesis aims at investigating several unexplored issues regarding the
human AOS with respect to the specific role played by the regions belonging to such
system. The first experimental part (Chapters 3) describes a research on multiple
sclerosis (MS) patients which may provide a suitable experimental model for testing
some properties of the AOS. The second experimental part (Chapter 4) is concerned
with the effect of transitivity, i.e. the presence of an object as target of an action. In
contrast to monkeys, the human AOS responds to both intransitive and transitive
actions. In particular, this study was designed as to understand how object-related and
not-object-related actions are represented and coded within the human AOS. The third
experimental part (Chapter 5) will describe a research testing the possibility of defining
human ‘mirror’ regions. Finally, in the last experimental part (Chapter 6) I shall explore
the properties of the human homologue region of mirror area F5c as to test whether its
activity is modulated by the type of agent performing the action. The results for each
study will be discussed independently (see the ‘Discussion’ section for each
experimental chapter). Further, in a general discussion section the present findings will
be considered globally in light of the most recent theoretical tenets on action
observation (Chapter 7).

36

37
In this chapter the methods and the procedures which are common to all the
experiments included in the present thesis will be described.
2.1 Participants’ characteristics
The participants recruited for all the presented studies were right-handed. They all
had normal or corrected-to-normal vision and had no history of neurological problems.
A further screening was adopted in order to ensure that the participants could enter a
magnetic resonance (MR) scanner. Finally, informed consent was obtained from all
subjects before the testing session in accordance with the declaration of Helsinki.
2.2 Stimuli
Either static pictures or video-clips were adopted as stimuli in the studies reported in
the present thesis (a detailed description will be provided within each experimental
chapter). Video clips were edited using Adobe Premiere (Adobe Systems, San Jose, CA,
www.adobe.com), whereas pictures were edited with Adobe Photoshop (Adobe
Systems, San Jose, CA, www.adobe.com). All stimuli were presented by means of a
laptop PC that ensured synchronization with the MR scanner using either E-prime
(Psychology Software Tools Inc, Pittsburgh USA, www.pstnet.com) or Presentation
(Neurobehavioral Systems, Albany, CA, www.neuro-bs.com). An LCD computer-
controlled projector was employed to present the stimuli on a screen positioned outside
the bore of the magnet of the MR scanner.
2. General methods

38
2.3 Procedures and task
For all experiments, participants lay inside an MR scanner. Data regarding their
brain activity (functional data) were acquired while they performed specific tasks. As a
general instruction, participants were requested to keep their head still during scanning
and to pay attention to the presented stimuli. To minimize head motion, cushions and
pads specifically designed to restrain head translations and rotations within the head coil
were utilized.
2.4 Data acquisition
Functional data were acquired for each subject together with high quality T1-
weighted image (structural data) of the brain. For a detailed description of the MR
sequences adopted in the studies please refer to Appendix A.
2.5 Pre-processing of fMRI data
Here I shall provide a general overview of pre-processing and analysis of functional
data. Functional data were analysed using Statistical Parametric Mapping software
(SPM5, www.fil.ion.ucl.ac.uk/spm/, see Friston et al., 1995), implemented in MatLab
(version 7.3, www.mathworks.com). Pre-processing of functional data started with the
realignment of the collected functional images using a two-step procedure. The images
were registered to the first functional volume of each series and then to the mean image
of the entire sequence in order to correct for any head movement occurring during the
entire investigation. For each subject, a high quality structural image was co-registered
to the mean EPI image and segmented. The co-registered grey matter segment was
normalized onto the grey matter template (provided within SPM) and the resulting
normalization parameters applied to all functional images (resampling the voxels at
39
2x2x2 mm). Finally, data were spatially smoothed using 8 mm FWHM (Full Width at
Half Maximum) Gaussian kernel.
2.6 Measures of interest
Functional magnetic resonance imaging (fMRI) measures the functional activity of
the brain. The most commonly used contrast technique in fMRI is the so-called BOLD
(blood oxygenation level-dependent contrast) technique. In details, BOLD fMRI
technique basically measures changes in the inhomogeneity of the magnetic field, which
are the result of changes occurring in the level of oxygen present in the blood (blood
oxygenation) (Ogawa, Lee, Kay, & Tank, 1990; Ogawa et al., 1992).
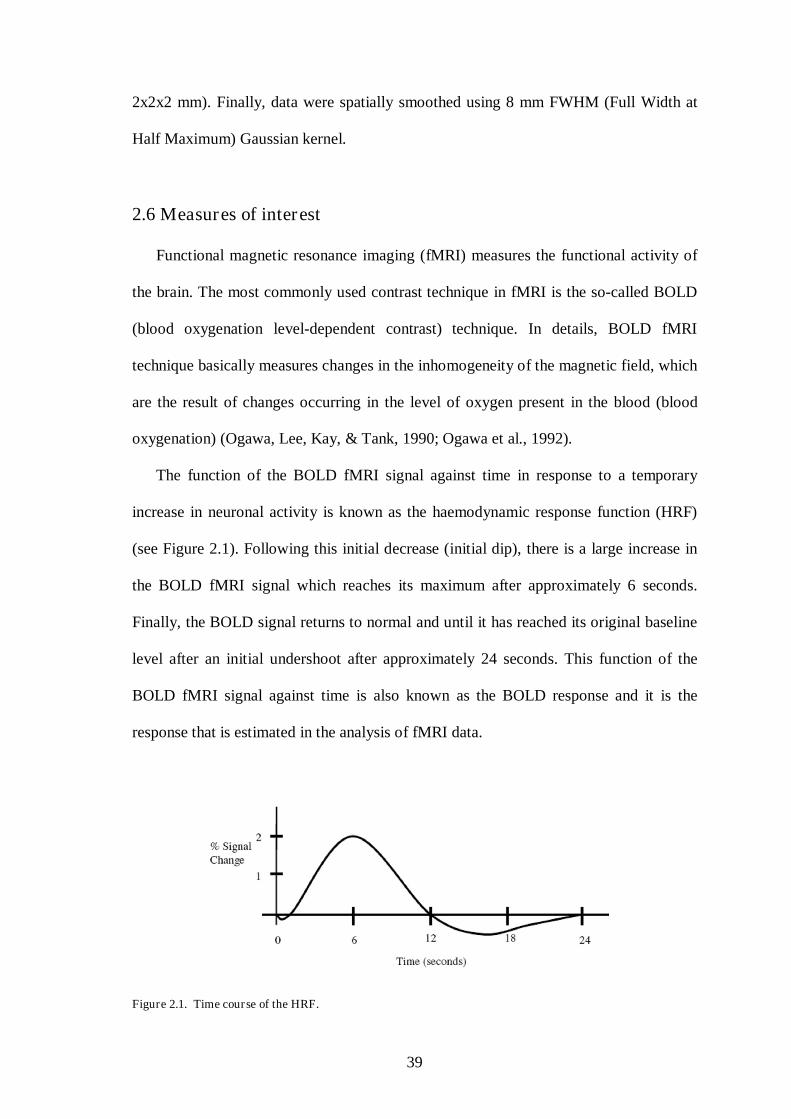
The function of the BOLD fMRI signal against time in response to a temporary
increase in neuronal activity is known as the haemodynamic response function (HRF)
(see Figure 2.1). Following this initial decrease (initial dip), there is a large increase in
the BOLD fMRI signal which reaches its maximum after approximately 6 seconds.
Finally, the BOLD signal returns to normal and until it has reached its original baseline
level after an initial undershoot after approximately 24 seconds. This function of the
BOLD fMRI signal against time is also known as the BOLD response and it is the
response that is estimated in the analysis of fMRI data.
Figure 2.1. Time course of the HRF.

40
2.7 fMRI data analysis
Following pre-processing, functional data were subsequently analyzed by applying a
General Linear Model (GLM) separately for each individual (first level analysis). In
order to produce the model, regressors were defined based on the timing of presentation
for each of the experimental conditions and were modelled using a delta function
(event-related studies) or a box car function (block design) convolved with the HRF.
Additional regressors of no interest were modelled to account for translation and
rotation along the three possible dimensions as measured during the realignment stage
of the pre-processing. Parameters of the model are estimated for each subject. Then in
order to draw inferences on the population, a second level analysis must be adopted.
The implementation in SPM of the second level analysis implies taking the parameters
estimated from the first-level (fixed-effect) analysis and entering them into a second-
level (random-effect) analysis. In the second-level analysis, contrasts between the
different conditions of interest are performed.
2.8 Localization of activated brain regions
Different and complementary methods were used in order to have a clear
localization of the activated brain regions. As a general neuroanatomical reference I
adopted two neuroanatomical atlases (Duvernoi & Bourgouin, 1999; Mai, Assheuer, &
Paxinos, 2004). Further, the SPM Anatomy Toolbox (version 1.6; Eickhoff et al., 2005),
based on three-dimensional probabilistic cytoarchitectonic maps, was used to determine
the probability of the peak activity voxels and of the clusters. For premotor, motor and
somatosensory cortices the position of the cluster and the peak was ascertained with the
data of the meta-analysis by Mayka, Corcos, Leurgans, & Vaillancourt (2006).

41
Abstract
Recent fMRI evidence indicated that both the execution and the observation of hand
actions determine, in multiple sclerosis (MS) patients, an increased recruitment of a
portion of the human ‘mirror’ system. However, it remains unclear whether this is the
expression of a compensatory mechanism for the coding of observed action or whether
such a mechanism represents a rather unspecific functional adaptation process. Here I
used fMRI on early relapsing remitting MS (RRMS) patients to clarify this issue.
Functional images of 15 early RRMS patients and of 15 sex- and age-matched healthy
controls were acquired. using a 1.5T scanner. During scanning, participants simply
observed images depicting a human hand either grasping an object or resting alongside
an object. When compared to controls, RRMS patients revealed a robust increase of
activation in an extensive network of brain regions including frontal, parietal, temporal
and visual areas usually activated during action observation. However, this pattern of
hemodynamic activity was completely independent of the type of observed hand-object
interaction. These findings are in line with previous fMRI evidence demonstrating
cortical reorganization in MS patients during action observation. However, they add to
this literature suggesting that such functional cortical changes may be the expression of
a generalized and unspecific compensatory mechanism which not necessarily is
involved in action understanding.
1Published. Pierno, A.C., Turella, L., Grossi, P., Tubaldi, F., Calabrese, M., Perini, P., Barachino, L., Morra, A., Gallo, P., & Castiello, U. (2009). Investigation of the neural correlates underlying action observation in multiple sclerosis patients. Experimental Neurology 217, 252-7.
3. Investigating the neural circuit underlying the observation of grasping movements: a study on multiple sclerosis patients1

42
3.1 Introduction
Research showing that grey matter demyelination starts early and can be extensive
in MS (Geurts & Barkhof, 2008; Pirko, Lucchinetti, Sriram, & Bakshi, 2007),
stimulated the use of fMRI to investigate this disease. For instance, a wealth of studies
conducted on MS patients indicated that, compared to healthy controls, the execution of
motor tasks causes a markedly increased recruitment not only of motor and sensory
regions, but also of some frontal and parietal areas usually associated with grasping and
manipulating objects (Lee et al., 2000; Filippi et al., 2002; Filippi, Rocca, &
Mezzapesa, 2004; Reddy et al., 2000; Rocca, Falini, Colombo, Scotti, & Filippi, 2002;
Rocca et al., 2005; Pantano et al., 2005). This altered pattern of activation has been
postulated to be an expression of a functional cortical reorganization put in place to
compensate for the impact determined by MS-related injuries and to maintain an
apparently normal level of functioning.
A recent study tested the intriguing hypothesis that the over-activation mechanism
reported in MS patients during action execution tasks may extend to action observation
and action understanding situations (Rocca, Tortorella, & Ceccarelli, 2008). Results
from this study indicated that, compared to healthy controls, the observation of a video
clip representing flexion-extension movements of the last four fingers of a human hand
elicited in MS patients an increased activation of a number of areas known to be
involved during hand action observation (Buccino et al., 2001; Gazzola et al., 2007).
Although the findings from this study are of great interest for the understanding of the
cortical plasticity mechanism operating in MS, an important issue remains unsolved.
Specifically, it is still unclear whether the reported increased cortical activation in action
observation-related brain areas is the result of a specific deficit in understanding the

43
observed actions or it reflects a rather unspecific and generalized response of the human
brain to structural damage of the central nervous system.
The aim of the present study was to address this issue by comparing patterns of
hemodynamic activity measured in early RRMS patients and in normal controls during
the observation of a human hand either interacting with an object or simply resting close
to an object. To do so, I conducted a whole-brain fMRI experiment in which subjects
were scanned while they observed two types of display depicting a human hand either
grasping an object (hand grasping condition), or resting alongside an object (hand
resting condition).
3.2 Materials and Methods
3.2.1 Participants
Fifteen early relapsing remitting MS (RRMS) patients (7 males and 8 females, mean
age = 30.6 years, range = 19-44; see Table B1 in Appendix B) have been recruited for
the present study. Their average disease duration was 16.2 months (range = 3-34
months) and the mean Expanded Disability Status Scale (EDSS) (Kurtzke, 1983) score
was 1.5 (range = 1-3). All patients were relapse-free for at least two months and steroid-
free for at least one month, when the anatomical and functional MRI scans were
performed. The main inclusion criteria were maximum disease duration of 36 months
and the absence of clinical impairment in the visual system and the upper limbs, which
could affect the performance of the requested task. Three patients presented a single
episode of optic neuritis with complete recovery at the onset of disease. At the time of
image acquisition, ten patients were under treatment with immunomodulatory drugs (8
interferon beta, 2 glatiramer acetate) and five patients were therapy free. Fifteen

44
volunteers were recruited as controls (8 males and 7 females, mean age = 34 years,
range = 24-54; see Table B1 in Appendix B).
3.2.2 Stimuli
Different types of black and white digital photographs (bitmap format, resolution
1024x768 pixels), which proved to be effective in eliciting activation within areas of the
AOS (Johnson-Frey et al., 2003), were utilized as stimuli. During acquisition of
functional volumes participants were presented with images depicting: i) a human right
hand grasping an object positioned on a dark surface (‘hand grasping condition’, see
Figure 3.1A) or ii) a human right hand resting alongside an object with the palm
adjacent to the dark surface (‘hand resting condition’, see Figure 3.1B). Note that for the
control condition any sort of hand-object interaction was avoided. For all conditions the
same set comprising eleven objects were utilized (e.g., a glass, a tin box, a candle, a can,
a jar, a tennis ball, etc., see Figure 3.1).
Figure 3.1. Example of the stimuli used in the present study.

45
3.2.3 Procedures
The experimental conditions were presented in a block design in which two
different types of block (corresponding to the experimental conditions) were
implemented. Within each block eleven static images were displayed on the screen for
1100 ms and were separated by 290 ms intervals of blank screen yielding a block
duration of 15 s. Consecutive blocks were separated by a 15 s rest period consisting of a
blank screen with a white fixation cross. The experiment was split into four functional
runs. Within each run eight periods of activation were alternated with nine periods of
rest. The two experimental conditions were presented four times per run resulting in a
total of sixteen repetitions throughout the entire experiment.
3.2.4 Data analysis
Data were analyzed by applying a General Linear Model (GLM) separately for each
individual. All conditions were modelled using a box-car function convolved with the
HRF and contrasts were defined in order to pick out the main effects of each
experimental condition. These contrasts were subsequently entered into a second level
random effects analysis (2x2 ANOVA) in which ‘condition’ (grasping or control) was
manipulated as within-subjects factor, and group (healthy controls and RRMS patients)
served as a between-subjects factor. The main effects and the interactions were then
tested by specifying appropriately weighted linear contrasts. Unless specified, the
voxel-level threshold for these second-level contrasts was set at p < 0.01 (False
Discovery Rate, FDR, corrected for multiple comparisons; see Genovese, Lazar, &
Nichols, 2002) and the extent threshold was of at least 15 contiguous voxels.

46
3.3 Results
First I tested for possible differences between RRMS patients and controls
independently from the type of observed stimuli by exploring the main effect of the
factor ‘group’. Results from this contrast [(RRMS patients/hand grasping + RRMS
patients/hand resting) – (Controls/hand grasping + Controls/hand resting)] indicated
robust differential activation in a widespread network of areas including occipital,
parietal, temporal and frontal regions (see Figure 3.2 and table B1 in Appendix B). In
the occipital lobe, RRMS patients were more activated than controls in two extensive
clusters which also extended to the parietal cortex. Specifically, RRMS patients showed
increased activations in a number of areas including the fusiform gyrus, the inferior, the
middle and the superior occipital gyri, and the calcarine gyrus. All these activations
were bilateral. In the parietal lobe RRMS patients were more activated than controls in
both the inferior and the superior parietal lobule bilaterally including the angular and the
supramarginal gyri. In the temporal lobe RRMS patients showed increased activation in
the inferior and the middle temporal gyri bilaterally and in the left superior temporal
gyrus. Increased activation for RRMS patients was also reported in the insular cortex
and in the hippocampus bilaterally. In the frontal and prefrontal cortex differential
activations were found in the precentral gyrus (premotor cortex), in the paracentral
lobule, and in both the inferior and the superior frontal gyri. Finally, RRMS patients
also showed increased activation in the left amygdala and in the cerebellum. The
reverse contrast [(Controls/hand grasping + Controls/hand resting) - (RRMS
patients/hand grasping + RRMS patients/hand resting)] did not bring to any significant
activations. This signifies that for neurologically healthy controls no areas were more
activated than RRMS patients.

47
Figure 3.2. Regions of increased activation for the main effect of ‘group’.
I next investigated the effects of viewing pictures depicting transitive grasping
actions by exploring the main effect of the factor ‘condition’. Specifically, for both
groups I compared activation elicited by the ‘hand grasping’ condition with that elicited
by the ‘hand resting’ condition [(Controls/hand grasping - Controls/hand resting) +
(RRMS patients/hand grasping - RRMS patients/hand resting)]. As shown Figure 3.3
(see Table B2 in Appendix B), this contrast revealed significant differential activation in
a number of occipital, parietal and frontal areas classically known to be activated during
action observation (AOS; Buccino et al., 2001; Gazzola et al., 2007). With respect to the
‘hand resting’ condition the sight of a human hand grasping an object determined
increased activation within the inferior and the middle occipital gyri, the superior and
the inferior parietal lobule including the intraparietal sulcus and the postcentral gyrus,
and finally within ventral premotor cortex, the precentral and the inferior frontal gyri.
All these activations were bilateral except for the precentral gyrus which was confined
to the left hemisphere. The reverse contrast [(Controls/hand resting - Controls/hand
grasping) + (RRMS patients/hand resting - RRMS patients/hand grasping)] revealed
significant differential activation only in the left calcarine gyrus (primary visual cortex,
see Table B3 in Appendix B). Finally the interaction aimed at localizing the modulating

48
effect of the factor ‘group’ on the factor ‘condition’ was not significant even when
explored at a more liberal threshold (i.e., p < .001 uncorrected).
Figure 3.3. Regions of increased activation for the main effect of ‘condition’.
3.4 Discussion
The aim of the present work was to ascertain whether possible differences in cortical
activation between MS patients and controls during the viewing of other people actions.
The main question was whether such differences could be genuinely interpreted as the
expression of a specific deficit in the ability to understand observed actions or represent
a rather unspecific and generalized adaptive response of the human brain to compensate
for structural damage.
A previous action observation study conducted on MS patients (Rocca et al., 2008)
revealed that observing hand actions elicited in MS patients significantly higher
activation than controls within the inferior frontal gyrus and the superior temporal
sulcus, two neural markers of action observation. These results are important because
they extend to action observation situations the notion that during the execution of
actions MS patients tend to show an increased recruitment of neural resources in terms
of both the level of activity and the number of involved areas (Filippi et al., 2004;

49
Reddy et al., 2000; Rocca et al., 2002; Pantano et al., 2005). If the above mentioned
activation pattern in action observation areas is the expression of a difficulty in
performing such function, this should be carefully considered at both clinical and
rehabilitative levels.
However, before these findings can be fully accepted, there is a fundamental issue
which needs to be clarified. In particular, it is unclear whether the reported effects are
due to a compensatory mechanism specific for the understanding of observed actions or
whether such mechanism represents a less specific functional adaptation process. The
study by Rocca et al. (2008) does not provide a definite answer to this question because
a control condition aside from simple rest was missing in their experimental design.
Indeed, simply comparing neural activation of MS patients following the observation of
an action with the neural activation found in healthy controls performing the same task
(Rocca et al., 2008) does not allow to fully ascertain whether the reported differences
can be ascribed to functional changes which reflect action understanding mechanisms.
In order to draw such conclusion what is needed is a control situation in which patients
observe the hand and an object, but presented in a non interactive fashion. In such
circumstances no differences amongst groups (MS patients and controls) should
emerge.
The results of the present study have the potential to provide some answers to this
question. If, as it is tempting to assume, we are in the presence of a compensatory
mechanism specifically tailored as to contribute to the maintenance of a suitable level of
action understanding, then such over-activation mechanism should have been found
only for my ‘hand grasping’ but not for my ‘hand resting’ condition. This is because the
adopted ‘hand resting’ condition does not entail any hand-object interaction. The
present results clearly indicate that this is not the case. Although the experimental

50
design was able to reveal robust main effects of both the factors ‘group’ and ‘condition’,
any significant ‘group’ by ‘condition’ interaction was found. Specifically, results from
the main effect of the factor ‘group’ (RRMS patients vs controls) revealed a widespread
network of areas in which activation was indeed greater for early RRMS patients than
for healthy controls. Furthermore, results from the main effect of the factor ‘condition’
(grasping hand > resting hand) indicated that in early RRMS patients, as well as in
healthy controls, observing a human hand grasping an object as compared to the same
hand resting nearby the object triggered differential significant activation in areas
known to play a pivotal role in action understanding such as the inferior frontal gyrus,
the precentral gyrus, and both the inferior and the superior sectors of the parietal cortex
including the intraparietal sulcus. The most important result, however, is the lack of any
interaction between the two manipulated factors (‘group’ and ‘condition’). This
indicates that the difference in terms of hemodynamic activation between observing a
hand grasping an object and a hand resting in proximity of an object is similar for early
RRMS patients and healthy controls. In other words, action understanding mechanisms
seem to operate in a comparable fashion across the two tested groups. This is suggestive
that the robust increased activation showed by early RRMS patients regardless of the
type of the observed hand-object interaction does not represent a compensatory
mechanism put in place as to overcome a specific deficit in action understanding.
Conversely, it is more likely to be the expression of rather unspecific adaptive
functional cortical changes which may contribute to maintain a normal level of function
despite the presence of brain tissue damages.
The possible neurophysiological causes for such over-activation might be mainly
related to two interrelated factors. The first factor relies on the evidence that MS causes
demyelination of axons and which consequently determines a deficit in neuronal

51
transmission (e.g., Franklin, & ffrench-Constant, 2008). The second factor is concerned
with the continuous repairing mechanism process triggered by the pathology (e.g.,
Franklin, & ffrench-Constant, 2008). Both a deficit in neural transmission and repairing
require higher metabolism with respect to a normal brain and therefore may account for
the abnormal level of functioning reported for these patients.
Altogether these findings demonstrate the presence in RRMS patients of a robust
increased recruitment of neural resources within an extensive and widespread network
of brain regions including visual, parietal, temporal and frontal regions. Although some
of the over-activated areas do play a role during the observation of other people actions,
the present results clearly indicate that such increase in neural activity is not specifically
related to action observation.

52

53
Abstract
In the present study I investigated the influence that transitivity - i.e. the presence of
an object as the target for an action - might have on the AOS. Participants were
requested to observe grasping actions ending behind a partition knowing in advance
whether a target-object would be present or absent. Importantly, independently from the
presence of the target-object, the observed actions were exactly the same in terms of
movement kinematics and contextual information. The ‘action’ conditions were
compared with ‘control’ conditions in which a stationary hand was presented either
alone or together with the target-object hidden behind the partition. I found that the
presence/absence of the target-object modulated activity within the right posterior
superior temporal sulcus and the anterior intraparietal sulcus bilaterally for the ‘action’
but not for the ‘control’ conditions. These findings provide strong evidence that
information regarding the transitivity of an action is sufficient to influence the level of
activity within the neural system subtending action observation. Further, they add to the
notion that in humans this system can rely solely on previous knowledge regarding the
action goal (i.e., presence or absence of a target-object) as to discriminate between
transitive and intransitive actions.
2Submitted. Turella, L., Tubaldi, F., Erb, M., Grodd, W. & Castiello, U. Transitivity modulates activity
within the action observation system.
4. Exploring the neural circuit underlying the observation of grasping movements: the effect of action transitivity2

54
4.1 Introduction
Here, I exploit the sensitivity of the human AOS by testing for the first time whether
this system is modulated by action transitivity. In other words, I am testing whether
action goals implying a physical interaction between an effector and an object can be
distinguished from goals which do not imply such interaction. Some evidence that this
might be the case comes from a study on monkeys suggesting that the AOS could be
profoundly influenced by the transitivity of an observed action (Umiltà et al., 2001).
Specifically, this study revealed that some F5c neurons responded even when the final
part of an observed grasping action was hidden behind a partition. The prerequisite for
this to happen was that the monkey knew about the presence of an object behind the
partition (Umiltà et al., 2001). The same neurons did not discharge when the monkey
observed a pantomime of the same action. That is, when the animal knew that there was
no object behind the partition. These findings, therefore, seem to suggest that previous
knowledge regarding the presence of a target-object might suffice as to distinguish
between transitive and intransitive actions.
I capitalize on the paradigm used by Umiltà et al. (2001) to ascertain a modulation
within the AOS depending on the transitivity of the observed action. Participants were
requested to observe a model performing a grasping action towards an object which was
hidden behind a partition, or the very same action in the very same contextual
conditions, but in the absence of the target-object (i.e., pantomimed grasp). Information
about the presence or absence of the target-object was conveyed by a prime presented
before the stimulus representing either a real or a pantomimed grasp. This procedure
might permit a specific investigation of whether the presence/absence of a target-object,
intended as the goal of the action, modulates activity within the AOS during the
observation of partially hidden actions. In turn, this will allow inferences to be drawn on

55
how the abstract representation of a goal is coded within the AOS by eliminating the
subtle confounds related to ‘how’ an action is performed. If the same visual stimulus
has the ability to modulate activity within the AOS on the basis of previous knowledge
regarding the presence of an unseen target-object (i.e. transitivity), then it could be
argued that the system is able to discriminate between transitive and intransitive actions.
4.2 Methods
4.2.1 Participants
Nineteen right-handed paid volunteers (9 male, mean age 27.2 years, range 20-37)
were recruited for the present study.
4.2.2 Stimuli
Video-clips (AVI format, Xvid codec compression, resolution 320x240, 25 frames
per second) were used as stimuli for the present study, namely the ‘AOS localizer’ and
the ‘main experiment’. The stimuli used for the ‘AOS localizer’ represented: i) the hand
of a model grasping an object resting on a table (see Figure 4.1A); and ii) the hand of a
model resting nearby an object (see Figure 4.1B). For the implementation of these
video-clips two different individuals served as models and four objects were used as
target stimuli for the models’ action (i.e., a sphere of 3.5 cm diameter; a sphere of 9 cm
diameter; two parallelepipeds measuring 9x6x6 and 6x2.5x2.5 cm, respectively).
Furthermore, object position was counterbalanced with respect to the participants’ point
of view. For half of the video-clips the object was located to the left, whereas for the
other half the object was located to the right side of the screen upon which the stimuli
were presented. The combination of the considered factors (2 models x 4 objects x 2
positions) resulted in a total of sixteen videos.

56
The ‘main experiment’ considered three specific events: i) prime (duration: 1
second); ii) experimental condition (duration: 3 seconds); and iii) question (duration: 2
seconds). For the ‘prime’ event, the stimuli represented an object resting on a table,
which was fully visible at the beginning of the video and then gradually covered by
means of a grey partition (see Figure 4.1C); and the same visual scene in the absence of
the object (see Figure 4.1D). For this event the stimuli were constructed starting from
static frames depicting an object resting on a table or the same scene without the object.
The moving grey partition was added using a video-editing technique. This partition
entered the scene at the beginning of the video-clip and its motion ended when the
object was fully hidden. When the object was absent the partition ended at the same
position as when the object was present. A total of ten videos were adopted (eight
video-clips with the object and two video-clips without the object). For the
‘experimental condition’ event the stimuli represented the hand of a model grasping an
object hidden behind the partition (see Figure 4.1E); and the hand of a model
maintained static nearby the partition (see Figure 4.1F). For this event the stimuli were
at all cases edited versions of the video-clips used for the ‘AOS localizer’. Here a static
grey partition was present for the entire duration of the video-clip. The stimulus for the
‘question’ event corresponded to a string of text appearing on the screen.

57
Figure 4.1. Types of stimuli. For the AOS localiser, two types of video-clips were adopted (‘grasping’ and ‘control’). The represented frames (Figure 4.1A, B) were extracted from the central part of the video-clips. For the main experiment, four types of videos were adopted: two for the prime event (‘object’ and ‘no object’) and two for the experimental condition event (‘action’ and ‘static’). The represented frames for both prime conditions (Figure 4.1C, D) and for the experimental conditions (Figure 4.1E, F) are extracted from the central part of the video-clips.
4.2.3 Procedures and task
4.2.3.1 AOS localiser
The ‘AOS localizer’ was performed as to identify a ‘pure’ action observation pattern
of activity (for a similar procedure, see Buccino et al., 2001; Gazzola et al., 2007;
Gazzola & Keysers, 2009). It consisted of a single run during which participants were
requested to carefully observe the stimuli described above. This part of the experiment
was always administered after the ‘main experiment’. There were two experimental
conditions: i) an ‘object-related grasping’ condition in which participants observed a
model performing a grasping action and ii) a ‘static’ control condition, in which
participants observed the hand of a model resting on a table nearby an object. The two
experimental conditions were presented in an alternated block design. Within each
block four video-clips were displayed for 3 s and were separated by 0.5 s intervals of
blank screen (total block duration: 13.5 s). Consecutive blocks were separated by a 12.5

58
s rest period during which a grey screen with a black fixation cross was presented. Each
condition was repeated sixteen times.
4.2.3.2 Main experiment
The procedures for the ‘main experiment’ largely relied on those previously used in
a neurophysiological study by Umiltà and colleagues (2001). Naturally they were
modified in order to fit the needs of an fMRI study. The sequence of events was as
follows (for the specific trial timeline please refer to Figure 4.2). The first event was a
‘prime’. There were two types of prime: an ‘object’ prime, in which the stimulus
represented an object resting on a table (Figure 4.2; red labelling) and a ‘no object’
prime, in which the object was absent (Figure 4.2; blue labelling). Following this, a grey
partition entered the scene and covered either the part of the scene in which the object
was present (‘object’ prime in Figure 4.2) or the corresponding empty area (‘no object’
prime; Figure 4.2). The second event ‘experimental condition’ varied depending on the
type of prime. When the prime signalled the presence of an object located behind the
partition (Figure 4.2; left upper panel) the stimuli for this event could be either (i) the
hand of a model grasping the object (‘grasping’ option within the left bottom panel in
Figure 4.2) or (ii) the model’s hand maintained static (‘object’ option within the right
bottom panel in Figure 4.2). When the prime signalled the absence of an object behind
the partition (Figure 4.2; right upper panel) the stimuli for the ‘experimental condition’
event were either (i) the hand of a model performing a pantomimed grasp (‘pantomime’
option within the left bottom panel in Figure 4.2) or (ii) the model’s hand maintained
static (‘no object’ option within the right bottom panel in Figure 4.2). For the third event
termed ‘question’ (see Figure 4.2) a text line appeared on the screen for two seconds
and participants were requested to indicate whether during the two previous events the

59
object was absent or present. They pressed the left key of an MRI-compatible response
box with the index finger of the right hand if the object was present or the right key with
the middle finger if the object was absent. Trials were considered as successful only
when the response was congruent with the prime. When the response was incorrect the
trial was considered as an error and subsequently discarded. The mean percentage of
errors across participants was about 3.3% (6.3 trials over a total of 192). In order to
ensure that participants fully understood the task they attended a practice session
outside the scanner.
The considered experimental conditions were embedded in a 2x2 factorial design,
with two within-subjects factors: ‘observed task’ (action vs control) and ‘object’
(presence vs absence). The combination of the two factors brought to four conditions of
interest:
i) ‘grasping’ condition, in which participants observed the model grasping an object
hidden behind the partition. Participants knew from the type of prime that an object was
present.
ii) ‘pantomime’ condition, in which participants observed the model performing a
grasping action knowing from the type of prime that there was no object behind the
partition.
iii) ‘object’ condition, in which participants observed a static hand and the partition
knowing from the type of prime that behind the partition there was an object.
iv) ‘no object’ condition, in which participants observed a static hand and a partition
knowing from the type of prime that there was no object behind the partition.
As reported above within the ‘stimuli’ section, only two sets of videos were used as
stimuli for the experimental conditions: one set was used for the ‘action’ conditions
(i.e., grasping and pantomime) and one set for the ‘control’ conditions (i.e., ‘object’ and
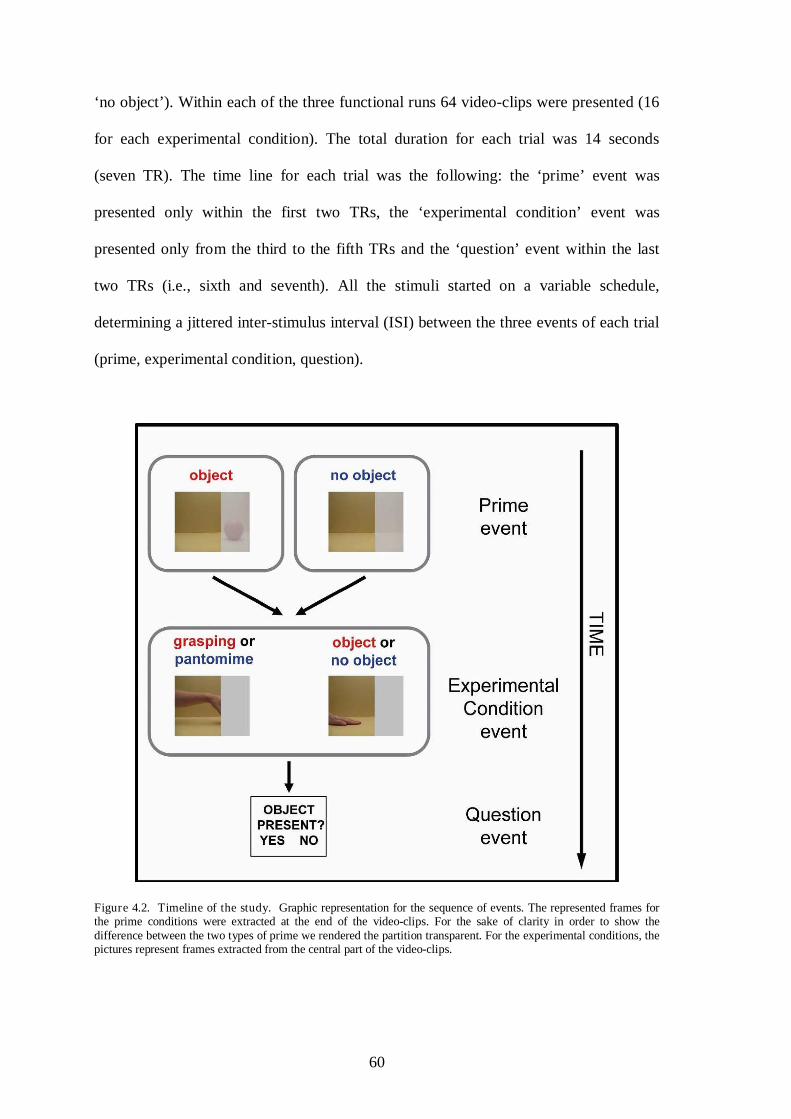
60
‘no object’). Within each of the three functional runs 64 video-clips were presented (16
for each experimental condition). The total duration for each trial was 14 seconds
(seven TR). The time line for each trial was the following: the ‘prime’ event was
presented only within the first two TRs, the ‘experimental condition’ event was
presented only from the third to the fifth TRs and the ‘question’ event within the last
two TRs (i.e., sixth and seventh). All the stimuli started on a variable schedule,
determining a jittered inter-stimulus interval (ISI) between the three events of each trial
(prime, experimental condition, question).
Figure 4.2. Timeline of the study. Graphic representation for the sequence of events. The represented frames for the prime conditions were extracted at the end of the video-clips. For the sake of clarity in order to show the difference between the two types of prime we rendered the partition transparent. For the experimental conditions, the pictures represent frames extracted from the central part of the video-clips.

61
4.2.4 Data Analysis
4.2.4.1 AOS Localiser
The analysis of the localiser data allows the definition of regions within the AOS.
The images referring to the contrast between ‘action observation’ and ‘static control’
were extracted for each subject at first level and then tested in a second level random
effect analysis using a one-sample t-test. The adopted statistical threshold was set at p<
0.05 FDR corrected (Genovese et al., 2002) and 25 contiguous voxels.
4.2.4.2 Main experiment
As my specific interest was to test the modulation within the AOS, a Region of
Interest (ROI) analysis was performed only on the regions found activated within the
localiser. This ROI analysis was performed on the mean percent signal change extracted
from these regions using Marsbars SPM Toolbox (Brett, Anton, Valabregue, & Poline,
2002). I tested the main effects and interaction of the 2x2 factorial design (two within-
subjects factors: ‘observed task’ and ‘object’) for each region. Within the regions,
where the interaction was significant, paired t-tests were performed to test the following
contrasts: ‘grasping’ vs ‘pantomime’ conditions and ‘object’ vs ‘no object’ conditions.
4.3 Results
4.3.1 AOS localiser
When contrasting the two conditions characterizing the AOS localiser (‘object-
related grasping action’ > ‘static control’, see Figure 4.3) activation was found within
the classically defined areas of the AOS. In details, activation was evident bilaterally
within the premotor, parietal, temporal cortices and the occipital cortices (see Figure 4.3

62
and Table C1 in Appendix C). This is in line with previous literature demonstrating an
automatic involvement of these areas during a ‘pure’ action observation task (Buccino
et al., 2001; Gazzola et al., 2007; Gazzola & Keysers, 2009).
Figure 4.3. Activation maps for the AOS localizer.
4.3.2 Main experiment
ROI analysis was performed on those regions which were activated at the level of
the AOS localiser. In all the tested regions the main effect of action observation was
significant. I shall discuss only those regions in which the interaction was significant,
i.e. the intraparietal sulcus (aIPS) bilaterally and the right posterior STS.
In order to understand the selective modulation within these areas due to the
presence/absence of an object I performed paired t-tests contrasting the ‘grasping’ vs
the ‘pantomime’ conditions and the ‘object’ vs the ‘no object’ conditions. The results
indicated that activity within the bilateral aIPS and the right pSTS was higher when
participants were exposed to the ‘grasping’ rather than to the ‘pantomime’ condition
(see Figure 4.4 and Table C2 in Appendix C).
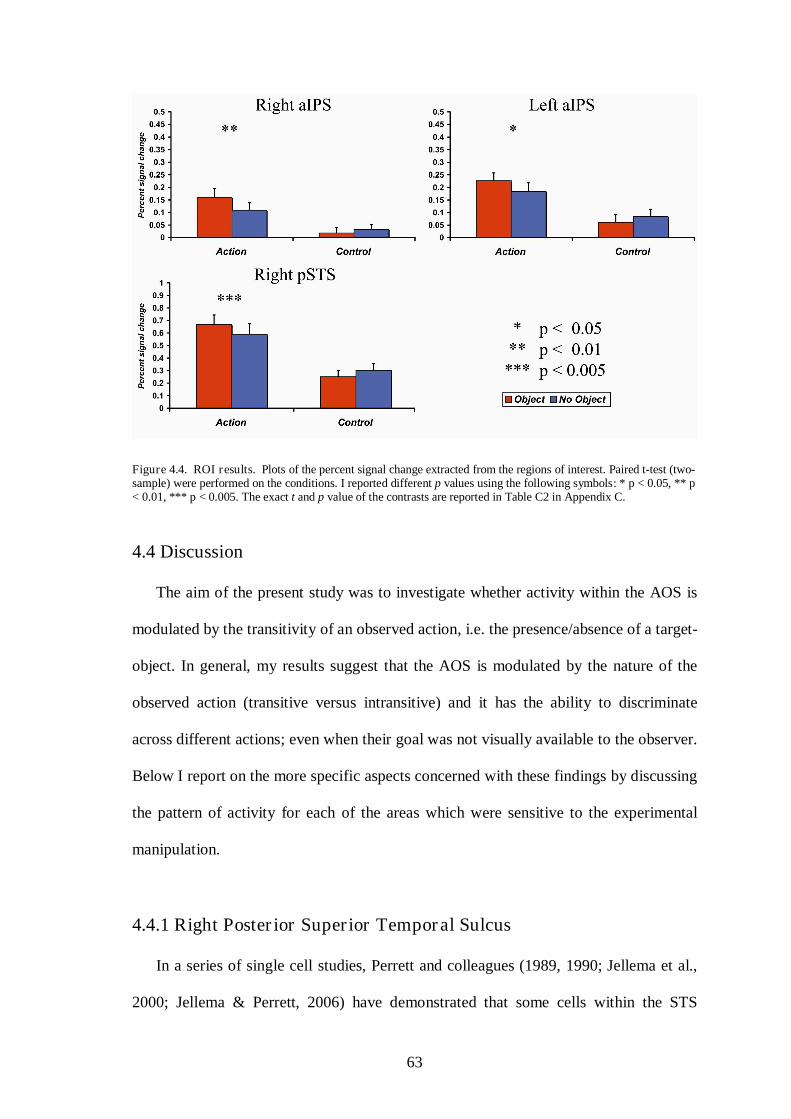
63
Figure 4.4. ROI results. Plots of the percent signal change extracted from the regions of interest. Paired t-test (two-sample) were performed on the conditions. I reported different p values using the following symbols: * p < 0.05, ** p < 0.01, *** p < 0.005. The exact t and p value of the contrasts are reported in Table C2 in Appendix C.
4.4 Discussion
The aim of the present study was to investigate whether activity within the AOS is
modulated by the transitivity of an observed action, i.e. the presence/absence of a target-
object. In general, my results suggest that the AOS is modulated by the nature of the
observed action (transitive versus intransitive) and it has the ability to discriminate
across different actions; even when their goal was not visually available to the observer.
Below I report on the more specific aspects concerned with these findings by discussing
the pattern of activity for each of the areas which were sensitive to the experimental
manipulation.
4.4.1 Right Posterior Superior Temporal Sulcus
In a series of single cell studies, Perrett and colleagues (1989, 1990; Jellema et al.,
2000; Jellema & Perrett, 2006) have demonstrated that some cells within the STS
64
respond to the sight of goal-related actions, such as a hand manipulating an object. The
response was not present (or extremely reduced) during the observation of a pantomime
or of a pantomimed grasp occurring in proximity of the object (Perrett et al., 1989,
1990). A recent study further investigated such modulation revealing that object-related
actions elicited the highest response, whereas pantomimes triggered a much weaker
response (Barraclough et al., 2009). However for both action conditions the level of
activity differed from a baseline condition in which the object was presented alone. The
present findings show a similar modulation within the pSTS indicating the highest
response for transitive actions, a reduced response for intransitive actions and an even
lower response for the control conditions.
Another aspect of the present results concerns the influence that knowledge
regarding the presence/absence of a previously seen object (i.e. the prime) has on pSTS
activity during action observation. Recent evidence in humans indicated that some form
of knowledge such as ‘perceptual history’ (Jellema & Perrett, 2003) - events that have
been recently witnessed - might modulate activity within the pSTS (Wyk, Hudac,
Carter, Sobel, & Pelphrey, 2009). Here participants observed a model expressing a
positive or a negative emotion towards one out of two objects, following which the
model would then grasp one of the two objects. The relationship between the grasped
object and the emotion expressed towards it, modulated activity within the pSTS. The
present study extends this literature showing that, in humans, past contextual
information regarding the transitivity of an action (presence or absence of a target-
object) might modulate activity within the pSTS.
Altogether the present findings provide some evidence of a possible link between
activity related to ‘perceptual history’ (Jellema & Perrett, 2003) and activity for goal-
related movements (Perrett et al., 1989, 1990; Barraclough et al., 2009). In this view the

65
pSTS might act as a central node for the processing of goal-related actions by
integrating the representation of a partially visible movement with the information
coming from previously experienced events.
4.4.2 Anterior Intraparietal Sulcus
Recent evidence indicates that the aIPS is sensitive to the presence of an object
which is the target of an action (‘goal-object’) (Hamilton & Grafton, 2006; Shmuelof &
Zohary, 2005, 2006). Along these lines here it is shown that the most effective response
in aIPS was evident when the model performed a real grasp, even when the object was
not visible. Further, the present results go a step forward demonstrating that it is the
knowledge regarding the transitivity of a partially hidden action which modulates
activity within this area.
Another aspect of the aIPS results is that the pattern of activation suggests a
differential processing for transitive and intransitive actions. Although the observation
of transitive actions determined a level of activity which was higher than that observed
for intransitive actions, the observation of intransitive actions still activated the aIPS.
This result is in line with recent findings suggesting that in humans the aIPS might be
activated by the view of intransitive movements (Wheaton, Thompson, Syngeniotis,
Abbott, & Puce, 2004; Dinstein, Hasson, Rubin, & Heeger, 2007; Dinstein, Gardner,
Jazayeri, & Heeger, 2008; Lui, et al., 2008). Therefore it appears that in humans the
aIPS is sensitive, though to a lesser extent, to actions in which no physical goal (i.e., the
object) is present. Support to this contention comes from a recent study by Lui et al.
(2008), showing that observation of mimed actions (i.e., pantomime of object-related
actions) elicits an activation similar to the pattern of activation found in previous studies
considering object-related actions (i.e. Buccino et al., 2001). However, these authors did

66
not consider a condition involving the observation of object-related actions, and
therefore the ‘transitivity’ issue remained unsolved. The present study, in which
transitive and intransitive actions are directly tested, provides compelling evidence that
within the aIPS both types of actions are coded. In addition, it demonstrates that the
aIPS might discriminate between different types of action on the basis of previous
knowledge regarding the presence of a target-object.

67
Abstract
In this study, I tested the possibility that regions of the human brain show
overlapping activity for both observation and execution of action (‘mirror’ activation),
adopting a highly conservative procedure and a paradigm which was similar to the
paradigm used in monkey single cell recording studies. The same participants were
requested to observe a grasping action (observation condition) and to perform a
grasping action (execution condition). Results from whole-brain analyses indicate that
overlapping activity for action observation and execution was evident in a broad
network of areas including parietal, premotor and temporal cortices. A finding which is
in line with the most recent proposals on the composition of the ‘mirror’ system.
3Published. Turella, L., Erb, M., Grodd, W. & Castiello, U. (2009). Visual features of an observed agent do not modulate human brain activity during action observation. NeuroImage, 46, 844-53.
5. The ‘mirror’ system in humans3
68
5.1 Introduction
Following the discovery of mirror neurons, many fMRI studies have been
performed in order to uncover a similar system in humans. Amongst these studies the
most convincing evidence of a ‘mirror-like’ system in humans comes from a study by
Gazzola et al. (2007; Gazzola & Keysers, 2009) who tested both action execution and
observation within the same individuals. In one day they asked participants to observe
either a human model or an industrial robot performing a variety of actions and in a
separate day to perform the actions. They found regions of overlap for action
observation and execution in classic ‘mirror’ areas together with many areas which
were not previously considered as mirror (Gazzola et al., 2007, Gazzola & Keysers,
2009). In the present study, I wanted to identify the mirror system in humans without
the confound of the robotic hand which might have introduced ‘noise’ in the results.
Therefore I used a strict experimental paradigm, as similar as possible to that originally
adopted in neurophysiological studies.
5.2 Materials and Methods
5.2.1 Participants
Seventeen paid participants (10 female, mean age 27.8 years, range 21-39) were
recruited for the present study. One subject was discarded due to head motion exceeding
3 mm (voxel size).
5.2.2 Apparatus
In order to investigate both execution and observation within the MR scanner I
adopted a custom-built MRI-compatible apparatus consisting of two main parts (Figure
5.1). A lower part embedding a screen which served to present the video clips and an

69
upper part consisting of a pneumatic piston containing a stick with a spherical stimulus
attached to it. The stimulus could be lowered down within the scanner at a reachable
distance using compressed air. The use of a pneumatic/mechanical apparatus allowed
for a precise control of the timing of the sequence of events and to avoid the interaction
of the subject with the experimenter. The apparatus was positioned over the subject’s
legs and the subject’s head was tilted in the coil (30 degrees) allowing both the screen
and the stimulus (when lowered down) to be visually available by the subjects.
Figure 5.1. Apparatus.
5.2.3 Stimuli
5.2.3.1 Action observation
Two different types of video clips served as stimuli (4 s duration, AVI format, Xvid
codec compression, resolution 360x240, 25 frames per second). As shown in Figure 5.2
these video clips could represent: i) a human model grasping an object (‘model
grasping’, Figure 5.1A); ii) a static human model with the hand resting on the table in
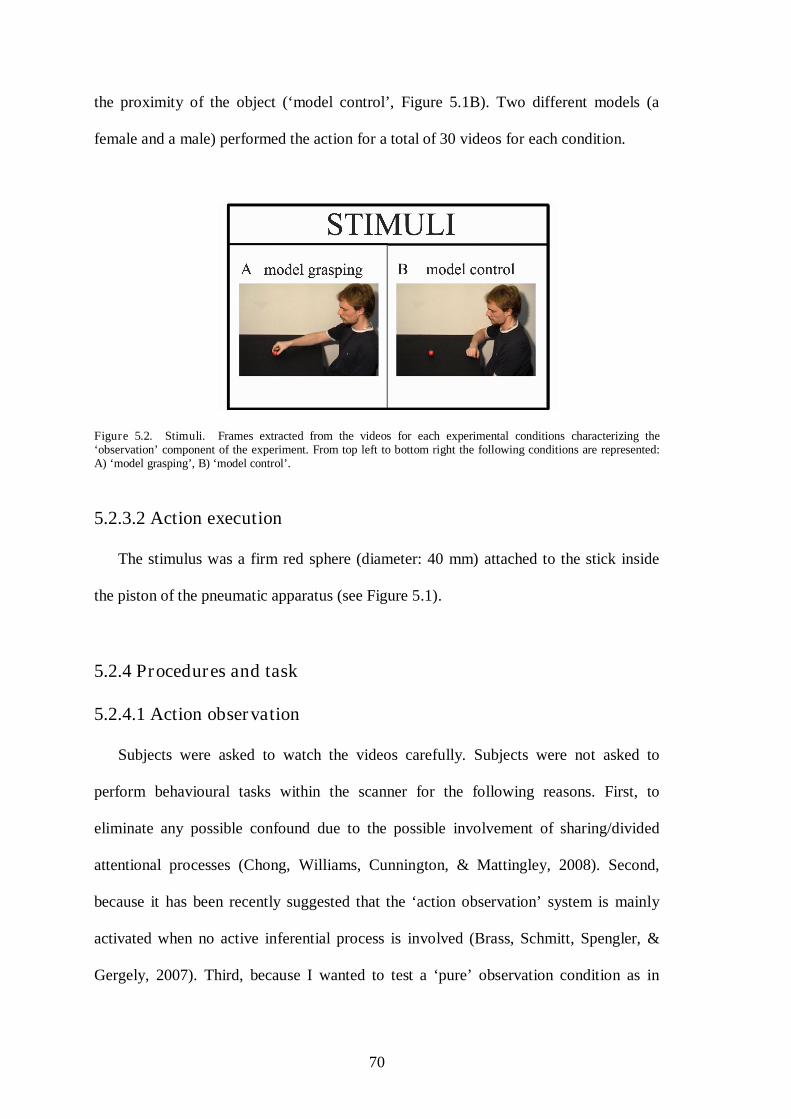
70
the proximity of the object (‘model control’, Figure 5.1B). Two different models (a
female and a male) performed the action for a total of 30 videos for each condition.
Figure 5.2. Stimuli. Frames extracted from the videos for each experimental conditions characterizing the ‘observation’ component of the experiment. From top left to bottom right the following conditions are represented: A) ‘model grasping’, B) ‘model control’.
5.2.3.2 Action execution
The stimulus was a firm red sphere (diameter: 40 mm) attached to the stick inside
the piston of the pneumatic apparatus (see Figure 5.1).
5.2.4 Procedures and task
5.2.4.1 Action observation
Subjects were asked to watch the videos carefully. Subjects were not asked to
perform behavioural tasks within the scanner for the following reasons. First, to
eliminate any possible confound due to the possible involvement of sharing/divided
attentional processes (Chong, Williams, Cunnington, & Mattingley, 2008). Second,
because it has been recently suggested that the ‘action observation’ system is mainly
activated when no active inferential process is involved (Brass, Schmitt, Spengler, &
Gergely, 2007). Third, because I wanted to test a ‘pure’ observation condition as in

71
monkeys’ studies (Rizzolatti et al., 2001). In between stimuli presentation subjects were
requested to fixate a cross presented in the middle of the screen.
5.2.4.2 Action execution
Subjects were requested to fixate a black cross presented on the grey background of
the screen embedded within the apparatus. Then they were requested to reach towards
and grasp the stimulus with a precision grip (see Culham et al., 2003, for a similar
procedure) or to fixate the stimulus. Specifically the sequence of events was the
following: i) subjects were requested to fixate the central cross (as for the observation
part); ii) the central cross disappeared; iii) the stimulus was lowered down in the
scanner and subjects were requested to fixate it. The time taken by the stimulus as to
reach the pre-determined location was 1.5 s; iv) subjects were requested to fixate the
stimulus for 1.5 s until the beginning of the experimental conditions. The latter 3
seconds of the event sequence were defined as ‘preparation time’. Following
‘preparation time’, the subjects had 3 seconds either to perform the reach-to-grasp
movement (if they hear a sound) or just to continue to fixate the ball (in case no sound
was presented), afterwards the ball was removed from the subject’s view. The task was
performed by all subjects with the dominant (right) hand. Half subjects performed the
execution task before the observation task, the other half performed the observation task
before the execution task.
5.2.5 Data Analysis
Two whole-brain analyses, one for the observation and one for the execution part of
the experiment were carried out by applying the General Linear Model (GLM). The
72
alpha level for these second-level analyses was set at p < 0.0001 uncorrected at voxel-
level and at p< 0.05 corrected at cluster level.
5.2.5.1 Action observation
The contrast of the two conditions (‘model grasping’ > ‘model control’) was
extracted for each subject at first level and then entered in a second level analysis.
5.2.5.2 Action execution
The contrast of interest, reach-to-grasp against object fixation, was extracted for
each subject at first level and then tested in a second level analysis. In order to
distinguish effects only related to the different tasks, ‘preparation time’ was modelled as
a regressor of no interest. Specifically it was defined as the time from the moment the
stimulus started to be lowered down up to the time the different tasks begun. The tasks,
‘reach-to-grasp’ and ‘object fixation’, were modelled as regressors starting from the end
of the preparation time regressor up to the time the stimulus started to re-enter within
the piston. Both the task and the preparation time duration was 3 seconds. Errors were
separately modelled as an ‘error’ regressor of no interest within the first level design
matrix.
5.2.5.3 Conjunction analysis
To define regions in which activation was elicited by both grasping observation and
execution a conjunction analysis between regions activated during action observation
and execution was performed. In order to find common voxels we created a binary
image overlapping the SPM{t} maps for the two contrasts of interest reported above.
The statistical threshold of the two maps was the same reported for the single contrasts,

73
i.e. p < 0.0001 uncorrected at voxel-level and at p< 0.05 corrected at cluster level. Thus,
we logically inferred that both action observation and execution would trigger activity
within cerebral areas in which both contrasts of interest reached statistical significance
(Nichols, Brett, Andersson, Wager, & Poline, 2005; Friston, Penny, & Glaser, 2005).
5.3 Results
5.3.1 Action observation
The contrast testing ‘model grasping’ vs ‘model control’ showed differential
activation within AOS comprehending premotor, temporal and parietal cortices
(Buccino et al., 2001; Gazzola et al., 2007; Gazzola and Keysers, 2009, see table D1 in
Appendix D). Activation map related to action observation is overlaid on the mean
image of the group (see Figure 5.3). Consistent with previous findings, significant
differential activation was evident bilaterally within both the dorsal and the ventral
sectors of the premotor cortex. Further, two bilateral clusters were activated within the
caudal cingulate motor area. For the parietal cortex bilateral activation was evident
within the superior and the inferior parietal lobules and the intraparietal sulcus. Parietal
activity within the left hemisphere also spread within the postcentral gyrus. Bilateral
activation was also evident in the superior, the middle and the inferior temporal gyri and
in two clusters within the superior occipital cortex. Activity was also evident in the
thalamus. Finally, activation within the cerebellum was evident at the level of the VI,
VII and VIII lobules. The reverse t-contrast considering ‘static control’ versus ‘action
observation’, did not show any significant activation.

74
Figure 5.3. Regions of increased activation for the main effect of ‘action observation’.
5.3.2 Action execution
Activations related to ‘grasping execution’ versus ‘object fixation’ are shown Figure
5.4 (see also Table D2 in Appendix D). In general, the revealed pattern of activation
was similar to that reported in previous grasping studies (for review see Castiello, 2005;
Castiello & Begliomini, 2008). Specifically, activation was significant within the dorsal
and the ventral sectors of the premotor cortex, in the inferior frontal gyrus and in the
insula. For the parietal cortex significant differential activation comprehended the
postcentral gyrus, the superior and the inferior parietal lobule together with the
intraparietal sulcus. Other activations closely associated with actual execution included
SMA and caudal cingulate motor area together with the inferior and the middle
temporal and the superior occipital cortices. An involvement of subcortical structures
was also detected at the level of the basal ganglia and the thalamus. Whereas all the
above mentioned brain loci where characterized by a bilateral pattern of activity there
was an evident left lateralization of activity within the postcentral gyrus and precentral
sulcus resembling somatomotor activation within regions related to the movement of the
thumb, the index finger, the arm and the elbow (Lotze et al., 2000).

75
Figure 5.4. Regions of increased activation for ‘action execution’.
5.3.3 Conjunction analysis
As shown in Figure 5.5, various regions showed overlapping activation related to
both the execution and the observation of grasping actions. These regions were the left
ventral premotor cortex together with bilateral activation within the dorsal premotor
cortex, caudal cingulate motor area, the middle temporal gyrus and the parietal cortex.
Subcortical regions included the left thalamus and the cerebellum bilaterally. These
results confirm the pattern of overlaps for action execution and observation previously
reported by Gazzola et al. (2007; Gazzola & Keysers, 2009).
Figure 5.5 Regions of overlapping activity for both ‘action observation’ and ‘action execution’.
76
5.4 Discussion
The results for the conjunction analysis revealed the existence of various regions of
overlap in which activations related to both observation and execution of grasping
actions were independently significant. The fact that areas showing possible ‘mirror’
type of activity exceed those considered as being part of the core ‘mirror’ system
supports recent neuroimaging studies in both humans and monkeys (Gazzola et al.,
2007; Gazzola & Keysers, 2009; Raos et al., 2007; Evangeliou, et al., 2009). In ‘human’
terms, Gazzola et al. (2007; Gazzola & Keysers, 2009) reported a pattern of activation
within a network involving temporal, parietal, and frontal areas similar to ours. In
‘monkey’ terms, two studies (Raos et al., 2007; Evangeliou et al., 2009), by using the
quantitative deoxyglucose method to map the activity pattern throughout the cortex of
macaques, have found overlapping activity for the generation and the perception of
hand actions within posterior parietal, somatosensory, motor and premotor cortices.
Importantly, these latter results confirmed previous ‘human’ neuroimaging studies
revealing activations for action execution and observation within the primary motor and
somatosensory cortices, the dorsal and ventral premotor cortical areas together with
medial cortical and the cingulated areas.
Altogether these and the present findings suggest that the resonant system
responding to both action perception and action generation encompasses much more of
the cortex than the mirror neuron concept would lead one to believe, suggesting the
existence of a broader process possibly entailing mental simulation of action (Goldman
et al., 2005; Raos et al., 2007; Gazzola et al., 2007; Gazzola & Keysers, 2009;
Evangeliou et al., 2009).
77
Abstract
Recent neuroimaging evidence in macaques (Nelissen et al., 2005) has shown that
mirror area F5c is modulated by whether an observed action is performed by a person in
full view or an isolated hand (i.e., type of agent manipulation). Although a human
homologue region has been identified, whether in humans the neural processes involved
in this capacity are modulated by the type of observed agent remains unknown. Here I
used fMRI to investigate this issue, i.e. whether this ‘mirror’ region within the ventral
premotor cortex, responds differentially depending on the type of agent. In contrast to
monkeys, results from region of interest (ROI) analyses showed that this area responded
in a similar fashion following the observation of either an isolated hand or an entire
model acting.
4Published. Turella, L., Erb, M., Grodd, W., & Castiello, U. (2009). Visual features of an observed agent do not modulate human brain activity during action observation. NeuroImage, 46, 844-53.
6. The response of the human ventral premotor ‘mirror’ region to the type of observed agent 4
78
6.1 Introduction
Recent findings from an fMRI study investigating the neural underpinnings of
action observation in monkeys add a further level of complexity regarding the visual
requirements necessary to activate the ‘observation’ component of the mirror system
(Nelissen et al., 2005). Monkeys observed video clips showing either a full view of a
person or an isolated hand grasping objects and, as control condition, static single
frames or scrambled videos. It was found that premotor area F5c (the area in which
mirror neurons were first discovered) was active only when the monkey observed a
human model presented in her entirety grasping an object, but it was not active when it
observed a human hand detached from the body performing the task. In the other
subregions of F5 (i.e., F5a, F5p) activation due to action observation was reported for
both the model and the hand alone acting. These results seem to suggest that different
types of agent alerts specific sectors of the premotor cortex and this occurs despite the
goal for the two agents, both biological in nature and presumably showing similar
kinematics, remains the same. Therefore it might well be that visual features of agents
are as important as action goal for modulating action observation activity, at least within
the core ‘mirror’ area F5c.
Here I capitalize on the above mentioned findings to investigate for the first time
whether in humans, as happens in monkeys, the human homologue region of monkey
F5c is differentially activated depending on the type of agent irrespective of action goal.
This is a reasonable question to ask considering that a number of fMRI studies in
humans have shown that action observation in humans evokes widespread frontal
activation, including that of premotor area 6 and of prefrontal areas 44 and 45 (Gazzola
et al., 2007). Therefore, I defined the homologue human ‘mirror’ region in ventral
79
premotor cortex and then I tested the effect of observing a grasping action performed
either by a fully visible model or by a hand alone.
6.2 Materials and Methods
Please note that all methodological procedures were similar to those described in
Chapter 5.
6.2.1 Participants
The participants were the same who participated in the experiment reported in
Chapter 5.
6.2.2 Stimuli
Four different types of video clips served as stimuli (4 s duration, AVI format, Xvid
codec compression, resolution 360x240, 25 frames per second). As shown in Figure 6.1
these video clips could represent: i) a human model grasping an object (‘model
grasping’, see Figure 6.2A); ii) a static human model with the hand resting on the table
in the proximity of the object (‘model static’, see Figure 6.2B); iii) a human hand
grasping an object (‘hand grasping’, see Figure 6.2C); and iv) a static human hand
resting on the table in the proximity of the object (‘hand static’, see Figure 6.2D). The
‘hand’ video clips were created from the ‘model’ video clips. Specifically, this was
done by editing the video in which the body of the human model was entirely visible.
This ensured that exactly the same movement was presented for all ‘action’ conditions,
therefore eliminating possible differences in kinematics which may confound data
interpretation. Two different models (a female and a male) performed the action for a
total of 30 videos for each condition. The video clips depicted either the model or the

80
model’s hand from the right side. Both the ‘model’ and the ‘hand’ videos were resized
to 360x240 pixels in order to keep the same resolution. The resized videos were then
compressed and their quality was the same in all conditions.
Figure 6.1. Stimuli. Frames extracted from the videos for each experimental conditions characterizing the ‘observation’ component of the experiment. From top left to bottom right the following conditions are represented: A) ‘model grasping’, B) ‘model static’, C) ‘hand grasping’ and D) ‘hand static’.
6.2.3 Procedures and task
The procedures and task was the same as in Chapter 5. The subjects were instructed
to observe carefully the video-clips.
6.2.4 Data Analysis
In order to make my analyses more consistent with the analyses performed in the
study which inspired the present research (Nelissen et al., 2005), I performed a ROI
analysis confined to one region, i.e. the ventral premotor cortex. This area was chosen
as to compare the most probable functional homologue region between my study and
STIMULI
A model grasping B model static
C hand grasping D hand static

81
the Nelissen et al. (2005) investigation. Further, a recent meta-analysis on human fMRI
data regarding action observation and execution supports my choice indicating that the
area in the human brain consistently activated in both conditions is the left ventral
premotor cortex (Chouinard & Paus, 2006). Because in humans it is more difficult than
in monkeys to determine a precise localization for this ventral premotor ROI, I
determined the ROI on the basis of functional properties. Specifically, the ROI was
identified by means of the results obtained from the conjunction analysis defining
regions activated during action observation and execution (see Chapter 5). The ROI
analysis was performed on the mean percent signal change (PSC) extracted using
Marsbar SPM Toolbox (Brett et al., 2002) from all the voxels within the selected region.
PSC data were analysed by means of an ANOVA similar to that performed for the
whole-brain ‘observation’ part. This analysis included two within-subjects factors, ‘type
of observed task’ (grasping, static) and ‘type of view’ (model, hand).
6.3 Results
An ANOVA, conducted on the PSC for the entire region of overlap within the
ventral premotor cortex, yielded only to a significant main effect of ‘type of observed
task’ (F1,15 = 89.4, p < 0.001, see Figure 6.2A for a plot of the data and Figure 6.2B for
a localization of the ROI). Both the main effect of model and the interaction between
the two factors were not significant (F1,15 = 1.36, p =0.263 and F1,15 = 0.07, p =0.800,
respectively). On the basis of these results I reasoned that testing the mean effect of an
entire ROI (comprehending 99 resampled voxels with a resolution of 2x2x2 mm) might
not be representative of the real effects occurring in this region. More subtle effects
could be present in subareas of the ventral premotor ROI. Indeed, when performing a
ROI analysis a strong assumption is made, that is that all the voxels have a

82
homogeneous pattern of activation. Normally this is not tested, but taken as true.
Therefore, to remove this possible confound I performed another analysis to test the
presence or lack of effect in all the voxels within the ventral premotor ROI. I extracted
every single voxel within the ROI. Each voxel was considered as an independent ROI.
Then 99 separate ANOVAs on the PSC for each sub-ROI were conducted. Because of
the exploratory nature of this analysis, I used no correction for the number of tested
regions. None of the 99 voxels showed a significant interaction between the two
considered factors (p > 0.05 uncorrected). But, all voxels showed a main effect of type
of ‘observed task’ (grasping vs static, p < 0.001 uncorrected). This indicates that the
results obtained for the original ROI analysis were not biased by restricting the analysis
only to the mean timecourse of the entire region.
Figure 6.2. Human ‘mirror’ ventral premotor cortex. A) Mean percent signal change occurring for the four experimental conditions for the region of overlap within ventral premotor cortex extracted from all the voxels using Marsbar. B) Localization of the premotor ventral ROI (as extracted from the conjunction analysis) rendered on the mean anatomy of the group using MriCron software.
6.4 Discussion
A recent fMRI study in monkeys has defined subregions within area F5 and the
adjacent prefrontal cortex responding to different properties of observed actions
(Nelissen et al., 2005). Specifically area F5c responded only when the monkey observed
a fully visible human model, but not when a hand alone was presented, whereas in other

83
subregions of F5 (i.e., F5a, F5p) activation due to action observation was similar for
both a fully visible model and a hand alone grasping an object (Nelissen et al., 2005).
Here I wanted to test whether a similar subdivision applies to humans.
Indeed on the basis of monkeys fMRI findings using a similar paradigm to mine
(Nelissen et al., 2005) differences in action observation activity depending on type of
view were expected, at least within premotor and other prefrontal areas. However, in
our study the type of view had little impact at the level of action observation. I suspect
that this might be ascribed to the fact that the processing of particular stimulus
properties, which in principle should occur in homologue areas, might not be common
to both species (Sereno & Tootell, 2005; Orban, Van Essen, & Vanduffel, 2004;
Nakahara, Adachi, Osada, & Miyashita, 2007). In this perspective the conclusion would
be that in humans the observation of a grasping hand alone (and an object) is sufficient
to trigger significant differential activity (Morin & Grezes, 2008). Alternatively the lack
of effects might be due to two methodological factors. The first stems from the
difficulty in defining homologue areas between monkey and human even using the
same approach (i.e., architecture, connections or function). The second refers to the
nature of the presented stimuli. To elaborate, in the study by Nelissen and colleagues
(2005) the presented stimuli greatly differ in terms of salience. For instance, the
grasping hand for the ‘hand alone grasping’ stimuli was much more visible than the
grasping hand for the ‘model grasping’ stimuli. Therefore it might not be a matter of
having elicited different type of representations within the premotor cortices. Rather, of
having triggered a differential level of activity for the ‘acting person’ stimulus in F5c.
This is because it was more difficult to decode the aspect of the context which was more
salient for the animal, that is the grasping hand. It might be reasonable to hypothesize
that if the grasping hand was not easy to contextualize, then the presentation of such

84
stimuli may have produced significant BOLD signal increase with respect to when the
grasping hand was easily coded (‘hand alone grasping’ condition). In this respect I took
great care in preparing the stimuli for the present study, maintaining the proportions and
kinematics for our stimuli similar. Importantly the videoclips for the hand alone
condition were extracted from the videoclips in which the model was in full view.
Therefore it is such consistency which might have allowed to reveal similar activations
within the premotor cortex for the two types of stimuli. Such contention is supported, at
least in humans, by a recent review examining activations in the premotor cortex during
passive observation of actions (Morin & Grezes, 2008). The suggestion here is that it is
the specificity of used stimuli which determines activity within specific areas of the
prefrontal cortices.

85
7.1 Conclusive remarks
For humans, understanding the meaning of others’ actions is a fundamental ability.
It allows our species to survive in the complex environment which constitutes our
society. In this respect, the discovery of mirror neurons has certainly helped to
understand the neural mechanisms underlying this capacity. Although the initial
research on the AOS focused on action observation and understanding, researchers from
various domains have linked the notion of the human AOS system (or MN system) to a
variety of behaviours such as imitation, empathy, speech processing, etc. The idea that
the AOS might be implicated in all these processes is certainly appealing, but in my
opinion, a bit premature when considering that the exact role and properties of the AOS
during action observation is far from being fully understood. Therefore here I decided to
step back and to further investigate the basic properties of the human AOS.
The first experimental study (Chapter 3) investigated the AOS in a population
affected by a severe neurological disorder, i.e. relapsing remitting multiple sclerosis
(RRMS) patients. The aim of the study was to test for the presence of a selective
impairment within this network. The results showed a general, but unspecific, effect of
BOLD over-activation in MS patients probably determined by the extensive
demyelination caused by the disease and by the consequent repairing process carried out
by our organism. This opens to the possibility that the ‘spared’ action observation
system might be used for neurorehabilitation. Specifically, the ability of the neural
system underlying action observation to re-enact stored motor representations has been
utilized as a mean for rehabilitating motor control (action observation therapy; Ertelt et
7. General conclusions
86
al., 2007; Buccino, Solodkin, & Small, 2006). Therefore it might well be that the action
observation therapy may help in bringing back to normal values brain activity related to
action understanding in RRMS patients.
Then, in the second experimental study (Chapter 4), I focused on a more basic
feature of the human AOS, the coding of not-object-related (intransitive) actions. This is
a unique feature of the human AOS, because in non-human primates the AOS seems not
to code for such types of actions. The central advance of this study is the demonstration
that transitivity conveyed by previous knowledge regarding the presence/absence of a
target-object modulates activity within the AOS. By manipulating this type of
information it was revealed that the AOS is able to generate a representation of an
observed action on the basis of the action goal, even when the most crucial part of the
action (i.e., hand-object interaction) is not visible. A number of studies put forward the
proposal that the human AOS responds to both transitive and intransitive actions
(Buccino et al., 2001; Wheaton et al., 2004; Dinstein et al, 2007, 2008; Lui et al., 2008)
suggesting that when a target-object is not present the AOS is still recruited. The present
study investigates such issue using a controlled paradigm having the advantage of
eliminating possible confounds. The presence of the partition allowed the introduction
of two controls which were fundamental for the interpretation of the results. First,
without the partition I would have made a direct comparison between fully visible
object-related actions and pantomimed grasps which might not represent an optimal test
for transitivity. The pattern of activity stemming from this contrast could have been
ascribed to the presence of the object per se rather than to the representation of the
action goal. To date, neurons responding to the simple observation of graspable objects
(i.e., ‘canonical’ neurons; Murata et al., 1997; Murata, Gallese, Luppino, Kaseda, &
Sakata, 2000; Raos et al., 2006; Rozzi et al., 2008) have been found within the very

87
same or nearby cortical regions in which cells responding to action observation were
detected. Second, the introduction of the partition allowed me to use the same video-
clips for the ‘grasping’ and ‘pantomime’ conditions, minimizing the potential confounds
due to subtle differences in kinematics.
The present study add to the literature revealing that the AOS has the ability to
discriminate and understand observed actions on the basis of the properties
characterizing their goal (i.e. transitivity) rather than their perceived physical features.
In this sense, I was able to find a modulation within the AOS with respect to the
transitivity, suggesting that at least part of the system can be extremely selective in
terms of processing the abstract properties of the goal characterizing the observed
action.
The two final experimental Chapters (Chapters 5 and 6) of the present thesis were
concerned with the definition/identification of the human ‘mirror’ regions and (if any)
of what they code for. In general, the present results support the notion that in humans
‘mirror’ activity spreads across a number of areas which exceeds those classically
thought to be part of the ‘mirror’ system (e.g., Raos et al., 2007; Gazzola et al., 2007;
Gazzola and Keysers, 2009; Evangeliou et al., 2008). In details, it seems that activity
within this network is triggered by both a model or a hand alone acting, and that is not
modulated by the type of agent. In this respect, the present results highlight that it is the
goal of an action which might be the most important determinant causing action
observation activation. Further, a region of interest analysis (ROI) on the putative
human region F5c indicate that, in contrast to monkeys (Nelissen et al., 2005), this
region is activated in a similar fashion irrespective of whether the agent's entire body, or
only the grasping hand, is seen.

88
Altogether these results are discussed in terms of the possibility that the AOS and
the ‘mirror’ systems chiefly represent actions in terms of goals independently by
contextual information (Ferrari et al., 2005; Gazzola et al., 2007). The idea is that what
is represented in the premotor cortex is not bounded to the physical apparence of the
agent, but it is a rather abstract representation centred on the goal of the action,
independently of what is acting, a human, a robot, or even a tool. The present findings
confirm and extend this notion by broadening the several dimensions within which
action goals affect the response of the AOS and how such dimensions may vary across
species. In humans, the observation of an effector alone (the hand) grasping a target-
object is sufficient to activate the AOS. This aspect is particularly important because
most of the human studies on the AOS have been conducted with movies zooming into
the hand-part of the stimulus. If, as monkeys’ fMRI indicated (Nelissen et al., 2005),
this were to cancel out key mirror areas, much of the human literature would have been
challenged. The present data, however, show convincingly that this is not the case, at
least in humans, and therefore enhance the validity of a large number of studies
providing important and novel evidence within this flourishing field of research.
89
I would like to thank Professors Umberto Castiello and Professor Wolfgang Grodd
for their supervision and for providing the funding and the environment as to perform
the research reported in this thesis. Andrea C. Pierno is thanked for teaching how to
perform an fMRI investigation and for his invaluable support. Federico Tubaldi is
thanked for his invaluable technical support in implementing fMRI experiments and for
helping in fMRI data collection. Caterina Ansuini is thanked for having constructive
discussions on how to interpret experimental data. Merim Bilalic is thanked for his
support and for the long discussions. Mathias Röger is thanked for helping with data
acquisition and for his patience. Dr. Michael Erb is thanked for his help with the MRI-
apparatus, the MR sequences and data analysis. Sarah Mang and Hubertus Becker for
helping with the Matlab programming. Sarah is also thanked for her help in analysing
diffusion data. Christoph Braun und Jürgen Dax are thanked for constructing the MRI-
compatible apparatus.
Acknowledgements

90

91
Barraclough, N.E., Keith, R.H., Xiao, D., Oram, M.W., & Perrett, D.I. (2009). Visual
adaptation to goal-directed hand actions. Journal of Cognitive Neuroscience, 21,
1806-20.
Belmalih, A., Borra, E., Contini, M., Gerbella, M., Rozzi, S., & Luppino, G. (2009).
Multimodal architectonic subdivision of the rostral part (area F5) of the macaque
ventral premotor cortex. The Journal of Comparative Neurology, 51, 183-217.
Brass, M., & Heyes, C.M. (2005). Imitation: is cognitive neuroscience solving the
correspondence problem? Trends in Cognitive Sciences, 9, 489-495.
Brass, M., Schmitt, R.M., Spengler, S., & Gergely, G. (2007). Investigating action
understanding: inferential processes versus action simulation. Current Biology, 17,
2117-21.
Brett, M., Anton, J.L., Valabregue, R., & Poline, J.B. (2002). Region of interest analysis
using an SPM toolbox. NeuroImage, 16, abstract 497.
Buccino, G., Binkofski, F., Fink, G.R., Fadiga, L., Fogassi, L., Gallese, V., et al. (2001).
Action observation activates premotor and parietal areas in a somatotopic manner:
an fMRI study. European Journal of Neuroscience, 13, 400–404.
References

92
Buccino, G., Solodkin, A., & Small, S. (2006). Functions of the mirror neuron system:
implications for neurorehabilitation. Cognitive and behavioral neurology, 19, 55-
63.
Castiello, U. (2005). The neuroscience of grasping. Nature Reviews. Neuroscience, 6,
726-736.
Castiello, U., & Begliomini, C. (2008). The cortical control of visually-guided grasping.
The Neuroscientist, 14,157-170.
Chong, T.T., Williams, M.A., Cunnington, R., & Mattingley, J.B. (2008). Selective
attention modulates inferior frontal gyrus activity during action observation.
NeuroImage, 40, 298-307.
Chouinard, P.A. & Paus, T. (2006). The primary motor and premotor areas of the
human cerebral cortex. The Neuroscientist, 12,143-152.
Culham, J.C., Danckert, S.L., DeSouza, J.F., Gati, J.S., Menon, R.S., & Goodale, M.A.
(2003). Visually guided grasping produces fMRI activation in dorsal but not ventral
stream brain areas. Experimental Brain Research, 153, 180-189.
di Pellegrino, G., Fadiga, L., Fogassi, L., Gallese, V., & Rizzolatti, G. (1992).
Understanding motor events: a neurophysiological study. Experimental Brain
Research, 91, 176-80.
93
Desimone, R., Albright, T.D., Gross, C.G., & Bruce, C. (1984). Stimulus-selective
properties of inferior temporal neurons in the macaque. The Journal of
Neuroscience, 4, 2051–2062.
Dinstein, I., Hasson, U., Rubin, N., & Heeger, D.J. (2007): Brain areas selective for
both observed and executed movements. Journal of Neurophysiology, 98, 1415–
1427.
Dinstein, I., Gardner, J.L., Jazayeri, M. & Heeger, D.J. (2008): Executed and observed
movements have different distributed representations in human aIPS. Journal of
Neuroscience, 28, 11231–11239.
Duvernoi, H.M., & Bourgouin, P. (1999). The human brain surface, three-dimensional
sectional anatomy and MRI. Wein: Springer-Verlag.
Eickhoff, S.B., Stephan, K.E., Mohlberg, H., Grefkes, C., Fink, GR., Amunts, K., et al.
(2005). A new SPM toolbox for combining probabilistic cytoarchitectonic maps and
functional imaging data. NeuroImage, 25, 1325-1335.
Ertelt, D., Small, S., Solodkin, A., Dettmers, C., McNamara, A., & Buccino, G. (2007).
Action observation has a positive impact on rehabilitation of motor deficits after
stroke. NeuroImage, 36, T164-173.

94
Evangeliou, M.N., Raos, V., Galletti, C., & Savaki, H.E. (2009). Functional imaging of
the parietal cortex during action execution and observation. Cerebral Cortex, 19,
624-639.
Ferrari, P.F., Rozzi, S., & Fogassi, L. (2005). Mirror neurons responding to observation
of actions made with tools in monkey ventral premotor cortex. Journal of Cognitive
Neuroscience, 17, 212-226.
Filippi, M., Rocca, M.A., Colombo, B., Falini, A., Codella, M., Scotti, G., et al. (2002).
Functional magnetic resonance imaging correlates of fatigue in multiple sclerosis.
NeuroImage, 15, 559-567.
Filippi, M., Rocca, M.A., & Mezzapesa, D.M. (2004). A functional MRI study of
cortical activations associated with object manipulation in patients with MS.
NeuroImage, 21, 1147-1154.
Fogassi, L., Ferrari, P. F., Gesierich, B., Rozzi, S., Chersi, F., & Rizzolatti, G. (2005).
Parietal lobe: from action organization to intention understanding. Science, 308,
662-667.
Franklin, R.J.M., & ffrench-Constant, C. (2008). Remyelination in the CNS: from
biology to therapy. Nature Reviews. Neuroscience, 9, 839-855.
Friston, K.J., Holmes, A.P., Poline, J.B., Grasby, P.J., Williams, S.C.R., Frackowiak,
R.S.J., et al. (1995). Analysis of fMRI time-series revisited. NeuroImage, 2, 45-53.

95
Friston, K.J., Penny, W.D., & Glaser, D.E. (2005). Conjunction revisited. NeuroImage,
25, 661-667.
Gallese, V., Fadiga, L., Fogassi, L., & Rizzolatti, G. (1996). Action recognition in the
premotor cortex. Brain, 119, 593–609.
Gallese, V., Fogassi, L., Fadiga, L. & Rizzolatti, G. (2002). Action representation and
the inferior parietal lobule. In W. Prinz and B. Hommel. (Eds.), Common
Mechanisms in Perception and Action: Attention and Performance (Vol. XIX, pp.
247-266). New York, Oxford University Press.
Gazzola, V., Rizzolatti, G., Wicker, B., & Keysers, C. (2007). The anthropomorphic
brain: The mirror neuron system responds to human and robotic actions.
NeuroImage, 35, 1674-1684.
Gazzola, V., & Keysers, C. (2009). The observation and execution of actions share
motor and somatosensory voxels in all tested subjects: single-subject analyses of
unsmoothed fMRI data. Cerebral Cortex, 19, 1239-55.
Genovese, C.R., Lazar, N.A., & Nichols, T. (2002). Thresholding of statistical maps in
functional neuroimaging using the false discovery rate. NeuroImage, 15, 870-878.
Geurts, J.J.G., & Barkhof, F. (2008). Grey matter pathology in multiple sclerosis.
Lancet Neurology, 7, 841-851.
96
Goldman, A.I., & Sebanz, N. (2005). Simulation, mirroring, and a different argument
from error. Trends in Cognitive Sciences, 9, 320.
Grafton, S.T., Arbib, M.A., Fadiga, L., & Rizzolatti, G. (1996). Localization of grasp
representations in humans by positron emission tomography: 2. Observation
compared with imagination. Experimental Brain Research, 112, 103-111.
Grafton, S.T., & Hamilton, A.F. (2007). Evidence for a distributed hierarchy of action
representation in the brain. Human movement science, 26, 590-616.
Gridley, M. C., & Hoff, R. (2006). Do mirror neurons explain misattribution of
emotions in music? Perceptual and motor skills, 102, 600-602.
Hamilton, A.F., & Grafton, S.T. (2006). Goal representation in human anterior
intraparietal sulcus. The Journal of Neuroscience, 26, 1133-1137.
Hamilton, A.F., & Grafton, S.T. (2007). The motor hierarchy: From kinematics to goals
and intentions. In P. Haggard, Y. Rossetti, M. Kawato, (Eds.), Sensorimotor
Foundations of Higher Cognition (pp 381–408). Oxford: Oxford University Press.
Hamilton, A.F., & Grafton, S.T. (2008). Action outcomes are represented in human
inferior frontoparietal cortex. Cerebral Cortex, 18, 1160–1168.
Iacoboni, M. (2005). Neural mechanisms of imitation. Current Opinion in
Neurobiology, 15, 632-637.

97
Iacoboni, M., Molnar-Szakacs, I., Gallese, M., Buccino, G., Mazziotta, J.C. &
Rizzolatti, G. (2005). Grasping the intentions of others with one’s own mirror
neuron system. Public Library of Science, Biology, 79, 529-535.
Jellema, T., Baker, C.I., Wicker, B., & Perrett, D.I. (2000). Neural representation for the
perception of the intentionality of hand actions. Brain and Cognition, 44, 280–302.
Jellema, T., &Perrett, D.I. (2003). Perceptual history influences neural responses to face
and body postures. Journal of Cognitive Neuroscience, 15, 961-71.
Jellema, T., & Perrett, D.I. (2006). Neural representations of perceived bodily actions
using a categorical frame of reference. Neuropsychologia, 44, 1535-46.
Johnson-Frey, S.H., Maloof, F.R., Newman-Norlund, R., Farrer, C., Inati, S., &
Grafton, S. T. (2003). Actions or hand-object interactions? Human inferior frontal
cortex and action observation. Neuron, 39, 1053-1058.
Keysers, C., & Perrett, D. I. (2004). Demystifying social cognition: a Hebbian
perspective. Trends in Cognitive Sciences, 8, 501-507.
Kurtzke, J.F. (1983). Rating neurologic impairment in multiple sclerosis: an expanded
disability status scale EDSS. Neurology, 33, 1444-1452.

98
Lee, M., Reddy, H., Johansen-Berg, H., Pendlebury, S., Jenkison, M., Smith, S., Palace,
J. & Mattews, P.M., (2000). The motor cortex shows adaptive functional changes to
brain injury from multiple sclerosis. Annals of Neurology, 47, 606-613.
Leslie, K.R., Johnson-Frey, S.H., & Grafton, S.T. (2004). Functional imaging of face
and hand imitation: towards a motor theory of empathy. NeuroImage, 21, 601-607.
Lotze, M., Erb, M., Flor, H., Huelsmann, E., Godde, B., & Grodd, W. (2000). fMRI
Evaluation of Somatotopic Representation in Human Primary Motor Cortex.
NeuroImage, 11, 473-481.
Lui, F., Buccino, G., Duzzi, D., Benuzzi, F., Crisi, G., Baraldi, P., et al. (2008). Neural
substrates for observing and imagining non-object-directed actions. Social
Neuroscience, 3, 261-75.
Mai, J.K., Assheuer, J., & Paxinos, G. (2004). Atlas of the human brain. 2nd Edition,
Academic Press. San Diego: Elsevier Academic Press.
Mayka, M.A., Corcos, D.M., Leurgans, S.E., & Vaillancourt, D.E. (2006). Three-
dimensional locations and boundaries of motor and premotor cortices as defined by
functional brain imaging: a meta-analysis. NeuroImage, 31, 1453-74.
Molnar-Szakacs, I., & Overy, K. (2006). Music and mirror neurons: from motion to
‘e’motion. Social Cognitive and Affective Neuroscience, 1, 235-241.

99
Morin, O., & Grèzes, J. (2008). What is "mirror" in the premotor cortex? A review.
Clinical Neurophisiology, 38, 189-195.
Murata, A., Fadiga, L., Fogassi, L., Gallese, V., Raos, V., & Rizzolatti, G. (1997).
Object representation in the ventral premotor cortex (area F5) of the monkey.
Journal of Neurophysiology, 78, 2226-30.
Murata, A., Gallese, V., Luppino, G., Kaseda, M., & Sakata, H. (2000). Selectivity for
the shape, size, and orientation of objects for grasping in neurons of monkey parietal
area AIP. Journal of Neurophysiology, 83, 2580-601.
Nakahara, K., Adachi, Y., Osada, T. & Miyashita, Y. (2007). Exploring the neural basis
of cognition: multi-modal links between human fMRI and macaque
neurophysiology. Trends in Cognitive Sciences, 11, 84–92.
Nelissen, K., Luppino, G., Vanduffel, W., Rizzolatti, G., & Orban, G.A. (2005).
Observing others: multiple action representation in the frontal lobe. Science, 310,
332-336.
Nichols, T., Brett, M., Andersson, J., Wager, T., & Poline, J.B. (2005). Valid
conjunction inference with the minimum statistic. NeuroImage, 25, 653-660.
Ogawa, S., Lee, T.M., Kay, A.R., & Tank, D.W. (1990). Brain magnetic resonance
imaging with contrast dependent on blood oxygenation. Proceedings of the National
Academy of Sciences of the United States of America, 87, 9868-9872.

100
Ogawa, S., Tank, D.W., Menon, R., Ellermann, J.M., Kim, S.G., Merkle, H., et al.
(1992). Intrinsic signal changes accompanying sensory stimulation: Functional brain
mapping with magnetic resonance imaging. Proceedings of the National Academy of
Sciences of the United States of America, 89, 5951-5955.
Orban, G.A., Van Essen, D. & Vanduffel, W. (2004). Comparative mapping of higher
visual areas in monkeys and humans. Trends in Cognitive Sciences, 8, 315–324.
Pantano, P., Maniero, C., Lenzi, D., Caramia, F., Iannetti, GD., Piattella, M.C., et al.
(2005). A longitudinal fMRI study on motor activity in patients with multiple
sclerosis. Brain, 128, 2146-2153.
Pelphrey, K.A., Morris, J.P., Michelich, C.R., Allison, T., & McCarthy, G. (2005).
Functional anatomy of biological motion perception in posterior temporal cortex: an
FMRI study of eye, mouth and hand movements. Cerebral Cortex, 15, 1866-1876.
Perrett, D.I., Harries, M.H., Bevan, R., Thomas, S., Benson, P.J., Mistlin, A.J., et al.
(1989). Frameworks of analysis for the neural representation of animate objects and
actions. Journal of Experimental Biology, 146, 87–113.
Perrett, D.I., Mistlin, A.J., Harries, M.H., & Chitty, A.J. (1990). Understanding the
visual appearance and consequence of hand actions. In M.A. Goodale (ed.), Vision
and action: the control of grasping (pp. 163–180). Norwood, New Jersey: Ablex
Publishing.

101
Pineda, J.O.A., & Oberman, L.M. (2006). What goads cigarette smokers to smoke?
Neural adaptation and the mirror neuron system. Brain research, 1121, 128-135.
Pirko, I., Lucchinetti, C.F., Sriram, S., & Bakshi, R., (2007). Gray matter involvement
in multiple sclerosis. Neurology, 68, 634-642.
Ponseti, J., Bosinski, H. A., Wolff, S., Peller, M., Jansen, O., Mehdorn, H. M., et al.
(2006). A functional endophenotype for sexual orientation in humans. Neuroimage,
33, 825-833.
Raos V., Evangeliou, M.N., & Savaki, H.E. (2004). Observation of action: grasping
with the mind's hand. Neuroimage, 23, 193-201.
Raos, V., Umiltá, M.A., Murata, A., Fogassi, L. & Gallese, V. (2006): Functional
properties of grasping-related neurons in the ventral premotor area F5 of the
macaque monkey. Journal of Neurophysiology, 95, 709-29.
Raos, V., Evangeliou, M.N., & Savaki, H.E. (2007). Mental simulation of action in the
service of action perception. The Journal of Neuroscience, 27, 12675-12683.
Reddy, H., Narayanan, S., Arnoutelis, R., Jenkinson ,M., Antel, J., Mattews, P.M., et al.
(2000). Evidence for adaptive functional changes in the cerebral cortex with axonal
injury from multiple sclerosis. Brain, 123, 2314-2320.

102
Rizzolatti, G., Camarda, R., Fogassi, L., Gentilucci, M., Luppino, G. & Matelli, M.
(1988). Functional organization of inferior area 6 in the macaque monkey. II. Area
F5 and the control of distal movements. Experimental Brain Research, 71, 491-507.
Rizzolatti, G., Fadiga, L., Fogassi, L., & Gallese, V. (1996a). Premotor cortex and the
recognition of motor actions. Brain research: Cognitive Brain research, 3, 131–141.
Rizzolatti, G., Fadiga, L., Matelli, M., Bettinardi, V., Paulesu, E., Perani, D., et al.
(1996b). Localization of grasp representation in humans by PET: 1. Observation
versus execution. Experimental Brain Research, 111, 246–52.
Rizzolatti, G., Fogassi, L., & Gallese, V. (2001). Neurophysiological mechanisms
underlying the understanding and imitation of action. Nature Reviews.
Neuroscience, 2, 661–670.
Rizzolatti, G., & Craighero, L. (2004). The mirror-neuron system. Annual Review of
Neuroscience, 27, 169–192.
Rizzolatti, G., & Fabbri-Destro, M. (2008). The mirror system and its role in social
cognition. Current Opinion in Neurobiology, 18, 179-184.
Rizzolatti, G., Fabbri-Destro, M., & Cattaneo, L. (2009). Mirror neurons and their
clinical relevance. Nature clinical practice. Neurology, 5, 24-34.

103
Rocca, M.A., Falini, A., Colombo, B., Scotti, G., & Filippi, M. (2002). Adaptive
functional changes in the cerebral cortex of patients with non-disabling MS
correlate with the extent of brain structural damage. Annals of Neurology, 51, 330-
339.
Rocca, M.A., Colombo, B., Falini, A., Grezzi, A., Martinelli, V., Scotti, G., Comi, G.,
& Filippi, M. (2005). Cortical adaptation in patients with MS: a cross-sectional
functional MRI study of disease phenotypes. Lancet Neurology, 4, 618-626.
Rocca, M.A., Tortorella, P., & Ceccarelli, A. (2008). The “mirror-neuron system” in
MS: A 3 tesla fMRI study. Neurology, 70, 255-262.
Rozzi, S., Ferrari, P.F., Bovini, L., Rizzolatti, G., & Fogassi, L. (2008). Functional
organization of inferior parietal lobule convexity in the macaque monkey:
electrophysiological characterization of motor, sensory and mirror responses and
their correlation with cytoarchitectonic areas. European Journal of Neuroscience,
28, 1569-1588.
Sereno, M.I. & Tootell, R.B. (2005). From monkeys to humans: what do we now know
about brain homologies? Current Opinion in Neurobiology, 15, 135-144.
Schmahmann, J.D., Doyon, J., Toga, A.W., Petrides, M., & Evans, A.C. (2000). MRI
Atlas of the Human Cerebellum. San Diego: Academic Press.

104
Shmuelof, L., & Zohary, E. (2005). Dissociation between ventral and dorsal fMRI
activation during object and action recognition. Neuron, 47, 457-470.
Shmuelof, L., & Zohary, E. (2006). A mirror representation of others’ actions in the
human anterior parietal cortex. The Journal of Neuroscience, 26, 9736-9742.
Umiltà, M.A., Kohler, E., Gallese, V., Fogassi, L., Fadiga, L., Keysers, C., et al. (2001).
I know what you are doing: a neurophysiological study. Neuron; 31, 155-165.
Wachsmuth, E., Oram, M. W., & Perrett, D. I. (1994). Recognition of objects and their
component parts: responses of single units in the temporal cortex of the macaque.
Cerebral Cortex, 4, 509–522.
Wheaton, K.J., Thompson, J.C., Syngeniotis, A., Abbott, D.F. & Puce, A. (2004):
Viewing the motion of human body parts activates different regions of premotor,
temporal, and parietal cortex. NeuroImage, 22, 277-88.
Wyk, B.C., Hudac, C.M., Carter, E.J., Sobel, D.M., & Pelphrey, K.A. (2009): Action
Understanding in the Superior Temporal Sulcus Region. Psychological Sciences,
20, 771-777.
105
Data acquisition information regarding the experiment reported in
Chapter 3
All functional and structural images collected for the present study were acquired
using a whole body 1.5T Philips Achieva scanner (Philips Medical Systems, Best, The
Netherlands) equipped with a standard 8-channel head coil. Functional images were
obtained with a standard single shot echo-planar (EPI) T2*-weighted sequence in order
to measure blood oxygenation level-dependent (BOLD) contrast throughout the whole
brain (TR = 3 s; TE = 50 ms; flip angle = 90°; 32 contiguous axial slices with a slice
thickness of 3.5 mm/0.5 mm gap; FOV = 224 x 224 mm; matrix size = 64 x 64; in-plane
resolution of 3.5 x 3.5 mm). 356 volumes were acquired in four scanning runs (89
volumes for each run). Immediately after the acquisition of the functional EPI volumes,
a structural image of the brain was acquired for each participant with the following
sequence: three-dimensional T1-weighted Fast Field Eco (FFE) sequences (TR = 25; TE
= 4.6; flip angle = 30°; 120 contiguous axial slices with a slice thickness 1.2 mm, FOV
= 250 x 250 mm, matrix size = 256 x 256, in-plane resolution of 0.98 x 0.98 mm).
Data acquisition information regarding the experiment reported in
Chapter 4
Whole-brain data were acquired on a three Tesla Magnetom Trio Scanner (Siemens,
Erlangen, Germany) equipped with a 12-channel head array RF coil. Functional images
were obtained with an EPI T2*-weighted sequence in order to measure blood
Appendix A: information regarding magnetic resonance imaging sequences

106
oxygenation level-dependent (BOLD) contrast throughout the whole brain (TR = 2000
ms, TE = 33 ms, field of view 192x192 mm, matrix 64x64, in-plane resolution 3x3 mm,
slice thickness = 3.5 mm, 0.7 mm gap, 32 slices). Scans were acquired for each
participant in different scanning runs, three runs (462 volumes each) for the observation
part of the experiment and one for the localiser (425 volumes). The first 5 volumes of
every run were discarded due to initial instability in the signal of EPI images. High-
resolution T1-weighted images were also acquired for each participant during the
experimental session (MP-RAGE, TR = 2300 ms, TE = 3.03 ms, flip angle = 8°, field of
view 224 x 256 mm, 1 mm isotropic voxels, 160 slices).
Data acquisition information regarding the experiment reported in
Chapters 5 and 6
fMRI data were acquired on a 3T scanner (Siemens Magnetom Trio, Erlangen,
Germany) equipped with a 12-channel head array RF coil. Functional images were
obtained with a gradient echo-planar (EPI) T2*-weighted sequence in order to measure
blood oxygenation level-dependent (BOLD) contrast throughout the whole brain (36
slices, 3 mm isotropic voxel size, 0.75 spacing, inplane resolution of 64 x 64 voxels,
FOV = 192 x 192 mm, flip angle = 90°, TR=2500 ms, TE = 35 ms). The first 5
volumes of every run were discarded from the analysis due to initial instability in the
signal of EPI images. Scans were acquired for each subject in four scanning runs, two
runs (437 volumes each) for the observation part of the experiment and two runs (229
volumes each) for the execution part. In addition, high-resolution T1-weighted images
(anatomical scans) were also acquired for each participant (MP-RAGE, 160 slices, in-
plane resolution 224 x 256, 1 mm isotropic voxels, TR = 2300 ms, TE = 3.03 ms, flip
angle = 8° ).

107
TABLE B1: Demographic, clinical and MRI parameters of both early RRMS patients and healthy controls.
MS patients Healthy controls
Female/male 8/7 7/8
Mean age in years 30.6 (19-44) 34 (24-54)
Mean disease duration in months 16.2 ± 9.2 (3-34) n.a
T2-WM-LV 2.4 ± 1.7 (0.8-5.3) 0
CLs number 3.1 ± 2.1 (0-7) 0
BPf (%) 83.1 ± 3.2 (81.1-
86.7) 82.8 ± 3.4 (81.2-
85.8)
GMf (%) 39.1 ± 1.6 (36.2-
41.1) 40.2 ± 2.1 (38.2-
42.3)
WMf(%) 44.0 ± 1.8 (41.0-
46.8) 42.6± 2.0 (40.9-
46.3)
EDSS 1.5 ± 0.6 (1-3) n.a.
DMT: None
Immunomodulatory
5
10 n.a.
Data are reported as mean, ± standard deviation, and range in brackets. T2-WM-LV = T2 white matter lesion volume; CLs = cortical lesions; BPf = brain parenchimal fraction; GMf = grey matter fraction; WMf = white matte fraction; EDSS = expanded disability status scale; DMT = disease modifying therapy; n.a. = not applicable.
Appendix B: supplementary materials of Chapter 3.

108
TABLE B2: Regions activated for the main effect of group.
Peak localization x y z t value
Frontal cortex
Left Precentral gyrus -50 -4 46 12.72
Left Paracentral lobule -10 -28 70 11.28
Right Precentral gyrus 50 2 36 10.57
Right Superior medial gyrus 10 66 8 6.78
Left Superior frontal gyrus -14 32 48 6.17
Left Superior frontal gyrus -20 64 0 5.49
Right Superior frontal gyrus 18 46 38 4.36
Temporal cortex
Middle temporal gyrus 58 -38 2 8.46
Hippocampus 28 2 -36 8.04
Hippocampus 18 -10 -12 6.96
Inferior temporal gyrus -62 -56 -6 6.66
Insula 28 18 -12 5.32
Middle temporal gyrus -66 -46 4 5.24
Superior temporal gyrus -66 -26 12 4.87
Insula -32 -6 12 3.98
Inferior temporal gyrus 58 -46 -12 10.53
Visual cortex
Fusiform gyrus -22 -86 -18 24.22
Middle occipital gyrus -22 -94 4 16.65
Cerebellum
Cerebellar cortex (crus II) -38 -66 -46 5.03
Cerebellar vermis -2 -62 -40 4.98
Subcortical structures
Amygdala -24 -6 -14 4.10
Stereotaxic coordinates in MNI space are reported in mm.

109
TABLE B3: Regions activated for the main effect of ‘condition’ (Hand grasping > Hand resting).
Peak localization x y z t value
Frontal cortex
Left Middle frontal gyrus -34 60 14 4.61
Right Inferior frontal gyrus 54 20 28 4.42
Right Inferior frontal gyrus 52 36 -8 4.23
Left Inferior frontal gyrus -48 40 14 4.11
Left Precentral gyrus -54 10 30 3.99
Parietal cortex
Right Postcentral gyrus 50 -22 38 5.82
Visual cortex
Right Inferior occipital gyrus 28 -90 -6 11.89
Left Middle occipital gyrus -36 -90 0 11.06
Right Superior occipital gyrus 26 -80 32 4.6
Stereotaxic coordinates in MNI space are reported in mm.
TABLE B4: Regions activated for the main effect of ‘condition’ (Hand resting > Hand grasping).
Peak localization x y z t value
Visual cortex
Right Calcarine gyrus 4 -86 -2 8.40
Stereotaxic coordinates in MNI space are reported in mm.

110
TABLE C1: Regions activated for the localizer.
Peak localization x y z t value
Frontal cortex
Left Precentral gyrus -26 -12 52 4.95
Right Precentral gyrus 28 -12 54 4.08
Left Superior Frontal gyrus -14 -8 72 3.77
Parietal cortex
Left Superior Parietal lobule -36 -46 60 7.3
Right Intraprietal cortex 42 -38 54 5.39
Right Supramarginal gyrus 60 -24 42 4.26
Temporal cortex
Left Inferior Temporal gyrus -40 -46 -18 4.89
Left Superior Temporal gyrus -46 -44 14 3.71
Occipital cortex
Left Middle Occipital gyrus -50 -72 4 14.19
Right Superior Occipital gyrus 24 -80 36 5.88
Cingulate cortex
Left Posterior Cingulate cortex -14 -26 34 3.72
Cerebellum
Left Cerebellum Crus II -4 -78 -40 4.02
Left Cerebellum lobule VI -24 -40 -40 3.9
Subcortical structures
Right Thalamus 16 -22 8 4.66
Left Thalamus 16 -30 2 4.58
Stereotaxic coordinates in MNI space are reported in mm.
Appendix C: supplementary materials of Chapter 4.
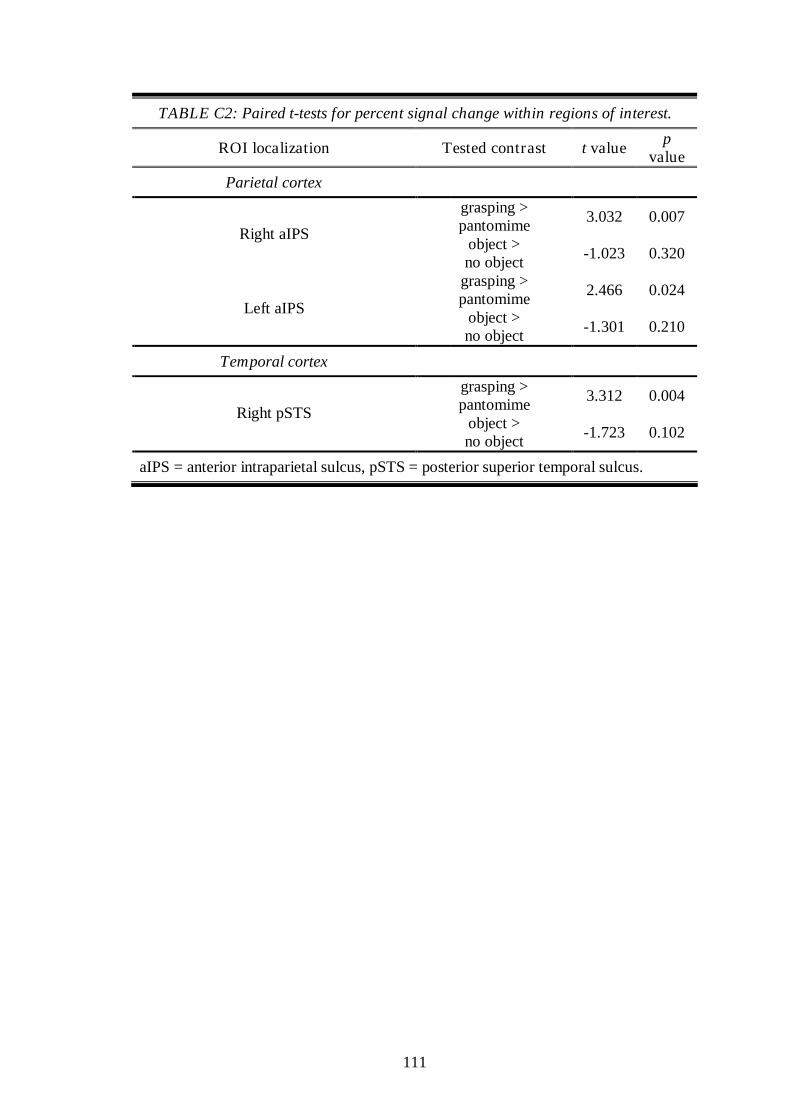
111
TABLE C2: Paired t-tests for percent signal change within regions of interest.
ROI localization Tested contrast t value p
value
Parietal cortex
grasping > pantomime
3.032 0.007 Right aIPS
object > no object
-1.023 0.320
grasping > pantomime
2.466 0.024 Left aIPS
object > no object
-1.301 0.210
Temporal cortex
grasping > pantomime
3.312 0.004 Right pSTS
object > no object
-1.723 0.102
aIPS = anterior intraparietal sulcus, pSTS = posterior superior temporal sulcus.

112
TABLE D1: Regions activated for action observation.
Peak localization x y z t value
Frontal cortex
Left Precentral gyrus -28 -12 56 8.57
Left Precentral gyrus -54 4 38 6.68
Right Precentral gyrus 34 -6 56 5.59
Parietal cortex
Left Postcentral gyrus -34 -42 58 9.89
Temporal cortex
Right Middle Temporal gyrus 44 -66 0 11.43
Left Middle Temporal gyrus -40 -68 4 9.29
Right Superior Temporal gyrus 66 -36 18 8.07
Occipital cortex
Superior Occipital cortex -24 -84 34 6.44
Superior Occipital cortex 26 -80 34 6.31
Cingulate cortex
Left Cingulate cortex -14 -24 40 8.87
Right Cingulate cortex 14 -22 44 5.98
Cerebellum
Cerebellum: lobule VI -12 -70 -20 5.48
Cerebellum: lobule VII 10 -74 -40 5.43
Cerebellum: lobule VI 32 -52 -26 5.00
Subcortical structures
Thalamus -14 -22 8 5.71
Stereotaxic coordinates in MNI space are reported in mm.
Appendix D: supplementary materials of Chapters 5 and 6.

113
TABLE D2: Regions activated for grasping execution.
Peak localization x y z t value
Frontal cortex
Right Superior Frontal gyrus 28 -6 66 13.84
Middle Frontal gyrus -34 42 26 6.21
Parietal cortex
Left Postcentral gyrus -42 -22 56 24.7
Temporal cortex
Middle Temporal gyrus -42 -74 6 18.4
Stereotaxic coordinates in MNI space are reported in mm.

114


![INDEX [paduaresearch.cab.unipd.it]paduaresearch.cab.unipd.it/3498/1/tesi3.pdf · 1. introduction 3 1.1 hydrogeophysics in hydrological systems 8 1.1.1 the saturated zone 8 1.1.2 the](https://static.fdocuments.in/doc/165x107/5f3a9f7144e7680c117a5f68/index-1-introduction-3-11-hydrogeophysics-in-hydrological-systems-8-111.jpg)

