
The Network of Innovators in Jena: An Application of ...ruffino/Letture SNA/Cantner - Jena...
29
Jenaer Schriften zur Wirtschaftswissenschaft The Network of Innovators in Jena: An Application of Social Network Analysis Uwe Cantner und Holger Graf 4/2004 Arbeits- und Diskussionspapiere der Wirtschaftswissenschaftlichen Fakultät der Friedrich-Schiller-Universität Jena ISSN 1611-1311 Herausgeber: Wirtschaftswissenschaftliche Fakultät Friedrich-Schiller-Universität Jena Carl-Zeiß-Str. 3, 07743 Jena www.wiwi.uni-jena.de Schriftleitung: Prof. Dr. Hans-Walter Lorenz [email protected] Prof. Dr. Armin Scholl [email protected]
Transcript of The Network of Innovators in Jena: An Application of ...ruffino/Letture SNA/Cantner - Jena...
Jenaer Schriften zur Wirtschaftswissenschaft
The Network of Innovators in Jena: An Application of Social Network
Analysis
Uwe Cantner und Holger Graf
4/2004
Arbeits- und Diskussionspapiere
der Wirtschaftswissenschaftlichen Fakultät
der Friedrich-Schiller-Universität Jena
ISSN 1611-1311
Herausgeber:
Wirtschaftswissenschaftliche Fakultät Friedrich-Schiller-Universität Jena Carl-Zeiß-Str. 3, 07743 Jena
www.wiwi.uni-jena.de
Schriftleitung:
Prof. Dr. Hans-Walter [email protected]
Prof. Dr. Armin [email protected]
The Network of Innovators in Jena: An Applicationof Social Network Analysis
Uwe Cantner∗ Holger Graf†‡
February 4, 2004
Abstract
We apply social network analysis methods to describe the evolution of theinnovator network of Jena, Germany in the period from 1995 to 2001. We findthis evolution to be directed towards an increasing focus on core competencies ofthe local innovation system. Further we analyze the network resulting from R&Dcooperations and explain - by means of network regression techniques - that thejob mobility of scientists and the technological overlap between the actors, ratherthan past cooperations, can best predict the resulting structure. We also observean increasing importance of the university while the former “Kombinate” beginto lose their prominent role.
Keywords: Innovator Networks; Network Regression; Local Innovation Systems; R&D Co-operation; Research University
JEL Classification: O31; L14; R11
1 Introduction
In large parts of the economy the process of innovation is characterized by interac-
tion between different actors. The fundamental idea behind this notion is collective
invention which is very idealistic in Allen’s (1983) pure and original sense but when
interpreted less strictly describes well what is at the core of the idea of local innova-
tion systems (LIS). In the literature we also find studies on user-producer relationships
(Lundvall 1992), university-industry relationships (Owen-Smith, Riccaboni, Pammolli,
and Powell 2002), and cooperative agreements between firms that belong to the same
sector (von Hippel 1987). Interaction within the process of innovation is held respon-
sible for a large part of new knowledge created by the actors as the mutual exchange
∗Friedrich-Schiller University, Jena, Economics Department†Friedrich-Schiller University, Jena, Economics Department‡Corresponding author: Friedrich-Schiller University, Jena, Economics Department, Carl-Zeiss-
Str. 3, D-07743 Jena, email: [email protected]
The Network of Innovators in Jena 2
of knowledge provides the most efficient way of learning and cross-fertilization. The
probability of interaction should be increasing in proximity between the actors. Prox-
imity might be defined in geographical as well as technological space. What both types
of proximity actually imply is social proximity, that is the probability to know who
might be a promising partner for mutual exchange and creation of knowledge.
We study the LIS of Jena, which stands out of the mass of communities in the
eastern part of Germany as a technologically and economically successful region (OECD
2001, Cantner, Helm, and Meckl 2003). We thereby restrict the analysis to geographical
proximity between the actors as being most relevant to foster interaction and thereby
learning. Within this LIS, we focus on the different role of technological and social
proximity.
Another focus of our work is on the determinants of the cooperative linkages. We
analyze the network resulting from R&D cooperation and explain - by means of net-
work regression techniques - that the job mobility of scientists and the technological
overlap between the actors, rather than past cooperation, can best explain the resulting
structure.
The paper proceeds as follows. In the next section we give a short introduction
to the methodology and the data used for the empirical analysis. In section 3 we
apply social network analysis methods and visualizations to describe the evolution of
the innovator network of Jena in the period from 1995 to 2001. Besides the overall
structure of the network we also investigate the change in relative positions of the core
network members. Section 4 concentrates on the explanation of cooperative linkages
between the actors. Finally, section 5 concludes the paper by summarizing and pointing
towards further research required.
2 Research methodology and data
2.1 Social network analysis
Social network analysis is a interdisciplinary methodology developed mainly by soci-
ologists and researchers in social psychology, further developed in collaboration with
mathematics, statistics, and computing that led to a rapid development of formal ana-
The Network of Innovators in Jena 3
lyzing techniques which made it an attractive tool for other disciplines like economics,
marketing or industrial engineering.
“[. . . ] social network analysis is based on an assumption of the importance
of relationships among interacting units.[. . . ] relations defined by linkages
among units are a fundamental component of network theories.”(Wassermann
and Faust 1994, p. 4)
There is a wide range of topics in economics, that employ methods of social network
analysis. Some recent examples include the work of Cowan and Jonard, who evaluate
the impact of the network structure on its performance by means of simulation (Cowan
and Jonard 2003a, Cowan and Jonard 2003b). Owen-Smith, Riccaboni, Pammolli,
and Powell (2002) compare the organization and structure of scientific research in the
United States and Europe by building networks of R&D cooperation. Breschi and
Lissoni (2003) as well as Singh (2003) expand the study of Jaffe, Trajtenberg, and
Henderson (1993) and find that social proximity has the stronger relevance for the
degree of knowledge spillovers than geographical proximity.1
2.2 Data
The following example should provide the reader with a short introduction to the
methodology and our data setup. For more details, please refer to the widely cited
book by Wassermann and Faust (1994). Since we use patent data it is natural to use
a small number of patents as the raw data for our example given in table 1. On each
patent you find information about the assignee(s), let us call them innovator, which is
usually a firm or public research laboratory, but might also be an individual. You also
find the actual inventor(s), i.e. the people who generated the knowledge that has been
patented as well as the technological classification of the patent.
If one wishes to build a network of innovators where a linkage between the assignees
A1 and A2 result from people having worked for both of them, one has to generate the
incidence matrix I, where the rows are the assignees and the columns represent the
1Another example is the work of Potts (2000), who places the existence and generation of linkages
between actors at the center of his evolutionary microeconomic theory.

The Network of Innovators in Jena 4
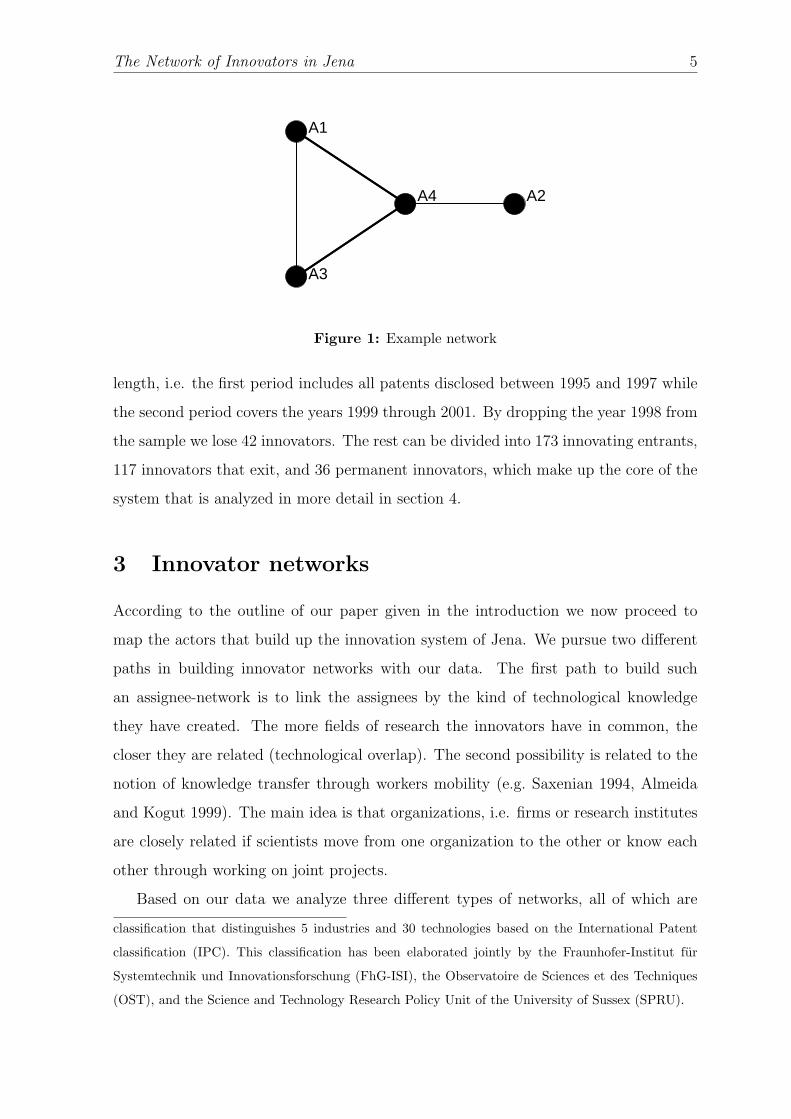
Table 1: Example raw data
Patent Innovator Inventor Class
P1 A1 I1, I4 1
P2 A2 I2 2
P3 A3 I3, I4 2
P4 A4 I1, I4 1
P5 A4 I2, I3 2
P6 A4 I5 2
inventors. Inventors are then the common “events” of the innovators.
I =
1 0 0 1 0
0 1 0 0 0
0 0 1 1 0
1 1 1 1 1
The square matrix that indicates the number of linkages aij between Ai and Aj,
is called the adjacency matrix A, which is computed as the product of I with its
transposed.
A = II ′ =
− 0 1 2
0 − 0 1
1 0 − 2
2 1 2 −
Since I4 has worked both for A1(i14 = 1) and A3(i34 = 1), there is a linkage between
A1 and A3, indicated by a13 = 1. The graphical or network representation of A is then
given in figure 1.
We use data on patents that were applied for at the German Patent Office and
were disclosed between 1995 and 2001. To include all patents that are relevant for
Jena as an innovation system we filtered out all patents where at least one of the
inventors named on the patent had their residence in Jena at the time of application.
Altogether we could identify 368 distinct assignees holding 1181 patents in 29 out of
the 30 technologies2, employing 1888 inventors (1113 of which resided in Jena). To
investigate the dynamics of the networks we split the sample into two periods of equal
2For the technological aggregation, patents have been classified according to a technology-oriented
The Network of Innovators in Jena 5
A1
A2
A3
A4
Figure 1: Example network
length, i.e. the first period includes all patents disclosed between 1995 and 1997 while
the second period covers the years 1999 through 2001. By dropping the year 1998 from
the sample we lose 42 innovators. The rest can be divided into 173 innovating entrants,
117 innovators that exit, and 36 permanent innovators, which make up the core of the
system that is analyzed in more detail in section 4.
3 Innovator networks
According to the outline of our paper given in the introduction we now proceed to
map the actors that build up the innovation system of Jena. We pursue two different
paths in building innovator networks with our data. The first path to build such
an assignee-network is to link the assignees by the kind of technological knowledge
they have created. The more fields of research the innovators have in common, the
closer they are related (technological overlap). The second possibility is related to the
notion of knowledge transfer through workers mobility (e.g. Saxenian 1994, Almeida
and Kogut 1999). The main idea is that organizations, i.e. firms or research institutes
are closely related if scientists move from one organization to the other or know each
other through working on joint projects.
Based on our data we analyze three different types of networks, all of which are
classification that distinguishes 5 industries and 30 technologies based on the International Patent
classification (IPC). This classification has been elaborated jointly by the Fraunhofer-Institut fur
Systemtechnik und Innovationsforschung (FhG-ISI), the Observatoire de Sciences et des Techniques
(OST), and the Science and Technology Research Policy Unit of the University of Sussex (SPRU).
The Network of Innovators in Jena 6
built for the two consecutive periods (1995-1997 and 1999-2001):
Technological overlap: Linkages between assignees are formed whenever they patent
in the same technological class. This network can be interpreted as the potential
for cooperation.
Cooperation: When there is more than one assignee mentioned on a patent, there
are linkages between all co-assignees.
Scientist mobility: In our database, the inventors who actually generated the knowl-
edge for the patent are mentioned. Whenever a specific inventor is mentioned
on (non cooperative) patents assigned by distinct assignees a link between those
assignees is formed, since the inventor has worked for both.
3.1 The innovator network based on technological overlap
Innovators can be specialized in a certain field of knowledge or instead be diversified.
Building a network where innovators are connected by the overlap in technological
interest we would expect diversified actors forming the center of the network, whereas
the specialized innovators are positioned in the periphery. This exercise serves three
purposes. First, it gives us a picture of the structure of the innovation system in
different time periods. Are the innovators all focussing on the same technologies or
do we see several specialized groups of firms that form clusters in the periphery of
the network? Second, we can identify the innovators in the center and the periphery,
thereby investigating the roles of particular actors. Third, this type of network can be
viewed as the potential for innovators to cooperate since the connected firms share a
common knowledge base, a topic that will be addressed in section 4.
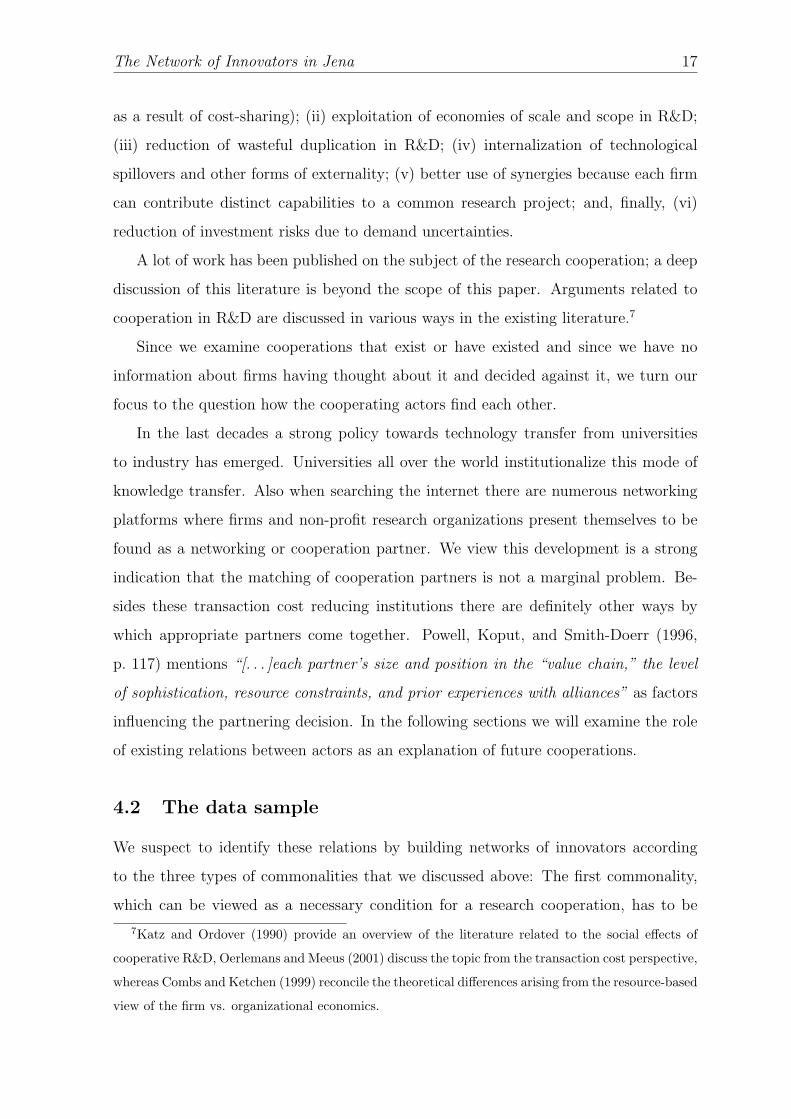
Figure 2 visualizes the Jena network of innovators, where nodes are patent assignees
and edges result from an overlap in at least two technologies3.4
It comes as no surprise, that the larger innovators form the center of these networks.
Jenapharm is the only exception, being a specialized firm in pharmaceuticals. Carl Zeiss
3This restriction is only used for visualization of the network.4The network visualization for this and the following figures was performed using NetDraw as
implemented in UCINET 6 software and multidimensional scaling with node repulsion and equal edge
length bias as layout.
The Network of Innovators in Jena 7
Technological overlap 1995-1997
Ahlers
CarlZeissJena
FSUJena
FhG
Groeber
HKIIPHT
JENOPTIK
JENOPTIKTechnologie
Jenapharm
LDTGmbH&Co.
Max-Planck
Technological overlap 1999-2001
4D-Vision
Agfa-GevaertAG
Ahlers
AnalytikJenaAG
Asclepion-MeditecAG
CarlZeissJena
FSUJena
FhG
GESO
HKI
HermsdorferInstitut
IMB
IPHT
JENOPTIK
Jenapharm
LDTGmbH&Co.
LeicaMSJena
Martin
SchottGlas
SiemensAG
Streitenberger
TUIlmenau
Figure 2: Potential for cooperation in Jena. Nodes are patent assignees irrespective oforganizational form, edges between A and B result from holding patents inat least two common technologies. The size of a node is determined by thenumber of patents granted, the width of an edge is related to the number ofoverlapping technologies. Isolated innovators are not displayed for reasons oflucidity.
The Network of Innovators in Jena 8
Jena and Jenoptik are the successors of the former VEB Carl Zeiss which dominated
the economic structure of Jena during the socialist era in the GDR. This VEB was a
highly differentiated “Kombinat”, i.e. integrated firm and already by visual inspection
we see that they move towards the periphery of the network as they follow a strategy
of higher specialization. The University (FSU) on the other hand moves towards the
center of the network and covers the broadest range of research fields in the second
period5.
We do not observe any clear cut cluster formation within Jena for either period, it
rather seems that the core has become denser while small innovators position them-
selves in the same types of technologies as the core. Even though we applied equal
time spans for the division of the data, the size of the network almost doubles from
25 innovators6, that have at least two technologies in common, to 48 innovators in the
second period.
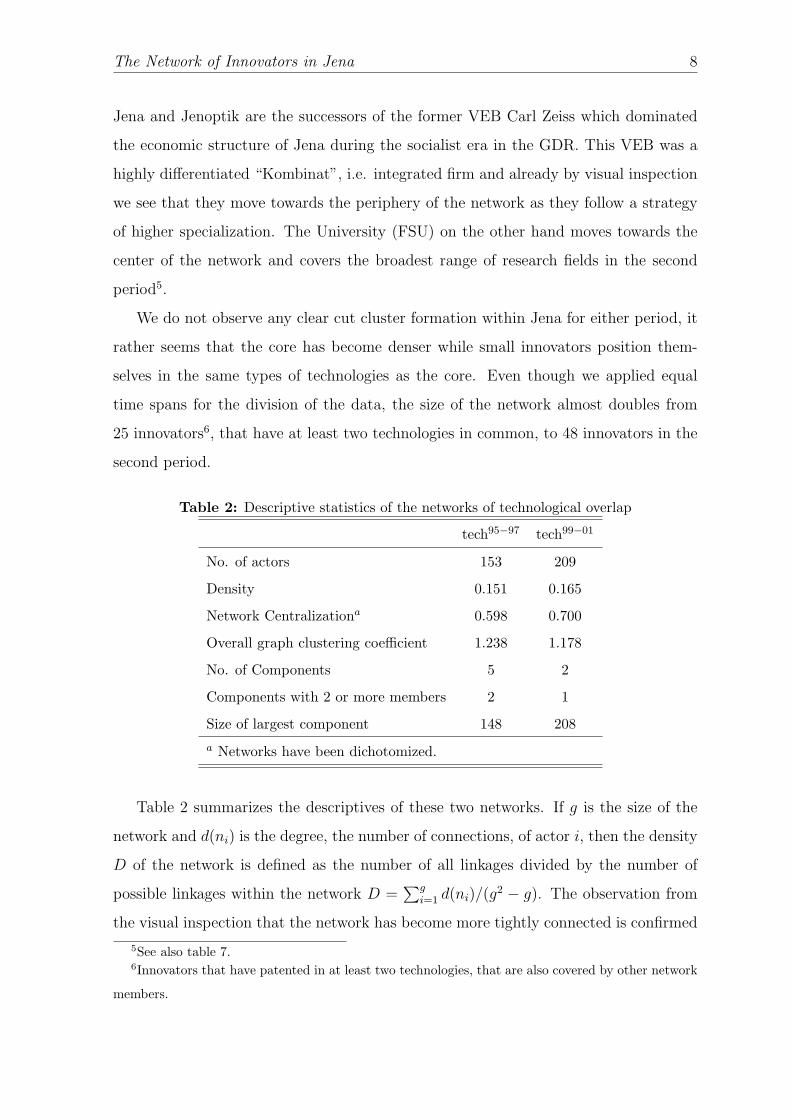
Table 2: Descriptive statistics of the networks of technological overlap
tech95−97 tech99−01
No. of actors 153 209
Density 0.151 0.165
Network Centralizationa 0.598 0.700
Overall graph clustering coefficient 1.238 1.178
No. of Components 5 2
Components with 2 or more members 2 1
Size of largest component 148 208
a Networks have been dichotomized.
Table 2 summarizes the descriptives of these two networks. If g is the size of the
network and d(ni) is the degree, the number of connections, of actor i, then the density
D of the network is defined as the number of all linkages divided by the number of
possible linkages within the network D =∑g
i=1 d(ni)/(g2 − g). The observation from
the visual inspection that the network has become more tightly connected is confirmed
5See also table 7.6Innovators that have patented in at least two technologies, that are also covered by other network
members.
The Network of Innovators in Jena 9
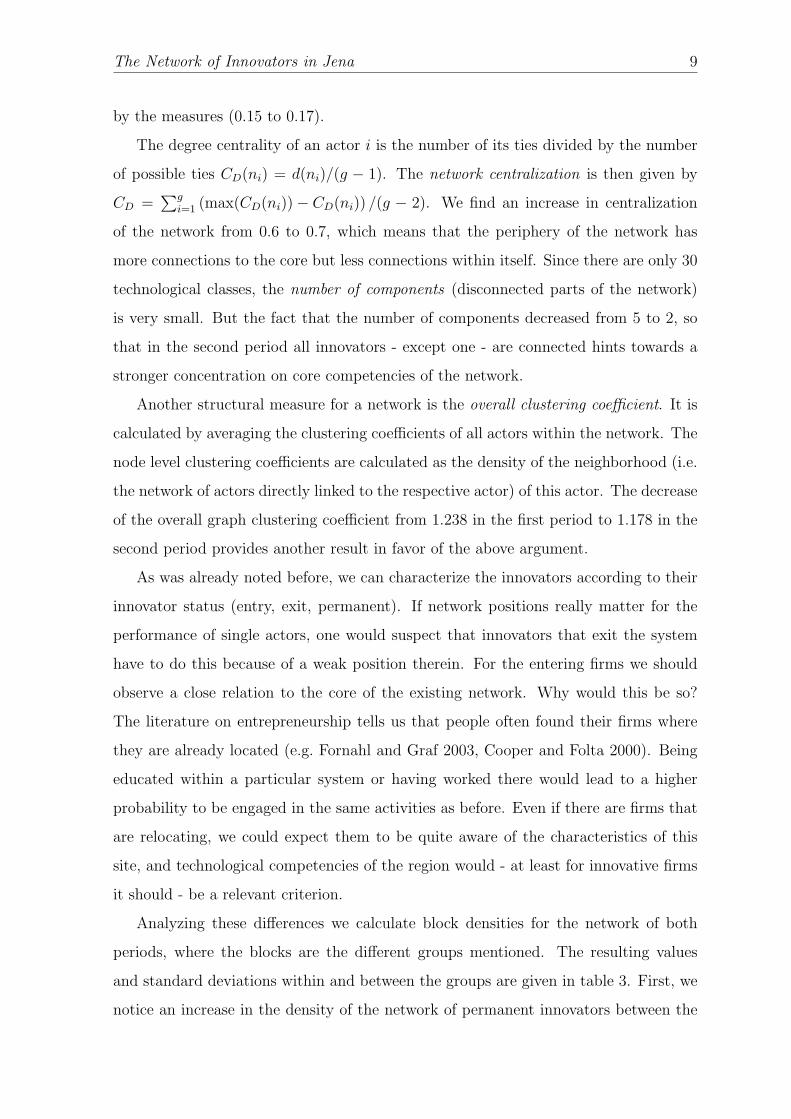
by the measures (0.15 to 0.17).
The degree centrality of an actor i is the number of its ties divided by the number
of possible ties CD(ni) = d(ni)/(g − 1). The network centralization is then given by
CD =∑g
i=1 (max(CD(ni))− CD(ni)) /(g − 2). We find an increase in centralization
of the network from 0.6 to 0.7, which means that the periphery of the network has
more connections to the core but less connections within itself. Since there are only 30
technological classes, the number of components (disconnected parts of the network)
is very small. But the fact that the number of components decreased from 5 to 2, so
that in the second period all innovators - except one - are connected hints towards a
stronger concentration on core competencies of the network.
Another structural measure for a network is the overall clustering coefficient. It is
calculated by averaging the clustering coefficients of all actors within the network. The
node level clustering coefficients are calculated as the density of the neighborhood (i.e.
the network of actors directly linked to the respective actor) of this actor. The decrease
of the overall graph clustering coefficient from 1.238 in the first period to 1.178 in the
second period provides another result in favor of the above argument.
As was already noted before, we can characterize the innovators according to their
innovator status (entry, exit, permanent). If network positions really matter for the
performance of single actors, one would suspect that innovators that exit the system
have to do this because of a weak position therein. For the entering firms we should
observe a close relation to the core of the existing network. Why would this be so?
The literature on entrepreneurship tells us that people often found their firms where
they are already located (e.g. Fornahl and Graf 2003, Cooper and Folta 2000). Being
educated within a particular system or having worked there would lead to a higher
probability to be engaged in the same activities as before. Even if there are firms that
are relocating, we could expect them to be quite aware of the characteristics of this
site, and technological competencies of the region would - at least for innovative firms
it should - be a relevant criterion.
Analyzing these differences we calculate block densities for the network of both
periods, where the blocks are the different groups mentioned. The resulting values
and standard deviations within and between the groups are given in table 3. First, we
notice an increase in the density of the network of permanent innovators between the
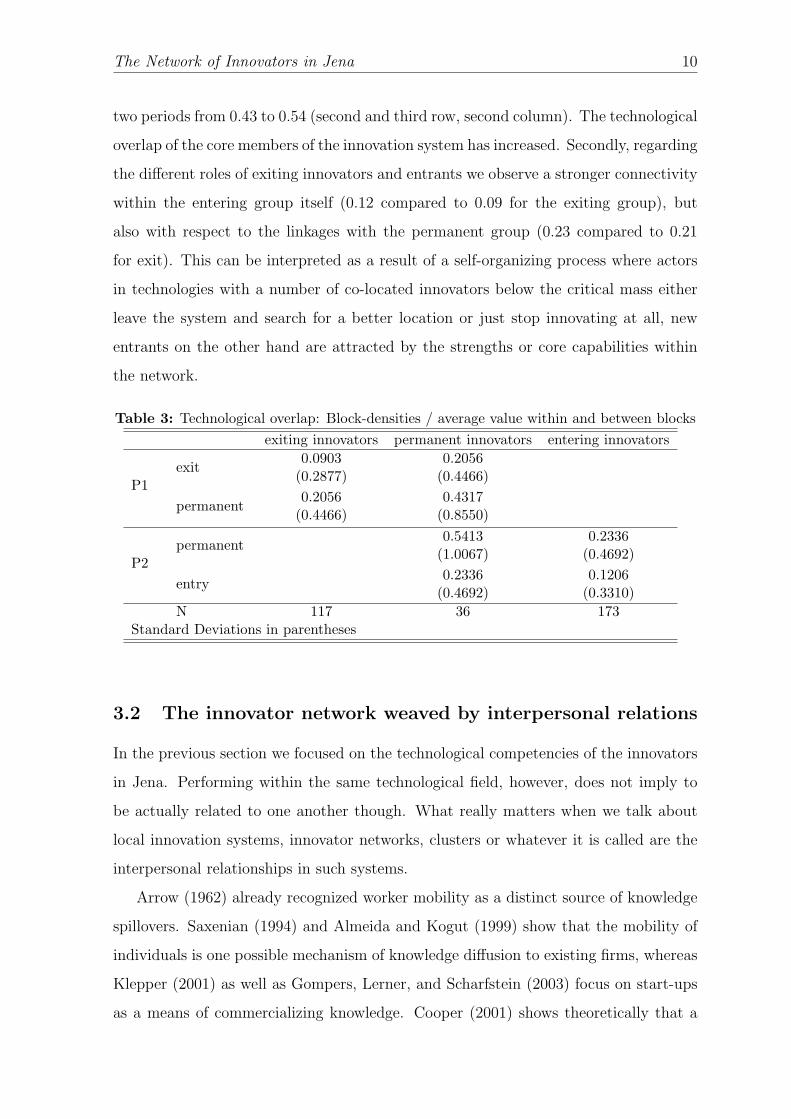
The Network of Innovators in Jena 10
two periods from 0.43 to 0.54 (second and third row, second column). The technological
overlap of the core members of the innovation system has increased. Secondly, regarding
the different roles of exiting innovators and entrants we observe a stronger connectivity
within the entering group itself (0.12 compared to 0.09 for the exiting group), but
also with respect to the linkages with the permanent group (0.23 compared to 0.21
for exit). This can be interpreted as a result of a self-organizing process where actors
in technologies with a number of co-located innovators below the critical mass either
leave the system and search for a better location or just stop innovating at all, new
entrants on the other hand are attracted by the strengths or core capabilities within
the network.
Table 3: Technological overlap: Block-densities / average value within and between blocksexiting innovators permanent innovators entering innovators
P1exit
0.0903 0.2056(0.2877) (0.4466)
permanent0.2056 0.4317
(0.4466) (0.8550)
P2permanent
0.5413 0.2336(1.0067) (0.4692)
entry0.2336 0.1206
(0.4692) (0.3310)N 117 36 173
Standard Deviations in parentheses
3.2 The innovator network weaved by interpersonal relations
In the previous section we focused on the technological competencies of the innovators
in Jena. Performing within the same technological field, however, does not imply to
be actually related to one another though. What really matters when we talk about
local innovation systems, innovator networks, clusters or whatever it is called are the
interpersonal relationships in such systems.
Arrow (1962) already recognized worker mobility as a distinct source of knowledge
spillovers. Saxenian (1994) and Almeida and Kogut (1999) show that the mobility of
individuals is one possible mechanism of knowledge diffusion to existing firms, whereas
Klepper (2001) as well as Gompers, Lerner, and Scharfstein (2003) focus on start-ups
as a means of commercializing knowledge. Cooper (2001) shows theoretically that a
The Network of Innovators in Jena 11
higher rate of job mobility corresponds to greater overall technological progress because
parts of the knowledge generated by the worker can be utilized by both firms involved.
Due to the data that we use, we have the possibility to analyze a network of inno-
vators that can be viewed as the lower barrier of actual relationships. On each patent
we find information about all the scientists and engineers that were involved in the
creation of the knowledge that led to this innovation (inventors). By creating an in-
cidence matrix where the assignees (innovators) are the nodes (rows) of the network
and the inventors on the patent are the characteristics (columns) of these innovators
we can identify those inventors that have worked on research projects for more than on
assignee, thereby creating linkages between these assignees. We assume that the more
scientists have worked for two distinct assignees, the closer the latter are related.
We can distinguish two different possibilities how this relationship is established.
The first way is by direct cooperation. Whenever we find a patent with more than
one assignee we assume it to be a cooperation. Of course, all the inventors on such a
patent are then a “common event” of all the assignees. We call the resulting network
cooperation. The other possibility is less direct. If an inventor is mentioned on patents
(which are not cooperative in the sense above) assigned by different innovators within
one of the two periods of observation (1995-1997 and 1999-2001) we end up with a link
between those innovators that we call scientist mobility.
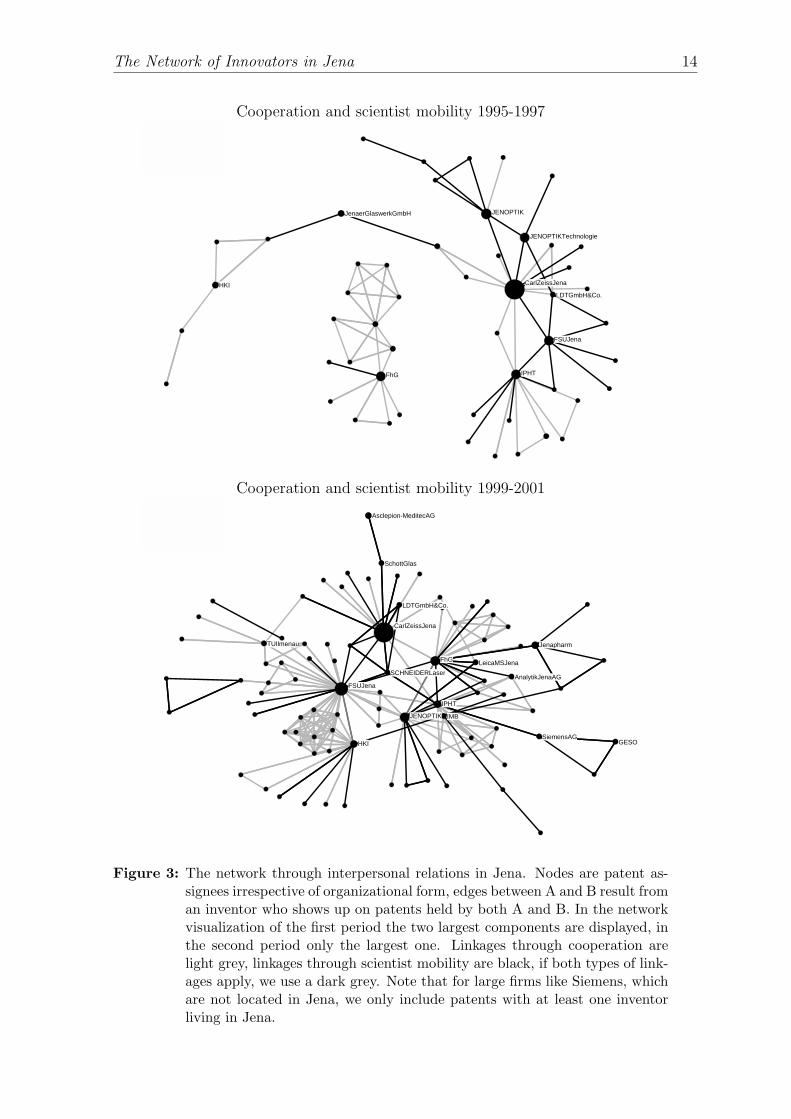
Besides the obvious increase in size of the visualized networks (figure 3) both types of
networks are characterized by a different evolution of the network structure. In table 4
we report the same statistics as in the last section for the networks of cooperation (cot),
scientist mobility (smt), and the network of personal relationships (prt) which does not
distinguish between the two former types of relations.
The density of the cooperation network decreases (0.026 to 0.022) while it increases
slightly for the scientist mobility network (0.004 to 0.005). The overall effect is domi-
nated by the effects of cooperation, which leads to a network of personal relationships
which is less connected in the second period (0.036 to 0.031). The overall network be-
comes more centralized (0.113 to 0.171), which is also due to the development in formal
cooperation (0.046 to 0.124) whereas centralization decreases in the scientist mobility
network (0.048 to 0.040). This network also shows a tendency towards stronger clus-
tering (0.638 to 0.885), which is opposite to the development for cooperation (3.835 to
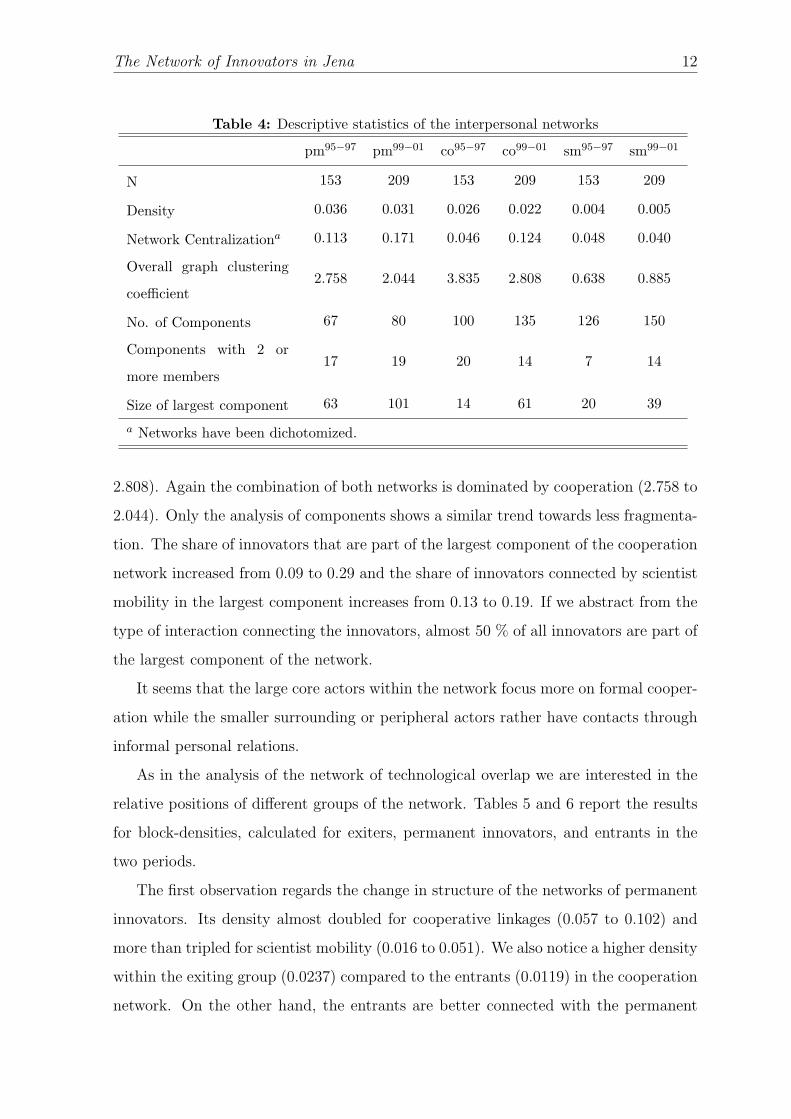
The Network of Innovators in Jena 12
Table 4: Descriptive statistics of the interpersonal networks
pm95−97 pm99−01 co95−97 co99−01 sm95−97 sm99−01
N 153 209 153 209 153 209
Density 0.036 0.031 0.026 0.022 0.004 0.005
Network Centralizationa 0.113 0.171 0.046 0.124 0.048 0.040
Overall graph clustering
coefficient2.758 2.044 3.835 2.808 0.638 0.885
No. of Components 67 80 100 135 126 150
Components with 2 or
more members17 19 20 14 7 14
Size of largest component 63 101 14 61 20 39
a Networks have been dichotomized.
2.808). Again the combination of both networks is dominated by cooperation (2.758 to
2.044). Only the analysis of components shows a similar trend towards less fragmenta-
tion. The share of innovators that are part of the largest component of the cooperation
network increased from 0.09 to 0.29 and the share of innovators connected by scientist
mobility in the largest component increases from 0.13 to 0.19. If we abstract from the
type of interaction connecting the innovators, almost 50 % of all innovators are part of
the largest component of the network.
It seems that the large core actors within the network focus more on formal cooper-
ation while the smaller surrounding or peripheral actors rather have contacts through
informal personal relations.
As in the analysis of the network of technological overlap we are interested in the
relative positions of different groups of the network. Tables 5 and 6 report the results
for block-densities, calculated for exiters, permanent innovators, and entrants in the
two periods.
The first observation regards the change in structure of the networks of permanent
innovators. Its density almost doubled for cooperative linkages (0.057 to 0.102) and
more than tripled for scientist mobility (0.016 to 0.051). We also notice a higher density
within the exiting group (0.0237) compared to the entrants (0.0119) in the cooperation
network. On the other hand, the entrants are better connected with the permanent
The Network of Innovators in Jena 13
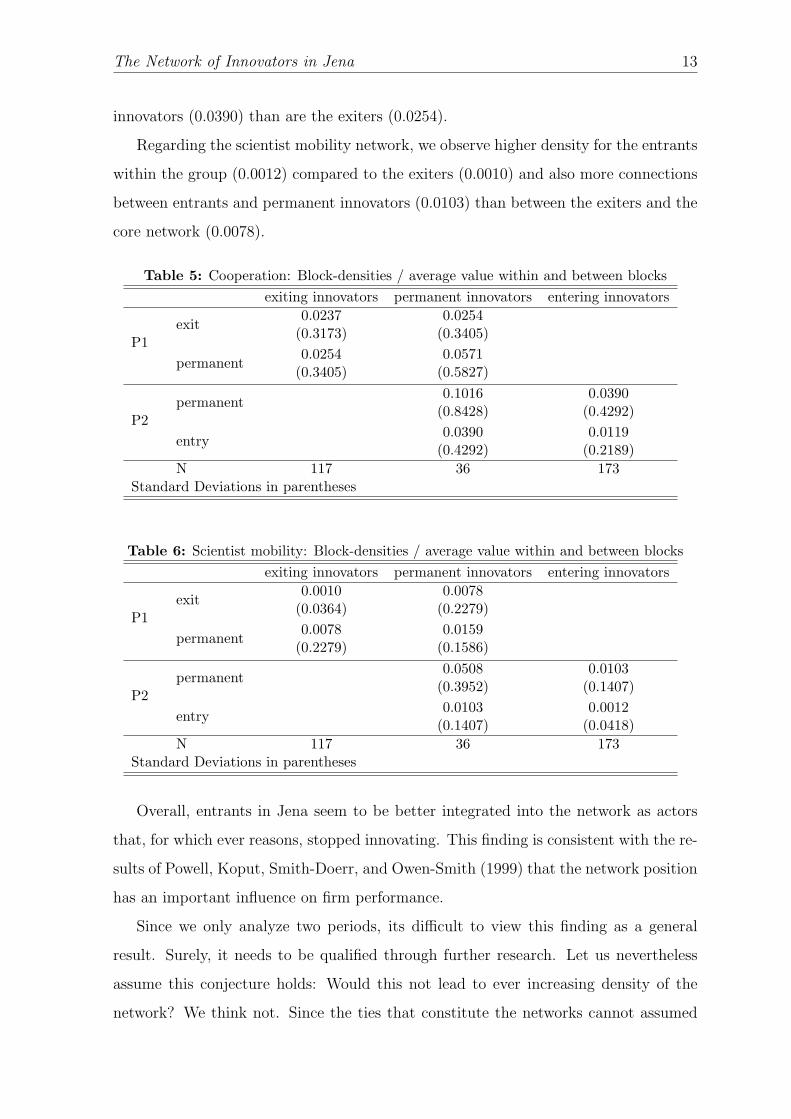
innovators (0.0390) than are the exiters (0.0254).
Regarding the scientist mobility network, we observe higher density for the entrants
within the group (0.0012) compared to the exiters (0.0010) and also more connections
between entrants and permanent innovators (0.0103) than between the exiters and the
core network (0.0078).
Table 5: Cooperation: Block-densities / average value within and between blocksexiting innovators permanent innovators entering innovators
P1exit
0.0237 0.0254(0.3173) (0.3405)
permanent0.0254 0.0571
(0.3405) (0.5827)
P2permanent
0.1016 0.0390(0.8428) (0.4292)
entry0.0390 0.0119
(0.4292) (0.2189)N 117 36 173
Standard Deviations in parentheses
Table 6: Scientist mobility: Block-densities / average value within and between blocksexiting innovators permanent innovators entering innovators
P1exit
0.0010 0.0078(0.0364) (0.2279)
permanent0.0078 0.0159
(0.2279) (0.1586)
P2permanent
0.0508 0.0103(0.3952) (0.1407)
entry0.0103 0.0012
(0.1407) (0.0418)N 117 36 173
Standard Deviations in parentheses
Overall, entrants in Jena seem to be better integrated into the network as actors
that, for which ever reasons, stopped innovating. This finding is consistent with the re-
sults of Powell, Koput, Smith-Doerr, and Owen-Smith (1999) that the network position
has an important influence on firm performance.
Since we only analyze two periods, its difficult to view this finding as a general
result. Surely, it needs to be qualified through further research. Let us nevertheless
assume this conjecture holds: Would this not lead to ever increasing density of the
network? We think not. Since the ties that constitute the networks cannot assumed
The Network of Innovators in Jena 14
Cooperation and scientist mobility 1995-1997
CarlZeissJena
FSUJena
FhG
HKI
IPHT
JENOPTIK
JENOPTIKTechnologie
JenaerGlaswerkGmbH
LDTGmbH&Co.
Cooperation and scientist mobility 1999-2001
AnalytikJenaAG
Asclepion-MeditecAG
CarlZeissJena
FSUJena
FhG
GESOHKI
IMB
IPHT
JENOPTIK
Jenapharm
LDTGmbH&Co.
LeicaMSJenaSCHNEIDERLaser
SchottGlas
SiemensAG
TUIlmenau
Figure 3: The network through interpersonal relations in Jena. Nodes are patent as-signees irrespective of organizational form, edges between A and B result froman inventor who shows up on patents held by both A and B. In the networkvisualization of the first period the two largest components are displayed, inthe second period only the largest one. Linkages through cooperation arelight grey, linkages through scientist mobility are black, if both types of link-ages apply, we use a dark grey. Note that for large firms like Siemens, whichare not located in Jena, we only include patents with at least one inventorliving in Jena.
The Network of Innovators in Jena 15
to be persistent over very long periods of time, it might well be that formerly well
connected actors become more isolated over time, therefore becoming a candidate for
subsequent exit.
3.3 The core network members
The last two sections provided a description of the network as a whole. Now we
will focus on the role of the core network members. To measure the importance of
single actors, social network theory employs several measures for centrality. We use
degree centrality, explained above, and the betweenness of an actor, i. It is defined
as CB(ni) =∑
j<kgjk(ni)
gjk,∀i 6= j, k, where gjk is the number of geodesics linking j
and k and gjk(ni) is the number of geodesics from j to k that pass through i. Con-
ceptually, high-betweenness vertices lie on a large number of non-redundant shortest
paths between other vertices; they can thus be thought of as “bridges” or “boundary
spanners.”
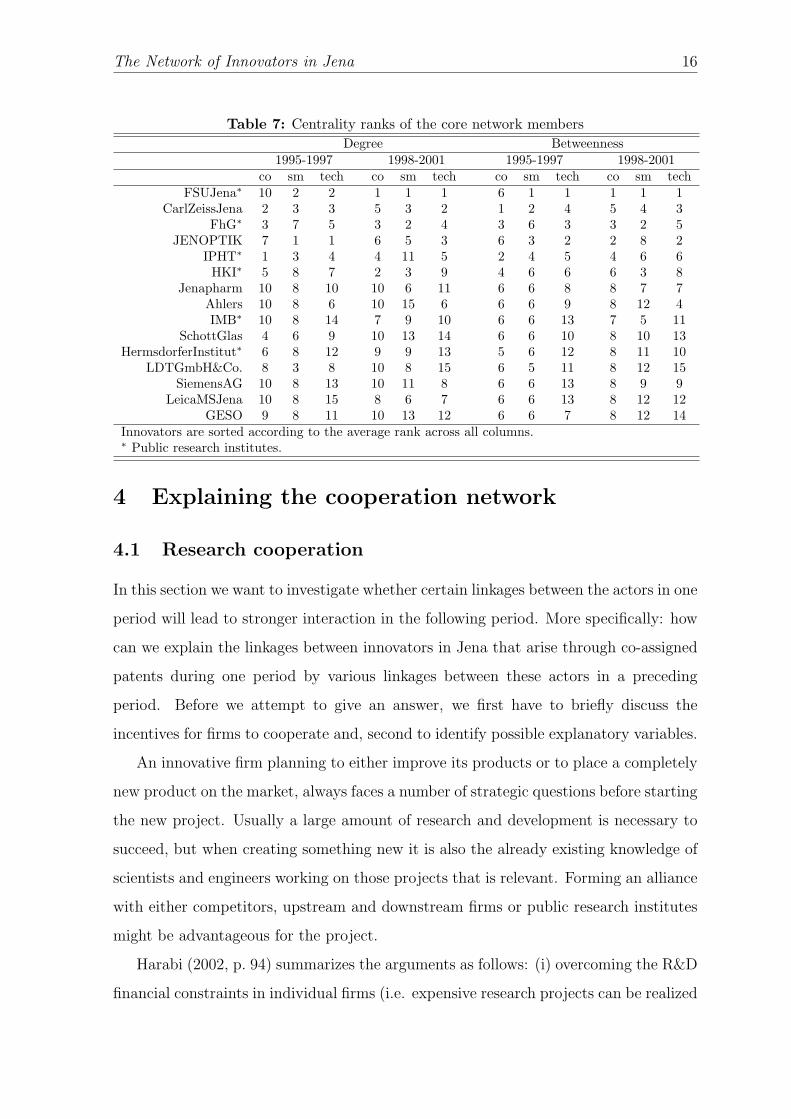
In table 7 we report the ranking of the innovators according to these centrality
measures for the 15 innovators that were most active in both periods. For reasons of
clarity we only present the rank scores on degree and betweenness centrality within
the three different types of networks (cooperation, scientist mobility, and technological
overlap), separate for each period.
The first observation is that the local innovation system is clearly dominated by
public research institutions (marked with an asterisk) and the large successors of the
VEB Carl Zeiss (Jenoptik and Carl Zeiss Jena). Secondly we notice the centrality of
the three actors within the top 15 that are not located in Jena (Hermsdorfer Insti-
tut, Siemens AG and LDT GmbH & Co.) to be decreasing over time. Finally, the
university of Jena (FSU) can strengthen its position and is top ranked in all types
of networks of the second period. Especially the betweenness measures indicate that
the university plays the central role in mediating between the local actors. The FSU
is central within the technology based network, meaning that it covers the knowledge
fields most important for the region. It is the central partner for research cooperations
and for the transfer of knowledge to the private sector via scientists.
The Network of Innovators in Jena 16
Table 7: Centrality ranks of the core network membersDegree Betweenness
1995-1997 1998-2001 1995-1997 1998-2001co sm tech co sm tech co sm tech co sm tech
FSUJena∗ 10 2 2 1 1 1 6 1 1 1 1 1CarlZeissJena 2 3 3 5 3 2 1 2 4 5 4 3
FhG∗ 3 7 5 3 2 4 3 6 3 3 2 5JENOPTIK 7 1 1 6 5 3 6 3 2 2 8 2
IPHT∗ 1 3 4 4 11 5 2 4 5 4 6 6HKI∗ 5 8 7 2 3 9 4 6 6 6 3 8
Jenapharm 10 8 10 10 6 11 6 6 8 8 7 7Ahlers 10 8 6 10 15 6 6 6 9 8 12 4IMB∗ 10 8 14 7 9 10 6 6 13 7 5 11
SchottGlas 4 6 9 10 13 14 6 6 10 8 10 13HermsdorferInstitut∗ 6 8 12 9 9 13 5 6 12 8 11 10
LDTGmbH&Co. 8 3 8 10 8 15 6 5 11 8 12 15SiemensAG 10 8 13 10 11 8 6 6 13 8 9 9
LeicaMSJena 10 8 15 8 6 7 6 6 13 8 12 12GESO 9 8 11 10 13 12 6 6 7 8 12 14
Innovators are sorted according to the average rank across all columns.∗ Public research institutes.
4 Explaining the cooperation network
4.1 Research cooperation
In this section we want to investigate whether certain linkages between the actors in one
period will lead to stronger interaction in the following period. More specifically: how
can we explain the linkages between innovators in Jena that arise through co-assigned
patents during one period by various linkages between these actors in a preceding
period. Before we attempt to give an answer, we first have to briefly discuss the
incentives for firms to cooperate and, second to identify possible explanatory variables.
An innovative firm planning to either improve its products or to place a completely
new product on the market, always faces a number of strategic questions before starting
the new project. Usually a large amount of research and development is necessary to
succeed, but when creating something new it is also the already existing knowledge of
scientists and engineers working on those projects that is relevant. Forming an alliance
with either competitors, upstream and downstream firms or public research institutes
might be advantageous for the project.
Harabi (2002, p. 94) summarizes the arguments as follows: (i) overcoming the R&D
financial constraints in individual firms (i.e. expensive research projects can be realized
The Network of Innovators in Jena 17
as a result of cost-sharing); (ii) exploitation of economies of scale and scope in R&D;
(iii) reduction of wasteful duplication in R&D; (iv) internalization of technological
spillovers and other forms of externality; (v) better use of synergies because each firm
can contribute distinct capabilities to a common research project; and, finally, (vi)
reduction of investment risks due to demand uncertainties.
A lot of work has been published on the subject of the research cooperation; a deep
discussion of this literature is beyond the scope of this paper. Arguments related to
cooperation in R&D are discussed in various ways in the existing literature.7
Since we examine cooperations that exist or have existed and since we have no
information about firms having thought about it and decided against it, we turn our
focus to the question how the cooperating actors find each other.
In the last decades a strong policy towards technology transfer from universities
to industry has emerged. Universities all over the world institutionalize this mode of
knowledge transfer. Also when searching the internet there are numerous networking
platforms where firms and non-profit research organizations present themselves to be
found as a networking or cooperation partner. We view this development is a strong
indication that the matching of cooperation partners is not a marginal problem. Be-
sides these transaction cost reducing institutions there are definitely other ways by
which appropriate partners come together. Powell, Koput, and Smith-Doerr (1996,
p. 117) mentions “[. . . ]each partner’s size and position in the “value chain,” the level
of sophistication, resource constraints, and prior experiences with alliances” as factors
influencing the partnering decision. In the following sections we will examine the role
of existing relations between actors as an explanation of future cooperations.
4.2 The data sample
We suspect to identify these relations by building networks of innovators according
to the three types of commonalities that we discussed above: The first commonality,
which can be viewed as a necessary condition for a research cooperation, has to be
7Katz and Ordover (1990) provide an overview of the literature related to the social effects of
cooperative R&D, Oerlemans and Meeus (2001) discuss the topic from the transaction cost perspective,
whereas Combs and Ketchen (1999) reconcile the theoretical differences arising from the resource-based
view of the firm vs. organizational economics.

The Network of Innovators in Jena 18
a common knowledge base. Even though research partners want to create something
new, they need to have an overlapping knowledge base to facilitate know-how exchange
and development, i.e. for cooperation to be mutually beneficial, the partners both
need the absorptive capacity to learn from each other (Cohen and Levinthal 1990). In
their empirical study on interfirm cooperation Mowery, Oxley, and Silverman (1998)
find strong evidence in favor of their hypothesis that joint venture partners display
a higher degree of technological overlap compared with non collaborators. We define
technological overlap as the number of technological classes in which two actors both
hold patents.8
When this condition is fulfilled the firm might approach someone with whom they
have successfully cooperated before. This is an idea of know-who on the institutional
level since researchers of the earlier cooperation have not to be involved directly. The
third commonality involves scientists that have worked for both companies or organi-
zations. Usually the contacts between colleagues are not terminated (at once) when
they change the job. Actually sometimes firms hire skilled people especially for their
contacts hoping to benefit from their networks.
We use the networks of permanent innovators for the regressions, i.e. the assignees
that patented in both periods of observation. This constraint decreases our sample
dramatically from 326 innovators, patenting in either of the two periods, to 36 perma-
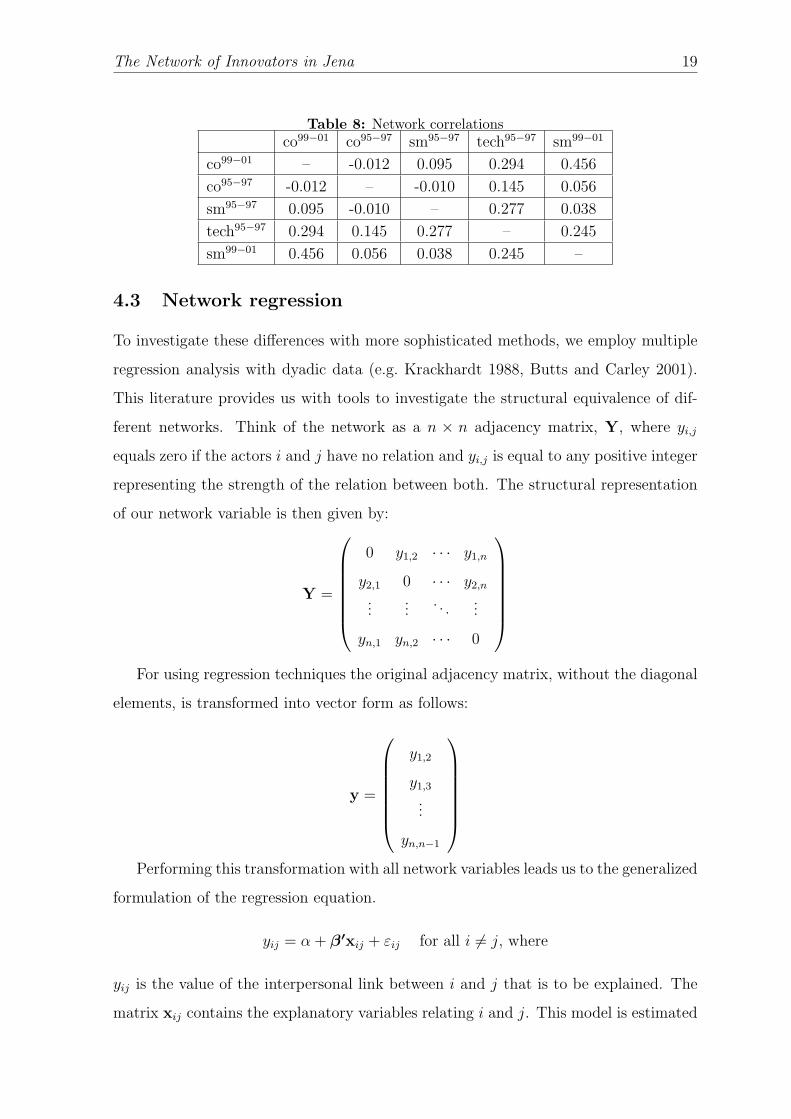
nent innovators in Jena. The correlations between the networks, as shown in table 8,
suggest that cooperation partners have overlapping technologies in the period before.
This result is not very surprising but table 8 also suggests that it is not the cooperations
between firms in the former period that determines who will cooperate in the second
period, but rather the linkages between the firms that result from the job mobility of
the scientists. Further we notice an increase of the correlation between technological
overlap and cooperation comparing the two periods. This is probably due to the fact
that overall cooperation activity has increased. Another result is that firms do not
seem to have both types of personal linkages in the same period. We observe almost
no correlation between sm95−97 and co95−97.
8This is a very simple measure of technological closeness, which has to be improved in subsequent
versions of this study.
The Network of Innovators in Jena 19
Table 8: Network correlationsco99−01 co95−97 sm95−97 tech95−97 sm99−01
co99−01 – -0.012 0.095 0.294 0.456
co95−97 -0.012 – -0.010 0.145 0.056
sm95−97 0.095 -0.010 – 0.277 0.038
tech95−97 0.294 0.145 0.277 – 0.245
sm99−01 0.456 0.056 0.038 0.245 –
4.3 Network regression
To investigate these differences with more sophisticated methods, we employ multiple
regression analysis with dyadic data (e.g. Krackhardt 1988, Butts and Carley 2001).
This literature provides us with tools to investigate the structural equivalence of dif-
ferent networks. Think of the network as a n × n adjacency matrix, Y, where yi,j
equals zero if the actors i and j have no relation and yi,j is equal to any positive integer
representing the strength of the relation between both. The structural representation
of our network variable is then given by:
Y =
0 y1,2 · · · y1,n
y2,1 0 · · · y2,n
......
. . ....
yn,1 yn,2 · · · 0
For using regression techniques the original adjacency matrix, without the diagonal
elements, is transformed into vector form as follows:
y =
y1,2
y1,3
...
yn,n−1
Performing this transformation with all network variables leads us to the generalized
formulation of the regression equation.
yij = α + β′xij + εij for all i 6= j, where
yij is the value of the interpersonal link between i and j that is to be explained. The
matrix xij contains the explanatory variables relating i and j. This model is estimated
The Network of Innovators in Jena 20
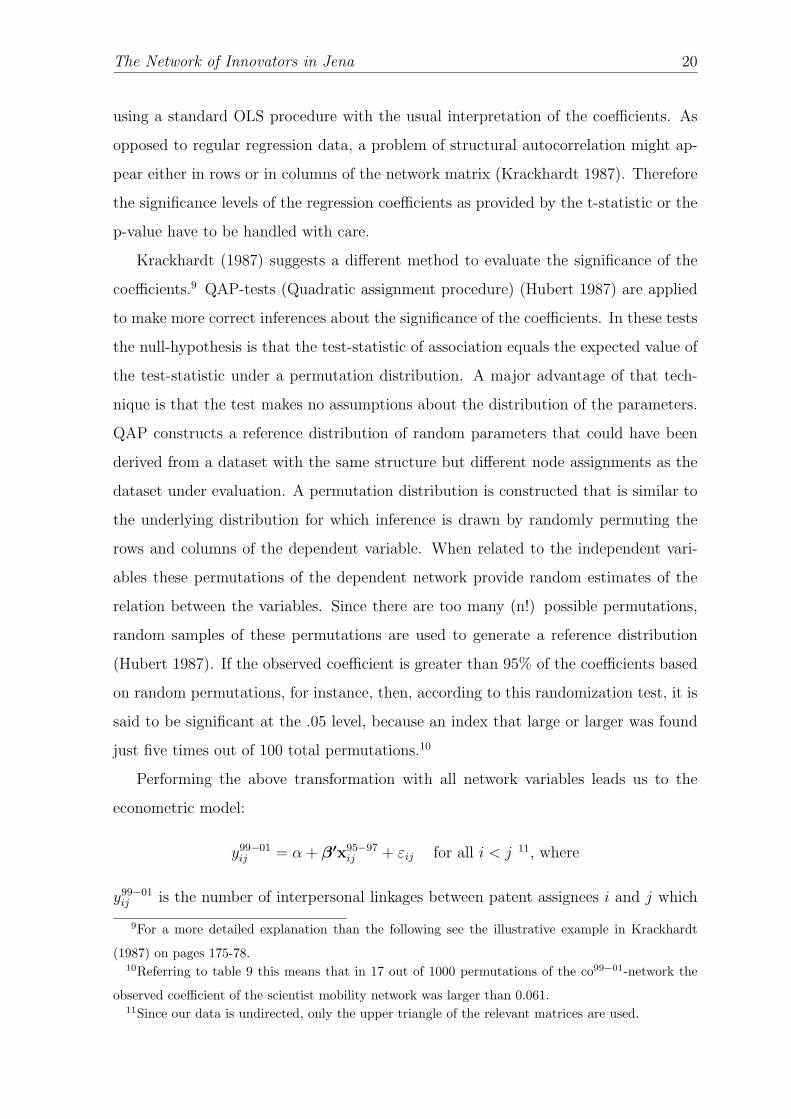
using a standard OLS procedure with the usual interpretation of the coefficients. As
opposed to regular regression data, a problem of structural autocorrelation might ap-
pear either in rows or in columns of the network matrix (Krackhardt 1987). Therefore
the significance levels of the regression coefficients as provided by the t-statistic or the
p-value have to be handled with care.
Krackhardt (1987) suggests a different method to evaluate the significance of the
coefficients.9 QAP-tests (Quadratic assignment procedure) (Hubert 1987) are applied
to make more correct inferences about the significance of the coefficients. In these tests
the null-hypothesis is that the test-statistic of association equals the expected value of
the test-statistic under a permutation distribution. A major advantage of that tech-
nique is that the test makes no assumptions about the distribution of the parameters.
QAP constructs a reference distribution of random parameters that could have been
derived from a dataset with the same structure but different node assignments as the
dataset under evaluation. A permutation distribution is constructed that is similar to
the underlying distribution for which inference is drawn by randomly permuting the
rows and columns of the dependent variable. When related to the independent vari-
ables these permutations of the dependent network provide random estimates of the
relation between the variables. Since there are too many (n!) possible permutations,
random samples of these permutations are used to generate a reference distribution
(Hubert 1987). If the observed coefficient is greater than 95% of the coefficients based
on random permutations, for instance, then, according to this randomization test, it is
said to be significant at the .05 level, because an index that large or larger was found
just five times out of 100 total permutations.10
Performing the above transformation with all network variables leads us to the
econometric model:
y99−01ij = α + β′x95−97
ij + εij for all i < j 11, where
y99−01ij is the number of interpersonal linkages between patent assignees i and j which
9For a more detailed explanation than the following see the illustrative example in Krackhardt
(1987) on pages 175-78.10Referring to table 9 this means that in 17 out of 1000 permutations of the co99−01-network the
observed coefficient of the scientist mobility network was larger than 0.061.11Since our data is undirected, only the upper triangle of the relevant matrices are used.
The Network of Innovators in Jena 21
result from a formal cooperation of both in the second period. The matrix x95−97ij
contains the explanatory variables from the first period, like cooperational linkages,
linkages through scientists mobility, and technological overlap between i and j. We
also include dummy variables for linkages between public funded research institutes
(uni) and private organizations (priv).
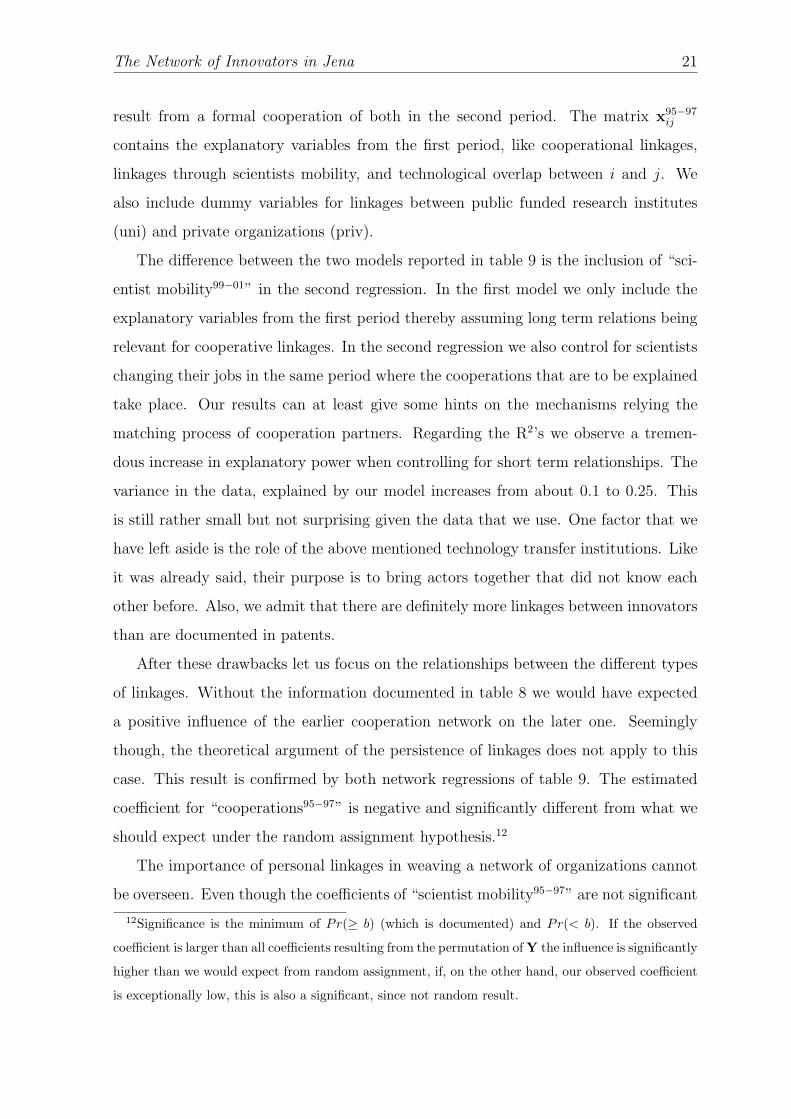
The difference between the two models reported in table 9 is the inclusion of “sci-
entist mobility99−01” in the second regression. In the first model we only include the
explanatory variables from the first period thereby assuming long term relations being
relevant for cooperative linkages. In the second regression we also control for scientists
changing their jobs in the same period where the cooperations that are to be explained
take place. Our results can at least give some hints on the mechanisms relying the
matching process of cooperation partners. Regarding the R2’s we observe a tremen-
dous increase in explanatory power when controlling for short term relationships. The
variance in the data, explained by our model increases from about 0.1 to 0.25. This
is still rather small but not surprising given the data that we use. One factor that we
have left aside is the role of the above mentioned technology transfer institutions. Like
it was already said, their purpose is to bring actors together that did not know each
other before. Also, we admit that there are definitely more linkages between innovators
than are documented in patents.
After these drawbacks let us focus on the relationships between the different types
of linkages. Without the information documented in table 8 we would have expected
a positive influence of the earlier cooperation network on the later one. Seemingly
though, the theoretical argument of the persistence of linkages does not apply to this
case. This result is confirmed by both network regressions of table 9. The estimated
coefficient for “cooperations95−97” is negative and significantly different from what we
should expect under the random assignment hypothesis.12
The importance of personal linkages in weaving a network of organizations cannot
be overseen. Even though the coefficients of “scientist mobility95−97” are not significant
12Significance is the minimum of Pr(≥ b) (which is documented) and Pr(< b). If the observed
coefficient is larger than all coefficients resulting from the permutation of Y the influence is significantly
higher than we would expect from random assignment, if, on the other hand, our observed coefficient
is exceptionally low, this is also a significant, since not random result.
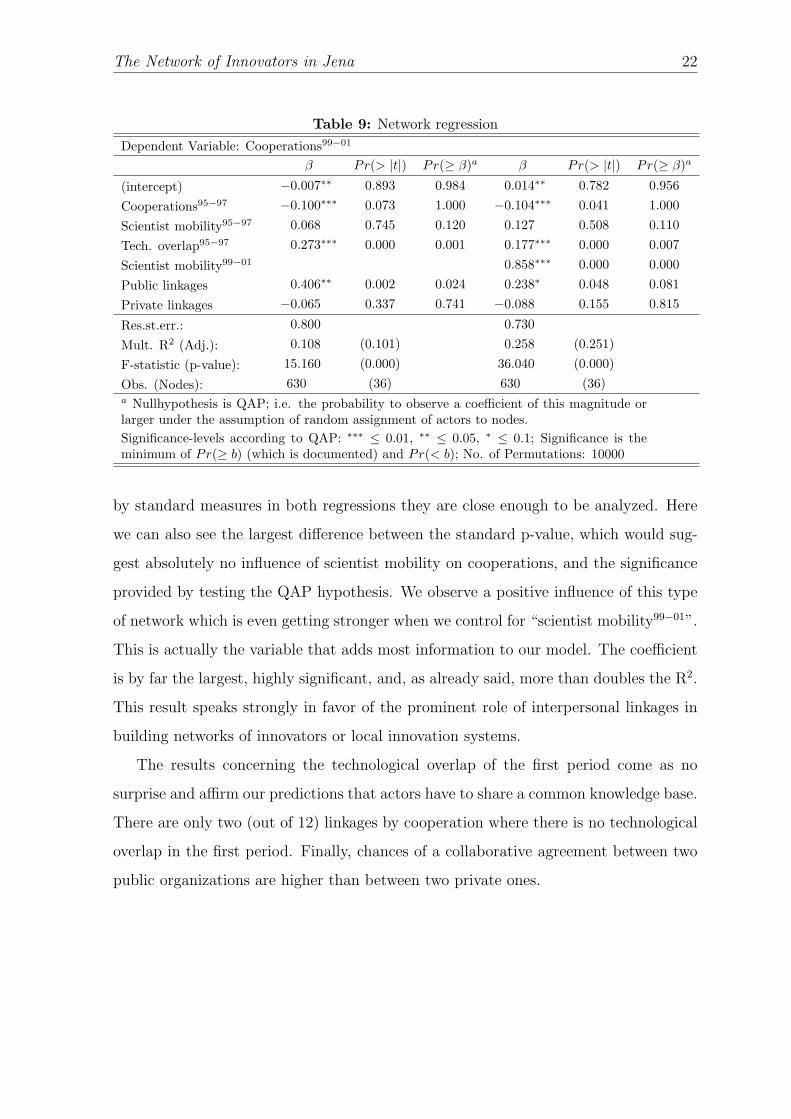
The Network of Innovators in Jena 22
Table 9: Network regressionDependent Variable: Cooperations99−01
β Pr(> |t|) Pr(≥ β)a β Pr(> |t|) Pr(≥ β)a
(intercept) −0.007∗∗ 0.893 0.984 0.014∗∗ 0.782 0.956
Cooperations95−97 −0.100∗∗∗ 0.073 1.000 −0.104∗∗∗ 0.041 1.000
Scientist mobility95−97 0.068 0.745 0.120 0.127 0.508 0.110
Tech. overlap95−97 0.273∗∗∗ 0.000 0.001 0.177∗∗∗ 0.000 0.007
Scientist mobility99−01 0.858∗∗∗ 0.000 0.000
Public linkages 0.406∗∗ 0.002 0.024 0.238∗ 0.048 0.081
Private linkages −0.065 0.337 0.741 −0.088 0.155 0.815
Res.st.err.: 0.800 0.730
Mult. R2 (Adj.): 0.108 (0.101) 0.258 (0.251)
F-statistic (p-value): 15.160 (0.000) 36.040 (0.000)
Obs. (Nodes): 630 (36) 630 (36)a Nullhypothesis is QAP; i.e. the probability to observe a coefficient of this magnitude orlarger under the assumption of random assignment of actors to nodes.Significance-levels according to QAP: ∗∗∗ ≤ 0.01, ∗∗ ≤ 0.05, ∗ ≤ 0.1; Significance is theminimum of Pr(≥ b) (which is documented) and Pr(< b); No. of Permutations: 10000
by standard measures in both regressions they are close enough to be analyzed. Here
we can also see the largest difference between the standard p-value, which would sug-
gest absolutely no influence of scientist mobility on cooperations, and the significance
provided by testing the QAP hypothesis. We observe a positive influence of this type
of network which is even getting stronger when we control for “scientist mobility99−01”.
This is actually the variable that adds most information to our model. The coefficient
is by far the largest, highly significant, and, as already said, more than doubles the R2.
This result speaks strongly in favor of the prominent role of interpersonal linkages in
building networks of innovators or local innovation systems.
The results concerning the technological overlap of the first period come as no
surprise and affirm our predictions that actors have to share a common knowledge base.
There are only two (out of 12) linkages by cooperation where there is no technological
overlap in the first period. Finally, chances of a collaborative agreement between two
public organizations are higher than between two private ones.
The Network of Innovators in Jena 23
5 Concluding remarks
We performed a case study on the local innovation system of Jena. The analysis
of the network of technological overlap leads us to conclude that the dynamics of
the system is directed towards an increasing focus on core competencies of the local
innovation system; i.e. innovators on the periphery of the network exit and new entrants
position themselves closer to the core of the network. Thus, new innovators and exiting
innovators in Jena have shown to be different regarding their network positions. From
this we presume that a critical mass of innovators is necessary for a specific technology
to “survive” within a LIS. A success-breeds-success mechanism on the level of the
technology will then lead to an increasing specialization of the LIS in these technologies.
The same dynamics regarding the network positions of entering and exiting innovators
are observed when analyzing the cooperation and scientist mobility networks. Other
studies of this type will have to find evidence in favor of the hypothesis that network
positions are a crucial factor in explaining the innovative performance of the actors.
It has been suggested that the partnering in R&D cooperation is a problem for
firms and has even led to political intervention. We showed that personal relationships
that arise through the job mobility of scientists are an important variable in explaining
the formation of cooperation networks. Our result, that a dominating firm is losing its
position to the local university is regarded as a specificity that might be typical to the
transformation process in east Germany.
Acknowledgements: We thank the participants of the 3rd ETE - Workshop at
IDEFI in Sophia Antipolis (January 29-30, 2004) for helpful comments. Graphical
network representations were performed using NetDraw, as included in UCINET 6
(Borgatti, Everett, and Freeman 2002). Network regressions and structural variables
were calculated using the sna-package by Carter T. Butts for R statistical software and
UCINET 6.
References
Allen, R. C. (1983): “Collective invention,” Journal of Economic Behaviour andOrganization, 4, 1–24.
The Network of Innovators in Jena 24
Almeida, P., and B. Kogut (1999): “The Localization of Knowledge and the Mo-bility of Engineers in Regional Networks,” Management Science, 45(7), 905–917.
Arrow, K. J. (1962): “Economic Welfare and the Allocation of Resources for In-vention,” in The Rate and Direction of Innovative Activity: Economic and SocialFactors, ed. by R. Nelson, pp. 609–25. Princeton University Press, Princeton.
Borgatti, S., M. Everett, and L. Freeman (2002): Ucinet for Windows: Soft-ware for Social Network Analysis. Analytic Technologies, Harvard.
Breschi, S., and F. Lissoni (2003): “Mobility and Social Networks: LocalisedKnowledge Spillovers Revisited,” CESPRI Working Paper, No. 142, March 2003.
Butts, C., and K. Carley (2001): “Multivariate Methods for Interstructural Anal-ysis,” CASOS working paper, Carnegie Mellon University.
Cantner, U., R. Helm, and R. Meckl (2003): Strukturen und Strategien in einemInnovationssystem: Das Beispiel Jena. Verlag Wissenschaft & Praxis, Sternenfels.
Cohen, W. M., and D. A. Levinthal (1990): “Absorptive capacity: A new per-spective on learning and innovation,” Administrative Science Quarterly, 35, 128–152.
Combs, J. G., and D. J. Ketchen (1999): “Explaining inter-firm co-operation andperformance: Toward a reconciliation of predictions from the recource-based viewand organizational economics,” Strategic Management Journal, 20, 867–888.
Cooper, A. C., and T. B. Folta (2000): “Entrepreneurship and high-technologyclusters,” in The Blackwell Handbook of Entrepreneurship, ed. by D. L. Sexton, andH. Landstrom, pp. 348–367. Blackwell, Oxford.
Cooper, D. P. (2001): “Innovation and reciprocal externalities: information trans-mission via job mobility,” Journal of Economic Behavior and Organization, 45(4),403–425.
Cowan, R., and N. Jonard (2003a): “The dynamics of collective invention,” Journalof Economic Behavior and Organization, 52(4), 513–532.
(2003b): “Invention on a Network,” forthcoming, Structural Change andEconomic Dynamics.
Fornahl, D., and H. Graf (2003): “Standortfaktoren und Grundungsaktivitatenin Jena,” Strukturen und Strategien in einem Innovationssystem: Das Beispiel Jena,pp. 97–123.
Gompers, P., J. Lerner, and D. Scharfstein (2003): “Entrepreneurial Spawn-ing: Public Corporations and the Genesis of New Ventures, 1986-1999,” HarvardNOM Working Paper No. 03-37; MIT Sloan Working Paper No. 4317-03 (June 2003).
Harabi, N. (2002): “The Impact of Vertical R&D Cooperation on Firm Innovation:An Empirical Investigation,” Economics of Innovation and New Technology, 11(2),93–108.
The Network of Innovators in Jena 25
Hubert, L. J. (1987): Assignment Methods in Combinatorial Data Analysis. MarcelDekker, INC., New York and Basel.
Jaffe, A. B., M. Trajtenberg, and R. Henderson (1993): “Geographic Lo-calization of Knowledge Spillovers as Evidenced by Patent Citations,” QuarterlyJournal of Economics, 108(3), 577–598.
Katz, M. L., and J. A. Ordover (1990): “R&D Cooperation and Competition,”Brookings Papers: Microeconomics, pp. 137–91.
Klepper, S. (2001): “Employee Startups in High-Tech Industries,” Industrial andCorporate Change, 10, 639–674.
Krackhardt, D. (1987): “QAP partialling as a test of spuriousness,” Social Net-works, 9, 171–186.
(1988): “Predicting with Networks: Nonparametric Multiple Regression Anal-ysis of Dyadic Data,” Social Networks, 10, 359–381.
Lundvall, B.-A. (1992): “User-Producer Relationships, National Systems of Innova-tion and Internationalisation,” in National Systems of Innovation: Towards a The-ory of Innovation and Interactive Learning, ed. by B.-A. Lundvall, pp. 45–67. PinterPublishers, London.
Mowery, D. C., J. E. Oxley, and B. S. Silverman (1998): “Technology overlapand interfirm cooperation: implications for the resource-based view of the firm,”Research Policy, 27(5), 507–23.
OECD (2001): Cities and regions in the new learning economy. OECD, Paris.
Oerlemans, L. A. G., and M. T. H. Meeus (2001): “R&D Cooperation in aTransaction Cost Perspective,” Review of Industrial Organization, 18, 77–90.
Owen-Smith, J., M. Riccaboni, F. Pammolli, and W. W. Powell (2002):“A Comparison of U.S. and European University-Industry Relations in the Life Sci-ences,” Management Science, 48(1), 24–43.
Potts, J. (2000): The New Evolutionary Microeconomics: Complexity, Competence,and Adaptive Behaviour. Edward Elgar, Cheltenham.
Powell, W. W., K. W. Koput, and L. Smith-Doerr (1996): “Interorganiza-tional collaboration and the locus of innovation: networks of learning in biotechnol-ogy,” Administrative Science Quarterly, 41(1), 116–145.
Powell, W. W., K. W. Koput, L. Smith-Doerr, and J. Owen-Smith (1999):“Network Position and Firm Performance: Organizational Returns to Collaborationin the Biotechnology Industry,” in Research in the Sociology of Organizations, ed.by S. B. Andrews, and D. Knoke, pp. 129–159. JAI Press, Greenwich, CT.
Saxenian, A. (1994): Regional Advantage. Harvard University Press, Cambridge.
Singh, J. (2003): “Social Networks as Drivers of Knowledge Diffusion,” HarvardUniversity, Mimeo.

The Network of Innovators in Jena 26
von Hippel, E. (1987): “Cooperation Between Rivals: Informal Know-How Trading,”Research Policy, 16, 291–302.
Wassermann, S., and K. Faust (1994): Social Network Analysis. Methods andApplications. Cambridge University Press, Cambridge.
Jenaer Schriften zur Wirtschaftswissenschaft
2004
1/2004 Uwe Cantner, Werner Güth, Andreas Nicklisch, Torsten Weiland: Competition in Innova-tion and Imitation - A Theoretical and Experimental Study -.
2/2004 Uwe Cantner und Andreas Freytag: Eliten, Wettbewerb und langer Atem - Ein praktikabler Vorschlag zur Schaffung von Eliteuniversitäten.
3/2004 Johannes Ruhland und Kathrin Kirchner (Hrsg.): Räumliche Datenbanken - Überblick und praktischer Einsatz in der Betriebswirtschaft.
4/2004 Uwe Cantner und Holger Graf: The Network of Innovators in Jena: An Application of Social Network Analysis.
2003
1/2003 Wolfgang Kürsten: Synergetische Merger, Co-Insurance und Shareholder Value, oder: Wer profitiert von "wertschaffenden" Fusionen? Erschienen in: Die Betriebswirtschaft 63 (2003), 239-256.
2/2003 Roland Helm, Laura Manthey, Armin Scholl und Michael Steiner: Empirical Evaluation of Preference Elicitation Techniques from Marketing and Decision Analysis.
3/2003 Wolfgang Kürsten: Grenzen und Reformbedarfe der Sicherheitsäquivalentmethode in der (traditionellen) Unternehmensbewertung. Erwiderung auf die Anmerkungen von Ralf Diedrich und Jörg Wiese in der ZfbF. Erschienen in: Zeitschrift für betriebswirtschaftliche Forschung 55 (2003), S. 306 – 314.
4/2003 Uwe Cantner und Holger Graf: Cooperation and Specialization in German Technology Regions.
5/2003 Jens J. Krüger: On the Dynamics of the U.S. Manufacturing Productivity Distribution.
6/2003 Uwe Cantner, Dirk Fornahl und Holger Graf: Innovationssystem und Gründungsgeschehen in Jena. Erste Erkenntnisse einer Unternehmensbefragung.
7/2003 Peter Kischka: Faktorzuweisungen im Rubin-Modell.
8/2003 Roland Helm, Reinhard Meckl, Manfred Strohmayer und Antje Bernau: Die Wissens-Scorecard als Basis eines anwendungsorientierten Ansatzes des Wissensmanagement.
9/2003 Jens J. Krüger: Productivity Dynamics Beyond-the-Mean in U.S. Manufacturing Industries - An Application of Quantile Regression.
10/2003 Reinhard Meckl, Antje Bernau und Roland Helm: Wissensmanagement und Kundenbezieh-ungen in internationalen Dienstleistungsunternehmen.
11/2003 Colette Friedrich und Simone Martin: Leiharbeitnehmer und Stammarbeitnehmer als Kon-kurrenten in Turnieren?
II
12/2003 Colette Friedrich und Simone Martin: Effizienzwirkungen - Ein Vergleich des Einsatzes von Leih- und Stammarbeitnehmern.
13/2003 Lutz Häselbarth und Armin Scholl: Dynamische Bestellmengenplanung für verderbliche Luxusgüter.
14/2003 Armin Scholl, Robert Klein und Lutz Häselbarth: Planung im Spannungsfeld zwischen Informationsdynamik und zeitlichen Interdependenzen.
15/2003 Roland Helm, Antje Mark und Lars-Johann Fischer: Qualitätskontrolle und Qualitätssignale in der Wirtschaftsprüfung – Eine empirische Evaluierung des Nutzens für Mandanten. Erschienen in: Die Wirtschaftsprüfung, 56. Jg., 2003, S. 1301-1309.
16/2003 Armin Scholl und Lutz Häselbarth: Bestellmengenplanung im zeitlich offenen Entschei-dungsfeld.
17/2003 Roland Helm and Martin Kloyer: Controlling Contractual Exchange Risks in R&D-Interfirm-Cooperation: An Empirical Study.
18/2003 Reinhard Haupt und Sandra Peterlein: Hochschule und Hochtechnologie: Jenaer For-schungspartnerschaften im Spiegel der Patentstatistik.
19/2003 Roland Helm und Rudolf C. Meiler: Intangible Ressourcen, strategische Ziele und Management interner Wissenspotenziale.
20/2003 Armin Scholl und Christian Becker: State-of-the-art exact and heuristic solution procedures for simple assembly line balancing.
21/2003 Christian Becker und Armin Scholl: A survey on problems and methods in generalized assembly line balancing.
22/2003 Armin Scholl und Christian Becker: A note on "An exact method for cost-oriented assembly line balancing".
23/2003 Roland Helm, Michael Steiner und Anett Peters: Ausmaß und Zusammensetzung der Vergütung des Aufsichtsrats mittelständischer, nicht börsennotierter Aktiengesellschaften: Eine empirische Bestandsaufnahme vor dem Hintergrund der Corporate Governance- Diskussion. Kurzfassung erschienen als: Vergütungsstrukturen des Aufsichtsrats mittelständischer, nicht börsennotierter Aktiengesellschaften, Der Betrieb 56 (2003), S. 2718-2723.
24/2003 Marcus Lange: Die Optimierung des Anspruchsumfangs im Rahmen der Patentanmeldung. Eine formaltheoretische Betrachtung.
25/2003 Martin Kloyer: Vergütungspräferenzen des F&E-Anbieters – Eine empirische Untersuchung.
26/2003 Johannes Ruhland und Thomas Wachsmuth (Hrsg.): Viertes Interuniversitäres Doktoran-denseminar Wirtschaftsinformatik - Dezember 2003.
27/2003 Roland Helm: Informationslücken im Entscheidungsprozess und Marktinformationen: Fehlerquellen in empirischen Studien und Konsequenzen für die Ableitung von Entscheidungen.
Weitere Informationen zu älteren Heften und Bezugsmöglichkeiten: www.wiwi.uni-jena.de