The Nene Management Catchment - CIRCABC - … The Nene Management Catchment Figure 1 - Swans on the...
61
1 The Nene Management Catchment Figure 1 - Swans on the River Nene at Fotheringhay, Northamptonshire A summary of information about the water environment in the Nene management catchment
Transcript of The Nene Management Catchment - CIRCABC - … The Nene Management Catchment Figure 1 - Swans on the...

1
The Nene Management Catchment
Figure 1 - Swans on the River Nene at Fotheringhay, Northamptonshire
A summary of information about the water environment in the Nene management catchment

2
We are the Environment Agency. We protect and improve the environment and make it a better place for people and wildlife. We operate at the place where environmental change has its greatest impact on people’s lives. We reduce the risks to people and properties from flooding; make sure there is enough water for people and wildlife; protect and improve air, land and water quality and apply the environmental standards within which industry can operate. Acting to reduce climate change and helping people and wildlife adapt to its consequences are at the heart of all that we do. We cannot do this alone. We work closely with a wide range of partners including government, business, local councils, other agencies, civil society groups and the communities we serve.
Published by:
Environment Agency Horizon House, Deanery Road, Bristol BS1 5AH Email: [email protected] www.gov.uk/environment-agency
© Environment Agency 2014
All rights reserved. This document may be reproduced with prior permission of the Environment Agency.
Further copies of this report are available on the e-consultation tool:
www.gov.uk/government/consultations/update-to-the-draft-river-basin-management-plans and via our National Customer Contact Centre: T: 03708 506506
Email: [email protected].

3
Contents The Nene Management Catchment ........................................................................... 1
Contents ..................................................................................................................... 3
1 Your views count ................................................................................................. 4
2 The Nene Management Catchment .................................................................... 7
2.1 Protected areas ............................................................................................ 8
2.2 Status of waters ........................................................................................... 9
2.3 Improvements to how water bodies are assessed ..................................... 10
2.4 Investigating the water environment in the Nene management catchment 11
2.5 Challenges and choices consultation 2013 ................................................ 12
2.6 Taking action in partnership ....................................................................... 13
2.7 Measures that could improve the water environment ................................. 14
2.8 Economic appraisal and environmental assessment of measures to improve the water environment .......................................................................................... 16
2.9 Proposed long term objectives ................................................................... 17
2.10 Links to other management plans .............................................................. 17
3 Operational catchments .................................................................................... 18
3.1 Upper Nene operational catchment ........................................................... 18
3.2 Brampton Branch operational catchment ................................................... 25
3.3 Ise operational catchment .......................................................................... 33
3.4 Middle Nene operational catchment ........................................................... 40
3.5 Willow Brook operational catchment .......................................................... 46
3.6 Lower Nene operational catchment ........................................................... 53
4 What do you think? ........................................................................................... 59
4.1 How to respond .......................................................................................... 59
4.2 What the Environment Agency will use the responses for ......................... 60
4.3 How the Environment Agency will use your information ............................ 60
4
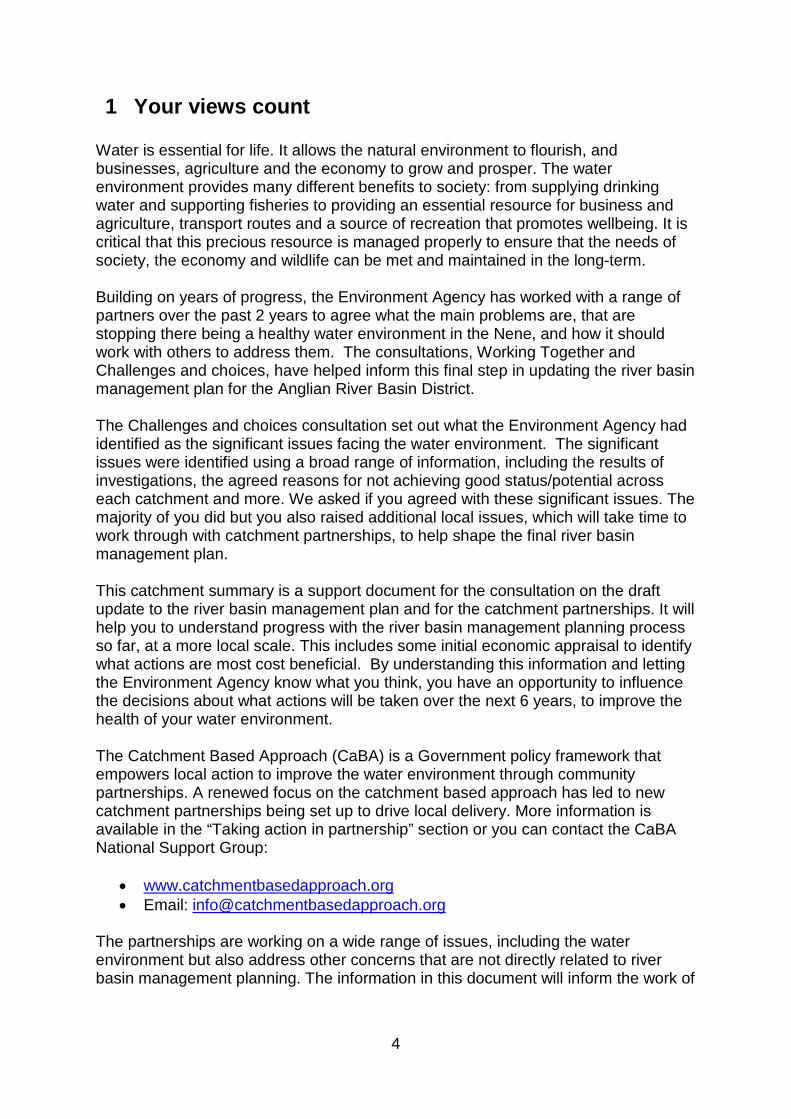
1 Your views count Water is essential for life. It allows the natural environment to flourish, and businesses, agriculture and the economy to grow and prosper. The water environment provides many different benefits to society: from supplying drinking water and supporting fisheries to providing an essential resource for business and agriculture, transport routes and a source of recreation that promotes wellbeing. It is critical that this precious resource is managed properly to ensure that the needs of society, the economy and wildlife can be met and maintained in the long-term. Building on years of progress, the Environment Agency has worked with a range of partners over the past 2 years to agree what the main problems are, that are stopping there being a healthy water environment in the Nene, and how it should work with others to address them. The consultations, Working Together and Challenges and choices, have helped inform this final step in updating the river basin management plan for the Anglian River Basin District. The Challenges and choices consultation set out what the Environment Agency had identified as the significant issues facing the water environment. The significant issues were identified using a broad range of information, including the results of investigations, the agreed reasons for not achieving good status/potential across each catchment and more. We asked if you agreed with these significant issues. The majority of you did but you also raised additional local issues, which will take time to work through with catchment partnerships, to help shape the final river basin management plan. This catchment summary is a support document for the consultation on the draft update to the river basin management plan and for the catchment partnerships. It will help you to understand progress with the river basin management planning process so far, at a more local scale. This includes some initial economic appraisal to identify what actions are most cost beneficial. By understanding this information and letting the Environment Agency know what you think, you have an opportunity to influence the decisions about what actions will be taken over the next 6 years, to improve the health of your water environment. The Catchment Based Approach (CaBA) is a Government policy framework that empowers local action to improve the water environment through community partnerships. A renewed focus on the catchment based approach has led to new catchment partnerships being set up to drive local delivery. More information is available in the “Taking action in partnership” section or you can contact the CaBA National Support Group:
• www.catchmentbasedapproach.org • Email: [email protected]
The partnerships are working on a wide range of issues, including the water environment but also address other concerns that are not directly related to river basin management planning. The information in this document will inform the work of

5
the River Nene Catchment Partnership in developing their vision, aims and priorities; it is not intended to duplicate or overarch the important local work. To view the consultation on the update to the Anglian river basin management plan, please visit https://consult.environment-agency.gov.uk/portal/ho/wfd/draft_plans/consult?pointId=s1405417862790#section-s1405417862790. This is a public consultation and we, the Environment Agency, welcome everyone's views Figure 2 shows the location of the Nene management catchment within the Anglian River Basin District. To help you get the most out of the information provided within this catchment summary, we have provided a glossary to explain some of the terms that are used. The glossary can be found on the e-consultation web pages. There are many ways to respond to this consultation (see section 4.1 How to respond for more details), but if you have any difficulties please call our National Customer Contact Centre on 03708 506 506 or email [email protected]. This consultation runs from October 2014 to April 2015. We will issue a response document in summer 2015. This will summarise the comments we received and what will happen as a result. The updated Anglian river basin management plan will be published in December 2015, following approval by the Secretary of State.

6
Figure 2 - Map of the Anglian River Basin District and the management catchments within it

7
2 The Nene Management Catchment
Figure 3 - Map of the Nene management catchment and the operational catchments within it
The River Nene rises near Daventry, flowing 169km to the Wash. It is the 10th longest river in the country. It passes through Northampton, becoming tidal below Peterborough before passing through Wisbech to the Wash. The Nene above Peterborough has a wide floodplain with gentle valley sides. Below Peterborough it becomes an embanked, straight river through the fens. It has significant tributaries in its catchment, which collect flows from Wellingborough, Kettering and Corby, amongst other urban areas. In the fens the North Level Main Drain and South Holland Main Drain are the principal tributaries. The Nene Washlands at Northampton and the Nene Washes below Peterborough are large areas of flood mitigation. It is a popular coarse fishery and is a well used navigable waterway, with 32 locks along its length. As a result the channel is highly modified. The Nene catchment is an important water resource for supplying Pitsford and Rutland Water reservoirs. It supplies water to the Ouse catchment and additional fen drains for agricultural use. Though much of the catchment is rural, with mixed arable and livestock uses above Peterborough, and arable and horticulture below in the fens, it is noted for containing the second largest growth area in the country, and the largest Enterprise Zone at Northampton.
8
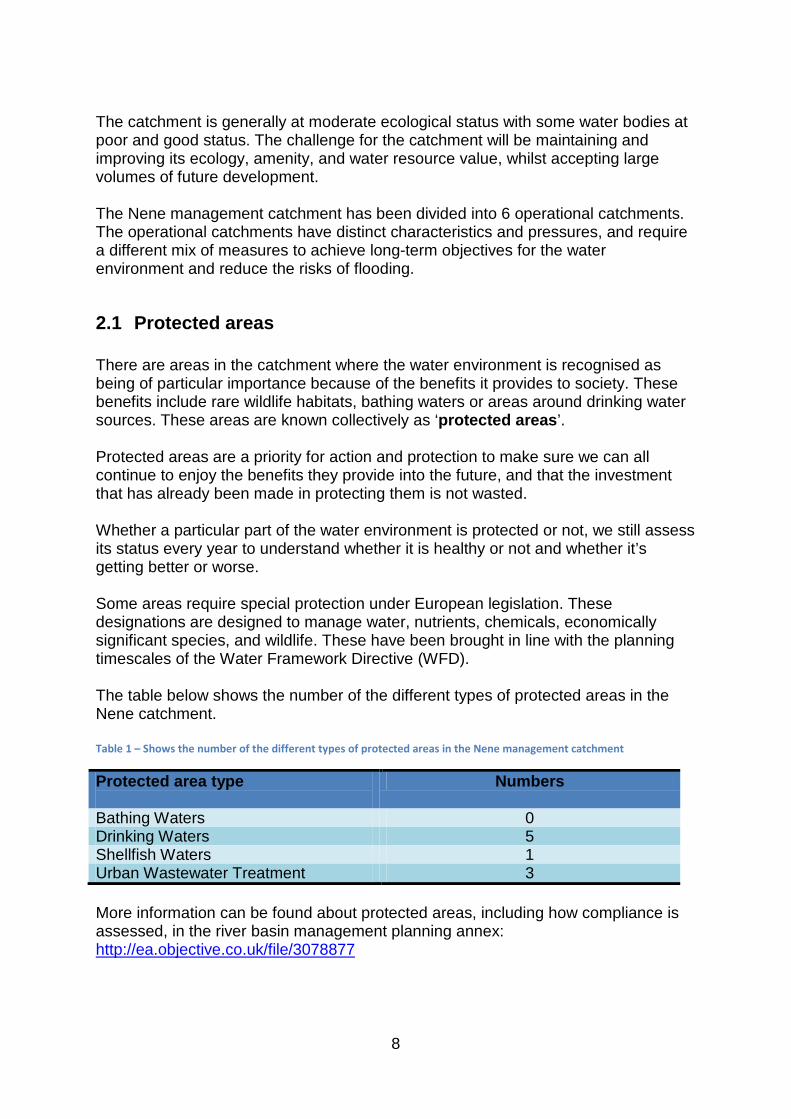
The catchment is generally at moderate ecological status with some water bodies at poor and good status. The challenge for the catchment will be maintaining and improving its ecology, amenity, and water resource value, whilst accepting large volumes of future development. The Nene management catchment has been divided into 6 operational catchments. The operational catchments have distinct characteristics and pressures, and require a different mix of measures to achieve long-term objectives for the water environment and reduce the risks of flooding.
2.1 Protected areas There are areas in the catchment where the water environment is recognised as being of particular importance because of the benefits it provides to society. These benefits include rare wildlife habitats, bathing waters or areas around drinking water sources. These areas are known collectively as ‘protected areas’. Protected areas are a priority for action and protection to make sure we can all continue to enjoy the benefits they provide into the future, and that the investment that has already been made in protecting them is not wasted. Whether a particular part of the water environment is protected or not, we still assess its status every year to understand whether it is healthy or not and whether it’s getting better or worse. Some areas require special protection under European legislation. These designations are designed to manage water, nutrients, chemicals, economically significant species, and wildlife. These have been brought in line with the planning timescales of the Water Framework Directive (WFD). The table below shows the number of the different types of protected areas in the Nene catchment. Table 1 – Shows the number of the different types of protected areas in the Nene management catchment
Protected area type
Numbers
Bathing Waters 0 Drinking Waters 5 Shellfish Waters 1 Urban Wastewater Treatment 3 More information can be found about protected areas, including how compliance is assessed, in the river basin management planning annex: http://ea.objective.co.uk/file/3078877

9
2.2 Status of waters In 2009 this catchment was divided up into 69 river water bodies, 4 lakes, 1 transitional water body, 2 canals and 3 groundwater bodies. We are proposing some changes to the way the catchment is divided up, which are described in more detail below. In 2009, 24% of water bodies were classified at good ecological status or better. Additional classification information by water body type can be found here: http://environment.data.gov.uk/catchment-planning/ Figure 4 shows the classification for the catchment’s surface waters in 2009, when the first river basin management plan was published, and the most recent (2013) status.
Figure 4 - Chart showing the classification of all water bodies in the Nene catchment in cycle 1
This consultation is concerned with the health of all the water in the Nene catchment, both surface water and groundwater. The absence of a sizeable principal groundwater body in the Nene catchment means secondary aquifers, such as the Northampton Sands, are locally important and used for small scale abstractions and supporting river flows. Groundwater resources are available in the secondary aquifers for consumptive use and the overall WFD status of that groundwater is good. The Nene becomes tidal below Peterborough, and is embanked across the fens to the Wash, which is itself an important wildlife resource and commercial shellfishery. The Nene catchment above Wansford is a Drinking Water Protected Area (DrWPA), to safeguard the public water supply at Rutland Water . Water is also abstracted at Duston, near Northampton to supply Pitsford Reservoir. The Nene catchment

10
DrWPA is at risk of failing precautionary drinking water standards due to certain herbicides and pesticides, principaly among these is metaldehyde. The Nene Catchment Sensitive Farming Partnership has a programme of measures aimed at improving awareness of the DrWPA; including workshops, and farm visits. Although there are 15500 ha of significant habitat in the catchment, more than 75% of this is deciduous woodland. The catchment does have the Upper Nene Valley Gravel Pits Special Protection Area, Pitsford Reservoir Site of Special Scientific Interest (SSSI), and the River Ise and Meadows SSSI is improving towards favourable status.
2.3 Improvements to how water bodies are assessed Improvements have been made to the way water bodies are defined and classified since the plans were published in 2009. Subject to consultation, the changes will be adopted when the updated plans are published in 2015. You can find more information about these improvements in the River basin management planning Annex at http://ea.objective.co.uk/file/3078877 The table below shows the status of the different kinds of water bodies in the management catchment based on these new approaches. Table 2 – Cycle 2 classification summary
Management Catchment
Numbers of water bodies at each status or potential in 2013 (using cycle 2 water bodies)
Water body type
High Good Moderate Poor Bad
Rivers & Canals (including Surface Water Transfers)
0 19 40 3 0
Lakes
0 0 3 1 0
Estuaries and Coastal waters (Transitional)
0 0 1 0 0
Groundwaters
- 2 - 1 -
For more information on the changes since cycle 1, please see section 4.3 ‘Changes since first cycle (new building blocks)’ within Part 2 (technical annex) of the RBMPs. (http://ea.objective.co.uk/file/3078877)

11
2.4 Investigating the water environment in the Nene management catchment
Since the initial assessment of status was made, the Environment Agency and its partners have been working to understand the reasons for not achieving good status/potential. Since 2009, the Environment Agency has carried out 229 investigations in the Nene catchment. These have helped to determine the reasons why water bodies are failing and the likely causes. High levels of phosphates and other nutrients affect the ecology in many of the watercourses within the Nene catchment. Discharges from sewage treatment works (STWs) and private sewage systems are a reason for this, alongside diffuse agricultural pollution. The main River Nene carries a considerable amount of treated effluent. Excessive weed growth on the main River Nene has an impact on the navigable waterway. Due to the number of towns and cities, urban run-off affects certain water bodies.
The Nene and many of its catchment water bodies have been over-straightened, and over deepened. The extent of historic river modification has affected habitat diversity in this catchment. Weirs and flood defence structures that act as obstacles to fish passage and a lack of in-channel habitat are examples of the challenges in the modified watercourses. Historic backwaters are an opportunity to provide mitigation to these issues.
Modifications to the morphology of the channels also exacerbate problems caused by siltation with sediments coming in from rural land use.
Invasive speices, specifically Signal Crayfish, effect a small number of water bodies at present, but pose a greater risk for the future.

12
Figure 5 - Chart showing the confirmed reasons for not achieving good status/potential of water bodies in the Nene catchment by type and source sector
All reasons for not achieving good status data are available on the catchment data explorer. As part of our work to understand the reasons for not achieving good status/potential we assigned a level of confidence to each of the reasons. With appropriate data and evidence we were able to confirm the reasons for not achieving good status/potential. For example, monitoring data from upstream and downstream of a sewage treatment works can be used to confirm that pollution from waste water is a significant factor affecting the ecological status. There are, however, further reasons for not achieving good status/potential that are more difficult to quantify and monitor. For example, our data can be used to illustrate the problems caused by sediment on the ecology within the river however identifying the source is more difficult. Where possible we have used modelling to help to identify sources but this has not been possible for all catchments. The graphs within this document only show the reasons for not achieving good status/potential that have been confirmed.
2.5 Challenges and choices consultation 2013 In 2013, through the Challenges and choices consultation, the Environment Agency asked for your views on:
• the significant issues that are limiting the benefits society obtains from the water environment (the challenges)
• the best way to address these issues and what should be done first (the choices)

13
The main issues raised were pollution; particularly diffuse rural and urban sources, physical modifications, invasive species and flows. It was considered that development provides a risk to water supplies. It was also suggested that as well as issues from structures in our rivers, the benefits of them in regulating river levels and alleviating flooding should also be mentioned. Raising awareness within communities about these issues and what can be done to improve rivers was considered to be important, with DrWPAs mentioned as an example. Education, and providing advice and guidance were seen as important. The benefits of an integrated approach were mentioned, for example, river restoration schemes that provide water quality improvements, flood protection, and benefits for wildlife. For further information on the responses submitted during the Challenges and choices consultation, please see the consultation response document here: https://consult.environment-agency.gov.uk/portal/ho/wfd/water/choices
2.6 Taking action in partnership In June 2013, the Department for Environment, Food and Rural Affairs (Defra) published a policy framework to encourage the wider adoption of an integrated catchment based approach to improving the quality of the water environment, which incorporated findings from the pilot phase. The objectives for the catchment based approach are:
• to deliver positive and sustained outcomes for the water environment by promoting a better understanding of the environment at a local level
• to encourage local collaboration and more transparent decision-making when both planning and delivering activities to improve the water environment
Adopting the approach will promote the development of more appropriate river basin management plans (which underpin the delivery of the objectives of the WFD) but will also provide a platform for engagement, discussion and decisions of much wider benefits including tackling diffuse agricultural and urban pollution, and widespread, historical alterations to the natural form of channels. The Environment Agency is a member of the River Nene Catchment Partnership, which is developing a plan to enhance the catchment. This summary has been informed by the partnership, both formally through the Challenges and choices consultation and through the ongoing work to develop measures to protect and improve the water environment. As well as shaping the updates to the river basin management plan, the results of this consultation will be used to inform the work of the partnership. The River Nene Regional Park (RNRP) is a Community Interest Company. The RNRP piloted a catchment based approach to inform and deliver WFD objectives alongside wider objectives and opportunities, as one of 10 DEFRA sponsored pilots

14
across the country. Hosted by Northamptonshire County Council, the RNRP has a wide ranging stakeholder group. The RNRP has produced the River Nene Integrated Catchment Management Plan, covering the River Nene catchment from Northamptonshire through to Peterborough. The plan arises from implementation of the WFD, but provides a means of addressing the opportunities and challenges facing the Nene in a co-ordinated, strategic way. The plan launched in June 2014 and the inaugural meeting of the Nene Catchment Partnership was held in July 2014. The Nene Valley Nature Improvement Area Partnership has operated since 2012. It aims to create more and better connected habitats over large areas in the Nene Valley, providing space for wildlife to thrive and adapt to climate change. Stakeholders have come together to enable strategic, joined up approaches to tackling these issues, realising the partnership ambition of step-change in the delivery of nature conservation in the Nene Valley. One objective is to improve the ecological status of the river.
We are focussed heavily on turning our measures into live projects within the Nene Catchment. We have worked, and continue to work, in partnership with a number of private, public and charitable organisations to achieve environmental benefit. Where possible, we are aiming to bring together environmental, social and economic outcomes to achieve integrated improvement in our local area. Together with our other stakeholders we have spent a significant amount of money and time in the Nene Catchment on projects including changing the morphology of our rivers, catchment sensitive farming initiatives, tackling diffuse pollution from rural and urban sources, and helping to remove or adapt barriers to fish movement. Some of these projects are listed below, and we will continue to work with others to identify and achieve the needs of the Water Framework Directive (WFD) in the Catchment. Current and completed on-going projects:
• Greening the river through Peterborough - River Nene Regional Park • ‘Eel Alley’ Improvements, Orton - Environment Agency • Harpers Brook Single Phosphate Issue Project - National Farmers Union • Duston Mill Channel Improvements - Environment Agency • Nene Catchment Sensitive Farming Partnership - Natural England / River
Nene Regional Park
2.7 Measures that could improve the water environment Where a failure has been identified, a range of measures have been assessed that would be needed to improve the status of water bodies. The Environment Agency has made an assessment of the measures needed to achieve positive benefits for the water environment and society. The measures have been grouped together to ensure the cumulative catchment effect is considered.

15
Where possible, climate resilient measures have been chosen. However it is considered unlikely that the measures will be sufficient to address all impacts of climate change and we will be assessing the likely gaps before the publication of the final river basin management plans: https://consult.environment-agency.gov.uk/portal/ho/wfd/draft_plans/consult?pointId=s1405417862790#section-s1405417862790. As well as the measures needed to improve the status of water bodies, other measures are needed to:
• protect or improve protected areas within the management catchment • prevent water bodies deteriorating from their current status
Some of these measures will benefit more than 1 water body or catchment and some are very specific. The cumulative effect and benefits of measures for the operational catchment have been considered. The measures proposed for this catchment are:
Table 3 – Proposed measures in the Nene management catchment
Improve modified physical habitats • Removal or easement of barriers to fish migration
• Removal or modification of engineering structure
• Improvement to condition of channel/bed and/or banks/shoreline
• Improvement to condition of riparian zone and /or wetland habitats
• Vegetation management
Managing pollution from waste water • Reduce point source pollution pathways (i.e. control entry to the water environment)
• Mitigate/remediate point source impacts on receptor
• Reduce point source pollution at source
Manage pollution from towns, cities and transport • Reduce diffuse pollution at source
• Reduce diffuse pollution pathways (i.e. control entry to the water environment)
Manage invasive non-native species • Early detection, monitoring and rapid response (to reduce the risk of establishment)
• Mitigation, control and eradication (to reduce extent)
Manage pollution from rural areas • Reduce diffuse pollution at source
• Reduce diffuse pollution pathways (i.e. control entry to water environment)
• Mitigate/remediate diffuse pollution impacts on the receptor

16
2.8 Economic appraisal and environmental assessment of measures to improve the water environment
The benefits that measures will bring to society, along with the cost and any disbenefits (negative impacts) of implementing them, have been assessed in economic appraisals. The appraisals aim to identify whether the measures needed to improve the water environment are cost beneficial, in other words, the benefits are greater than the costs. The effects of the measures on the wider environment are also considered, which helps to inform the environmental assessment. The results of the appraisals will help to decide if it is economically, environmentally and socially worthwhile to implement the measures. Environmental and socio-economic benefits and disbenefits (negative impacts) are considered in the economic appraisals. A monetary value has been assigned to some benefits. For surface waters, this is based on society’s willingness to pay for improvements in the water environment1. For groundwaters, values used have been ‘transferred’ from other detailed economic studies2. Other benefits and disbenefits which have not been monetised have been identified and form part of the overall appraisal results. The majority of the costs of measures, assessed in the economic appraisals carried out, are estimates. Costs are from local and national sources, and are based on previous experience of implementing similar measures. Where more accurate, local cost information is available, this has been used in place of national estimates. The economic appraisals have been carried out at the operational catchment scale. If the group of measures to improve all water bodies in the catchment to good status is not considered to be cost beneficial (so the cost outweighs the benefits), or would have significant adverse effects on the wider environment, an alternative group of measures to achieve the most for the water environment has been appraised. Assessing the costs and benefits of improving our water environment is an ongoing process and economic appraisals will need to be updated as new and better information becomes available. Your responses to this consultation will help us gather more and better information about the costs and benefits of the measures needed. The economic appraisals we’ve carried out will be refined before the updated Anglian river basin management plan is published. For more information on the approach taken for catchment economic appraisals and environmental assessment, please see the draft update to the Anglian river basin management plan: https://consult.environment-agency.gov.uk/portal/ho/wfd/draft_plans/consult?pointId=s1405417862790#section-s1405417862790.
1Willingness to pay values used are from The Environment Agency’s National Water Environment Benefits Survey (2007, updated 2012). 2 ‘Benefits transfer’ is a recognised way of using benefit values from existing academic studies and surveys. Other benefits which have not been monetised have been identified and form part of the overall economic appraisal results.

17
2.9 Proposed long term objectives In the consultation, we ask for your views on the proposed long term objectives for the water environment, based on preventing a drop in status and delivering all improvements which are technically feasible and worthwhile, based on economic appraisal. In the following operational catchment sections, we look at the possible scale of improvement which could happen in the second cycle, based on current knowledge of plans and actions.
2.10 Links to other management plans Achieving the long term objectives for the water environment will require a coordinated approach to making improvements across a number of different planning processes. The Strategic Environmental Assessment Environment Report considers the full range of plans that are relevant to the Anglian River Basin District and its catchments. To see this report go to: http://ea.objective.co.uk/file/3078905 One of the most important links relates to the way flood risks are managed in the catchment. Over the next year, the Environment Agency will continue to undertake considerable planning work, culminating in the publication of the updated river basin management plans and the flood risk management plans. Together, these plans will shape important decisions, direct considerable investment and action, and deliver significant benefits to society and the environment. The 2 planning processes are working to common river basin district boundaries and many key stakeholders have an interest in both. As the plans themselves and the supporting documents/data-sets are complex, we have decided not to integrate them into a single set of consultation documents. Instead we will coordinate the engagement around the planning processes, promoting them together, cross-referencing, and explaining how they relate to each other. We believe this is the best way to make it easy for you to participate in either, or both, consultations. The flood risk management plan consultation coincides with the launch of this consultation. It includes the measures proposed to manage flood risk, and can be found at: www.gov.uk/government/consultations/draft-flood-risk-management-plans The Nene catchment is home to around 800,000 people; 1,500 of whom are at high risk of flooding, 26,000 at medium risk, and 37,000 at low risk. There are 94,000 non-residential properties; over 1,000 of which are at high risk of flooding, 7,000 at medium risk, and almost 8,000 are at low risk. Roughly a third of the area’s agricultural land (64,954 hectares) and 3,019 hectares of the designated 5,423 hectares of SSSI are at risk of flooding. The flood risk management plan recognises the mutually beneficial measures indentified to improve the ecology.

18
3 Operational catchments The following sections give an overview of the current state of the water environment in each of the operational catchments; the reasons for not achieving good status/potential; and the measures being proposed to protect and improve the health of the water.
3.1 Upper Nene operational catchment
Figure 6 - Stretch of the River Nene, Upper Nene
The Upper Nene catchment includes the River Nene and its tributaries upstream of Northampton. The catchment includes Daventry and Long Buckby. It is predominately rural with mixed arable and livestock farming. It has a broad floodplain above Northampton. This operational catchment supplies Pitsford Reservoir with raw drinking water, itself an important wildlife and amenity site. The catchment is subject to potential development pressures, effecting the aquatic ecology and flood risk management. The water bodies are predominately at moderate status.
Figure 7 - Map of the Upper Nene operational catchment

19
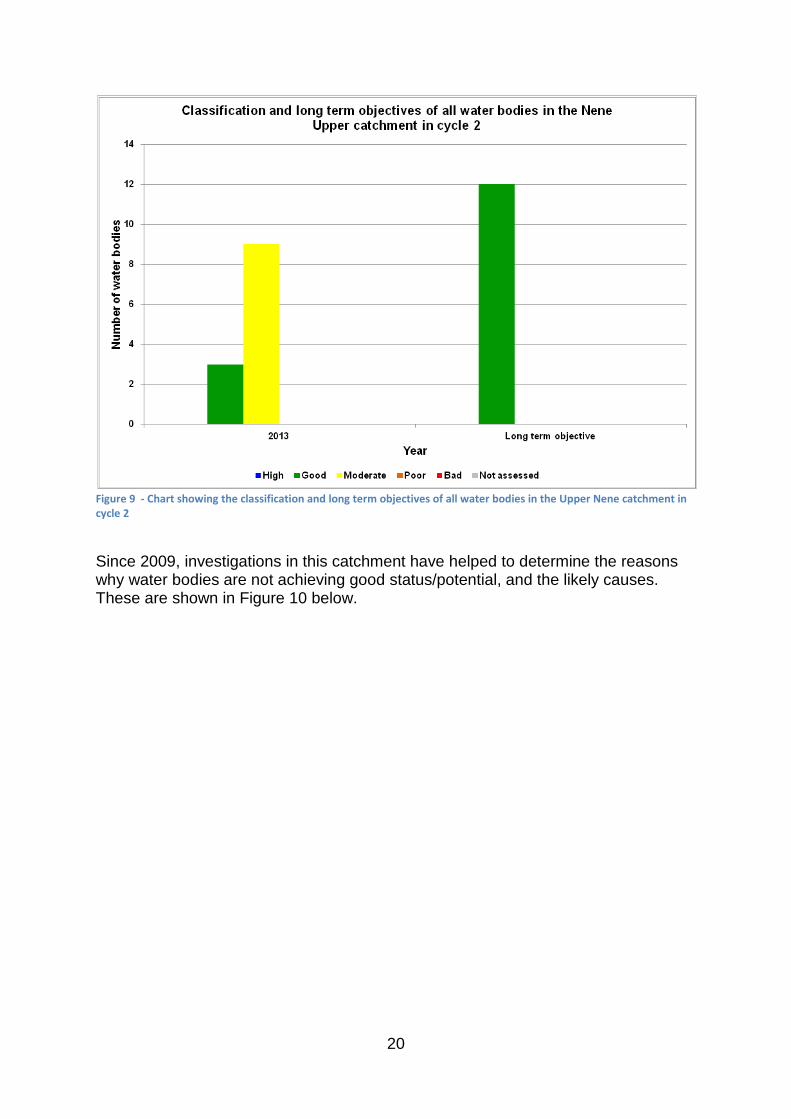
In the first river basin planning cycle this catchment was split into 17 water bodies. In cycle 2, there are 10 river water bodies and 2 canal water bodies in this catchment. The status (health) of the water environment in 2009 was assessed as being generally moderate. In 2013, the status of the water environment had not deteriorated and was showing encouraging signs of improvement. It can take 5 to 10 years for the positive benefits of actions to be reflected in the ecological status. Our current analysis suggests that 100% of the water bodies in the Nene Upper catchment should have a long term objective of achieving good status/potential, as shown in Figure 9.
Figure 8 - Chart showing the classification of all water bodies in the Upper Nene catchment in cycle 1
For more information on the changes since cycle 1, please see section 4.3 ‘Changes since first cycle (new building blocks)’ within Part 2 (technical annex) of the RBMPs. (http://ea.objective.co.uk/file/3078877)
20
Figure 9 - Chart showing the classification and long term objectives of all water bodies in the Upper Nene catchment in cycle 2
Since 2009, investigations in this catchment have helped to determine the reasons why water bodies are not achieving good status/potential, and the likely causes. These are shown in Figure 10 below.

21
Figure 10 - Chart showing the confirmed reasons for not achieving good status/potential of water bodies in the Upper Nene catchment by type and source sector
As part of our work to understand the reasons for not achieving good status/potential we assigned a level of confidence to each of the reasons. With appropriate data and evidence we were able to confirm the reasons for not achieving good status/potential. For example, monitoring data from upstream and downstream of a sewage treatment works can be used to confirm that pollution from waste water is a significant factor affecting the ecological status. There are, however, further reasons for not achieving good status/potential that are more difficult to quantify and monitor. For example, our data can be used to illustrate the problems caused by sediment on the ecology within the river however identifying the source is more difficult. Where possible we have used modelling to help to identify sources but this has not been possible for all catchments. The graphs within this document only show the reasons for not achieving good status/potential that have been confirmed. Measures to improve the water environment have been assessed. Some of these measures will benefit more than 1 water body or catchment and some are very specific. The cumulative effect and benefits of measures for the operational catchment have been considered. The measures proposed for this catchment are shown in the table below.

22
Table 4 - Proposed measures in the Upper Nene operational catchment
Improve modified physical habitats • Removal or easement of barriers to fish migration
• Improvement to condition of channel/bed and/or banks/shoreline
• Improvement to condition of riparian zone and /or wetland habitats
• Vegetation management
Managing pollution from waste water • Mitigate/remediate point source impacts on receptor
• Reduce point source pollution at source
Manage pollution from towns, cities and transport • Reduce diffuse pollution pathways (i.e. control entry to the water environment)
Manage pollution from rural areas • Reduce diffuse pollution at source
• Mitigate/remediate diffuse pollution impacts on the receptor
Issues impacting the Upper Nene operational catchment have been identified through the River Nene Regional Park Integrated Catchment Management Plan and work identified through the Nene Catchment Sensitive Farming Partnership. The actions are centred on multi-beneficial measures that can improve flow regime, reduce sediment loss, reduce diffuse urban and rural pollution loads, including nutrient and pesticide loss to the environment. This includes changing soil management techniques, on-line wetlands, sediment trapping ponds, and fish refuges amongst others. These measures will improve water quality conditions that contribute to an improved habitat for wildlife. Additionally, actions are identified to directly improve the habitat of the Upper Nene operational catchment through in-channel habitat improvement, creating pools and riffles, and channel narrowing, and meander creation. Where required, barriers to fish movements, such as weirs, are removed or incorporated with a fish pass. It is recognised that actions will be required at a local and landscape scale. Addressing point sources, particularly of nutrient input, is a recognised measure, and it is understood in the catchment where these sources are the highest contributor to phosphate levels in the receiving watercourse. However, actions to address these should consider the need and effect on the ecology as a priority, rather than a generic need for an overall reduction. As well as improving ecology, drinking water resource would be improved and protected and it is hoped these measures will improve the amenity value of the catchment. All of these measures are considered to be needed to improve the water environment to as near to good status/potential as practicable. The costs and

23
Net present value
£2.7 million
Benefit cost ratio
1.24
Present value benefits
£13.8 million
Present value costs
£11.1 million
benefits of the measures have been considered in the catchment economic appraisal, results of which are shown below. You can find out more detail on the status and long term objectives by using the Catchment Data Explorer tool at: http://environment.data.gov.uk/catchment-planning/
3.1.1 Upper Nene catchment economic appraisal and environmental assessment
3.1.1.1 Results and recommendation Different combinations of measures were appraised where improvement to good status/potential for all water bodies in the catchment was not cost beneficial. The results presented here are for a combination of measures which do improve some water bodies in the catchment and that are economically worthwhile. There were 3 measures to manage pollution from waste water through mitigation or remediation of point source impacts on the receptor and 5 measures to improve modified physical habitats by the removal or easement of barriers to fish migration removed from this appraisal. The results of the economic appraisal are shown below.
3.1.1.2 Monetised costs and benefits of implementing the measures proposed for this catchment3
This means that for every pound that is spent towards improving the water environment in this catchment, you could expect to receive £1.24 of benefits. Some additional benefits have been valued and monetised as part of this economic appraisal to provide further justification that the benefits of implementing the measures are greater than the costs. These are biodiversity benefits from agricultural schemes and are included in the results above.
3 The benefits and costs are shown in ‘Present Value’ terms, which is a way of expressing the value of costs and benefits that will happen in the future in today’s money. We apply a ‘discount’ rate and benefits to reflect people’s preference for receiving goods and services now rather than later.

24
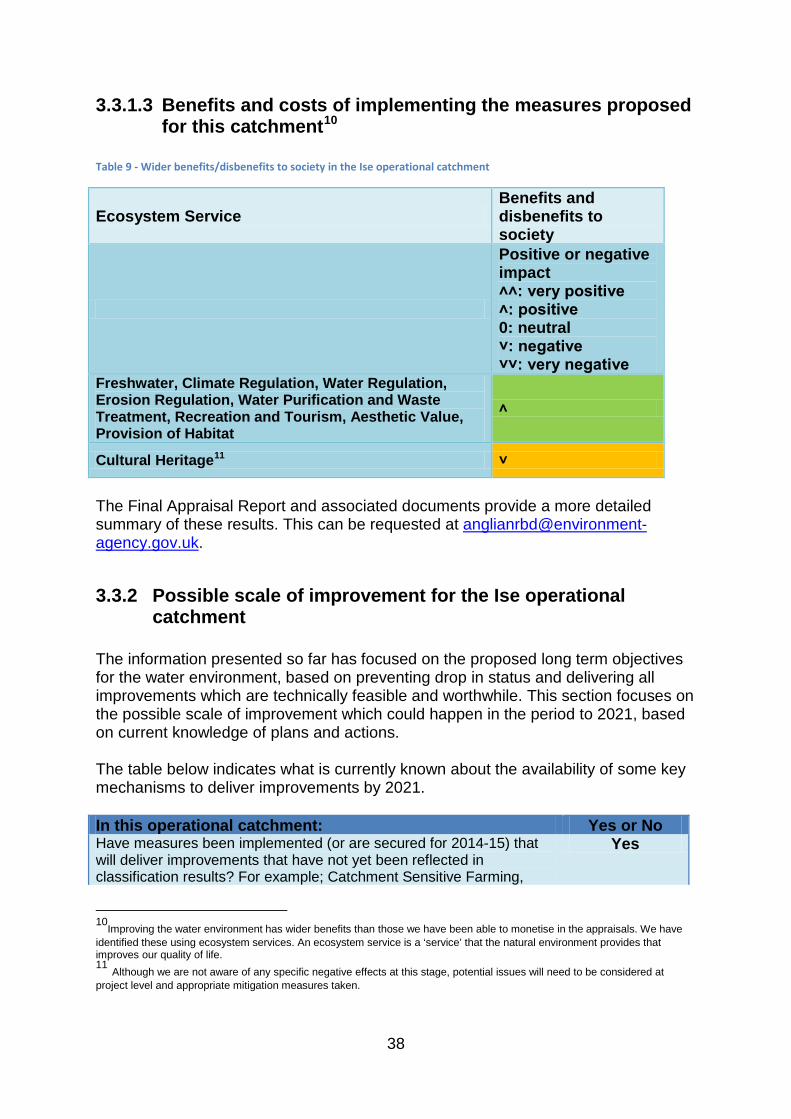
3.1.1.3 Benefits and costs of implementing the measures proposed for this catchment4
Table 5 - Wider benefits / disbenefits to society in the Upper Nene operational catchment
Ecosystem Service Benefits and disbenefits to society
Positive or negative impact ˄˄: very positive ˄: positive 0: neutral ˅: negative ˅˅: very negative
Freshwater, Climate Regulation, Water Regulation, Erosion Regulation, Recreation and Tourism, Provision of Habitat
˄
Cultural Heritage5 ˅
The Final Appraisal Report and associated documents provide a more detailed summary of these results. This can be requested at [email protected].
3.1.2 Possible scale of improvement for the Upper Nene operational catchment
The information presented so far has focused on the proposed long term objectives for the water environment, based on preventing drop in status and delivering all improvements which are technically feasible and worthwhile. This section focuses on the possible scale of improvement which could happen in the period to 2021, based on current knowledge of plans and actions. The table below indicates what is currently known about the availability of some key mechanisms to deliver improvements by 2021. In this operational catchment: Yes or No Have measures been implemented (or are secured for 2014-15) that will deliver improvements that have not yet been reflected in classification results? For example; Catchment Sensitive Farming, Catchment Restoration Fund Projects
Yes
Are there measures planned to deliver Protected Area objectives that will also contribute to improvements in water body status?
Yes
Has this operational catchment been identified in water company draft Yes 4Improving the water environment has wider benefits than those we have been able to monetise in the appraisals. We have
identified these using ecosystem services. An ecosystem service is a ‘service’ that the natural environment provides that improves our quality of life. 5 Although we are not aware of any specific negative effects at this stage, potential issues will need to be considered at project level and appropriate mitigation measures taken.

25
In this operational catchment: Yes or No business plans as an area for improvement? Has this operational catchment been identified as a priority for action under the new environmental land management schemes (NELMS)?
Yes
Have the local catchment partnership identified measures they are likely to secure funding for, which will bring about improvement within the second cycle?
Yes
Are any additional improvement measures included in Environment Agency or other statutory plans?
Yes
Based on our understanding of the information above, and our catchment knowledge, we have medium confidence that this operational catchment will see an improvement towards the proposed long term objectives by 2021.
3.2 Brampton Branch operational catchment
Figure 11 - Stretch of the Brampton Branch
Brampton Branch is one of the main Nene tributaries; flowing into Northampton from the north, where it joins the River Nene. The catchment includes Brixworth. It is predominately rural with mixed arable and livestock farming, but is urban through Northampton. Brampton Branch operational catchment supplies include Pitsford Reservoir, itself an important wildlife and amenity site, as well as the smaller Ravensthorpe and Hollowell water supply reservoirs. The water bodies within this catchment are predominately at poor to moderate status. The catchment is known for the considerable numbers of invasive Signal Crayfish affecting the ecology.

26
Figure 12 - Map of the Brampton Branch operational catchment
In the first river basin planning cycle this catchment was split into 15 water bodies. In cycle 2, there are 10 river water bodies and 3 lakes in this catchment. The status (health) of the water environment in 2009 was assessed as being generally moderate. In 2013, the status of the water environment had deteriorated. It can take 5 to 10 years for the positive benefits of actions to be reflected in the ecological status. Our current analysis suggests that 61% of the water bodies in the Brampton Branch catchment should have a long term objective of achieving good status/potential, as shown in Figure 14.

27
Figure 13 - Chart showing the classification of all water bodies in the Brampton Branch catchment in cycle 1
For more information on the changes since cycle 1, please see section 4.3 ‘Changes since first cycle (new building blocks)’ within Part 2 (technical annex) of the RBMPs. (http://ea.objective.co.uk/file/3078877)
Figure 14 - Chart showing the classification and long term objectives of all water bodies in the Brampton Branch catchment in cycle 2

28
Since 2009, investigations in this catchment have helped to determine the reasons why water bodies are not achieving good status/potential, and the likely causes. These are shown in Figure 15 below.
Figure 15 - Chart showing the confirmed reasons for not achieving good status/potential of water bodies in the Brampton Branch catchment by type and source sector
As part of our work to understand the reasons for not achieving good status/potential we assigned a level of confidence to each of the reasons. With appropriate data and evidence we were able to confirm the reasons for not achieving good status/potential. For example, monitoring data from upstream and downstream of a sewage treatment works can be used to confirm that pollution from waste water is a significant factor affecting the ecological status. There are, however, further reasons for not achieving good status/potential that are more difficult to quantify and monitor. For example, our data can be used to illustrate the problems caused by sediment on the ecology within the river however identifying the source is more difficult. Where possible we have used modelling to help to identify sources but this has not been possible for all catchments. The graphs within this document only show the reasons for not achieving good status/potential that have been confirmed. Measures to improve the water environment have been assessed. Some of these measures will benefit more than 1 water body or catchment and some are very specific. The cumulative effect and benefits of measures for the operational catchment have been considered. The measures proposed for this catchment are shown in the table below.

29
Table 6 - Proposed measures in the Brampton Branch operational catchment
Improve modified physical habitats • Removal or easement of barriers to fish migration
• Removal or modification of engineering structure
• Improvement to condition of channel/bed and/or banks/shoreline
• Improvement to condition of riparian zone and /or wetland habitats
Managing pollution from waste water • Reduce point source pollution pathways (i.e. control entry to the water environment)
• Mitigate/remediate point source impacts on receptor
• Reduce point source pollution at source
Manage pollution from towns, cities and transport • Reduce diffuse pollution pathways (i.e. control entry to the water environment)
Manage invasive non-native species • Early detection, monitoring and rapid response (to reduce the risk of establishment)
• Mitigation, control and eradication (to reduce extent)
Manage pollution from rural areas • Reduce diffuse pollution at source
• Mitigate/remediate diffuse pollution impacts on the receptor
Issues impacting the Brampton Branch operational catchment have been identified through the River Nene Regional Park Integrated Catchment Management Plan and work identified through the Nene Catchment Sensitive Farming Partnership. The actions are centred on multi-beneficial measures that can improve flow regime, reduce sediment loss, reduce diffuse urban and rural pollution loads, including nutrient and pesticide loss to the environment. This includes changing soil management techniques, on-line wetlands, sediment trapping ponds, and fish refuges amongst others. These measures will improve water quality conditions that contribute to an improved habitat for wildlife. Additionally, actions are identified to directly improve the habitat of the Brampton Branch operational catchment through in-channel habitat improvement, creating pools and riffles, and channel narrowing, and meander creation. Where required, barriers to fish movements, such as weirs, are removed or incorporated with a fish pass. It is recognised that actions will be required at a local and landscape scale. The effect of Signal Crayfish requires further consideration as to any feasible successful action that could be taken. Addressing point sources, particularly of nutrient input, is a recognised measure, and it is understood in the catchment where these sources are the highest contributor to phosphate levels in the receiving watercourse. However, actions to address these should consider the need and effect on the ecology as a priority, rather than a generic need for an overall reduction. As well as improving ecology, it is hoped these measures will improve the amenity value of the catchment.

30
Net present value
£2 million
Benefit cost ratio
1.12
Present value benefits
£18.2 million
Present value costs
£16.2 million
All of these measures are considered to be needed to improve the water environment to as near to good status/potential as practicable. The costs and benefits of the measures have been considered in the catchment economic appraisal, results of which are shown below. You can find out more detail on the status and long term objectives by using the Catchment Data Explorer tool at: http://environment.data.gov.uk/catchment-planning/
3.2.1 Brampton Branch catchment economic appraisal and environmental assessment
3.2.1.1 Results and recommendation Measures proposed to improve the water environment to good status/potential (where it is considered to be potentially achievable) in this catchment are cost beneficial; the benefits are greater than the costs. Their effects on the wider environment have been considered. The results of the economic appraisal are shown below.
3.2.1.2 Monetised costs and benefits of implementing the measures proposed for this catchment6
This means that for every pound that is spent towards improving the water environment in this catchment, you could expect to receive £1.12 of benefits.
3.2.1.3 Benefits and costs of implementing the measures proposed for this catchment7
6 The benefits and costs are shown in ‘Present Value’ terms, which is a way of expressing the value of costs and benefits that will happen in the future in today’s money. We apply a ‘discount’ rate and benefits to reflect people’s preference for receiving goods and services now rather than later.
7Improving the water environment has wider benefits than those we have been able to monetise in the appraisals. We have
identified these using ecosystem services. An ecosystem service is a ‘service’ that the natural environment provides that improves our quality of life.

31
Table 7 - Wider benefits / disbenefits in the Brampton Branch operational catchment
Ecosystem Service Benefits and disbenefits to society
Positive or negative impact ˄˄: very positive ˄: positive 0: neutral ˅: negative ˅˅: very negative
Freshwater, Erosion Regulation ˄˄
Climate Regulation, Water Regulation, Water Purification and Waste Treatment, Recreation and Tourism, Aesthetic Value, Provision of Habitat
˄
Cultural Heritage8 ˅
Impacts on the freshwater and erosion regulation ecosystem services (wider benefits) are particularly important in the results of this economic appraisal. The impacts will significantly benefit society and although they have not been valued and monetised as part of this economic appraisal, further support the proposed measures for this catchment. The Final Appraisal Report and associated documents provide a more detailed summary of these results. This can be requested at [email protected].
3.2.2 Possible scale of improvement for the Brampton Branch operational catchment
The information presented so far has focused on the proposed long term objectives for the water environment, based on preventing drop in status and delivering all improvements which are technically feasible and worthwhile. This section focuses on the possible scale of improvement which could happen in the period to 2021, based on current knowledge of plans and actions. The table below indicates what is currently known about the availability of some key mechanisms to deliver improvements by 2021. In this operational catchment: Yes or No Have measures been implemented (or are secured for 2014-15) that will deliver improvements that have not yet been reflected in classification results? For example; Catchment Sensitive Farming,
Yes
8 Although we are not aware of any specific negative effects at this stage, potential issues will need to be considered at project level and appropriate mitigation measures taken.

32
In this operational catchment: Yes or No Catchment Restoration Fund Projects Are there measures planned to deliver Protected Area objectives that will also contribute to improvements in water body status?
Yes
Has this operational catchment been identified in water company draft business plans as an area for improvement?
Yes
Has this operational catchment been identified as a priority for action under the new environmental land management schemes (NELMS)?
Yes
Have the local catchment partnership identified measures they are likely to secure funding for, which will bring about improvement within the second cycle?
Yes
Are any additional improvement measures included in Environment Agency or other statutory plans?
Yes
Based on our understanding of the information above, and our catchment knowledge, we have medium confidence that this operational catchment will see an improvement towards the proposed long term objectives by 2021.

33
3.3 Ise operational catchment
Figure 16 - Stretch of the River Ise
The River Ise joins the Nene at Wellingborough, flowing in from the north. Its other major urban areas are Kettering, Desborough and Rothwell. The River Ise is at good ecological status, with its main tributary, Slade Brook at moderate status. It remains largely rural with mixed farming, but is subject to major development pressures. It has an important riverine SSSI upstream of Geddington that is in need of improvement. The river forms part of Wicksteed Park, an important amenity for the local area.
Figure 17 - Map of the Ise operational catchment
In the first river basin planning cycle this catchment was split into 9 water bodies. In cycle 2, there are 8 river water bodies in this catchment. The status (health) of the water environment in 2009 was assessed as being generally moderate. In 2013, the status of the water environment had not deteriorated. It can take 5 to 10 years for the positive benefits of actions to be reflected in the ecological status. Our current analysis suggests that 100% of the water bodies in the Ise catchment should have a long term objective of achieving good status/potential, as shown in Figure 19.

34
Figure 18 - Chart showing the classification of all water bodies in the Ise catchment in cycle 1
For more information on the changes since cycle 1, please see section 4.3 ‘Changes since first cycle (new building blocks)’ within Part 2 (technical annex) of the RBMPs. (http://ea.objective.co.uk/file/3078877)
Figure 19 - Chart showing the classification and long term objectives of all water bodies in the Ise catchment in cycle 2

35
Since 2009, investigations in this catchment have helped to determine the reasons why water bodies are not achieving good status/potential, and the likely causes. These are shown in Figure 20 below.
Figure 20 - Chart showing the confirmed reasons for not achieving good status/potential of water bodies in the Ise catchment by type and source sector
As part of our work to understand the reasons for not achieving good status/potential we assigned a level of confidence to each of the reasons. With appropriate data and evidence we were able to confirm the reasons for not achieving good status/potential. For example, monitoring data from upstream and downstream of a sewage treatment works can be used to confirm that pollution from waste water is a significant factor affecting the ecological status. There are, however, further reasons for not achieving good status/potential that are more difficult to quantify and monitor. For example, our data can be used to illustrate the problems caused by sediment on the ecology within the river however identifying the source is more difficult. Where possible we have used modelling to help to identify sources but this has not been possible for all catchments. The graphs within this document only show the reasons for not achieving good status/potential that have been confirmed. Measures to improve the water environment have been assessed. Some of these measures will benefit more than 1 water body or catchment and some are very specific. The cumulative effect and benefits of measures for the operational catchment have been considered. The measures proposed for this catchment are shown in the table below.

36
Table 8 - Proposed measures in the Ise operational catchment
Improve modified physical habitats • Removal or easement of barriers to fish migration
• Removal or modification of engineering structure
• Improvement to condition of channel/bed and/or banks/shoreline
• Improvement to condition of riparian zone and /or wetland habitats
• Vegetation management
Managing pollution from waste water • Mitigate/remediate point source impacts on receptor
• Reduce point source pollution at source
Manage pollution from towns, cities and transport • Reduce diffuse pollution pathways (i.e. control entry to the water environment)
Manage pollution from rural areas • Reduce diffuse pollution at source
• Mitigate/remediate diffuse pollution impacts on the receptor
Issues impacting the River Ise operational catchment have been identified through the River Nene Regional Park Integrated Catchment Management Plan and work identified through the Nene Catchment Sensitive Farming Partnership, Nature Improvement Area, Re-vitalise Project and the Diffuse Water Pollution Plan for the River Ise SSSI. The actions are centred on multi-beneficial measures that can improve flow regime, reduce sediment loss, reduce diffuse urban and rural pollution loads, including nutrient and pesticide loss to the environment. This includes changing soil management techniques, on-line wetlands, sediment trapping ponds, and fish refuges amongst others. These measures will improve water quality conditions that contribute to an improved habitat for wildlife. Additionally, actions are identified to directly improve the habitat of the River Ise catchment through in-channel habitat improvement, creating pools and riffles, and channel narrowing, meander creation and backwater restoration. Where required, barriers to fish, such as weirs, are removed or incorporated with fish passes. It is recognised that actions will be required at a local and landscape scale. As well as improving ecology, it is hoped these measures will improve the amenity value of the catchment. As the status of the River Ise is currently at good, and there is no immediate threat to this status, the priority would be to protect and improve the SSSI and improve the moderate status Slade Brook. All of these measures are considered to be needed to improve the water environment to as near to good status/potential as practicable. The costs and benefits of the measures have been considered in the catchment economic appraisal, results of which are shown below.

37
Net present value
£2.6 million
Benefit cost ratio
1.34
Present value benefits
£10.1 million
Present value costs
£7.6 million
You can find out more detail on the status and long term objectives by using the Catchment Data Explorer tool at: http://environment.data.gov.uk/catchment-planning/
3.3.1 Ise catchment economic appraisal and environmental assessment
3.3.1.1 Results and recommendation Measures proposed to improve the water environment to good status/potential (where it is considered to be potentially achievable) in this catchment are cost beneficial; the benefits are greater than the costs. Their effects on the wider environment have been considered. The results of the economic appraisal are shown below.
3.3.1.2 Monetised costs and benefits of implementing the measures proposed for this catchment9
This means that for every pound that is spent towards improving the water environment in this catchment, you could expect to receive £1.34 of benefits.
9 The benefits and costs are shown in ‘Present Value’ terms, which is a way of expressing the value of costs and benefits that will happen in the future in today’s money. We apply a ‘discount’ rate and benefits to reflect people’s preference for receiving goods and services now rather than later.
38
3.3.1.3 Benefits and costs of implementing the measures proposed for this catchment10
Table 9 - Wider benefits/disbenefits to society in the Ise operational catchment
Ecosystem Service Benefits and disbenefits to society
Positive or negative impact ˄˄: very positive ˄: positive 0: neutral ˅: negative ˅˅: very negative
Freshwater, Climate Regulation, Water Regulation, Erosion Regulation, Water Purification and Waste Treatment, Recreation and Tourism, Aesthetic Value, Provision of Habitat
˄
Cultural Heritage11 ˅ The Final Appraisal Report and associated documents provide a more detailed summary of these results. This can be requested at [email protected].
3.3.2 Possible scale of improvement for the Ise operational catchment
The information presented so far has focused on the proposed long term objectives for the water environment, based on preventing drop in status and delivering all improvements which are technically feasible and worthwhile. This section focuses on the possible scale of improvement which could happen in the period to 2021, based on current knowledge of plans and actions. The table below indicates what is currently known about the availability of some key mechanisms to deliver improvements by 2021. In this operational catchment: Yes or No Have measures been implemented (or are secured for 2014-15) that will deliver improvements that have not yet been reflected in classification results? For example; Catchment Sensitive Farming,
Yes
10
Improving the water environment has wider benefits than those we have been able to monetise in the appraisals. We have identified these using ecosystem services. An ecosystem service is a ‘service’ that the natural environment provides that improves our quality of life. 11 Although we are not aware of any specific negative effects at this stage, potential issues will need to be considered at project level and appropriate mitigation measures taken.

39
In this operational catchment: Yes or No Catchment Restoration Fund Project Are there measures planned to deliver Protected Area objectives that will also contribute to improvements in water body status?
Yes
Has this operational catchment been identified in water company draft business plans as an area for improvement?
No
Has this operational catchment been identified as a priority for action under the new environmental land management schemes (NELMS)?
Yes
Are the measures expected to result in substantial benefits to society, when compared to other catchments in the river basin district?
Not Applicable
Have the local catchment partnership identified measures they are likely to secure funding for, which will bring about improvement within the second cycle?
Yes
Are any additional improvement measures included in Environment Agency or other statutory plans?
Yes
Based on our understanding of the information above, and our catchment knowledge, we have medium confidence that this operational catchment will see an improvement towards the proposed long term objectives by 2021.

40
3.4 Middle Nene operational catchment
Figure 21 - Stretch of the River Nene, Middle Nene
Middle Nene is the largest operational catchment, starting in Northampton at the Brampton Branch confluence, ending in Peterborough at Stanground. The wider catchment is rural with mixed arable and livestock farming with a wide floodplain, but it does drain additional large urban areas at Wellingborough, Irthlingborough, Rushden and Thrapston. The catchment supplies Rutland Water. The River Nene here is an important navigable waterway with 32 locks and many backwaters. It is also a popular coarse fishery. It is an important source of aggregates, with many gravel pits, some of which are internationally important wildlife sites. Development pressure is a concern.
Figure 22 - Map of the Middle Nene operational catchment
In the first river basin planning cycle this catchment was split into 27 water bodies. In cycle 2, there are 24 river water bodies and 1 lake in this catchment. The status (health) of the water environment in 2009 was assessed as being generally moderate. In 2013, the status of the water environment had deteriorated. It can take

41
5 to 10 years for the positive benefits of actions to be reflected in the ecological status. Our current analysis suggests that 96% of the water bodies in the Nene Middle catchment should have a long term objective of achieving good status/potential, as shown in Figure 24.
Figure 23 - Chart showing the classification of all water bodies in the Middle Nene catchment in cycle 1
For more information on the changes since cycle 1, please see section 4.3 ‘Changes since first cycle (new building blocks)’ within Part 2 (technical annex) of the RBMPs. (http://ea.objective.co.uk/file/3078877)
Figure 24 - Chart showing the classification and long term objectives of all water bodies in the Middle Nene catchment in cycle 2

42
Since 2009, investigations in this catchment have helped to determine the reasons why water bodies are not achieving good status/potential, and the likely causes. These are shown in Figure 25 below.
Figure 25 - Chart showing the confirmed reasons for not achieving good status/potential of water bodies in the Middle Nene catchment by type and source sector
As part of our work to understand the reasons for not achieving good status/potential we assigned a level of confidence to each of the reasons. With appropriate data and evidence we were able to confirm the reasons for not achieving good status/potential. For example, monitoring data from upstream and downstream of a sewage treatment works can be used to confirm that pollution from waste water is a significant factor affecting the ecological status. There are, however, further reasons for not achieving good status/potential that are more difficult to quantify and monitor. For example, our data can be used to illustrate the problems caused by sediment on the ecology within the river however identifying the source is more difficult. Where possible we have used modelling to help to identify sources but this has not been possible for all catchments. The graphs within this document only show the reasons for not achieving good status/potential that have been confirmed. Measures to improve the water environment have been assessed. Some of these measures will benefit more than 1 water body or catchment and some are very specific. The cumulative effect and benefits of measures for the operational catchment have been considered. The measures proposed for this catchment are shown in the table below.

43
Table 10 - Proposed measures in the Middle Nene operational catchment
Improve modified physical habitats • Removal or easement of barriers to fish migration
• Removal or modification of engineering structure
• Improvement to condition of channel/bed and/or banks/shoreline
• Improvement to condition of riparian zone and /or wetland habitats
• Vegetation management
Managing pollution from waste water • Reduce diffuse pollution at source
• Mitigate/remediate point source impacts on receptor
Manage pollution from towns, cities and transport • Reduce diffuse pollution at source
• Reduce diffuse pollution pathways (i.e. control entry to the water environment)
Manage pollution from rural areas • Reduce diffuse pollution at source
• Reduce diffuse pollution pathways (i.e. control entry to water environment)
• Mitigate/remediate diffuse pollution impacts on the receptor
Issues impacting the Middle Nene operational catchment have been identified through the River Nene Regional Park Integrated Catchment Management Plan and work identified through the Nene Catchment Sensitive Farming Partnership and Nature Improvement Area. The actions are centred on multi-beneficial measures that can improve flow regime, reduce sediment loss, reduce diffuse urban and rural pollution loads, including nutrient and pesticide loss to the environment. This includes changing soil management techniques, on-line wetlands, sediment trapping ponds, and fish refuges amongst others. These measures will improve water quality conditions that contribute to an improved habitat for wildlife. Additionally, actions are identified to directly improve the habitat of the Middle Nene operational catchment through in-channel habitat improvement, creating pools and riffles, and channel narrowing, meander creation and backwater restoration. Where required, barriers to fish, such as weirs, are removed or incorporated with fish passes. It is recognised that actions will be required at a local and landscape scale. Addressing point sources, particularly of nutrient input, is a recognised measure, and it is understood in the catchment where these sources are the highest contributor to phosphate levels in the receiving watercourse. However, actions to address these should consider the need and effect on the ecology as a priority, rather than a generic need for an overall reduction. As well as improving ecology, drinking water resource would be improved and protected and it is hoped these measures will improve the amenity value of the catchment. Its status is predominately moderate.

44
Net present value
£1.24 million
Benefit cost ratio
1.03
Present value benefits
£46.34 million
Present value costs
£45.1 million
All of these measures are considered to be needed to improve the water environment to as near to good status/potential as practicable. The costs and benefits of the measures have been considered in the catchment economic appraisal, results of which are shown below. You can find out more detail on the status and long term objectives by using the Catchment Data Explorer tool at: http://environment.data.gov.uk/catchment-planning/
3.4.1 Middle Nene catchment economic appraisal and environmental assessment
3.4.1.1 Results and recommendation Different combinations of measures were appraised where improvement to good status/potential for all water bodies in the catchment was not cost beneficial. The results presented here are for a combination of measures which do improve some water bodies in the catchment and that are economically worthwhile. There were 5 measures to manage pollution from waste water through mitigation or remediation of point source impacts on the receptor removed from this appraisal. The results of the economic appraisal are shown below.
3.4.1.2 Monetised costs and benefits of implementing the measures proposed for this catchment12
This means that for every pound that is spent towards improving the water environment in this catchment, you could expect to receive £1.03 of benefits. Some additional benefits have been valued and monetised as part of this economic appraisal to provide further justification that the benefits of implementing the measures are greater than the costs. These are biodiversity benefits from agricultural schemes and are included in the results above.
12 The benefits and costs are shown in ‘Present Value’ terms, which is a way of expressing the value of costs and benefits that will happen in the future in today’s money. We apply a ‘discount’ rate and benefits to reflect people’s preference for receiving goods and services now rather than later.

45
3.4.1.3 Benefits and costs of implementing the measures proposed for this catchment13
Table 11 - Wider benefits and disbenefits to society in the Middle Nene operational catchment
Ecosystem Service Benefits and disbenefits to society
Positive or negative impact ˄˄: very positive ˄: positive 0: neutral ˅: negative ˅˅: very negative
Freshwater, Provision of Habitat ˄˄
Climate Regulation, Water Regulation, Erosion Regulation, Water Purification and Waste Treatment, Recreation and Tourism
˄
Cultural Heritage14 ˅
Impacts on the freshwater and provision of habitat ecosystem services (wider benefits) are particularly important in the results of this economic appraisal. The impacts will significantly benefit society and although they have not been valued and monetised as part of this economic appraisal, further support the proposed measures for this catchment. The Final Appraisal Report and associated documents provide a more detailed summary of these results. This can be requested at [email protected]
3.4.2 Possible scale of improvement for the Middle Nene operational catchment
The information presented so far has focused on the proposed long term objectives for the water environment, based on preventing drop in status and delivering all improvements which are technically feasible and worthwhile. This section focuses on the possible scale of improvement which could happen in the period to 2021, based on current knowledge of plans and actions. The table below indicates what is currently known about the availability of some key mechanisms to deliver improvements by 2021.
13
Improving the water environment has wider benefits than those we have been able to monetise in the appraisals. We have identified these using ecosystem services. An ecosystem service is a ‘service’ that the natural environment provides that improves our quality of life. 14 Although we are not aware of any specific negative effects at this stage, potential issues will need to be considered at project level and appropriate mitigation measures taken.

46
In this operational catchment: Yes or No Have measures been implemented (or are secured for 2014-15) that will deliver improvements that have not yet been reflected in classification results? For example; Catchment Sensitive Farming, Catchment Restoration Fund Projects
Yes
Are there measures planned to deliver Protected Area objectives that will also contribute to improvements in water body status?
Yes
Has this operational catchment been identified in water company draft business plans as an area for improvement?
Yes
Has this operational catchment been identified as a priority for action under the new environmental land management schemes (NELMS)?
Yes
Have the local catchment partnership identified measures they are likely to secure funding for, which will bring about improvement within the second cycle?
Yes
Are any additional improvement measures included in Environment Agency or other statutory plans?
Yes
Based on our understanding of the information above, and our catchment knowledge, we have medium confidence that this operational catchment will see an improvement towards the proposed long term objectives by 2021.
3.5 Willow Brook operational catchment
Figure 26 - Stretch of Willow Brook
Willow Brook is a relatively small catchment, flowing from Corby to the River Nene near Elton. In Corby it has 2 main tributaries, Northern and Southern streams, which join in Deene Lake, 1 of 3 large lakes the Willow Brook flows through. Downstream of Deene Lake the Willow Brook is at moderate to good status. The majority of Southern Stream is comprised of treated sewage and industrial effluents, whereas Northern Stream is heavily influenced by urban runoff and historical industrial land use, including landfill.

47
Figure 27 - Map of the Willow Brook operational catchment
In the first river basin planning cycle this catchment was split into 3 water bodies. In cycle 2, there are 3 river water bodies in this catchment. The status (health) of the water environment in 2009 was assessed as being generally moderate. In 2013, the status of the water environment had not deteriorated. It can take 5 to 10 years for the positive benefits of actions to be reflected in the ecological status. Our current analysis suggests that 66% of the water bodies in the Willow Brook catchment should have a long term objective of achieving good status/potential, as shown in Figure 29.

48
Figure 28 - Chart showing the classification of all water bodies in the Willow Brook catchment in cycle 1
For more information on the changes since cycle 1, please see section 4.3 ‘Changes since first cycle (new building blocks)’ within Part 2 (technical annex) of the RBMPs. (http://ea.objective.co.uk/file/3078877)
Figure 29 - Chart showing the classification and long term objectives of all water bodies in the Willow Brook catchment in cycle 2

49
Since 2009, investigations in this catchment have helped to determine the reasons why water bodies are not achieving good status/potential, and the likely causes. These are shown in Figure 30 below.
Figure 30 - Chart showing the confirmed reasons for not achieving good status/potential of water bodies in the Willow Brook catchment by type and source sector
As part of our work to understand the reasons for not achieving good status/potential we assigned a level of confidence to each of the reasons. With appropriate data and evidence we were able to confirm the reasons for not achieving good status/potential. For example, monitoring data from upstream and downstream of a sewage treatment works can be used to confirm that pollution from waste water is a significant factor affecting the ecological status. There are, however, further reasons for not achieving good status that are more difficult to quantify and monitor. For example, our data can be used to illustrate the problems caused by sediment on the ecology within the river however identifying the source is more difficult. Where possible we have used modelling to help to identify sources but this has not been possible for all catchments. The graphs within this document only show the reasons for not achieving good status/potential that have been confirmed. Measures to improve the water environment have been assessed. Some of these measures will benefit more than 1 water body or catchment and some are very specific. The cumulative effect and benefits of measures for the operational catchment have been considered. The measures proposed for this catchment are shown in the table below.

50
Table 12 Proposed measures in the Willow Brook operational catchment
Improve modified physical habitats • Improvement to condition of riparian zone and /or wetland habitats
Managing pollution from waste water • Reduce diffuse pollution at source
• Mitigate/remediate point source impacts on receptor
Manage pollution from towns, cities and transport • Reduce diffuse pollution pathways (i.e. control entry to the water environment)
• Mitigate/remediate diffuse pollution impacts on the receptor
Manage pollution from rural areas • Reduce diffuse pollution at source
Issues impacting the Willow Brook operational catchment have been identified through the River Nene Regional Park Integrated Catchment Management Plan. The actions are centred on improving the quality of Northern and Southern Streams, with some quality and habitat improvement measures identified for the main Willow Brook. Measures for Northern and Southern Streams include misconnection investigations, soft engineering options for certain outfalls, pollution prevention campaigns on industrial estates, and improvements to the quality of certain groundwater discharges. Addressing point sources, particularly of nutrient input, is a recognised measure, and it is understood in the catchment where these sources are the highest contributor to phosphate levels in the receiving watercourse. However, actions to address these should consider the need and effect on the ecology as a priority, rather than a generic need for an overall reduction. All of these measures are considered to be needed to improve the water environment to as near to good status/potential as practicable. The costs and benefits of the measures have been considered in the catchment economic appraisal, results of which are shown below. You can find out more detail on the status and long term objectives by using the Catchment Data Explorer tool at: http://environment.data.gov.uk/catchment-planning/
3.5.1 Willow Brook catchment economic appraisal and environmental assessment
3.5.1.1 Results and recommendation Different combinations of measures were appraised where improvement to good status/potential for all water bodies in the catchment was not cost beneficial. The results presented here are for a combination of measures which do improve some water bodies in the catchment and that are economically worthwhile. There was 1 measure to manage pollution from waste water through mitigation or remediation of point source impacts on the receptor removed from this appraisal.

51
Net present value
£1.5 million
Benefit cost ratio
3.52
Present value benefits
£2 million
Present value costs
£0.6 million
The results of the economic appraisal are shown below.
3.5.1.2 Monetised costs and benefits of implementing the measures proposed for this catchment15
This means that for every pound that is spent towards improving the water environment in this catchment, you could expect to receive £3.52 of benefits.
3.5.1.3 Benefits and costs of implementing the measures proposed for this catchment16
Table 13 Wider benefits and disbenefits to society in the Willow Brook operational catchment
Ecosystem Service Benefits and disbenefits to society
Positive or negative impact ˄˄: very positive ˄: positive 0: neutral ˅: negative ˅˅: very negative
Freshwater, Water Regulation, Water Purification and Waste Treatment, Aesthetic Value, Provision of Habitat ˄
The Final Appraisal Report and associated documents provide a more detailed summary of these results. This can be requested at [email protected]
15 The benefits and costs are shown in ‘Present Value’ terms, which is a way of expressing the value of costs and benefits that will happen in the future in today’s money. We apply a ‘discount’ rate and benefits to reflect people’s preference for receiving goods and services now rather than later.
16Improving the water environment has wider benefits than those we have been able to monetise in the appraisals. We have
identified these using ecosystem services. An ecosystem service is a ‘service’ that the natural environment provides that improves our quality of life.

52
3.5.2 Possible scale of improvement for the Willow Brook operational catchment
The information presented so far has focused on the proposed long term objectives for the water environment, based on preventing drop in status and delivering all improvements which are technically feasible and worthwhile. This section focuses on the possible scale of improvement which could happen in the period to 2021, based on current knowledge of plans and actions. The table below indicates what is currently known about the availability of some key mechanisms to deliver improvements by 2021. In this operational catchment: Yes or No Have measures been implemented (or are secured for 2014-15) that will deliver improvements that have not yet been reflected in classification results? For example; Catchment Sensitive Farming, Catchment Restoration Fund Projects
Yes
Are there measures planned to deliver Protected Area objectives that will also contribute to improvements in water body status?
N/A
Has this operational catchment been identified in water company draft business plans as an area for improvement?
Yes
Has this operational catchment been identified as a priority for action under the new environmental land management schemes (NELMS)?
Yes
Have the local catchment partnership identified measures they are likely to secure funding for, which will bring about improvement within the second cycle?
Yes
Are any additional improvement measures included in Environment Agency or other statutory plans?
Yes
Based on our understanding of the information above, and our catchment knowledge, we have medium confidence that this operational catchment will see an improvement towards the proposed long term objectives by 2021.

53
3.6 Lower Nene operational catchment
Figure 31 - Stretch of the River Nene, Lower Nene
The Lower Nene operational catchment starts below Peterborough and ends at the Wash shoreline. The principal water body is the River Nene, which flows in an embanked channel through the Dog-in-Doublet tidal lock to the Wash. This passes Wisbech and the Port of Sutton Bridge, a busy commercial port. The River Nene is navigable. The catchment is fenland; intensively farmed with arable and horticulture predominating. The fenland is drained to the River Nene and Wash through well maintained internal drainage board drains, the 2 largest being South Holland Main Drain and North Level Main Drain. The water bodies range from moderate to good status.
Figure 32 - Map of the Lower Nene operational catchment
In the first river basin planning cycle this catchment was split into 5 water bodies. In cycle 2, there are 5 river water bodies in this catchment. The status (health) of the water environment in 2009 was assessed as being generally moderate. In 2013, the status of the water environment had deteriorated. It can take 5 to 10 years for the

54
positive benefits of actions to be reflected in the ecological status. Our current analysis suggests that 80% of the water bodies in the Nene Lower catchment should have a long term objective of achieving good status/potential, as shown in Figure 34.
Figure 33 - Chart showing the classification of all water bodies in the Lower Nene catchment in cycle 1
For more information on the changes since cycle 1, please see section 4.3 ‘Changes since first cycle (new building blocks)’ within Part 2 (technical annex) of the RBMPs. (http://ea.objective.co.uk/file/3078877)
Figure 34 - Chart showing the classification and long term objectives of all water bodies in the Lower Nene catchment in cycle 2
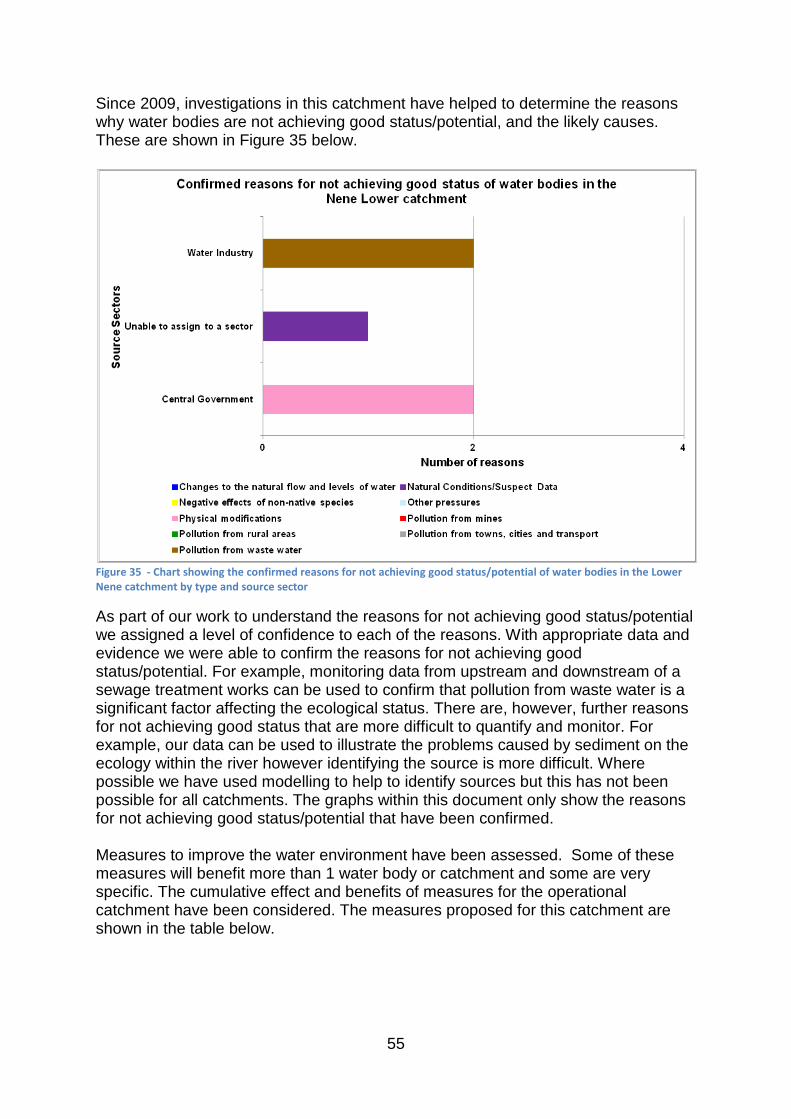
55
Since 2009, investigations in this catchment have helped to determine the reasons why water bodies are not achieving good status/potential, and the likely causes. These are shown in Figure 35 below.
Figure 35 - Chart showing the confirmed reasons for not achieving good status/potential of water bodies in the Lower Nene catchment by type and source sector
As part of our work to understand the reasons for not achieving good status/potential we assigned a level of confidence to each of the reasons. With appropriate data and evidence we were able to confirm the reasons for not achieving good status/potential. For example, monitoring data from upstream and downstream of a sewage treatment works can be used to confirm that pollution from waste water is a significant factor affecting the ecological status. There are, however, further reasons for not achieving good status that are more difficult to quantify and monitor. For example, our data can be used to illustrate the problems caused by sediment on the ecology within the river however identifying the source is more difficult. Where possible we have used modelling to help to identify sources but this has not been possible for all catchments. The graphs within this document only show the reasons for not achieving good status/potential that have been confirmed. Measures to improve the water environment have been assessed. Some of these measures will benefit more than 1 water body or catchment and some are very specific. The cumulative effect and benefits of measures for the operational catchment have been considered. The measures proposed for this catchment are shown in the table below.

56
Table 14 Proposed measures in the Lower Nene operational catchment
Improve modified physical habitats • Improvement to condition of channel/bed and/or banks/shoreline
• Improvement to condition of riparian zone and /or wetland habitats
• Vegetation management
Managing pollution from waste water • Mitigate/remediate point source impacts on receptor
Issues impacting the Lower Nene operational catchment have been identified through the River Nene Regional Park Integrated Catchment Management Plan and discussions with relevant Internal Drainage Boards. Run-off from agricultural land within the catchment is not such an issue here as in other catchments, due to the flat topography and soil types. All the water bodies are artificial or highly modified, where water levels are carefully controlled to provide as efficient drainage as possible for the prime agricultural land, as well as allowing as much available water for agricultural use as possible, and at the same time allowing sufficient levels to promote the ecological benefit of the drains. Point source discharges provide input of nutrient that if reduced could benefit the water bodies. Some of the internal board drains are also popular coarse fisheries, where fish populations would benefit from habitat improvement; typically providing cover, shading and spawning habitat. Measures to dilute and contain as much as possible saline intrusion on some watercourses could prevent negative impacts on the water body ecology. All of these measures are considered to be needed to improve the water environment to as near to good status/potential as practicable. The costs and benefits of the measures have been considered in the catchment economic appraisal, results of which are shown below. You can find out more detail on the status and long term objectives by using the Catchment Data Explorer tool at: http://environment.data.gov.uk/catchment-planning/
3.6.1 Lower Nene catchment economic appraisal and environmental assessment
3.6.1.1 Results and recommendation Measures proposed to improve the water environment to good status/potential (where it is considered to be potentially achievable) in this catchment are cost beneficial; the benefits are greater than the costs. Their effects on the wider environment have been considered. The results of the economic appraisal are shown below.

57
Net present value
£0.037 million
Benefit cost ratio
1.003
Present value benefits
£11.584 million
Present value costs
£11.547 million
3.6.1.2 Monetised costs and benefits of implementing the measures proposed for this catchment17
This means that for every pound that is spent towards improving the water environment in this catchment, you could expect to receive £1.003 of benefits.
3.6.1.3 Benefits and costs of implementing the measures proposed for this catchment18
Table 15 Wider benefits and disbenefits to society in the Lower Nene operational catchment
Ecosystem Service Benefits and disbenefits to society
Positive or negative impact ˄˄: very positive ˄: positive 0: neutral ˅: negative ˅˅: very negative
Freshwater, Provision of Habitat ˄˄
Climate Regulation, Water Regulation, Recreation and Tourism ˄
Cultural Heritage19 ˅
Impacts on the freshwater and provision of habitat ecosystem services (wider benefits) are particularly important in the results of this economic appraisal. The
17 The benefits and costs are shown in ‘Present Value’ terms, which is a way of expressing the value of costs and benefits that will happen in the future in today’s money. We apply a ‘discount’ rate and benefits to reflect people’s preference for receiving goods and services now rather than later.
18Improving the water environment has wider benefits than those we have been able to monetise in the appraisals. We have
identified these using ecosystem services. An ecosystem service is a ‘service’ that the natural environment provides that improves our quality of life. 19 Although we are not aware of any specific negative effects at this stage, potential issues will need to be considered at project level and appropriate mitigation measures taken.

58
impacts will significantly benefit society and although they have not been valued and monetised as part of this economic appraisal, further support the proposed measures for this catchment. The Final Appraisal Report and associated documents provide a more detailed summary of these results. This can be requested at [email protected]
3.6.2 Possible scale of improvement for the Lower Nene operational catchment
The information presented so far has focused on the proposed long term objectives for the water environment, based on preventing drop in status and delivering all improvements which are technically feasible and worthwhile. This section focuses on the possible scale of improvement which could happen in the period to 2021, based on current knowledge of plans and actions. The table below indicates what is currently known about the availability of some key mechanisms to deliver improvements by 2021. In this operational catchment: Yes or No Have measures been implemented (or are secured for 2014-15) that will deliver improvements that have not yet been reflected in classification results? For example; Catchment Sensitive Farming, Catchment Restoration Fund Projects
Yes
Are there measures planned to deliver Protected Area objectives that will also contribute to improvements in water body status?
No
Has this operational catchment been identified in water company draft business plans as an area for improvement?
No
Has this operational catchment been identified as a priority for action under the new environmental land management schemes (NELMS)?
Yes
Have the local catchment partnership identified measures they are likely to secure funding for, which will bring about improvement within the second cycle?
Yes
Are any additional improvement measures included in Environment Agency or other statutory plans?
Yes
Based on our understanding of the information above, and our catchment knowledge, we have medium confidence that this operational catchment will see an improvement towards the proposed long term objectives by 2021.

59
4 What do you think? In order to produce a river basin management plan and a flood risk management plan, it is important that the people who understand the local area are able to contribute to these plans. The draft update to the river basin management plan provides information on the river basin district and then asks you to consider a number of questions. To help you provide feedback at the level that is most relevant to you, the catchment summaries summarise the river basin planning information at a more local scale.
• To see the full set of consultation questions, please go to: https://consult.environment-agency.gov.uk/portal/ho/wfd/draft_plans/consult?pointId=s1405417862790#section-s1405417862790
• To see the flood risk management plan questions, please go to
www.gov.uk/government/consultations/draft-flood-risk-management-plans Your answers to the questions above will help inform the final plans and ensure that the objectives they contain will help drive the protection, enhancement and improvement of the water environment for all its users. For further information on how to provide your answers to these questions, please go to section 6.1 How to respond.
4.1 How to respond The Environment Agency would prefer you to respond online at: https://consult.environment-agency.gov.uk/portal/ho/wfd/draft_plans/consult?pointId=s1405417862790#section-s1405417862790This will allow you to manage your comments more effectively, while helping us to gather and summarise responses quickly and accurately.
Finding out more
• River Nene Regional Park http://www.riverneneregionalpark.org/ • Nene Valley Nature Improvement Area http://www.nenevalleynia.org/ • Proposed update to the Anglian river basin management plan:
https://consult.environment-agency.gov.uk/portal/ho/wfd/draft_plans/consult?pointId=s1405417862790#section-s1405417862790
• Strategic Environmental Assessment Report: http://ea.objective.co.uk/file/3078905

60
Alternatively, there is a Word response form available for each river basin district which you can download and use to write your response before you submit it online, or you can email it to [email protected] You can view the consultation documents and consultation questions online. But, if you would prefer a printed version of the document, please call the Environment Agency's contact our National Customer Contact Centre on 03708 506 506 (local rate). Please return written responses by 10 April 2015.
4.2 What the Environment Agency will use the responses for The Environment Agency will use the responses from this consultation to update the Anglian river basin management plan. Environment Agency staff dealing with this consultation will see all responses in full. Other Environment Agency staff may also see the responses to help them plan future consultations. A full summary of the responses will be published on the Environment Agency website.
4.3 How the Environment Agency will use your information The Environment Agency will make all comments (apart from personal information) publicly available on the Environment Agency website. This includes comments received online, by email, post and by fax, unless you have specifically requested that your response be kept confidential. Only names of organisations that respond and not individuals will be published. If you respond online or provide an email address, you will receive an acknowledgement of your response. After the consultation has closed a summary of the responses will be published on the Environment Agency website. You will be contacted to let you know when this is available. You will also be notified of any forthcoming river basin consultations unless you request otherwise. Under the Freedom of Information Act 2000, the Environment Agency may be required to publish your response to this consultation, but will not include any personal information. If you have requested your response be kept confidential, it may still be required to provide a summary. If you have any questions or complaints about the way this consultation has been carried out, please contact:
Cath Beaver, Consultation Co-ordinator
Environment Agency, Horizon House, Deanery Road, Bristol, BS1 5AH

61