THE NEED TO ADOPT A PROACTIVE APPROACH …documents.worldbank.org/curated/en/... · Proactive...
52
J U N E 2 0 1 7 Flood Risk Management at River Basin Scale: THE NEED TO ADOPT A PROACTIVE APPROACH KNOWLEDGE NOTES Urban Floods Community of Practice Adri Verwey, Yann Kerblat, and Brendan Chia Photo credit: xuanhuongho. Public Disclosure Authorized Public Disclosure Authorized Public Disclosure Authorized Public Disclosure Authorized
Transcript of THE NEED TO ADOPT A PROACTIVE APPROACH …documents.worldbank.org/curated/en/... · Proactive...

J U N E 2 0 1 7
Flood Risk Management at River Basin Scale:T H E N E E D T O A D O P T A P R O A C T I V E A P P R O A C H
KN
OW
LE
DG
E N
OT
ES
Urb
an
Flo
od
s C
om
mu
nit
y o
f P
rac
tic
e
Adri Verwey, Yann Kerblat , and Brendan Chia
Photo credit: xuanhuongho.
Pub
lic D
iscl
osur
e A
utho
rized
Pub
lic D
iscl
osur
e A
utho
rized
Pub
lic D
iscl
osur
e A
utho
rized
Pub
lic D
iscl
osur
e A
utho
rized

F L O O D R I S K M A N A G E M E N T AT R I V E R B A S I N S C A L E : T H E N E E D T O A D O P T A P R O A C T I V E A P P R O A C H2
Abbreviations ...................................................................................................................................3Summary............................................................................................................................................41. Introduction ...................................................................................................................................................5
Objectives of This Technical Note ..............................................................................................................................................7
Institutional Aspects ......................................................................................................................................................................8
Key Messages for Decision Makers Involved in Flood Management .................................................................................8
Observed Trends in Flood Causes and Damages .....................................................................................................................18
2. Understanding River Basin Floods ........................................................................................ 20Characteristics and Origin of Flood Events ...............................................................................................................................20
The Threat of Peak Discharges ...................................................................................................................................................21
Integrated River Basin System ....................................................................................................................................................23
Role of Floodwater Storage..........................................................................................................................................................24
Role of Channel Conveyance Capacity ......................................................................................................................................26
3. Flood Management Options ..................................................................................................... 28The Impossibility of Totally Avoiding Floods .............................................................................................................................28
Proactive Versus Reactive Approach .........................................................................................................................................32
Flood Hazard and Flood Risk ........................................................................................................................................................33
Structural and Nonstructural Measures ....................................................................................................................................36
4. Flood Risk Assessment Methodology .........................................................................37A Simple Approach to Flood Hazard Mapping: The Gumbel Method ...................................................................................38
Numerical Simulation Models .....................................................................................................................................................39
Variety of Flood-Forcing Factors ..................................................................................................................................................40
Flood Risk Mapping........................................................................................................................................................................41
Critical Infrastructure ....................................................................................................................................................................42
5. Data Needs for Flood Risk Assessment ......................................................................43Data Needs for Statistical Analyses ...........................................................................................................................................44
Data Needs for Model Development ...........................................................................................................................................45
Digital Elevation Models ...............................................................................................................................................................46
6. Summary: Key Principles for Flood Risk Management in River Basins ....................................................................48
Flood Management Considerations ............................................................................................................................................48
Implementing Context-Specific Interventions to Manage Flood Risks in River Basins ...................................................49
References and Additional Reading Material ..........................................................................................................................50
C O N T E N T S

F L O O D R I S K M A N A G E M E N T AT R I V E R B A S I N S C A L E : T H E N E E D T O A D O P T A P R O A C T I V E A P P R O A C H 3
DEM digital elevation model
DSM digital surface model
DTM digital terrain model
EU European Union
FMMP flood management master plan
GIS geographic information system
IDF intensity-duration-frequency
IRB international river basin
SRTM Shuttle Radar Topography Mission
SUDS sustainable urban drainage systems
1D one-dimensional
2D two-dimensional
1D2D integrated 1D and 2D
A B B R E V I A T I O N S
Development of th is note was led by Abigai l Baca and Dzung Huy Nguyen . The document was prepared by Adri Ver wey , Yann Kerblat , and Brendan Chia . Peer review comments were received from Christophe Prevost , Toshihiro Sonoda , and Xiaokai Li . The note was edi ted by Anne Himmelfarb and des igned by Johanna Mora.
The knowledge note was prepared under the auspices of the Urban Floods Community of Practice (UFCOP). UFCOP is a global knowledge initiative led by the World Bank with support from the Global Facility for Disaster Reduction and Recovery (GFDRR) and others.

F L O O D R I S K M A N A G E M E N T AT R I V E R B A S I N S C A L E : T H E N E E D T O A D O P T A P R O A C T I V E A P P R O A C H4
The number of people living in flood-prone areas is estimated to be 1.3 billion by 2050, or 15 percent of the global population. This number represents an increase of 0.3 billion over the present (Ligtvoet et al. 2014) and takes into account both river and coastal flooding. Looking at river flooding specifically, the World Resources Institute (2015) has demonstrated that this hazard affects 21 million people around the world every year. In 2030, that number could rise to 54 million per year, with ongoing urbanization and climate change driving the increase and putting more people in harm’s way.
While large infrastructure investments are being made to mitigate flood disaster risk, disasters continue to take their toll, in part because of ongoing changes in land use and land management. In rural areas, for example, agricultural fields are gradually replacing forests, and drainage improvements for agricultural land have led to increased flood peaks. Developments have also taken place in urban areas, where natural land cover is converted to paved, impervious surfaces over which rainfall runs more rapidly into drains and rivers. The construction of urban drainage systems may also release runoff more quickly into water bodies that are downstream and that may have insufficient carrying capacity. This trend can therefore increase the risk of flooding over time.
Across regions, decision makers and at-risk populations have realized that they can no longer afford to wait for the next flood to come. Developed countries have made progress in instituting policy reforms and putting in place integrated solutions for flood risk management, but developing countries too are growing more interested in implementing methods and policies for improving flood risk management at the river basin level. This Technical Note offers substantial guidance for decision makers tasked with considering flood management options.
The note addresses the following issues: It examines the nature of floods, focusing in particular on the important function of flood volume retention and the conveyance of excess water out of river basins. Based on this account, it discusses flood management options that can be implemented as part of a proactive approach, one that seeks to avoid the disasters that may result from a “wait and see” approach. In this context, it describes the role of flood hazard and flood risk mapping in decision making. The note also explores the distinct roles and comparative advantages of structural and nonstructural measures in managing flood risk. In addition, it provides guidance on flood risk assessment methodologies, including the role of numerical simulation models and their data requirements, and also includes a summary of the key principles of flood risk management. All these parts together serve to demonstrate the importance of understanding flood phenomena and assessing flood risks.
To ensure that the principles outlined in this document are as actionable as possible, the key messages are summarized here: (1) absolute flood protection in flood-prone areas is not possible or desirable, and some calculated acceptance of “living with floods” is necessary; (2) flood risk management investments—particularly nonstructural measures—provide an attractive economic rate of return; and (3) flood risk management interventions may have a significant impact (e.g., increase or decrease of flood risk) in areas outside where they are implemented.
S U M M A R Y

F L O O D R I S K M A N A G E M E N T AT R I V E R B A S I N S C A L E : T H E N E E D T O A D O P T A P R O A C T I V E A P P R O A C H 5
1 . I N T R O D U C T I O N
Floods accounted for 47 percent of all weather-related disasters from 1995 to 2015, and affected more people than any other disaster during that period. Between 1995 and 2015, floods affected 2.3 billion people and killed 157,000 (UNISDR/CRED 2015). During this period, average annual global losses due to floods amounted to almost US$20 billion. Between 2005 and 2014, the number of floods per year also rose to an average of 171, up from an annual average of 127 in the previous decade (figure 1).
The number of people living in flood-prone areas is estimated to be 1.3 billion by 2050, or 15 percent of the global population. This number represents an increase of 0.3 billion over the present (Ligtvoet et al. 2014). Floods are among the most frequent hazards, and along with other related hydrological hazards they are becoming more prominent. Flood disasters continue to occur even after large infrastructure investments are made to mitigate their effects.
When risks related to river and coastal floods (which are a major source of evolving hazard) are combined with population increase and rapid urbanization, it is clear that an increasing number of communities are being placed at risk. According to the World Resources Institute (2015), river floods affect 21 million people around the world every year. By 2030, that number could rise to 54 million, with ongoing urbanization, population growth, inadequate maintenance of flood management infrastructure, and climate change driving the increase and putting more and more people in harm’s way (figure 2).
1 9 8 0 – 2 0 1 6
0
600
1200
1980 1986 1990 1995 2000 2005 2010 2015
Geophysical Events Earthquakes, Tsunamis, Volcanic Activity
Meteorological Events Tropical storm, Extra tropical Storm, Convective Storm, Local Storm
Hydrological Events Flood, Mass Movement
Climatological Events Extreme Temperatures, Drought, Wildfire
Source: Munich Re 2016b.
FIGURE 1: Number of Loss Events

F L O O D R I S K M A N A G E M E N T AT R I V E R B A S I N S C A L E : T H E N E E D T O A D O P T A P R O A C T I V E A P P R O A C H6
Rest of the World
0.19CambodiaIraq
Congo, Dem Rep.Thailand
BrazilNigeria
AfghanistanMyanmar
EgyptIndonesia
Pakistan
VietnamChina
BangladeshIndia
0.19
0.24
0.25
0.27
0.29
0.33
0.39
0.46
0.64
0.71
0.93
3.28
3.48
4.84
Annual Expected Population Affected by River Floods (Millions)
4.24
The top 15 countries with greatest population exposed to river flood risk are either least developed or developing countries, which are the most vulnerable to natural disasters and climate change.
Source: World Resources Institute 2015.
In spite of large infrastructure investments made to mitigate disaster risk, disasters continue to take their toll. One of the principal causes is the continuing changes in land use and land management. Rapid urbanization and development of industrial estates have significantly increased flood hazard and exposure, while efforts to reduce vulnerability have only fractionally compensated this increase. In rural areas, agricultural fields are gradually replacing forests, and drainage improvements for agricultural land have led to increased flood peaks. In urban areas, the principal problem is that natural land is converted to paved surfaces over which storm water runs more rapidly into drains and rivers. The increased speed of runoff leads to higher runoff peaks in the downstream drainage channels. In addition, improvement of existing urban drainage systems often contributes to increased peak flows, as such systems may release storm water quicker than before. These increased peak flows may damage infrastructure, such as bridges, or lead to overtopping and failure of embankments. In the longer run, climate change impacts are expected to accentuate higher peak flows in rivers and backflow from the sea. To mitigate the negative impacts, good planning and the construction of compensatory infrastructure is required.
Across regions, decision makers and at-risk populations have realized that they can no longer afford to wait for the next flood to come. Attitudes are currently shifting; there is growing recognition of the need to better understand what causes floods and what can be done to minimize damages and losses. On one hand, this shift in attitude is leading to improved flood protection systems, primarily structural interventions. On the other hand, there is a realization that despite these investments a residual risk will always exist. Thus to a certain extent, governments and communities have to adopt a “living with floods” approach and to invest in measures—primarily nonstructural measures—that reduce losses in the inevitable event of a flood.
FIGURE 2: Countries With The Largest Populations Exposed To River Floods

F L O O D R I S K M A N A G E M E N T AT R I V E R B A S I N S C A L E : T H E N E E D T O A D O P T A P R O A C T I V E A P P R O A C H 7
Managing flood risk is challenging due to the different responses required for different types of floods. Floods present themselves in different forms, such as flooding of river floodplains, flash floods in steeper river basins, coastal flooding from the sea (including tsunamis), and rainfall-induced flooding of urban areas. Managing these different types of floods requires different approaches.
Furthermore, floods can have a direct relation to another disaster—and vice versa (GFDRR 2016). For example, floods and droughts are opposites and partially conflicting in their management, but drought conditions could increase the risk of flash flooding in the event of heavy rain. Dry, compacted soils absorb rainfall less easily, increasing the likelihood of flooding if a drought-stricken area is hit by storms. Other related sets of hazards also exist: Tsunamis are directly related to the occurrence of earthquakes. Floods and typhoons often coincide because of typhoons’ strong winds and very moist air. Finally, floods and landslides often occur jointly as a result of heavy rainfall.
Objectives of This Technical Note
This note focuses on flood risks
(with a particular focus on river flood
risks) with the objective of providing
guidance to government officials,
specialists, and other stakeholders
across various disciplines involved
in flood risk management. It seeks
to inform and facilitate the sets of
activities described in FIGURE 3.
FIGURE 3. Activities Dealing with River Flood Risk Management
Decision making for flood risk management activities, including prioritization of ex ante investments
Essential operations and maintenance activities of flood protection works
Support for handling flood emergencies (including strengthening preparedness)
Preparation of projects (specification
of objectives and tasks)
Guidance in the execution of technical studies and other projects
Highlighting of the importance of surveying
and monitoring data

F L O O D R I S K M A N A G E M E N T AT R I V E R B A S I N S C A L E : T H E N E E D T O A D O P T A P R O A C T I V E A P P R O A C H8
The note is structured in the following way: S e c t i o n 2 examines the nature of floods, with a focus on the important function of flood volume retention and the conveyance of excess water out of river basins. This account forms the basis for the discussion in s e c t i o n 3 on flood management options that can be implemented as part of a proactive approach, one that seeks to avoid the disasters that may result from a “wait and see” approach. This section also describes the role of flood hazard and risk mapping in decision making, as well as the distinct roles and comparative advantages of structural and nonstructural measures. S e c t i o n 4 provides guidance on flood risk assessment methodologies, including the role of numerical simulation models; s e c t i o n 5 considers the data requirements of these models. The note concludes with a summary of the key principles of flood risk management. Taken together, these parts serve to demonstrate the importance of understanding flood phenomena and techniques for assessing flood risks.
To ensure that the principles outlined in this note are as actionable as possible, the key messages are summarized here:
1. Absolute flood protection in flood-prone areas is not possible or desirable, and some calculated acceptance of “living with floods” is necessary;
2. Flood risk management investments—particularly nonstructural measures—provide an attractive economic rate of return, depending on the actual situation in a river basin; and
3. Flood risk management interventions may have a significant impact (e.g., increase or decrease flood risk) in areas outside where these are implemented.
Institutional Aspects
Management of floods—both the planning before floods and the handling of emergency
situations—is a complex task because it involves many government agencies and other
stakeholders. Another complication is that river basins often overlay parts of different countries,
provinces, and municipalities, increasing the number of parties involved in managing them. Finally,
river basins do not always have their own authorities, budgets, or mandates. These multi-jurisdictional
aspects of river basin management may make it difficult to handle investments required for flood
management. A first step is often to create better institutional arrangements. Compromises have to
be found to respect the interests of many parties, and these have to be laid down in laws.
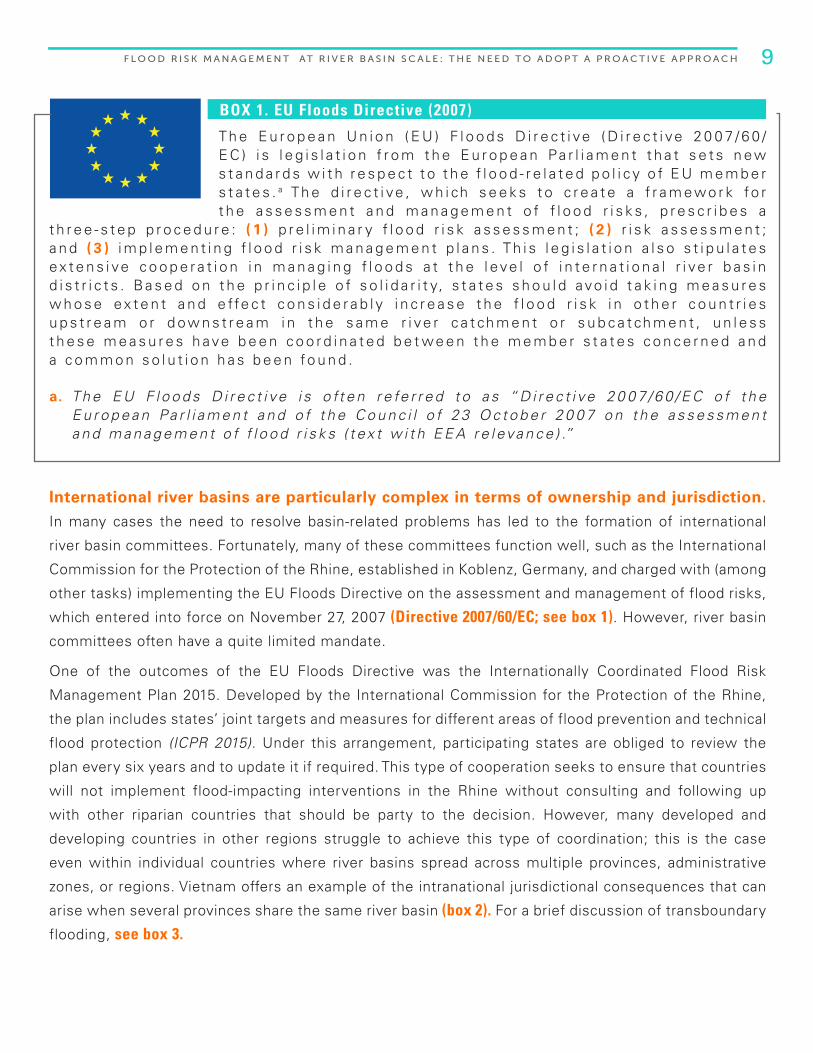
F L O O D R I S K M A N A G E M E N T AT R I V E R B A S I N S C A L E : T H E N E E D T O A D O P T A P R O A C T I V E A P P R O A C H 9
BOX 1. EU Floods Directive (2007)
Th e E u r o p e a n U n i o n ( E U ) F l o o d s D i r e c t i ve ( D i r e c t i ve 2 0 0 7 / 6 0 /E C ) i s l e g i s l a t i o n f r o m t h e E u r o p e a n Pa r l i a m e n t t h a t s e t s n ew s t a n d a r d s w i t h r e s p e c t t o t h e f l o o d - r e l a t e d p o l i c y o f E U m e m b e r s t a t e s . a Th e d i r e c t i ve , w h i ch s e e k s t o c r e a t e a f r a m ewo r k fo r t h e a s s e s s m e n t a n d m a n a g e m e n t o f f l o o d r i s k s , p r e s c r i b e s a
t h r e e - s t e p p r o c e d u r e : ( 1 ) p r e l i m i n a r y f l o o d r i s k a s s e s s m e n t ; ( 2 ) r i s k a s s e s s m e n t ; a n d ( 3 ) i m p l e m e n t i n g f l o o d r i s k m a n a g e m e n t p l a n s . Th i s l e g i s l a t i o n a l s o s t i p u l a t e s ex t e n s i ve c o o p e r a t i o n i n m a n a g i n g f l o o d s a t t h e l eve l o f i n t e r n a t i o n a l r i ve r b a s i n d i s t r i c t s . Ba s e d o n t h e p r i n c i p l e o f s o l i d a r i t y, s t a t e s s h o u l d avo i d t a k i n g m e a s u r e s w h o s e ex t e n t a n d e ffe c t c o n s i d e r a b l y i n c r e a s e t h e f l o o d r i s k i n o t h e r c o u n t r i e s u p s t r e a m o r d ow n s t r e a m i n t h e s a m e r i ve r c a t ch m e n t o r s u b c a t ch m e n t , u n l e s s t h e s e m e a s u r e s h ave b e e n c o o r d i n a t e d b e t we e n t h e m e m b e r s t a t e s c o n c e r n e d a n d a c o m m o n s o l u t i o n h a s b e e n fo u n d .
a. Th e E U F l o o d s D i r e c t i ve i s o ft e n r e fe r r e d t o a s “ D i r e c t i ve 2 0 0 7 / 6 0 / E C o f t h e E u r o p e a n Pa r l i a m e n t a n d o f t h e C o u n c i l o f 2 3 O c t o b e r 2 0 0 7 o n t h e a s s e s s m e n t a n d m a n a g e m e n t o f f l o o d r i s k s ( t ex t w i t h E E A r e l eva n c e ) .”
International river basins are particularly complex in terms of ownership and jurisdiction.
In many cases the need to resolve basin-related problems has led to the formation of international
river basin committees. Fortunately, many of these committees function well, such as the International
Commission for the Protection of the Rhine, established in Koblenz, Germany, and charged with (among
other tasks) implementing the EU Floods Directive on the assessment and management of flood risks,
which entered into force on November 27, 2007 (Directive 2007/60/EC; see box 1). However, river basin
committees often have a quite limited mandate.
One of the outcomes of the EU Floods Directive was the Internationally Coordinated Flood Risk
Management Plan 2015. Developed by the International Commission for the Protection of the Rhine,
the plan includes states’ joint targets and measures for different areas of flood prevention and technical
flood protection (ICPR 2015). Under this arrangement, participating states are obliged to review the
plan every six years and to update it if required. This type of cooperation seeks to ensure that countries
will not implement flood-impacting interventions in the Rhine without consulting and following up
with other riparian countries that should be party to the decision. However, many developed and
developing countries in other regions struggle to achieve this type of coordination; this is the case
even within individual countries where river basins spread across multiple provinces, administrative
zones, or regions. Vietnam offers an example of the intranational jurisdictional consequences that can
arise when several provinces share the same river basin (box 2). For a brief discussion of transboundary
flooding, see box 3.

F L O O D R I S K M A N A G E M E N T AT R I V E R B A S I N S C A L E : T H E N E E D T O A D O P T A P R O A C T I V E A P P R O A C H10
BOX 2. Vietnam Case Study: The Need for Integrated Disaster Risk Management at the River Basin Level
Water and watershed management normally requires an integrated basinwide
approach. Yet in Vietnam, regulation of river basins is the jurisdictional domain
of individual provinces: Vietnam has developed 63 administrative zones at the
provincial level that do not coincide with river basin boundaries. As storm
water and floodwater may pass freely from zone to zone, their management
and mitigation need to be addressed in a coordinated manner. Uncoordinated
activities not only affect the sustainability of water use and the health of
natural resources within tributary basins, but may also actually exacerbate the risks posed
by storms and floods, particularly in downstream locations. Vietnam should move toward a
river basin approach, specifically by putting in place river basin committees (which may be
given a special jurisdictional status), creating basin risk maps, and mainstreaming disaster
risk management into all river basin plans in relevant provinces (Molle and Hoanh 2009).
Another institutional issue to be resolved in Vietnam is the free exchange of data monitored
or surveyed under the jurisdiction of a particular ministry. Making such data freely available
t o o t h e r m i n i s t r i e s f a c i l i t a t e s t h e d e v e l o p m e n t o f r e l i a b l e f l o o d m a n a g e m e n t
m a s t e r p l a n s , w h i ch f o r m t h e b a ck b o n e o f l a n d u s e p l a n n i n g a n d i n v e s t m e n t s t o
r e d u c e f l o o d r i s k s i n r i v e r b a s i n s .
VI E TN
AM
In most countries there is a strong need for cooperation between various water-related
stakeholders, in particular government agencies. The exploitation of multipurpose reservoirs
forms a clear example. When a reservoir is primarily used for hydropower development, there is an
interest in keeping water levels in the reservoir as high as possible. This contradicts the requirement for
the reservoir’s use in flood management, which depends on having storage capacity available. A similar
conflict of interest, though less extreme, exists for reservoirs also used for irrigation water or urban
water supply. The joint exploitation of such reservoirs requires well-defined institutional arrangements
that are embedded in laws or bilateral agreements. Fortunately, recent developments in technology
facilitate and support cooperation across agencies. For example, the current state-of-the-art in flood
forecasting technology, often operational under the responsibility of a ministry of environment, also
allows for real-time control of reservoirs under the jurisdiction of another ministry; in other words, flood
forecasting and reservoir control can quite easily be combined into the same tool, while each of the
responsible agencies maintains its own control based upon its own responsibilities.

F L O O D R I S K M A N A G E M E N T AT R I V E R B A S I N S C A L E : T H E N E E D T O A D O P T A P R O A C T I V E A P P R O A C H 11
BOX 3. Transboundary Flooding
A study of 1,760 river floods by Marloes H. N. Bakker (2009) found that
“some 175 river floods were shared by two or more countries.” At the global
level, these floods “accounted for 32% of all casualties, almost 60% of all
affected individuals and 14% of all financial damage” (Bakker 2006)—clearly
a sign of “the massive impacts of…transboundary flood events on a global scale.” These
figures might also be a sign that river basins that fall within a single country have better
flood protection than transboundary river basins. One explanation for the weaker flood
protection in international river basins (IRBs) is that these basins lack the institutional
capacity to deal with transboundary floods. However, this lack of capacity may be
linked to the absence of common budget allocation agreements for transboundary flood
management. Bakker (2006, 2009) found that the existing IRB institutions were dealing
with water management in general and not merely with flooding problems. She also
concluded that IRBs with flood-specific institutional capacity suffered less flood damage
than IRBs without such capacity. In other words, giving sufficient attention to flooding
issues and making sure that institutional capacity is developed can reduce the impact of
transboundary floods. Most likely, similar conclusions can be drawn about flood damages
in interprovincial river basins within a country.
An important aspect of cooperation within a river basin is information and data sharing.
River basin planning and management demand an integrated approach in which countries, provinces,
and municipalities share information on water-related issues in basin management plans, including
water resources management, irrigation demands, urban water supply, hydropower generation,
navigation, flood management, drought management, aquaculture, and ecosystem management. For
interprovincial-level flood management in a river basin within a single country, certain cooperation
mechanisms and institutional arrangements between ministries and provincial directorates are highly
recommended and are often considered as global best practices. These are shown in figure 4.

F L O O D R I S K M A N A G E M E N T AT R I V E R B A S I N S C A L E : T H E N E E D T O A D O P T A P R O A C T I V E A P P R O A C H12
FIGURE 4. Cooperation Mechanisms Recommended For River Basin Flood Management At The Interprovincial Level
Sharing of information on flooding problems, dialogue and coordination, flood risk assessment, development plans, plans for flood management projects, and other plans that may affect flood hazards
Sharing of monitored data, including rainfall data, river discharge and reservoir release data, and water-level data for reservoirs, rivers, estuaries, and coasts
Joint realization of flood forecasts and maintenance of the system, and (depending on the scale of the basin) sharing of flood emergency warning and associated services
Shared funding of flood management measures on the basis of benefits achieved by various beneficiaries, and interagency compensation payments for negative impacts
Key Messages for Decision Makers Involved in Flood Management
Urbanization has significantly increased flood peak runoff, while recurring flooding of
agricultural land has led to production losses, food shortages, and rural undernutrition
(UNISDR/CRED 2015). As urban areas expand, particularly in Asia and Africa, tens of trillions of
dollars in infrastructure, industrial and office buildings, and homes will be increasingly at risk from
river and coastal flooding (see figure 5). The nature of disastrous floods has also changed in recent
years, with flash floods and acute riverine and coastal flooding becoming increasingly frequent. People
living in flood-prone areas are often protected (or protect themselves) against floods to some degree,
although many regions suffer a flood safety deficit. Unfortunately, the actual protection levels are not
known globally, nor are the future flood risk strategies and protection levels across the various cities
and regions of the world.
RIVER BASIN FLOOD MANAGEMENT

F L O O D R I S K M A N A G E M E N T AT R I V E R B A S I N S C A L E : T H E N E E D T O A D O P T A P R O A C T I V E A P P R O A C H 13
Source: PBL Netherlands.
0
8,000
16,000
2010 2020 2030 2040 2050
Billion U.S. DollarsGDP in Flood-Prone Areas
Developed Countries
Latin America and the Caribbean
East Asia and Pacific
Russia Region and Central Asia
Middle East and North Africa
South Asia
Sub-Saharan Africa
FIGURE 5: Comparison Of Regional Trends In Gross Domestic Product At Risk
2 0 1 0 – 2 0 5 0
Studies of flood management projects demonstrate that it is more cost-effective to spend
money prior to a disaster than to pay for post-disaster relief and reconstruction (Hawley,
Moench, and Sabbag 2012). Put differently, these calculations show that it pays to adopt a more
proactive approach to flood management, especially if this approach focuses in part on the evaluation
of the risks associated with developments in flood-prone areas.
Suggesting that urbanization of flood-prone areas should be avoided is not a sensible
recommendation for land development; it is too simplistic and omits important
considerations, such as land availability as a limiting factor. The issue is not just how flood
damages can be avoided. The bigger issue is how the difference between benefits and costs for this
land use can be maximized. This effort should take into consideration the costs associated with the safe
use of assets and the economic and social benefits these assets provide in return. Costs associated
with providing protection against floods are just one of the many factors in the evaluation of land
development decisions, along with land acquisition, construction costs, etc.

F L O O D R I S K M A N A G E M E N T AT R I V E R B A S I N S C A L E : T H E N E E D T O A D O P T A P R O A C T I V E A P P R O A C H14
It is for this reason that some countries have started to follow the example of the Netherlands
and build below mean sea level. Singapore, for example, is in an advanced stage of reclaiming
land from the sea for its continuing housing development on the very limited space available. The
development of flood-prone areas requires detailed studies of how damages and losses can be limited
to economically feasible levels. In other words, investments and other measures supporting flood
protection also provide benefits beyond the mitigation of flood risk and the reduction of loss when a
flood strikes. Flood protection investments also unlocks economic potential thanks to reduced risks,
and can generate development co-benefits such as ecosystem services, transportation uses, and
agricultural productivity gains, even in the absence of floods.
Flood risk management involves striking a balance between structural and nonstructural
measures (listed in figure 6).
FIGURE 6. Structural Versus Nonstructural Flood Mitigation Measures
STRUCTURAL MEASURES
• Aim to reduce flood risks by keeping floods away from people and assets
• Construct dikes, storm surge barriers, coastal lagoons with sand barriers, reservoirs, and other flood retention facilities; construct bypasses and other flood conveyance improvement interventions; raise local land levels.
NONSTRUCTURAL MEASURES
• Aim to keep people safe from flooding through better planning and management of human sett lements.
• Prescribe building codes, flood proofing of buildings, prioritization of specific types of building material, flood forecasting, and flood warning and timely information provision; install temporary flood barriers; improve flood risk awareness and improve institutional arrangements.
Structural measures aim primarily at protecting a specific geographical area. The need for
protection depends on the level of flood hazard for that area and on its level of exposure, including
future or planned exposure. Exposure is relatively low for agricultural land, while it is much higher for an
industrial estate. Consequently, areas with a high economic interest require a higher level of protection
than areas with a lower economic return. The objective of structural flood management interventions
is to reduce the combined effect of flood hazard and exposure, either by lowering the peak flood levels
or by increasing the levels of protecting barriers, such as dikes. An effective way to reduce peak flood
levels is to spread the runoff of the flood volume along rivers or drainage systems over a longer time
span. In general, the growing tendency across regions is toward a more proactive approach to floods,
rather than a reactive one (see figure 7).

F L O O D R I S K M A N A G E M E N T AT R I V E R B A S I N S C A L E : T H E N E E D T O A D O P T A P R O A C T I V E A P P R O A C H 15
FIGURE 7. “ B u y i n g D o w n T h e R i s k ”
Initial Risk
Zoning
Building Regulations
Early Warning System
Engagement Awareness Campaigns
Improved Drainage
Structural Defenses
R I S K R E D U C T I O N T O O L S
RISK
RESI
DUAL
RIS
K
Note: “Buying down the risk” refers to the reduction of risk by investments in risk reduction measures.
Source: Jha, Bloch, and Lamond 2012.
Reducing peak discharges and peak flood levels is a primary target in reducing flood
damages. It is often achieved by delaying runoff of storm water (see figure 8). Large-scale solutions include constructing reservoirs in upstream river basins or improving the rules of reservoir operation in favor of flood protection, although these approaches tend to compete with efforts to reduce drought impact and/or generate hydropower. In urban environments, the effort to apply the same principle (delaying the runoff of storm water) involves searching for micro-storage options. This has led to the concept of sustainable urban drainage systems (SUDS). The use of a large number of small-scale interventions in the urban environment, such as the mobilization of emergency storage on parks and playgrounds, reduces the speed of runoff and reduces peak flows in the drainage system. Usually these solutions are multipurpose and demonstrate clear co-benefits.
Another way to reduce peak flood levels is to increase the conveyance capacity of the
system or divert floodwater. In the first place, the increased flow capacity reduces flood levels for a given discharge. The application of this principle is observed in cities where smooth river embankments have been constructed to reduce peak flood levels that result from the passage of peak discharges. In other cases, flows are diverted around the city. Flooding problems are also often encountered in cities built where rivers meet the sea (e.g., Dar es Salaam, Cap-Haïtien). These may be due to river encroachment or sedimentation, often caused by increased sediment loads from upstream (e.g., from garbage, construction activities, or deforestation). Floods resulting from tropical storms in smaller river basins are hard to control by the construction of reservoirs. In these cases, the river’s flood outlet capacity has to be at least equal to the inlet capacity, so that dredging and widening of the river in the city or flow diversion may be the only feasible solutions to reduce flood risks. To ensure sustainable solutions, these interventions may have to be complemented with better erosion management, or with the construction of upstream sediment traps.

F L O O D R I S K M A N A G E M E N T AT R I V E R B A S I N S C A L E : T H E N E E D T O A D O P T A P R O A C T I V E A P P R O A C H16
FIGURE 8 . Overview Of Flood Risk Management Options At Catchment Scale
Source: Baca Architects; cited in Jha, Bloch, and Lamond 2012.
FIGURE 9 . Flood Peak Discharge Attenuation By Conveyance And Storage Devices Within A Catchment
Source: Baca Architects; cited in Jha, Bloch, and Lamond 2012.

F L O O D R I S K M A N A G E M E N T AT R I V E R B A S I N S C A L E : T H E N E E D T O A D O P T A P R O A C T I V E A P P R O A C H 17
In general, flood protection interventions are best realized as water retention works in (or at the upstream end of) flood-prone areas, whereas increased flood conveyance capacity interventions are most effective in (or downstream of) flood-prone areas. Upstream retention leads to a reduction in peak flows (see figure 9), with a positive flood reduction impact felt quite far downstream. When rivers pass through cities, the peak flow will cause flooding if the flood conveyance capacity is not sufficient to convey the flood within the river banks. However, the increased flow capacity may also lead to higher peak flows downstream. This is no problem for cities located in the river delta, close to the sea. At those locations the creation of capacity to convey the flood peak flows without overtopping the river banks is often a cost-effective measure. Decision making about which interventions to use should be based upon an integrated approach, where all options are studied and prioritized.
An integrated approach to flood management should be based upon the development of flood management master plans (FMMPs). Many countries follow this approach and develop FMMPs for their river basins and update them regularly. For example, it is common practice in Hong Kong to develop drainage master plans for small river basins and to update them approximately every 10 years.
FFMPs generally focus on reducing the negative impacts of floods, but they should also consider possible benefits from floods. In regions that do not use fertilizers to boost agricultural production, frequent flooding of agricultural lands brings fertilizing deposits to the fields. Along the banks of the Licungo River in Mozambique, for example, these fertilizing floods may make production of higher-value organic rice crops possible. In regions like this, there is a need to optimize the height of dikes so that they prevent excessive damage to agricultural production, while still allowing the benefits of fertilization. Dike construction technology also needs to minimize dike breaches in case of overtopping.
In an integrated approach, FMMPs promote a good understanding of how the river and drainage system functions. This allows for a balanced evaluation of positive and negative impacts of structural flood management interventions, which in turn facilitates the prioritization of proposed works. This process takes into account the positive impacts of investments along with the negative impacts, such as possible increased flood risks in downstream areas.
One issue an FMMP should address is how nonstructural measures contribute to reducing flood risks. Nonstructural measures focus primarily on reducing the vulnerability of people, assets, and economic values in the flood-prone area. Early warnings, for example, give people and businesses time to take protective measures, such as removing equipment to higher floors, installing temporary flood barriers, or installing mechanisms that elevate assets above expected floodwater levels to protect them (see figure 10). Nonstructural measures may very well be more cost-effective than structural measures. In any case, as full flood protection by structural measures is not realistic and complementary nonstructural measures are always needed, an FMMP should find a good balance between measures of both types.
FIGURE 10. Car On 1.5 M Stilts During The 2011 Bangkok Floods—A Practical Example Of Flood Risk Reduction Triggered As A Result Of Flood Warning
Photo credit: Dr. Nat Marjang.

F L O O D R I S K M A N A G E M E N T AT R I V E R B A S I N S C A L E : T H E N E E D T O A D O P T A P R O A C T I V E A P P R O A C H18
Nowadays, all FMMPs are based upon insight produced by numerical simulation models. These describe the hydrological or rainfall-runoff processes, if relevant for the situation, and the hydrodynamic processes of subsequent runoff in rivers and canals as well as over land. The inclusion of a hydrological model depends on the need to simulate the rainfall-runoff relationship. For coastal zones and principal rivers, for example, this may not always be necessary. But in urban areas the use of hydrological models is essential. Hydrodynamic modeling uses state-of-the-art integrated one-dimensional (1D) and two-dimensional (2D) models. The 1D models describe the flood propagation in rivers and canals, whereas the 2D models describe the flood propagation over land, e.g., on floodplains.
Such models make it possible to understand the flood phenomena in the basin, including how floods occur and how their most negative impacts can be mitigated. The models allow for a quantitative evaluation of the full impacts of a number of proposed flood protection options for the basin, and hence assist stakeholders in selecting the most cost-effective flood management interventions. The numerical simulation models support both the design of structural measures and the implementation of nonstructural measures.
Good-quality models require good-quality data sets. These include data sets on rainfall, monitored water levels and discharges, bathymetry and hydraulic structure, topography, land use, flood protection infrastructure, etc. Flood managers must be aware that monitoring of water levels and discharges no longer focuses on their use for statistical processing alone. For model development, monitoring is required at several locations, though over relatively short periods of time. Preferably such periods should include extreme flood events. The collection of data needed for modeling should begin well before the development of an FMMP.
Currently, one of the most important data items for flood management is a good-quality topographic map or digital elevation model (DEM). It is becoming common practice to survey this set of data with LiDAR technology. This approach generally allows for the production of DEMs at a vertical accuracy of 10 cm, or at least 20 cm. The LiDAR survey also provides at least basic insight into the presence of flood-blocking elements, such as dikes, roads, railways, etc. Both these capabilities facilitate the processing of high-quality flood hazard maps, which are an essential input for flood management decision making. Again, the survey of such detailed data should take place before—or at the very start of—an FMMP’s development.
Observed Trends in Flood Causes and Damages
Continuing land development, partly in flood-prone areas, is the principal reason for frequent, significant flood events, which often lead to extensive damages and economic losses as well as loss of life. For example, the flood event in Thailand’s Chao Phraya basin, which hit Bangkok severely in 2011, led to total estimated losses of US$45 billion (World Bank 2012). These losses resulted from the extensive urbanization of the lower Chao Phraya basin over the past decades, including the development of extensive industrial estates. Compared with the Great Flood of 1942, the damages and losses were of much higher magnitude. This trend—significant flood events caused by changes in land use—will likely intensify over time given current climate change predictions, particularly predictions about extreme weather events and sea-level rise; see figure 11.
Figure 11. People (in millions) living in flood-prone areas (i.e., areas that will be affected by a 1-in-1,000-year sea or river flood)
2010 2030 2050
Developed Countries 140 148 148
Latin America & the Caribbean
59 69 73
East Asia and Pacific 372 428 448
Russian Region and Central Asia
25 26 26
Middle East and North Africa
46 64 79
South Asia 294 378 435
Sub-Saharan Africa 55 88 125
TOTAL 991 1,203 1,334

F L O O D R I S K M A N A G E M E N T AT R I V E R B A S I N S C A L E : T H E N E E D T O A D O P T A P R O A C T I V E A P P R O A C H 19
Given that the world is changing rapidly, flood management planning must recognize that existing river basin conditions do not represent those likely to obtain in the future. The primary driver of change in this context is the industrialization of agricultural production, which reduces manpower needs in rural areas. Another driver is the population growth and expansion of industrial production in urban areas (figure 12). Land in urban areas is not always available at flood-safe locations, and industries and their employees often settle in flood-prone areas because they don’t understand flood risks very well (Kocornik-Mina et al. 2015). This concentration of industrial production in flood zones is the main cause of the increasing trend in flood damages over the past decades. The creation of space for urban expansion and industrial estates requires thorough planning based upon the outcomes of FMMPs, which should be updated regularly and take the following into consideration:
• Socioeconomic developments and land use changes associated with them
• Drainage infrastructure for new developments in land use, including impacts on the existing drainage system
• Transportation infrastructure (as there is often competition for land needed for drainage and transport)
• Impacts of climate changes
FIGURE 12. G l o b a l U r b a n A n d R u r a l P o p u l a t i o n
1 9 5 0 – 2 0 5 0
Source: UNDESA 2014.
7000
1950
Urban
0
3500
2050
1955
1960
1965
1970
1975
1980
1985
1990
1995
2000
2005
2010
2015
2020
2025
2030
2035
2040
2045
Rural
Popu
lati
on (
in B
illi
ons)

F L O O D R I S K M A N A G E M E N T AT R I V E R B A S I N S C A L E : T H E N E E D T O A D O P T A P R O A C T I V E A P P R O A C H20
2 . U N D E R S TA N D I N G R I V E R B A S I N F L O O D S
Understanding the fundamental behavior of river basin floods is a key component in identifying solutions to mitigate their negative impacts. Floods may be caused by factors originating within the river basin or by external influences. Figure 13 gives an overview of possible flood-forcing factors.
FIGURE 13. Flood-Forcing Factors
Local Rainfall
FloodForcingFactors
Upstream River
Discharges
Dike Breaches
Operation of Larger UpstreamReservoirs
DamBreaks
SpringTides
Storm Surges
TsunamisOther
Characteristics and Origin of Flood Events
River and coastal floodplain floods occur when the river or coastal channel does not have sufficient conveyance capacity for the flow that has to pass. In these situations, floodwaters seek a route over land. The flow may pass through areas that are used for urban settlements, industrial production, agriculture, or many other activities. Such flow may be very damaging, in particular when it comes unexpectedly.
Damage depends greatly on the speed with which a flood arrives. Most damaging in terms of human life are flash floods, which are often defined as floods that arrive within six hours after the start of a driving force such as heavy rainfall. Even in countries with a relatively good level of flood protection, flash floods may lead to loss of life. Such floods occur mostly in relatively steep mountain areas, though they also occur in urban areas. In the city of Barranquilla in Colombia, for example, some streets are used as drains to evacuate runoff from rainstorms. An appropriate subsurface drainage system was never built. Thus casualties occur every year when people are surprised by heavy rainfalls.

F L O O D R I S K M A N A G E M E N T AT R I V E R B A S I N S C A L E : T H E N E E D T O A D O P T A P R O A C T I V E A P P R O A C H 21
Regular floods are less threatening to human life than flash floods, though they often cause substantial economic damages, despite the longer time available to prepare for damage-reducing actions. Floods’ speed of passage depends on the conveyance capacity of rivers and the availability of flood volume storage. If a river has a high discharge capacity, floodwater will pass quickly in a downstream direction. Usually this is an advantage for the upstream community, though it may have negative consequences for communities downstream, where there are high peak discharges. If there are bottlenecks in the river system, such as narrow channel sections or bridge spans, local flooding may occur.
The availability of storage in the form of floodplains or reservoirs delays the speed of flood propagation. Not only does it give downstream communities more time to prepare for upcoming floods, it also leads to lower peak discharges and consequently lower flood levels.
The Threat of Peak Discharges
Extreme rainfall occurring on a river basin leads to high discharges in the basin’s rivers. The catchment runoff can be represented in the form of a discharge or runoff hydrograph, under extreme circumstances called a flood wave. The total volume of catchment runoff is determined by integrating the discharge over the period of the flood wave passage. This volume to be drained equals the rainfall depth, integrated over the receiving area and multiplied by the runoff coefficient from the catchment. The higher the rainfall depth over a given period of time, the higher this runoff coefficient. This phenomenon is therefore a nonlinear process that may change abruptly during a flood situation. This is the reason that increased rainfall due to climate change may be more damaging than was originally thought.
The period of such flood waves is short for fast-reacting catchments and longer for slower-reacting catchments. Figure 14 shows that for the same runoff volume, a fast-reacting catchment has a higher peak discharge than that of a slower-reacting catchment. The peak discharge is a very sensitive parameter in estimating flood risks. At most locations along rivers there is a direct relation between discharge and water level, the so-called rating curve; see figure 15 for an example. This curve makes it evident that flood depths are higher for higher peak discharges. The graph also makes clear that flood depths, and consequently flood risks, can be reduced by decreasing the peak discharge. This can be achieved by slowing down the runoff process of the catchment, e.g., through the creation of more space to (temporarily) store floodwater.
FIGURE 14. Influence Of The Flood Wave Parameter Time To Peak (Tp) On Peak Discharges: Comparison Of Flood Waves With Equivalent Flood Volumes.
Tp1=25hrs Tp2=50hrs
Qp1
DISC
HARG
E (Q
) in
m3/s
ec
Qp2
Tp1 Tp2 T I M E ( T ) i n hours
Flood hydrograph runoff duration 100 and 200 hrs (respectively) Developed by the Author

F L O O D R I S K M A N A G E M E N T AT R I V E R B A S I N S C A L E : T H E N E E D T O A D O P T A P R O A C T I V E A P P R O A C H22
FIGURE 15. Example Of A Discharge Rating Curve At A River Monitoring Station
Rive
r W
ater
Lev
el (
m)
120.00
124.00
128.00
0 800 1,600
D i s c h a r g e (m3/sec)
Monitored water level
Derived discharge
Peak discharges pose significant risks, particularly for infrastructure. Temporary
overtopping of an embankment
may lead to a dike breach, with
possibly far-reaching consequences
in terms of damages and losses.
Peak discharges may also threaten
other river infrastructure, such as
bridges. Figure 16 shows bridges
in the Licungo River in Mozambique
destroyed during the January
2015 flood, when peak discharges
surpassed the design criteria applied
for construction. This figure also
demonstrates the difference between
upstream and downstream water levels, gives an approximate indication of the flow energy loss at
the bridge, and suggests the flood flow’s difficulty in passing this point. The design of the bridges
did not take into account correct information on the hydrological system of the Licungo basin. Lack
of hydrological data during the design of the bridges was most likely the reason why the conveyance
capacity required underneath the bridges was underestimated.
FIGURE 16.Damaged Bridges In Mozambique, 2015: Across Licungo River At Malei (Left ) And At Mocuba (Right) , Also Showing The Difference In Upstream And Downstream Water Levels
Photo credit: World Bank. Photo credit: World Bank.

F L O O D R I S K M A N A G E M E N T AT R I V E R B A S I N S C A L E : T H E N E E D T O A D O P T A P R O A C T I V E A P P R O A C H 23
The risk of such failures may be reduced significantly if flood managers take timely action to reduce peak flood discharges. As demonstrated by figure 14, this reduction can be achieved by
stretching the flood wave over a longer period of time. Effective interventions are based upon delaying
runoff from the upstream part of a catchment, e.g., through retention storage, reforestation, changed
agricultural practices, etc. In any case, at the time the bridges shown in figure 16 were designed, the
hydrological conditions could have been estimated better on the basis of appropriate prior monitoring
and statistical analyses.
Integrated River Basin System
In a river basin, runoff water generated by rainfall usually moves from the affected area down to the basin outlet. This can be another river, a lake, the sea, or the ocean. Hence there may
be basinwide consequences from interference in the river system, such as through land use change,
construction of reservoirs, changes in the river discharge capacity, flow diversion, or any change in the
basin’s water management, in particular flood management. Interference may also have morphological
impacts on rivers and may affect the basin ecosystem.
Flood management should be an integral part of the overall water resources management for a river basin. Flood management may lead to conflict with other water-related interests, however.
Most striking is the conflict between those who wish to use reservoirs for hydropower generation and
those who wish to use them for flood control. Energy produced at a hydroelectric plant is linearly related
to two factors: (1) the water volume available; and (2) the water level in the reservoir. Consequently, a
higher water level in the reservoir leads to a higher energy production for the same volume of water
available. For this reason, a hydropower company has an interest in maintaining the highest possible
reservoir water level. Flood managers on the other hand would prefer to keep the reservoir empty (see box 4). Similar conflicts of interest occur when a reservoir is used both for drought (irrigation) and
flood control.
Operating rules for reservoirs seek to find the most appropriate balance between such competing interests. Flood-forecasting systems have proven to be very useful as a basis for real-time
control of the reservoirs. They may be particularly useful in cases where conflicting interests have to be
managed. Improved meteorological forecasts and monitoring on the basis of satellite images, numerical
weather models, weather radar systems, and state-of-the-art ground stations also have increased the
lead time in forecasting river basin rainfall. In conjunction with recently improved hydrological modeling
capabilities, these allow a reservoir manager to use the longer-range runoff forecast to improve decision
making on the operation of gates (see box 4). Such improved forecasts enable an earlier release of
water from reservoirs if such action is needed to create space for the floodwater, while also providing
lower losses to hydropower production or irrigation water stocks.

F L O O D R I S K M A N A G E M E N T AT R I V E R B A S I N S C A L E : T H E N E E D T O A D O P T A P R O A C T I V E A P P R O A C H24
This example of conflicting interests demonstrates the need for flood management plans to consider all river basin interests. Likewise, flood management should be a component of any
overall river basin management plan. It should not necessarily be the leading component, though neither
should it be neglected. Unfortunately, the terms of reference for river basin studies do not always pay
enough attention to the issue of floods.
Role of Floodwater Storage
In a river basin, the principal reason for creating storage for floodwater is reducing flood peak discharge values further downstream and slowing the propagation speed of flood waves. The reduction of flood peak discharge values, in turn, leads to a reduction of maximum flood
levels and the associated damages and losses. It also leads to lower construction costs for flood defenses
and hydraulic structures, which as a rule are designed to protect the floodplains from peak flood values.
Lowering the speed of flood wave propagation contributes to a further reduction of flood peak discharge
values. It has the additional benefit of giving downstream areas more time to prepare for an upcoming flood.
BOX 4. Hydropower Production and Floods
In mid-October 2016, H a T i n h P r o v i n c e in V i e t n a m experienced a rainfall of 902
mm over a period of three days—including 526 mm that fell during a single
day. Local officials blamed the release of high discharges from the upstream
hydropower reservoir for the floods that occurred downstream. According to
Dang Quoc Khanh, the provincial mayor, “Water released from hydropower
dams on Friday night had caused water levels to rise quickly and no one was
able to handle the situation.”a
Without a proper investigation of the circumstances, it is difficult to judge whether this claim
is correct. In any case, the large rainfall depth released by Typhoon Sarika would have caused
substantial damage even in the absence of the hydropower reservoir. It is quite possible,
though, that the management of reservoir releases did aggravate the flood situation. Given
this uncertainty, an investigation by an independent expert team, supported by numerical
model simulations to demonstrate the impact of applied reservoir operation rules, should
be undertaken. It would also be helpful to install a flood forecasting system for this basin
that enables the simulation of “what-if” scenarios for dam operation rules on the basis of
forecasted rainfall. Such a system could have prompted an earlier release of reservoir water
to reduce the impacts of the peak flow during the passage of the typhoon. The case also
demonstrates the importance of having institutional arrangements in place to guarantee the
interests of all stakeholders.
a. Quoted in Richard Davies, “Vietnam—Torrential Rain and Floods Leave 24 Dead,” Asia News, October, 17, 2016, http://floodlist.com/asia/vietnam-deadly-floods-october-2016.
VI E TN
AM

F L O O D R I S K M A N A G E M E N T AT R I V E R B A S I N S C A L E : T H E N E E D T O A D O P T A P R O A C T I V E A P P R O A C H 25
In many river basins, one of the problems associated with floods is that dikes or
embankments, constructed to protect parts of the floodplain from inundation, also reduce
the storage capacity of the river. Although these dikes provide local protection, the resulting higher
peak discharges increase flood problems further downstream. For this reason, various governments have
changed their policy on flood protection from site-specific measures to a more integrated approach that
incorporates nonstructural measures in addition to structural ones. And if the construction of dikes is
judged to be the best option for local flood protection, sound policy dictates that storage compensation
has to be constructed in order to neutralize the increased flood peak discharges caused by those dikes.
The impact of newly constructed storage has to be studied carefully. Adding storage can change
flood wave speeds, meaning that flood waves from different tributaries in the basin could amplify each
other more than they did in the absence of additional storage. In other words, although usually the
construction of reservoirs leads to reduced flooding, it could in some cases make the downstream
flood problem worse than before. It is now common practice to use mathematical model simulations
to study the impacts of newly constructed storage in the river basin—and indeed all flood management
interventions—in an integrated way.
Along a river, flood peak
discharge can be reduced by
constructing side or in-line
retention storage. The storage
capacity of a side retention reservoir
is most effective if it can be used to
store just the peak of a flood wave.
For side storage, this is achieved by
delaying floodwater inflow with a
barrier, such as a weir, which can be
either a fixed or a movable hydraulic
structure. The movable weir has to
be controlled in such a way that
filling of the reservoir starts at the
optimum time before the peak of
the flood arrives. It should store the
flood volume that passes just before
and after the peak of the wave.
BOX 5. Netherlands Case Study: Floodplain Retention Concept
A good example of creating delayed
retention of flood volumes is the Dutch
practice of building a system of parallel
low summer dikes and high winter dikes
along floodplains (secondary and primary
dikes, respectively – see figure 17). In the Netherlands,
floods are usually highest during the winter period. In
the summer, the low dikes protect the area between
the river and the winter dike so it can be used for cattle
grazing. The much higher winter dikes serve as primary
protection against the higher winter floods. In the winter,
the summer dike (also referred as the secondary dike)
has the function of delaying retention in the floodplain.
In this way, a larger part of the flood volume is conveyed
before the potential storage volume of the floodplains is
util ized. This system thus more effectively reduces flood
peak discharges and with them the danger of flooding
further downstream.a
a. For more information, see Oosthoek (2006).
N E T H E R L A N D S

F L O O D R I S K M A N A G E M E N T AT R I V E R B A S I N S C A L E : T H E N E E D T O A D O P T A P R O A C T I V E A P P R O A C H26
In-line retention storage is created by constructing a dam across the river and leaving a fixed opening at the riverbed level, which limits its capacity to pass high discharges. During high floods, the river floodplain upstream of the dam will be filled with floodwater to delay
runoff. The dam will also be equipped with a spillway to pass extreme peak discharges, which would
otherwise destroy the dam. In principle, the lower opening size or the spillway opening could also be
controlled with movable gates. Reservoir dimensions, inlet or outlet structure parameters, and their
control strategy are determined on the basis of mathematical model simulations, which are used to
refine best estimates initially made with simple hand calculations. Combining these interventions with
a flood forecasting system enables further optimization of the retention facility’s function.
Role of Channel Conveyance Capacity
Natural river channels have been formed over periods of thousands of years. The shape of
their profiles is the result of morphological processes forming the riverbed and sediment depositions on
their floodplains, with natural levees generally near the main channel. Flooding of the floodplain occurs
when the capacity of the principal river channel is not high enough to convey extreme discharges.
The spreading of floodwater on the floodplain also implies that during the passage of the flood wave, the further rise of the water level in the river is slowing down. In these
circumstances, the discharge capacity of the river can no longer rise fast enough to convey increasing
discharges coming in from upstream. A tipping point is reached when flooding of the floodplain can
easily and rapidly increase. Beyond such a tipping point, a relatively modest increase in rainfall depth
on the catchment can lead to an unexpectedly large extent of flooding. This phenomenon can aggravate
the impacts of increased rainfall depths associated with climate change. The construction of dikes
along the principal river channel shifts the tipping point to higher water levels.
FIGURE 17. Role Of Secondary Dikes In Flood Wave Peak Reduction
Picture credit: Wendy Verweij.

F L O O D R I S K M A N A G E M E N T AT R I V E R B A S I N S C A L E : T H E N E E D T O A D O P T A P R O A C T I V E A P P R O A C H 27
The conveyance capacity of a river channel is a function of cross-sectional area, average water depth, and channel roughness. These three parameters can be used to increase channel
conveyance capacity, where needed. The cross-sectional area of a river can be increased by increasing
its width and/or depth. Increasing river depth is the most effective way to increase conveyance capacity.
Each cubic meter of sediment removed from the channel bed is more effective in increasing channel
conveyance capacity than a similar volume removed for widening the cross-section or for creating
parallel channels in the floodplain. The reason is that increased depth increases the flow velocity over
the complete depth, which adds to the capacity beyond what results from the increase in the cross-
sectional area.
However, changing the riverbed to increase its channel conveyance capacity can have various negative impacts, which have to be investigated before any interventions are authorized. Local deepening of alluvial channels will destabilize the morphological equilibrium, changing bed
levels both upstream and downstream of that location. Expert advice on the sustainability of such
interventions, and on possible negative impacts, should be sought. Lowering river channel bed levels
leads to lower water levels, which may affect groundwater levels and in turn damage buildings and/
or harm agricultural production along the river. Moreover, the intervention may lead to increased salt
intrusion from the sea and affect biodiversity in the receiving coastal waters.
Morphological changes can also influence the roughness of the riverbed and hence the discharge capacity of the river. The roughness of alluvial river channels is mostly determined by
the bed characteristics under the influence of complex morphological processes. Changes in channel
conveyance capacity are also caused by other interventions in the river cross-section. For example,
river training for navigation leads to smaller cross-sectional areas and changes in roughness of the
riverbed. The often-applied solution of constructing groins may decrease river conveyance capacity, as
intentionally reducing the cross-sectional area increases the flow velocities. However, the situation is
sometimes more complex, and the construction of groins has reportedly led to an increased capacity
in some instances. In any case, interventions of this kind require consultation with experts to evaluate
their likely impacts on floods.
For drainage channels, roughness is an important parameter. When a high discharge capacity is
required and available space is limited, such as in urban environments, channels are often lined with concrete.
Thus after various floods in the city center, Singapore’s Public Utility Board decided in 2012 to cover the walls of
a critical culvert with polymer lining. The lining was installed in a section along Orchard Road of more than 1 km
in length and covered the much rougher weathered concrete wall surface. An alternative solution would have
required closing part of an already highly congested traffic route for a long period of time.
The opposite of roughness reduction takes place when a friendlier-appearing vegetation cover replaces concrete-lined drainage channels as part of an eco-restoration project. Detailed model
calibration in Hong Kong revealed that the discharge capacity of these so-called green channels would be three
times lower than that of concrete-lined channels. In practice there is often no space available for such green
interventions.

F L O O D R I S K M A N A G E M E N T AT R I V E R B A S I N S C A L E : T H E N E E D T O A D O P T A P R O A C T I V E A P P R O A C H28
Flood management interventions related to increasing channel conveyance capacity are most appropriate in the downstream parts of river basins. Downstream populations may be
interested in draining water quickly to prepare for more floodwater to come (see Box 6). A similar
measure applied in the upstream part of a river basin will increase flood peaks and also increase flood
damages and losses downstream. In case such upstream intervention is unavoidable—e.g., if a local
river constriction must be removed—current best practice is to design compensatory measures in the
form of additional flood retention space.
3 . F L O O D M A N A G E M E N T O P T I O N S
The Impossibility of Totally Avoiding FloodsTraditionally, human settlement and economic developments were attracted toward rivers and coastal
zones, as water provided the most attractive transport routes for goods and services. Unfortunately,
these zones were also most exposed to the threat of floods. For many human activities, space could
be found on higher ground. However, as populations grow and economic activities expand, they move
toward flood-prone areas. This trend appears to continue even in an era when road and railway transport
offers feasible alternatives to navigation.
C a p - H a ï t i e n , the second largest city of H a ï t i with a population of approximately
300 thousand is located at the mouth of the rivers Haut du Cap and Any. In
2012, 2014 and 2016 large parts of the city were flooded at depths of up to
2 m, impacting in each case around 100 thousand inhabitants. In November
2012 a total rain depth of 408 mm was recorded over a period of 2 days. Most damaging was
in all cases the runoff from the upstream river basin, which has a total size of approximately
150 km2. The city has a central lagoon with an area of approximately 1.5 km2, far too small to
provide retention to reduce incoming flood peaks. For the large rain depth coming to runoff,
the construction of upstream retention would at best serve as a complementary structural
flood management option.
The situation of Cap-Haïtien provides a typical case where a flood reduction solution is
primarily found by increasing the river discharge capacity, in particular that of the outlet to
the sea. Currently, financing is procured to solve the unacceptable flooding situation in a
phased approach, starting at its most downstream river section. To fully prevent floods in the
city, it has to be made sure that the river passing through the city has a sufficient discharge
capacity to convey the peak discharges arriving at the upstream end of the city. This implies
dredging of the river which has lost a significant part of its discharge capacity, primarily due
to encroachment and garbage deposition.
BOX 6. Flood Hazards at Cap-Haïtien, Haiti
HA I TI

F L O O D R I S K M A N A G E M E N T AT R I V E R B A S I N S C A L E : T H E N E E D T O A D O P T A P R O A C T I V E A P P R O A C H 29
H o C h i M i n h C i t y is expanding toward the sea, where low-lying terrain needs flood
protection from high tides and a monsoon-induced water-level surge. In these
areas, gravity drainage of rainwater is hard or impossible, and pumping is required
to at least support drainage by gravity. Flood protection and its associated costs
appear to be only one of the factors at play in the planning of urban expansion.
The cost for flood protection would most likely be lower if the city expanded to
higher ground toward the west. Flood hazard and risk mapping planned for Ho
Chi Minh City will determine the level of flood protection that is economically most attractive
for the existing urban area and the expansion zones.
BOX 7. Toward Sustainable Flood Risk Management In Ho Chi Minh City, Vietnam
VIETN
AM
Full flood protection is economically not feasible. Appropriate flood management focuses on
maximizing the benefits of living in flood-prone areas and not just on minimizing flood damages. Floods
are unavoidable; beyond the probable 1-in-100-year flood there is always the possibility of a 1-in-1,000-
year flood and beyond.
The question is where the optimum investment is found. This optimum varies from location to
location and depends on flood hazards, economic activities, and the human lives at stake. Figure 18
shows the optimum level of flood investments for a relatively high-risk area such as the Netherlands.
The figure reflects the principle that at any location in the world, an optimum allowable frequency
of flooding can be defined. It also demonstrates that a “do nothing” option in flood management is
not attractive, as small investments that decrease the frequency of floods—usually investments in
structural measures—already lead to a substantial rate of return on investment. However, the figure
also shows that beyond an optimum investment point, further investments become less attractive. In
other words, there will always be a residual risk of flooding that has to be accepted on the basis of
sound economic principles. Here the value of nonstructural investments comes in, as flood forecasts
and emergency support information can considerably reduce unavoidable losses.
Unfortunately, there are cases when allowing these “acceptable” floods would lead to many casualties. For example, some parts of the western Netherlands are nearly 7 m below mean
sea level. Thus flood protection in parts of the Netherlands is based on an allowable flood frequency
of 1 in 10,000 years. The 2005 Katrina flooding of New Orleans demonstrated that for areas below sea
level, a much lower flood frequency is acceptable than for standard river floodplain situations, where
the United States applies a 1-in-100-year allowable flood frequency. Similar exceptions to standard rules
apply to conditions with very high river dikes and high dams containing large reservoirs.

F L O O D R I S K M A N A G E M E N T AT R I V E R B A S I N S C A L E : T H E N E E D T O A D O P T A P R O A C T I V E A P P R O A C H30
In dam construction it is common practice to provide an extremely high level of security against failure, for example by applying a high safety factor in the design of the spillway capacity, in particular for high dams. Engineers use the concept of probable maximum flood—that
is, the largest flood that could conceivably occur at the outlet of a reservoir. This terminology might
give the impression that such a flood could never occur. But this is not true. In the 1980s, the spillway
capacity of the Warragamba Dam in New South Wales, Australia, had to be doubled urgently when
new analysis of more recently monitored data showed that the required capacity had been severely
underestimated at the time of its design and construction. The lesson learned is that the estimate of a
probable maximum flood may give a false impression about real safety. Thus the Netherlands designs
the crest level of its most critical sea dikes at an overtopping frequency of 1 in 10,000 years.
However, more recent studies suggest that a dike-level criterion alone does not guarantee safety at such frequency. New studies in the Netherlands, based upon a full probability analysis,
considered all possible failure mechanisms of dikes and other protection elements surrounding flood-
prone areas in order to arrive at a real 1-in-10,000-year security level. These analyses have made
clear that additional interventions in the flood protection system are needed. Despite all the existing
investments, the probability that floods will strike the Netherlands’ population and infrastructure is still
near 1 percent during a lifetime. So even with this very high protection level, floods can never be totally
avoided. This truth was recognized many decades ago by Johan van Veen, the pioneer of the Dutch Delta
Works, who wrote: “One day, with a sigh of relief, we will give up this country to the tempestuous sea.”
The statement, of course, was made well before the effects of climate change were first mentioned.
FIGURE 18. Relationship Between Cost And Benefits Of Flood Risk Management Investments
Cost
s (m
illi
ons
€)
1/100 1/1000 1/10.000 0
P r o b a b i l i t y o f Wat e r L e v e l ( P e r Y e a r )
Best Investment
Investments
Risk= probability x damages
Source: Rijnland Water Control Board, the Netherlands.

F L O O D R I S K M A N A G E M E N T AT R I V E R B A S I N S C A L E : T H E N E E D T O A D O P T A P R O A C T I V E A P P R O A C H 31
The reason to adopt the high safety criteria in the given examples is the massive volume of water that could be released in a short time and the subsequent high flood depths that would occur. If the Warragamba Dam (Australia) failed, it would inundate a large floodplain—an area
that in recent years has been rapidly urbanized—at a depth of up to 25 m. In the Netherlands, flood
depths could be as high as 7 m, and flood damages and loss of life would be enormous in the densely
populated areas behind the sea dikes.
Most areas in the world are above mean sea level and are not threatened by massive volumes and depths of released water. For this reason, a commonly adopted optimum for flood
security is the 1-in-100-year event. This is the common standard for residential areas in the United
States, Australia, the United Kingdom, and many other countries. Where the 1-in-100-year criterion is
applied, the probability of experiencing a flood during a lifetime is higher than 50 percent. Deviations
from the 1-in-100-year criterion are often adopted for special zones, such as agricultural and other rural
zones; in these areas lower standards are accepted. The choice of safety standard levels is based on
weighing costs of flood protection against the protection’s benefits. For example, table 1 shows the
flood protection standards applied in the United Kingdom. Because of the scale of potential flood
damage, an exception has been made for the Thames Barrier and associated tidal defenses, which are
designed to a 1-in-1,000-year standard of protection.
TABLE 1. Flood Defense Standards Of The United Kingdom
Land Use Band Typical Land UseStandard of protection
(years): NontidalStandard of protection
(years): Tidal
High-Density Urban
High-density urban areas containing significant amounts of both residential and commercial property at risk
1:50–1:100 1:100–1:200
Medium-Density Urban
Medium-density urban areas, some parks and open spaces, or high-grade agricultural use at risk
1:25–1:100 1:30–1:200
Low-Density Urban
Low-density urban areas or rural communities; typically large areas of high-grade agricultural land with some properties at risk from flooding
1:5–1:50 1:2.5–1:20
Arable Farmland
Generally farmland with occasional properties at risk; medium productivity agriculture which may also be prone to the effects of waterlogging
1:1.25–1:10 1:2.5–1:20
GrasslandTypically low-grade agricultural land or public open space, often grassland or scrub, with very few properties at risk
Less than 1:2.5 Less than 1:2.5

F L O O D R I S K M A N A G E M E N T AT R I V E R B A S I N S C A L E : T H E N E E D T O A D O P T A P R O A C T I V E A P P R O A C H32
Proactive Versus Reactive Approach
Most countries have developed their flood defense system in a reactive way. In fact, there
was no other way to determine safety levels in the era before numerical simulation models. When
determining flood levels in rivers and along coasts was impossible, people relied on the best guess for
estimating required dimensions of flood defense structures. This is how dikes were constructed in the
Netherlands for 1,000 years before simulation models were introduced.
The reactive approach has nearly always led to shortsighted solutions. Dike crest levels were
constructed too low, lateral slopes were too steep, and dikes were positioned too close to the river in
order to maximize the protected area. In the early 20th century, the German playwright Bertolt Brecht
insightfully noted: “The river that drags everything is known as violent but nobody calls violent the
margins that arrest him.” The lesson is that the river needs its own space, which is why the Dutch
introduced the concept “room for the river.” If this space is not given, the river takes it back on its own.
This has happened many times in the past, not only along the Dutch rivers and coasts but in many other
countries as well. Until better research and planning practices were introduced, dikes were periodically
repaired and “built better.” But it was only a matter of time until the next disaster occurred.
Overall, the reactive approach to flood management has been very expensive and has led to many casualties. An example of its high costs is the 2011 flooding of Bangkok. This flood, which a
Stanford University study estimated as having a return period of 30–75 years, led to damage estimated
by the World Bank at US$45 billion (Meehan 2012) and to approximately 800 casualties. A flood of
comparable magnitude that occurred in 1942 did far less damage; the reason for the huge losses in
2011 is the enormous expansion of the city and the large industrial estates built over the past decades
in the Chao Phraya floodplain. With the continued growth of the city, similar floods in the future will
yield even higher losses.
Given continuous physical and spatial changes to rivers and surrounding areas, flood risks should be continually monitored through the development and updating of river basin master plans. After the 2011 flood, the Thai government proposed a US$10 billion investment to avoid
similar flooding in the future. The investment included plans for diversion canals around Bangkok, new
reservoirs upstream, and two large flood retention schemes (World Bank 2012). Mathematical model
simulations demonstrated that with this investment a similar flood could be contained in the future. If
the investment had been made earlier, it would have produced an attractive economic rate of return,
especially in light of ongoing development in the area. Unfortunately, political developments in this
country have delayed the realization of the plans.
The case of Thailand nevertheless shows that a proactive approach to flood management is preferable to a reactive approach. (This has been the experience in New Orleans as well; see box 8). The Thailand case also demonstrates that any solution to flood problems requires combining a
variety of possible interventions. The final decision on interventions depends on the best rate of return
produced by the investment options, the social benefits, and the constraints in realizing these. There

F L O O D R I S K M A N A G E M E N T AT R I V E R B A S I N S C A L E : T H E N E E D T O A D O P T A P R O A C T I V E A P P R O A C H 33
is never an easy solution to the problem of managing floods, and it is wise to involve stakeholders at
an early stage of the decision-making process. The outcome of this process depends on the evaluation
of the economic and social benefits the various options deliver. Mathematical model simulations and
subsequent flood risk analyses provide an important basis for decisions on flood mitigation investments.
Flood Hazard and Flood Risk
Insight into flood hazard provides the most important source of information for the planning of new land developments in river basins. For selected flood return periods, potential flood hazard
can be presented on maps, providing spatial information on flood extent, flood depth, flood duration,
and flood flow velocities. With this information, decision makers can determine whether certain areas
are suitable for urban, industrial, or other developments. The maps also make clear that if developments
in flood-prone areas are considered advantageous, special protection measures must be taken, which
will increase investment costs.
Flood risk mapping provides a meaningful input for flood management decision making, as derived through the relation illustrated in figure 19. In this relation, hazard is the fraction of exposure
that is at risk, e.g., as derived from the production of flood hazard maps; exposure reflects land use
with its population, building stock, and economic activities in the area; and vulnerability expresses the
fraction of that exposure that really results in damage for the given hazard. Flood risk is the result of
the combination of these three contributors. Flood risk may be reduced by reducing the impacts of any
and all of these three contributing factors, as discussed in more detail below.
Investments made in New Orleans after Hurricane Katrina demonstrate the urgent need
for action in situations with a high flood probability. In 2005, Hurricane Katrina caused
around US$10–20 billion in damage in New Orleans. The real pre-Katrina flood protection
of this city was estimated at only around a 1-in-25-year level. After Hurricane Katrina,
a US$14 billion program was implemented by the U.S. Army Corps of Engineers to increase the
city’s protection to a 1-in-100-year level. In 2013, another (less intense) hurricane, Hurricane Isaac,
tested the new flood protection system and showed that the city was well protected by its new flood
barriers. A quick post-hurricane analysis showed that damage would have been US$5–10 billion if no
action had been taken after Hurricane Katrina. Thus, most of the investment paid off within a few years
of the previous event!
BOX 8. Urgency Of Investing In Flood Risk Reduction
LOUISIANA
Source: Mathijs van Ledden, RoyalHaskoning DHV.

F L O O D R I S K M A N A G E M E N T AT R I V E R B A S I N S C A L E : T H E N E E D T O A D O P T A P R O A C T I V E A P P R O A C H34
FIGURE 19. Risk As A Function Of Hazard, Exposure, And Vulnerability
H A Z A R D
X
E X P O S U R E
X
V u l n e r a b i l i t y
=
F l o o d R i s k
Exposure reflects the economic value and people located in a flood-prone area. It represents
the maximum damage that could occur, based upon population, asset value, the value of economic
activities (such as industrial or agricultural production), the value of roads in transporting people and
goods, etc. Usually, economic values and human life at risk are evaluated separately.
Exposure and the flood hazard map together determine “hazard” as the fraction of exposure subject to potential flood-caused losses. In addition to mapping flood hazard, the relation between
exposed value and flood parameters—such as extent, depth, duration, and flow velocities—has to
be established. These relations are stored in lookup tables. For each return period and subsequent
hazard map, these lookup tables are consulted to define the potential effect on each individual exposed
economic value, in terms of either damages or losses.
Vulnerability is the fraction of the product of hazard and exposure that would result in loss for the given flood return period. Without any measures to reduce such potential flood damage,
the value of this factor would be equal to one. The value can be reduced if adequate measures are
taken prior to, during, or after the flood. These measures fall in the category of nonstructural measures
(figure 20).
Flood risk assessment provides the basis for evaluating meaningful flood management investments. Flood risk as defined above represents economic losses for a specific return period.
However, all possible return periods may lead to damages and economic losses. These are usually small
for floods that occur frequently and high for floods that are rare. To evaluate the overall flood risk in an
area, risk is evaluated for a selected number of flood frequencies. From this evaluation the overall flood
risk can be integrated and converted to a probable yearly flood risk, as a meaningful input for decision
makers. By comparing flood risk before and after an intervention is made, this procedure makes it
possible to evaluate the benefits of flood management investments.

F L O O D R I S K M A N A G E M E N T AT R I V E R B A S I N S C A L E : T H E N E E D T O A D O P T A P R O A C T I V E A P P R O A C H 35
FIGURE 20. Ways To Reduce Vulnerability To Floods
Methods for Reducing
Vulnerability to Floods
Building Codes and Choice of
Construction Material
Raising Flood Hazard Awareness
Installing a Flood
Forecasting System
Providing Early Flood
Warning
Temporary Flood
Barriers
Evacuation Exercises
Installing Flood
Information Systems
Adopting Clear
Institutional Arrangements
Resilient Construction
Such As Robust
Embankments
Resilient Use of Living Space
Post-Flood Recovery Services
Flood Insurance
Structural and Nonstructural Measures
There are many ways in which flood risk can be reduced through a proactive approach that mixes structural and nonstructural measures. Structural and nonstructural measures in flood
management have the objective of bringing flood risk down. The relation illustrated in figure 19 shows
that this can be accomplished by reducing hazard, exposure, and/or vulnerability. Reducing hazard is
primarily possible via structural measures. Modifying exposure and vulnerability is primarily achieved
via nonstructural methods. In recent years the value of nonstructural measures has been increasingly
recognized. Or, using a metaphor: brains are gaining value over muscles.

F L O O D R I S K M A N A G E M E N T AT R I V E R B A S I N S C A L E : T H E N E E D T O A D O P T A P R O A C T I V E A P P R O A C H36
Historically, structural measures have been used to provide protection against floods and inundations. For thousands of years, dikes were built in coastal zones and along rivers to defend
against flooding. These works provided protection in a direct way. Later, when the positive effect of
delaying runoff was understood (figure 14), other types of civil engineering works, such as those
designed to increase flood retention capacity, were introduced. As shown in figure 21, there is a
large variety of structural measures to provide protection against floods.
FIGURE 21. Structural Measures That Reduce Flood Hazard
• Construction of dikes or embankments
• Construction of storm surge barriers
• Creation of polders with pumps and/or tidal outlets
• Construction of diversion canals
• Increase of channel conveyance capacity
• Construction of reservoirs
• Construction of detention basins or dry polders
• Construction of coastal lagoons and sand barriers
• Elevation of terrains in new urban developments
• Construction of elevated highways
• Temporary flood defenses
However, some nonstructural measures can also reduce flood hazard if applied over large areas. These include:
• Reforestation of the river basin
• Rules for agricultural practices
• Enhanced infiltration in the river basin
• Improved operating rules for reservoirs
The exposure of an area to floods relates to existing or planned urbanization, economic activities, and infrastructure. To lessen exposure, decisions can be made to protect existing
settlements or activities and to reduce or cancel future developments. Examples of specific steps for
reducing exposure are given in figure 22.
FIGURE 22. Nonstructural Measures That Reduce Exposure
• Land use planning and regulations
• Construction of floating houses or houses on stilts or platforms
• Construction of flood-proof buildings
• Property acquisition and resettlement of people

F L O O D R I S K M A N A G E M E N T AT R I V E R B A S I N S C A L E : T H E N E E D T O A D O P T A P R O A C T I V E A P P R O A C H 37
Hard infrastructure options such as levees and dams have traditionally been the go-to
solutions in the management of riverine and urban floods. However, the combination of
increasing flood risk and unevenness in the efficacy and costs of such “gray” infrastructure
has led to growing interest in other, more integrated approaches. In this regard, green infrastructure
solutions have become more popular. They leverage natural processes for managing wet-weather
impacts and reduce the flow of water while also delivering environmental, social, and economic
benefits. Designed to complement other flood risk management approaches, they connect floodwater
with adjacent natural storage and overflow systems such as wetlands, mangroves, bioshields, buffer
zones, and swales. These solutions can be cost-effective, low in impact, and environmentally friendly,
and can be easily incorporated alongside gray infrastructure or designed as standalones.
The World Bank’s Urban Floods Community of Practice has recently published a Knowledge Note
on the role of green infrastructure solutions in flood risk management (UFCOP 2016), which can be
consulted for more information.
BOX 9. Green Infrastructure Solutions: An Exciting Approach To Flood Risk Management
4 . F L O O D R I S K A S S E S S M E N T M E T H O D O L O G YFlood risk assessment is an important component of proactive flood risk management. In many countries, proactive approaches have led to investments with a very attractive economic rate of return. Flood risk assessment provides the basis for evaluating the cost-effectiveness
of a range of possible flood management interventions and for prioritizing their realization. It allows
production of risk maps that can be used to compare various investment options with the reference
situation in order to support decision making related to flood risk reduction and land use development.
Due to ongoing land use developments in river basins, flood risk maps have to be updated with a
certain frequency, usually once every 10 to 15 years.
Flood Hazard MappingFlood hazard maps are the most important source of information for land development planning in river basins. As indicated above, flood hazard maps provide spatial information for
selected return periods on flood extent, flood depth, flood duration, and flood flow velocities. With this
information, decision makers can determine whether certain areas are suitable for urban, industrial, or
other developments. The maps also indicate that if developments are deemed advantageous despite
being located in flood-prone areas, special flood protection measures must be taken, which will tend to
increase investment costs. An example of a flood hazard map is shown in figure 23.
Flood hazard maps are produced for selected hazard return periods, e.g., 2, 5, 10, 25, 50, 100, or 500 years. This information provides insight into the damages that may occur at specific
locations and at the stipulated frequencies. If justified by the economic values at stake, a flood risk
map can be produced that provides a more detailed analysis. This need arises in particular for urbanized
areas where the value of economic activities is high.

F L O O D R I S K M A N A G E M E N T AT R I V E R B A S I N S C A L E : T H E N E E D T O A D O P T A P R O A C T I V E A P P R O A C H38
FIGURE 23. Example Of A Flood Hazard Map (Jakarta 2007)
Source: Deltares.
A Simple Approach to Flood Hazard Mapping: The Gumbel Method
The most straightforward methodology to produce flood hazard maps, often referred as the Gumbel
method, is based upon a frequency analysis applied to discharges at a selected river location. This
method assumes the existence of a single valued relationship between water level and discharge
(rating curve) at that location. Discharges with a selected return period are transformed into water
levels. These levels are then plotted along the transversal section at this location to provide flood
depths on the digital elevation model (discussed in section 5). In the United States, this method
is commonly applied for mapping the 1-in-100-year flood extent in the river floodplain. However, this
method also has quite a number of limitations, as listed in figure 24.

F L O O D R I S K M A N A G E M E N T AT R I V E R B A S I N S C A L E : T H E N E E D T O A D O P T A P R O A C T I V E A P P R O A C H 39
FIGURE 24. Limitations Of The Gumbel Method
• It assumes locally a steady-state situation for river flow.
• The rating curve may not be single valued (e.g. , due to backwaters, tides, morphological impacts, etc.).
• Flood levels may not be horizontal in transversal direction.
• Floodwater may not reach certain zones, as the inflow might be blocked.
• It assumes that the upstream catchment has not changed much over the period when data were collected and applied for the frequency analysis.
• Peak flows are affected by local floodwater storage, which has an impact on the extrapolation of flows used in the frequency analysis.
• Peak flow statistics are affected by upstream reservoir operation.
• There may be multiple forcing factors generating the floods.
Numerical Simulation ModelsIn order to address these limitations, it is common practice to supplement this approach with numerical simulation models for flood mapping. In most cases, this requires a combination
of a rainfall-runoff (or hydrological) model and a hydrodynamic model. These models have to be developed
and calibrated on the basis of surveyed and monitored data. Once a model has been developed it has
to be calibrated and validated by comparing simulated and monitored data, such as water level and/
or discharge time series, flood depth, flood extent maps, etc. Subsequently, model simulations can
be produced by inputting historical data or by using statistically generated data. The application of this
methodology requires more data and other resources than are needed for the simpler Gumbel method.
However, this more resource-intensive approach is highly recommended because it provides more
reliable insights, especially when the simple model is not able to represent the more complex physical
functioning of the system correctly, as is often the case.
There is a large variety of rainfall-runoff model concepts currently in use. For defined areas,
these models describe the water balance by taking into account the fractions of rainfall associated with
losses, such as interception and evapotranspiration, infiltration into the soil, surface storage, and surface
and subsurface runoff to drains. The defined areas could be complete river basins (lumped models) or a
large set of smaller areas, such as subcatchments of the basin or square grid cells (distributed models).

F L O O D R I S K M A N A G E M E N T AT R I V E R B A S I N S C A L E : T H E N E E D T O A D O P T A P R O A C T I V E A P P R O A C H40
The growing availability of geographic information system (GIS) data (layers)—such as terrain slopes derived from DEMs, land use, vegetation type, soil type and composition, drainage networks, etc.—is leading to a growing preference for the development of distributed models. Data layers in GIS are mapped on each individual cell or subcatchment to derive
local model parameters. The advantage of such models is the more realistic representation of physical
processes, which makes extrapolation to extreme conditions more reliable. This is extremely important
when dealing (for example) with 100-year floods, which are rarely monitored for use in model calibration.
In the distributed approach, model process parameters are related to physical characteristics derived from GIS layers. These relations are further refined through model calibration, based upon
the availability of reliable monitored rainfall and river discharge data. Once the rainfall-runoff model is
calibrated and validated, its application generates the inflows to a hydrodynamic model, which simulates
the flood wave passage in the network of rivers and canals and across floodplains.
The simplest hydrodynamic models are based upon a 1D schematization of the river network. These models rely mostly on channel bathymetry in the form of cross-sections and on reservoir and
hydraulic structure information (see section 5 for a discussion of data needs for model development).
They can be set up to represent flow in river networks, open drainage networks, closed drainage
networks, or combinations of these. If only 1D models are used, flood hazard maps are still produced
in GIS by extending computed channel water levels in a transversal direction.
More detailed and correct flood hazard maps are obtained when flow over the terrain is included in the description by adding a 2D flow component to the model. For this approach, the
results rely mostly on digital terrain elevations. State-of-the-art hydrodynamic modeling uses integrated
1D2D models, which present numerous advantages: they can fully incorporate flow-blocking objects,
such as dikes, highways, and railways; and they can represent a variety of flow-conveying components,
such as canals, culverts, pipes, and tunnels. Simulations made with this type of model make it easier to
detect all kinds of possible flow routes or blockages on the terrain, which may be overlooked in the 1D
approach. Flood maps are also more easily produced by post-processing model results in GIS, allowing
for the determination of flood extent, spatial distribution of flood depth, flow duration, and maximum
flow velocities.
Variety of Flood-Forcing Factors
The simple approach presented above considers a local point along the river and the influence of a single forcing factor only. However, the frequency of peak discharges becomes
more complex when dealing with a variety of tributaries, especially when these arrive from subbasins
with different geological or land use characteristics. The situation becomes even more complex when
impacts from local rainfall, coasts, or large reservoirs are considered. These more complex situations
require the collection of larger quantities of data for the assessment of flood frequencies.

F L O O D R I S K M A N A G E M E N T AT R I V E R B A S I N S C A L E : T H E N E E D T O A D O P T A P R O A C T I V E A P P R O A C H 41
An additional complication is that some of these forcing factors may have a mutually dependent relation,
such as the combination of cyclone-induced storm surges and rainfall. Other combinations are fully
independent, such as rainfall and tides. As suggested above, reservoir operation in particular may be
a complicating factor in flood hazard mapping because reservoirs represent conflicting interests, such
as use for hydropower generation versus use for flood control. Hydropower generation concerns itself
with more than the available stored volume; it is linearly dependent on the water level in the reservoir,
which leads to pressure to maximize reservoir levels, which in turn increases flood hazard.
Flood Risk Mapping
While flood hazard is expressed in terms of the state of the flood situation for a selected return period, the overall flood risk is computed by integrating the risk over all individual return periods. For each return period considered, the product of hazard, exposure, and vulnerability
has to be computed or estimated. Subsequently, this risk has to be integrated over the various return
periods to arrive at a risk that the area faces as a yearly average. This calculation provides an important
input in determining the yearly budget that can be spent to reduce damage and loss.
Flood risk mapping requires the quantification of exposure in the flood-prone area. First, the
values of assets have to be estimated, often in a clustered manner. In some countries this is done by
linking the asset to the country’s fiscal system database, which is used to impose taxes on properties.
Second, all economic activities in the region have to be evaluated. For industries, this includes not only
damages to assets but the additional losses that occur when production is interrupted—e.g., employees
have to be paid irrespective of production, and clients who face a delay in receiving ordered products
may initiate a claim. An indirect impact of loss of productivity is market losses. All these factors come
into play when dealing with industries.
All other sorts of flood-related losses also have to be investigated. In São Paulo, Brazil, for
example, most of the flood-related losses arise from the interruption of traffic during floods. To reduce
these losses, many flood retention basins have been constructed. However, these investments have
not been able to keep up with the pace of urban densification. A logical step would be to address traffic
congestion in alternative ways, such as the construction of elevated highways, which are quite common
in Asian countries. So far, however, such systematic comparison of possible solutions is still lacking,
and the problems persist.

F L O O D R I S K M A N A G E M E N T AT R I V E R B A S I N S C A L E : T H E N E E D T O A D O P T A P R O A C T I V E A P P R O A C H42
A proposal for a flood hazard and risk mapping project should clearly
describe the methods and products envisaged. What the client needs should
become clear from the description given in the terms of reference for the study. A
good description is even more important when floods are caused by a variety of factors. Although
some freedom may be given to the consultant for the study, the terms of reference may also
explicitly prescribe a methodology. In any case, the quality of tools and methodology proposed, in
combination with available data, determines to a large extent the quality of flood maps delivered.
The proposed methodology should have significant weight in the assessment of the proposal’s
overall quality.
BOX 10. Practical Tip for a Flood Risk Manager
Critical Infrastructure
Life in society depends on the functioning of infrastructural facilities, which may be affected by floods. It is important to guarantee the ability of critical infrastructure to function
during floods. But this does not always happen. During the Bangkok floods of 2011, for example, the
water conveyed through the canal leading to the city water treatment plant got contaminated with
floodwater flowing through the urban environment. The treatment process could not cope with the
huge quantities of pollutants that were introduced, and the quality of water delivered was far below
standards.
More severe was the case in Serbia, where during the 2014 floods electricity production was severely affected due to the flooding of transformers and equipment. In addition, the
largest open coal mine in Kolubara got flooded up to 60 m in depth with a volume of 210 million m3.
This affected the production of the largest thermoelectric power plant in Serbia, Nikola Tesla, which
had supplied close to 50 percent of electricity in the country. It took 12 months to entirely pump out
water from the coal production fields (Balkan Energy 2016).
As part of flood management in river basins, it is very important to investigate the safety of critical infrastructure, in particular because damage to one component may affect
other components in a cascade of events. Such risks and relationships may be analyzed in exercises
involving various representative parties and other stakeholders. The outcome of such exercises
is presented in figure 25. The effectiveness of such exercises can be enhanced considerably if
supported with a rapid flood assessment tool, such as 3Di, which generates flood simulation results
in a fast and interactive way.

F L O O D R I S K M A N A G E M E N T AT R I V E R B A S I N S C A L E : T H E N E E D T O A D O P T A P R O A C T I V E A P P R O A C H 43
FIGURE 25. Example Of Relationships Between Critical Infrastructures
5 . D ATA N E E D S F O R F L O O D R I S K A S S E S S M E N TMeasurement is the first step that leads to control and eventually to improvement: “If you can’t measure
something, you can’t understand it, if you can’t understand it, you can’t control it, if you can’t control
it, you can’t improve it.” This remark of H. James Harrington touches the essence of what is required to
control and increase certainty about flood risks. Unfortunately, there are still too many cases in which
the lack of information on flood risks leads to wrong decisions and subsequent large damages. The
rather unpredictable nature of hydrometeorological conditions requires monitoring over long periods to
generate a sense—based on information—of what may happen. Detailed information on extreme flood
conditions is essential for the development of tools that simulate such extreme events. Improvements
in monitoring and surveying have been tremendous over the past decade and have led to insights into
both large trends and details of specific events. A proactive approach in flood management also asks
for a timely decision to collect data on the functioning of the river basin, subject to floods.

F L O O D R I S K M A N A G E M E N T AT R I V E R B A S I N S C A L E : T H E N E E D T O A D O P T A P R O A C T I V E A P P R O A C H44
Data Needs for Statistical Analyses
Statistical processing of raw data collected for a geographical area can help support a variety of useful and actionable information. This information can be applied for flood hazard
mapping and help to identify solutions that mitigate the effects of floods. For example, a number of
single-valued statistical parameters are frequently derived for a selected return period, such as peak
river discharge and peak sea water level. A set of parameters derived statistically, such as intensity-
duration-frequency (IDF) curves, is also commonly used to provide (for example) statistically defined
rain storms for urban drainage design.
For statistical analyses, time series data are required over a sufficient period of time, preferably without interruptions. The duration is related to the return period of the event to
be defined. As a rule of thumb, the duration of the time series has to be at least one-third of the
selected return period for the event.
In river basins, conditions under which data have been collected often evolve. In such
cases, time series data are no longer commensurable, as required for the statistical operations on
the time series. Land use change, such as deforestation and the further use of the land for
agriculture, creates a very different water balance, and the construction of a reservoir may lead
to significant changes in river runoff. Along the river, rating curves change over time due to
morphological impacts. All these factors reduce the reliability of the statistical analysis.
Some areas may be under the influence of periodic climate oscillations, such as El Niño or La Niña. Moreover, climate change leads to trends that disturb the extrapolation of the series
used to derive state parameters for selected return periods. While climate change in general is a
relatively slow process, urban heat-induced micro-climate change in cities affects convective storms,
which may lead to distinct increasing trends in urban rainfall intensities. Such trends can easily be
misinterpreted as the result of larger-scale climate change.
Despite all these changing conditions, it is useful to collect information on the hydrometeorological state of a river basin over the longer term. Trends can be identified,
and corrections required in the statistical analyses can be quantified. The identification of trends is
becoming even more valuable in light of discussions on the impact of climate changes on floods.

F L O O D R I S K M A N A G E M E N T AT R I V E R B A S I N S C A L E : T H E N E E D T O A D O P T A P R O A C T I V E A P P R O A C H 45
Data Needs for Model Development
The development of hydrological and hydraulic models requires both spatial and temporal data. Spatial data requirements include terrain information, such as elevation and
roughness; channel bathymetry; dimensions of hydraulic structures and reservoirs; etc. Models
are constructed based upon these types of data. Time series of rainfall, water levels, and water
discharges are needed for model calibration and validation but also for the simulation of intervention
options. For urban applications the time step in monitoring series must be at least one hour and
preferably more frequent—e.g., for the reproduction of cloudburst events. Whereas statistical
analyses require data covering a long period of time, model calibration and validation are better
served with time series of short duration for extreme conditions, such as extreme rainfall events,
tides, storm surges, etc. Figure 26 includes some specific types and sources of data needed in
model development.
FIGURE 26. Sources And Types Of Data Sets Required For Model Development
• Information on past flood disasters, including affected communities, extent, duration of flooding, peak flood marks, post-flooding impacts, meteorological conditions, satellite images of flooded areas, etc.
• Statistically processed data, such as spatial rainfall distributions, IDF curves for each of the river basins, areal reduction factors to be applied, etc.
• Consistency proof of level reference data
GENERAL
• River catchment delineations
• Network of hydro meteorological stations
• Rainfall time series for selected model calibration and validation events
• IDF curves and aerial reduction factors
• River and coastal water levels and discharges for selected model calibration and validation events
• GIS layers with geographics, land use, vegetation, soil type, and soil layer thickness
• River basin digital elevation model
HYDROLOGICAL MODEL DEVELOPMENT
• GIS layer with channel network
• Network of hydrological and tidal stations
• Channel cross-sections• Embankments and other
flood barriers, such as roads and railways
• Floodplain digital elevation model
• Hydraulic structure, reservoir and lake data• Hydraulic structure
dimensions• Operation rules• Reservoir or lake
bathymetry• Monitored outflows
and water levels
• Water levels and discharges• Monitored water levels
and discharges for selected calibration events
• Rating curves• Tidal and storm surge
water levels at sea boundaries
• Catchment runoff from hydrological models
HYDRAULIC MODEL DEVELOPMENT

F L O O D R I S K M A N A G E M E N T AT R I V E R B A S I N S C A L E : T H E N E E D T O A D O P T A P R O A C T I V E A P P R O A C H46
Digital Elevation Models
Most important for the modeling of flood hazards in floodplains and coastal zones are digital elevation models. In the past, these could be constructed only from topographic maps
with elevation contour lines, often at an interval of one or more meters. For the production of high-
quality flood hazard maps, these 1 m contour lines provide insufficient accuracy in flat areas, such as
floodplains and coastal zones. However, this information can still be useful in serving as a first step
in flood hazard mapping. Such rapid assessment will familiarize relevant agencies with this approach
and will provide insight into the need for more accurate surveying.
In flood hazard mapping, the vertical accuracy determines the quality of the final product. Horizontal accuracy is of lesser importance, as long as various data sources are consistent in this
respect. A 10 cm vertical accuracy is sufficient for the purpose of flood hazard mapping. Vertical
accuracies of just a few centimeters can be achieved using LiDAR technology. LiDAR data are usually
obtained from airplanes recording via GPS their position relative to satellites and measuring their
distance from the earth’s surface via laser pulses. For the inspection of line elements, such as dikes,
helicopters may also be used effectively. For smaller areas, such as cities, the use of drones is
becoming more common.
The accuracy obtained with LiDAR depends on laser quality and net point density of laser pulses (flight height and speed), as well as on other flying conditions and vegetation. The
point density also determines whether information on line elements, such as dike crest elevation or
the elevation of concrete or masonry flood protection walls, can be surveyed. The state of the art
is a point density of 8 to 10 points per m2 for planes. With helicopters, a much higher density can
be achieved. Most important is avoiding random errors, which present as errors in the level of one
point relative to other points in the flood hazard mapping domain. System-level errors will not affect
modeled flood flow patterns very much. However, if the reference level of the DEM differs from, for
example, the reference level of water level gauges or cross-section, there is a problem. Consistency
between the LiDAR and the national reference has to be checked, e.g., by using LiDAR boards to
check areas on the terrain for which the position in the national or local reference system is known.
The boards require a size that will receive a sufficient number of pulses to match their coordinates
with the LiDAR reference system.
After quality checking, raw LiDAR data have to be filtered to remove pulses reflected by vegetation. This process also allows for determining the height and type of vegetation. The
first product obtained from the LiDAR survey is the digital surface model (DSM). After removing
vegetation, buildings and similar structures also have to be filtered out to obtain the digital terrain
model (DTM), which represents the true ground levels and is presented on a grid of polygons. This
could, for example, be a 1 m2 grid covering the flood hazard mapping area.

F L O O D R I S K M A N A G E M E N T AT R I V E R B A S I N S C A L E : T H E N E E D T O A D O P T A P R O A C T I V E A P P R O A C H 47
For the purposes of modeling, this DTM can be processed further to obtain land levels for the computational grid, i.e., the DEM. Depending on the modeling system used, the grid can
range from a simple 50 m by 50 m square grid to a flexible grid composed of a variety of polygons
of different shapes and sizes. Point cloud data and the DSM and DTM also serve to identify flood
obstacles, such as embankments or other break lines that influence the propagation of floods in the
floodplain. In summary, it is useful to realize that along the path from terrain-level data surveying
to modeling, level data are presented at the following scales: (1) point cloud representation; (2)
surveyed surface data (DSM); (3) processed terrain level data (DTM); and (4) numerical model grid
elevation data (DEM). The DTM or DEM can be further complemented by integrating it with the
bathymetry of rivers, canals, lakes, reservoirs, lagoons, and other coastal waters. Such integrated
DEMs provide a lot of flexibility in defining hydrodynamic models for flood hazard mapping.
Detailed flood hazard mapping is often preceded by a rapid assessment. A useful basis
for such mapping is the SRTM (Shuttle Radar Topography Mission) data model produced by NASA.
Since 2015, terrain-level data have been available at a resolution of 1 arc second (approximately 30
m) for most of the world. The accuracy of the SRTM data set varies spatially. In some areas residual
offsets of levels cause systematic errors. Another source of errors is the presence of vegetation. A
radar pulse used in SRTM reflects a level somewhere along the height of standing vegetation, which
results in SRTM terrain levels higher than in reality. This error requires some form of correction.
Despite these shortcomings, the SRTM-derived DEM can be very useful for a first analysis of flood hazards. Though the approach certainly does not give perfect results, it is well
to remember the advice given by Voltaire: “Perfect is the enemy of good.” The DEM can be used to
construct a pilot hydrological and hydrodynamic model that gives an indication of flood-prone areas.
For these areas, the quality of the SRTM DEM can be improved by better filtering techniques and
comparison with ground reference points. The pilot model results can also serve to define areas
where LiDAR surveys are recommended to improve the quality of flood hazard maps. The DEM
generated for the LiDAR survey domain can then be complemented with an improved SRTM DEM to
cover the complete flood hazard mapping domain or even the complete river basin. This step requires
the removal of spikes and the impact of vegetation as well as further adjustments to merge the
SRTM DEM seamlessly at the contours of the LiDAR survey domain.

F L O O D R I S K M A N A G E M E N T AT R I V E R B A S I N S C A L E : T H E N E E D T O A D O P T A P R O A C T I V E A P P R O A C H48
6 . S U M M A R Y: K E Y P R I N C I P L E S F O R F L O O D R I S K M A N A G E M E N T I N R I V E R B A S I N S
Flood Management Considerations
1. Total protection against flooding in flood-prone areas cannot be guaranteed: this is
neither possible nor desirable, as the required investments would not be cost-effective.
Just as people accept other uncertainties in life, such as traffic accidents, they should accept
that “living with floods” is unavoidable. What is important, though, is that the risk is well
calculated and accepted on the basis of cost-benefit and socially acceptable principles.
2. River and coastal floodplains are attractive areas for urban, industrial, and
infrastructural developments. The decision to develop such areas must be based upon
robust cost-benefit analyses. Essential components in this decision-making process are the
assessment of flood hazards and flood risks and the identification of measures to minimize
these risks through structural interventions and nonstructural flood management support. In
the end, decisions must be based upon achieving higher societal and economic benefits than
costs, while taking into account future changes such as the impacts of climate change.
3. There is a growing tendency now to adopt a more proactive approach to flood risk
management, based on worldwide lessons learned from growing losses due to destructive
floods. The proactive approach to flood management may prevent disasters, while a “wait and
see” approach could lead to significant numbers of casualties and high economic losses.
4. Investments in structural and nonstructural flood management provide an attractive
economic rate of return. Investment decisions in flood risk management need to be
systematically based upon flood hazard mapping and flood risk assessments and the extent
to which various possible interventions, including structural and nonstructural measures,
can reduce flood risks. Nonstructural investments include good urban and land use
planning practices prior to starting the developments, which may prevent or redefine risky
investments. The higher the level of structural flood protection, the more there is a need for
complementary nonstructural measures.
5. Information support before and during a flood disaster is an essential component of
nonstructural flood management. As flood forecasts becoming increasingly accurate,
they can support planning and in many situations provide sufficient lead time for significant
potential reductions in flood damages and losses. To complement flood forecasting, there is
a need for a good information system (dealing with critical infrastructure, evacuation routes,
shelter, etc.) to enhance preparedness and support early warning during flood emergency
operations.
6. There is a need for integrated studies in flood risk management. Integrated studies are
important because flood risk management interventions have impacts outside the areas where

F L O O D R I S K M A N A G E M E N T AT R I V E R B A S I N S C A L E : T H E N E E D T O A D O P T A P R O A C T I V E A P P R O A C H 49
they are implemented. In river basins, nearly all the interventions that are feasible have positive
or negative impacts in the downstream direction, and the negative impacts should be included in
the cost-benefit analysis for the proposed project. Integrated studies are also important because
flood management interventions generally have impacts on many other aspects of river basin
management, such as environment, agriculture, drought, hydropower, etc.
7. Investing in data collection pays off in the form of more reliable structural and nonstructural
flood management investments. There is a growing interest in data collection in river basins,
but much still has to be done in this area. Many flood management studies suffer from a lack of
data, which can lead to very costly structural failures or wrong decisions in planning. Of particular
importance are digital terrain models, which provide detailed information on terrain levels to support
flood hazard mapping based upon numerical simulation modeling.
Implementing Context-Specific Interventions to Manage Flood Risks in River Basins
8. Creating flood retention storage in river basins has two important effects: it reduces
the speed of flood wave propagation, and it reduces flood peak discharges and flood
peak water levels in the downstream direction. Although in general the impact of such
interventions is positive, there are exceptions that lead to increased discharge peak values
downstream, e.g., due to changes in the arrival time of flood peaks from different river
tributaries.
9. Embanking flood-prone areas is often the most cost-effective way to protect
communities locally. It is nevertheless good practice to study potential negative impacts, as
such interventions usually increase flood risks downstream. The reduced “room for the river”
will lead to faster flood propagation downstream and higher peak flows, which may threaten
downstream embankments or infrastructure such as bridges. It is good practice when
embanking to implement compensatory measures, such as additional retention capacity
elsewhere.
10. An increase in channel conveyance capacity or channel diversions may decrease
local flood risks significantly. However, any plans for this type of intervention must take
downstream impacts into consideration, as the faster release of flood volumes may lead to
increased flood risk downstream.
11. In general, retention space along a river is most effective if installed upstream of an
area to be protected or at the flooded site. In the first case it lowers peak discharges at
the flooded site, and in the second case it lowers peak water levels at the flooded site.
12. In general, the increase of channel conveyance capacity is most effective if realized at
an area to be protected or just downstream of it. In the first case it lowers flood levels for
a given peak flow in the flooded zone, and in the second case it allows flood volume to be
released faster out of the flooded area.

F L O O D R I S K M A N A G E M E N T AT R I V E R B A S I N S C A L E : T H E N E E D T O A D O P T A P R O A C T I V E A P P R O A C H50
R E F E R E N C E S A N D A D D I T I O N A L R E A D I N G M AT E R I A L
Bakker, M. 2006. “Transboundary River Floods: Vulnerability of Continents, International River Basins and Countries.” PhD dissertation, Oregon State University.
Bakker, M. H. N. 2009. “Transboundary River Floods and Institutional Capacity.” Journal of the American Water Resources Association (JAWRA) 45, no. 3 (June): 553–66. DOI: 10.1111/j.1752-1688.2009.00325.x.
Balkan Energy. 2016. “Country Report on Energy Business in Serbia.” June. http://balkanenergy.com/files/Country_report_on_energy_business_in_Serbia_June_2016.pdf.
GFDRR (Global Facility for Disaster Reduction and Recovery). 2016. Understanding Risk—Building Evidence for Action: Proceedings from the 2016 UR Forum. Washington, DC: World Bank Group.
Hawley, K., M. Moench, and L. Sabbag. 2012. Understanding the Economics of Flood Risk Reduction: A Preliminary Analysis. Boulder, CO: Institute for Social and Environmental Transition-International.
ICPR (International Commission for the Protection of the Rhine). 2015. “Internationally Coordinated Flood Risk Management Plan for the International River Basin District of the Rhine.” Accessed December 2016. http://www.iksr.org/fileadmin/user_upload/Dokumente_en/Brochures/FRMP_2015.pdf.
Jha, Abhas K., Robin Bloch, and Jessica Lamond. 2012. Cities and Flooding: A Guide to Integrated Urban Flood Risk Management for the 21st Century. Washington, DC: World Bank.
Kocornik-Mina, A., T. K. McDermott, G. Michaels, and F. Rauch. 2015. “Flooded Cities.” CEP Discussion Paper No. 1398. Center for Economic Performance. December. Accessed December 2016. http://cep.lse.ac.uk/pubs/download/dp1398.pdf.
Ligtvoet, Willem, Henk Hilderink, Arno Bouwman, Peter van Puijenbroek, Paul Lucas, and Maria Witmer. 2014. Towards a World of Cities in 2050: An Outlook on Water-Related Challenges. Background Report to the UN-Habitat Global Report. The Hague: PBL Netherlands Environmental Assessment Agency.
Meehan, R. 2012. “Thailand Floods 2011: Causes and Prospects from an Insurance Perspective.” May 6. http://web.stanford.edu/~meehan/floodthai2011/FloodNotes17.pdf.
Molle, Francois, and Chu Thai Hoanh. 2009. “Implementing Integrated River Basin Management: Lessons from the Red River Basin, Vietnam.” IWMI Research Report 131. International Water Management Institute, Colombo, Sri Lanka.
Munich Re. 2016a. “El Niño Curbs Losses from Natural Catastrophes in 2015.” https://www.munichre.com/en/media-relations/publications/press-releases/2016/2016-01-04-press-release/index.html. Accessed December 2016.

F L O O D R I S K M A N A G E M E N T AT R I V E R B A S I N S C A L E : T H E N E E D T O A D O P T A P R O A C T I V E A P P R O A C H 51
———. 2016b. Topics Geo. https://www.munichre.com/site/touch-publications/get/documents_E1273659874/mr/assetpool.shared/Documents/5_Touch/_Publications/302-08875_en.pdf.
Oosthoek, K. J. 2006. “Dutch River Defences in Historical Perspective.” Environmental History Resources. January 21. https://www.eh-resources.org/dutch-river-defences-in-historical-perspective/.
Rijnland Water Control Board. 2009. “Flood Control in the Netherlands: A Strategy for Dike Reinforcement and Climate Adaptation.” Rijnland Water Control Board, Leiden, Netherlands. https://www.rijnland.net/downloads/floodcontrolrijnland-1-1.pdf.
Sayers, Paul, Gerry Galloway, Edmund Penning-Rowsell, Li Yuanyuan, Shen Fuxin, Chen Yiwei, Wen Kang, Tom Le Quesne, Lei Wang, and Yuhui Guan. 2015. “Strategic Flood Management: Ten ‘Golden Rules’ to Guide a Sound Approach.” International Journal on River Basin Management 13, no. 2: 137–51.
UFCOP (Urban Floods Community of Practice). 2016. “The Role of Green Infrastructure Solutions in Urban Flood Risk Management.” World Bank, Washington, DC. August. https://openknowledge.worldbank.org/bitstream/handle/10986/25112/108291.pdf?sequence=4&isAllowed=y.
UNDESA (United Nations Department of Economic and Social Affairs, Population Division). 2014. World Urbanization Prospects: The 2014 Revision, Highlights. https://esa.un.org/unpd/wup/publications/files/wup2014-highlights.Pdf.
UNISDR (United Nations Office for Disaster Risk Reduction) and CRED (Centre for Research on the Epidemiology of Disasters). 2015. “The Human Cost of Weather-Related Disasters 1995–2015.” https://www.unisdr.org/2015/docs/climatechange/COP21_WeatherDisastersReport_2015_FINAL.pdf.
World Bank. 2012. “Thai Flood 2011: Rapid Assessment for Resilient Recovery and Reconstruction Planning: Overview (English).” World Bank, Washington, DC. http://documents.worldbank.org/curated/en/677841468335414861/Overview.
———. 2014. Understanding Risk in an Evolving World: Emerging Best Practices in Natural Disaster Risk Assessment. Washington, DC: World Bank Group.
World Resources Institute. 2015. “World’s 15 Countries with the Most People Exposed to River Floods.” March 5. Accessed December 2016. http://www.wri.org/blog/2015/03/world%E2%80%99s-15-countries-most-people-exposed-river-floods.
Wright, D. B. 2015. “Methods in Flood Hazard and Risk Assessment: CAPRA Technical Notes.” World Bank Group, Washington, DC.