The NE subarctic Pacific in winter: I. Biological standing ... · PDF fileThe NE subarctic...
14
Vol. 128: 11-24,1995 MARINE ECOLOGY PROGRESS SERIES Mar Ecol Prog Ser Published November 23 The NE subarctic Pacific in winter: I. Biological standing stocks P. W. ~oyd'~', S. Strom2, F. A. whitney3, S. Doherty', M. E. wen1, P. J. Harrisonl, C. S. wong3, D. E. varela1 'Department of Oceanography. University of British Columbia. Vancouver. British Columbia. Canada V6T 124 2Shannon Point Marine Center, Western Washington University. Anacortes. Washington 98221-4042, USA 'Center for Ocean Climate Chemistry, Institute of Ocean Sciences. Sidney, British Columbia, Canada V8L 4B2 ABSTRACT: Although an extensive biological time series data set of phytoplankton and zooplankton standing stocks has been collected over a 30 yr period in the NE subarctic Pacific at Ocean Station Papa (OSP), the majority of these data were obtained before recent advances in our understanding of the structure and functioning of the manne microbial food web. In addition, recent studies did not obtain data during the winter penod. This paper provides the first contemporary biological description of the NE subarctic Pacific dunng winter Data from 2 winter cruises in the vicinity of OSP indicate that the abundance and composition of the autotrophic and heterotroph~c assemblage at these times are similar to those observed during late spring and summer by others. In contrast, winter mesozooplankton stand- ing stocks are considerably less than observed In summer. These findings confirm the hypothesis that the relatively shallow winter mixed layer permits relatively high standing stocks of phytoplankton (20 mg C m-3)and consequently of microheterotrophs (7.1 to 13.1 mg C m-7 to subsist over the winter period. An assessment of autotrophic and heterotrophic biomass suggests that the requirements of the mesozooplankton (Stages IV to VI), microzooplankton and heterotrophic nanoflagellates may poten- tially be balanced by the standlng stocks of microplankton, nanoplankton/picophytoplankton, and picoplankton, respectively. However, the carbon requirements of heterotrophic bacteria cannot be balanced without invoking slower turnover times for thls pool relative to the turnover times for the dissolved organic carbon (DOC) pool. KEY WORDS: Subarctic Pacific. Winter - Standing stocks. Autotrophs . Heterotrophs INTRODUCTION The NE subarctic Pacific is of particular interest to biological oceanographers as it is a high nutrient-low chlorophyll region where pre-formed macronutrients are available all year round whilst low levels of phyto- plankton biomass are observed (Miller et al. 1991, Miller 1993a). In addition, there are notable differ- ences in the comparative ecology of this oceano- graphic province and that of the NE subarctic Atlantic. For example, there is no evidence of a well-defined annual spring bloom in the NE Pacific (Parsons & Lalli 1988 and references therein). Such features have led to studies in this region aimed at resolving the structure and function of the NE Pacific pelagic ecosystem. Specifically, studies have attempted to determine what controls phytoplankton standing stocks (Martin et al. 1989, 1991, Frost 1991, Miller et al. 1991, Miller 1993131, and to explore reasons for the differences in the mag- nitude of the coupling between phytoplankton and herbivorous grazers in the subpolar NE Pacific and NE Atlantic (Cushing 1975, Parsons & Lalli 1988, Fasham 1995). The subarctic NE Pacific has been the focus of inten- sive sampling for over 30 yr. This work began with long-term observations from Canadian Coastguard weatherships at Ocean Station Papa (OSP) (Fig. 1) O Inter-Research 1995 Resale of full article not permitted
Transcript of The NE subarctic Pacific in winter: I. Biological standing ... · PDF fileThe NE subarctic...
Vol. 128: 11-24,1995 MARINE ECOLOGY PROGRESS SERIES Mar Ecol Prog Ser Published November 23
The NE subarctic Pacific in winter: I. Biological standing stocks
P. W. ~ o y d ' ~ ' , S. Strom2, F. A. whitney3, S. Doherty', M. E. wen1, P. J. Harrisonl, C. S. wong3, D. E. varela1
'Department of Oceanography. University of British Columbia. Vancouver. British Columbia. Canada V6T 124 2Shannon Point Marine Center, Western Washington University. Anacortes. Washington 98221-4042, USA
'Center for Ocean Climate Chemistry, Institute of Ocean Sciences. Sidney, British Columbia, Canada V8L 4B2
ABSTRACT: Although an extensive biological time series data set of phytoplankton and zooplankton standing stocks has been collected over a 30 yr period in the NE subarctic Pacific at Ocean Station Papa (OSP), the majority of these data were obtained before recent advances in our understanding of the structure and functioning of the manne microbial food web. In addition, recent studies did not obtain data during the winter penod. This paper provides the first contemporary biological description of the NE subarctic Pacific dunng winter Data from 2 winter cruises in the vicinity of OSP indicate that the abundance and composition of the autotrophic and heterotroph~c assemblage at these times are similar to those observed during late spring and summer by others. In contrast, winter mesozooplankton stand- ing stocks are considerably less than observed In summer. These findings confirm the hypothesis that the relatively shallow winter mixed layer permits relatively high standing stocks of phytoplankton (20 mg C m-3) and consequently of microheterotrophs (7.1 to 13.1 mg C m-7 to subsist over the winter period. An assessment of autotrophic and heterotrophic biomass suggests that the requirements of the mesozooplankton (Stages IV to VI), microzooplankton and heterotrophic nanoflagellates may poten- tially be balanced by the standlng stocks of microplankton, nanoplankton/picophytoplankton, and picoplankton, respectively. However, the carbon requirements of heterotrophic bacteria cannot be balanced without invoking slower turnover times for thls pool relative to the turnover times for the dissolved organic carbon (DOC) pool.
KEY WORDS: Subarctic Pacific. Winter - Standing stocks. Autotrophs . Heterotrophs
INTRODUCTION
The NE subarctic Pacific is of particular interest to biological oceanographers as it is a high nutrient-low chlorophyll region where pre-formed macronutrients are available all year round whilst low levels of phyto- plankton biomass are observed (Miller et al. 1991, Miller 1993a). In addition, there are notable differ- ences in the comparative ecology of this oceano- graphic province and that of the NE subarctic Atlantic. For example, there is no evidence of a well-defined annual spring bloom in the NE Pacific (Parsons & Lalli
1988 and references therein). Such features have led to studies in this region aimed at resolving the structure and function of the NE Pacific pelagic ecosystem. Specifically, studies have attempted to determine what controls phytoplankton standing stocks (Martin et al. 1989, 1991, Frost 1991, Miller et al. 1991, Miller 1993131, and to explore reasons for the differences in the mag- nitude of the coupling between phytoplankton and herbivorous grazers in the subpolar NE Pacific and NE Atlantic (Cushing 1975, Parsons & Lalli 1988, Fasham 1995).
The subarctic NE Pacific has been the focus of inten- sive sampling for over 30 yr. This work began with long-term observations from Canadian Coastguard weatherships at Ocean Station Papa (OSP) (Fig. 1)
O Inter-Research 1995 Resale of full article not permitted
Mar Ecol Prog Ser 128: 11-24, 1995
Nor th Paci f ic
W'N
58
56
54
52
50
48
k 46'N
Fig 1. Map of the study area showing the positions of Ocean Station Papa (OSP) and Station P23
(including McAllister 1961, Parsons 19651, followed by the oceanographic cruises conducted by scientists from the Institute of Ocean Sciences (IOS), Sidney, BC, Canada, and finally the SUPER (Subarctic Pacific Ecosystem Research) program in the 1980s (Miller 1993a). These data sets provide one of the best resolved time series for an open ocean temperate region (Banse 1990). However, while these data sets are temporally well resolved for physical (Tabata 1989 and references therein) and chemical data (Parslow 1981, C. S. Wong unpubl.), less is known about the structure and functioning of the biological components of the pelagic ecosystem at OSP for certain periods of the annual cycle.
Detailed biological time series observations are available from the winter period at OSP on zooplank- ton abundances (McAllister 1961), on changes in zooplankton composition with season and depth (LeBrasseur 1965, Fulton 1978, Miller et al. 1984), chlorophyll concentrations (Parslow 1981, Parsons & Lalli 1988, Wong et al. 1995) and microzooplankton abundances (LeBrasseur & Kennedy 1972). However, many of these winter measurements were made in the 1960s and 1970s before methodological advances enabled the recent rapid growth in our understanding of the structure and functioning of marine food webs and, in particular, the importance of the marine micro- bial food web (Reid et al. 1991, Landry et al. 1993). For example, the microzooplankton data of LeBrasseur & Kennedy (1972) were obtained by collecting samples from OSP using 44 pm mesh nets. Net collection would destroy many protists, possibly even those greater than 44 pm, and such a mesh size would have been too large to collect the majority of microheterotrophs which dominate the summer microzooplankton assem-
blage at OSP (Booth et al. 1993). Recent studies at OSP such as SUPER and VERTEX (Vertical Exchange and Transport), conducted since these conceptual ad- vances in microbial ecology, have added much to our understanding of this pelagic ecosystem. However, since data were collected only during the period April to September, these studies have not added to the pre- vious preliminary winter biological observations made at OSP.
Models of the subarctic Pacific suggest that the winter phytoplankton dynamics are a key determi- nant of biomass patterns over the rest of the annual cycle (Evans & Parslow 1985, Frost 1993, Fasham 1995). Standing stocks of phytoplankton and zoo- plankton are predicted to remain high in this region over the winter period due to the relatively shallow winter mixed-layer depth (Evans & Parslow 1985, Frost 1993, Fasham 1995). The shallow winter mixed layer is maintained in this region due to strong year- round stratification caused by the presence of a per- manent halocline a t 120 m (Dodimead et al. 1963). These mixed layer conditions are thought to permit phytoplankton to maintain net production over this period and thus sustain a population of zooplankton, which in turn precludes a spring phytoplankton bloom due to the close coupling of herbivore and phytoplankton populations over the annual cycle. This close coupling between prey and grazers was supported by the findings of the SUPER program, but modified to suggest that protozoa rather than large zooplankton kept the phytoplankton stocks under control (Miller et al. 1991). Miller et al. (1991) pro- posed that the reduced illumination during winter would slow phytoplankton growth, but that their stocks would be little reduced as physical mixing was insufficient to sweep away the phytoplankton or the relatively high winter standing stocks of microzoo- plankton. However, this theory remains untested, and information is required to examine the relationship between phytoplankton stocks and their protozoan grazers during winter (Miller 1993a).
This study presents the first contemporary winter biological study of the subarctic Pacific and therefore provides the opportunity to test the validity of recent theories to explain the pelagic ecology of this region in winter.
MATERIALS AND METHODS
Samples were obtained in the NE subarctic Pacific on 2 occasions in March 1993 (14 and 15) from OSP (50" N, 145' W) and on 13 February 1994 from Station P23 (49" 48' N, 142" 27' W) (Fig. 1); adverse weather prevented the ship from reaching OSP in winter 1994

Boyd et al.: NE Pacific winter stocks
Due to reduced personnel in March 1993 and weather conditions in February 1994 some data were not avail- able for both years. The 2 sampling sites were consid- ered comparable on the basis of evidence of low spa- tial variability from survey data underway (Boyd et al. 1995, this issue). Temperature and salinity readings were obtained using a Guildline CTD (Smith Falls, ON, Canada) calibrated with discrete salinity and thermometer values. In situ vertical profiles of photo- synthetically active radiation (PAR) and incident solar PAR were measured using factory calibrated LICOR 1000 sensors of identical design. The incident solar PAR sensor was mounted in a shade-free area of the ship. The collection interval and integration proce- dure for PAR data were as described by Welschmeyer et al. (1993). The mixed layer depth of the water col- umn was estimated using the median depth of the region in the upper water colun~n where a 0.5"C decrease in temperature was first observed (after Lev- itus 1982).
In 1993, samples were collected for nutrient analysis from the Niskin water bottle rosette to which the CTD was attached and were measured shipboard using a Technicon AutoAnalyzer. In 1994, nutrient samples were obtained using clean 10 1 Go-Flos. Nitratehitrite and silicate were analysed using Technicon (1977a) and Technicon (1977b), respectively. Phosphate was analysed using an automated adaptation of the method of Murphy & Riley (1962), as outlined in Grasshoff et al. (1983). Samples for particulate organic carbon (POC) and particulate organic nitrogen (PON) analyses were collected on 0.8 pm porosity silver filters and com- busted at 975°C using a Carlo Erba C440 elemental analyser following Parsons et al. (1984).
Water samples for biological measurements were collected using clean 30 1 (1993) and 10 1 (1994) Go- Flos on Kevlar line. To estimate size-fractionated chlorophyll concentration, phytoplankton were collec- ted both under gravity on 18 pm pore-size polycar- bonate filters and using < l 0 0 mm Hg vacuum on 5 pm and 0.2 pm pore-size polycarbonate filters in a frac- tionation cascade (Joint & Pomroy 1983). Chlorophyll a (chl a) was measured by in vitro fluorometry on samples extracted for 24 h using 90 % acetone using a Turner Designs model 10 fluorometer (Parsons et al. 1984) and calibrated with standards derived from commercially prepared chlorophyll (Sigma Chemical Company, St Louis, MO, USA), the concentration of which had been checked spectrophotometrically. Samples for microscopical counts (diatoms) were preserved in Lugol's iodine and counted with an in- verted microscope (Utermohl 1958) whilst autotrophic flagellates and cyanobacteria were counted using epi- fluorescence microscopy after Booth et al. (1993). Estimates of the abundances of autotrophic dino-
flagellates were obtained from total dinoflagellate counts determined using epifluorescence microscopy (see below); the proportion of autotrophic and het- erotrophic dinoflagellates in the samples was calcu- lated by multiplying the total by a factor of 0.72 and 0.28 for heterotrophic and autotrophic components, respectively. These factors were based on the analysis of 3 samples from OSP in March 1993 (0.72 + 0.03).
Heterotrophic bacteria and heterotrophic nano- flagellates were enumerated using epifluorescence microscopy using 0.2 pm and 2.0 pm pore-size poly- carbonate filters after Turley & Hughes (1992) and fol- lowing Sherr et al. (1993), respectively. Modifications to the staining procedure of Sherr et al. (1993) included using both DAPI and proflavin hemisulfate. Two types of samples for microzooplankton enumera- tion were collected. For inverted microscopy (Uter- mohl 1958), approximately 750 m1 of seawater was drained directly from Niskin bottles into sample bot- tles containing 50 m1 of acid Lugol's solution for a final Lugol's concentration of 6%. Sample collection was in accordance with the recommendations of Gifford (1993) in an effort to avoid cell breakage. All ciliate, dinoflagellate, and sarcodine cells > 5 pm in length were enumerated, dimensions were measured, and cell volumes were calculated using a microcom- puter-aided digitizing system (Roff & Hopcroft 1986). Samples for epifluorescence microscopy were fixed with glutaraldehyde, DAPI-stained and filtered ac- cording to Sherr et al. (1993) using 5 pm pore-size polycarbonate filters with 8 pm pore-size cellulose backing filters. Dinoflagellates were enumerated at lOOOx using the characteristic condensed chromo- somes of the dinokaryon (visible under UV illumina- tion) and cell morphology as identification criteria. Cells were classed as autotrophs or heterotrophs based on the presence or absence of red fluorescing chloroplasts under blue illumination.
Mesozooplankton were collected at night using a modified WP I1 (57 cm diameter) net equipped with a 295 pm mesh. Vertical hauls were performed at 3 zones in the water column, 0 to 100, 100 to 200 and 200 to 500 m in triplicate at OSP in winter 1993, and from 0 to 100 m at Station P23 in 1994. Filtration vol- ume was not metered; however, the net diameter and vertical depth sampled gave an approximate volume sampled of 25 m3 per 100 m water column sampled. All samples were preserved in a 4 % buffered formalin- seawater solution. Laboratory subsampling of pre- served specimens was done with a modified Motoda splitter (Motoda 1959). Enumeration of subsampled fractions was made so that a minimum of 100 individu- als of older stage Neocalanus spp. , Eucalanus bungii and Metridia pacifica were counted. No subsampling was done for salps or for large copepods whose abun-

Mar Ecol Prog Ser 128: 11-24, 1995
dance was low (<l00 per net haul). No distinction was made between N. plumchrus and N. flemingeri. Thus N. plumchrus herein refers to both N. plumchrus and N. flemingeri.
Biomass conversions. Biomass calculations for cyanobacteria and for autotrophic and heterotrophic flagellates follow Booth et al. (1993). An additional esti- mate of phytoplankton carbon was available from size- fractionated chlorophyll data converted to carbon using a carbon:chlorophyll ratio of 50 after Kirchman et al. (1993). Heterotrophic bacteria were converted into units of carbon using a conversion factor of 20 fg C cell-' (see Kirchman et al. 1993). Cell volumes of cili- ates were converted to biomass assuming a carbon con- tent of 0.19 pg C pm-3 (Putt & Stoecker 1989), of dino- flagellates assuming a carbon content of 0.14 pg C pm-3 (E. Lessard pers. comm.), and of all other organisms according to Strathmann (1967; his Fig. 4). Mesozoo- plankton carbon was estimated from dry weight, cor- rected for preservation effects after Giguere et al. (1989), and converted to carbon using conversion fac- tors for Neocalanus plumchrus after Miller (1993a, b) and for all other species after Omori (1969).
A TEMPERATURE ('C)
4.5 5.0 5.5 6.0
SALINITY ( X . )
B PAR (#m01 ma a-')
0 50 l00 150 200 250 300 350 40u 0
RESULTS
Physical/optical properties
Vertical profiles of temperature and salinity were available only for March 1993; values of 5 . 7 0 ~ and Fig. 2. (A) Temperature (solid line) and salinity profiles
(dashed line) at OSP on March 14 1993. (B) Underwater PAR 32,57%1 respectively' were observed in the upper profile at 11:OO h local time, 13 March 1993 (note effects of water column (Fig. 2A). On the basis of temperature ship shadow between 0 and 20 m) change (Levitus 1982) and sigma-t, the mixed layer depth was ca 100 m (Fig. 2A). In February 1994, adverse weather conditions prevented CTD deploy- ment; however, surface measurements of a tempera- ture of 5.5"C and salinity of ca 32.5%0 were available from the shipboard thermosalinograph and were assumed to be representative of mixed layer condi- tions. During the March 1993 cruise, values of inci- dent PAR over a period of 4 d at OSP ranged between <50 and 900 pm01 photons m-2 S-' over the daylight period (<l2 h), giving a total PAR of 18.3 to 21.2 m01 photons m-' d-' for 12 to 15 March inclusive. The 1 % light depth in 1993 was ca 80 m (Fig. 2B). No incident or subsurface PAR data were obtained during the February 1994 cruise.
Nutrients
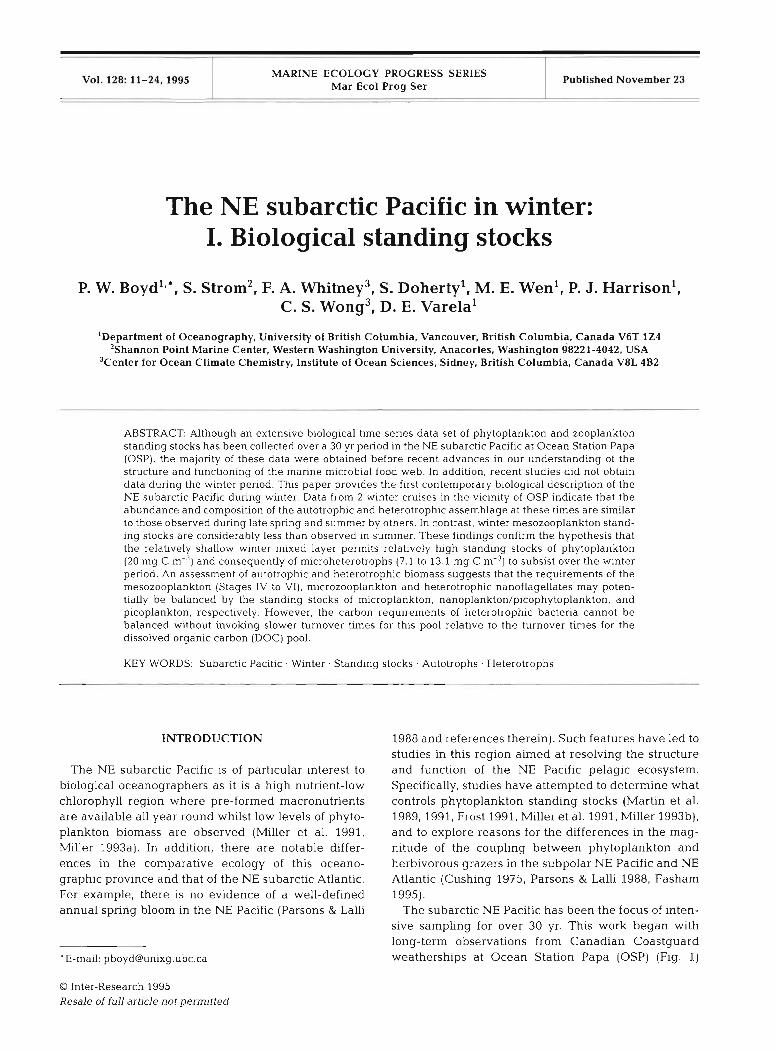
In general, nitrate, phosphate, silicate, and nitrite concentrations in both winter 1993 and 1994 were uniform over the upper water column (Fig. 3) and
increased below the top of seasonal halocline (>l00 m). Nitrate, nitrite and phosphate showed some interannual variability in concentration, averaging 11 .O, 0.17 and 1.1 pM respectively (Fig. 3). Silicate con- centrations measured in winter 1994 were 3.2 PM lower than in the corresponding period in 1993. In March 1993, ammonium ranged from 0.2 to 0.4 FM and urea ranged from undetectable to 0.20 pM over the upper water column. POC concentrations ranged from 30 to 56 pg 1-' in the upper water column and averaged 34 pg I-'. The mean ratio of POC/PON within the upper water column (0 to 70 m) was 4.5.
The planktonic assemblage
Cells < 5 pm dominated the phytoplankton assem- blage in both winter studies, in general malung up >50% of the total chlorophyll biomass which ranged from ca 0.25 pg 1-' in March 1993 to 0.37 pg 1-' in Feb-
Boyd et al.. NE Pacific winter stocks 15
SILICATE ( p H ) NITRATE (pM)
0 5 1 0 1 5 2 0 2 5 3 0 3 5 4 0 4 5 0 5 10 15 20 25 30
Fig. 3. Vertical profiles of silicate, nitrate, nitrite and phosphate from OSP on 14 March 1993 and from Station P23 on 13
February 1994
Fig. 4. Size fractionated chlorophyll distributions in the upper water column at OSP for (A) 13 arch, [B) 14 March, (C) 15 March 1993 and (D) 13 February
1994 at Station P23
NITRITE (pM) PHOSPHATE (pM)
CHLOROPHYLL ( p g L ) 0.0 0.1 0.2 0.3 0.4 0.5
CHLOROPHYLL ( p g L " ) 0.1 0.2 0.3 0.4 0.5

16 Mar Ecol Prog Ser 128: 11-24. 1995
AUTO. NANOPLACELLATES CYANOBACTERIA
ruary 1994 (Fig. 4). Autotrophic nanoflagellates and cyanobacteria were the most numerically abundant autotrophs at Station P23, with concentrations of the order of 2 X 10⁶ cells 1-' and 8 X 10⁶ cells I-', respectively (Fig. SA, B). Diatom abundances in the upper water column at OSP in 1993 ranged from 0.8 X 10⁵ to 1.9 X
105 cells l-' and were dominated by small pennates (Fig. 5C). In winter 1993, autotrophic dinoflagellate abundances at OSP ranged from 1.9 X 10³ to 4 . 3 X 10³ cells 1-' (Fig. 5D) and were dominated by Gymno- dinium spp. and Gyrodinium spp. <25 pm in length
Heterotrophic bacterial numbers in the upper water column at Station P23 ranged from 0.55 to 0.83 X
log cells 1-' (Fig. 6A). As observed for the autotrophic nanoflagellates (Fig. SA), the heterotrophic flagellates at Station P23 were dominated by cells within the <5 pm size class, with abundances of around 4.5 X
105 cells I-', which was more than an order of magni- tude more cells than observed in the 5 to 10 pm and 10 to 20 pm size classes (Fig. 6B) The total abundance of heterotrophic flagellates was ca 5.0 X 10' 1" (Fig. 6B).
Within the microzooplankton, ciliates (mainly alori- cate choreotrichs) and heterotrophic dinoflagellates were the most abundant heterotrophs and were pre- sent at abundances around 6 X 10³ to 12 X 10%ells 1-' In
DIATOMS AUTO. DINOPLAGELLATES
( * 1 0 ~ ~ s l l a L-~) ( 0 i ~ ' ~ s l l a L- l ) 0.0 0.4 0.8 1.2 1.6 2.0 0 1 2 3 4
Fig. 5. Upper water column abun- dances of: (A) autotrophic nano- flagellates (3 size classes), (B) cyanobacteria at Station P23 on 13 February 1994, (C) diatoms on 14 March 1993 and (D) autotrophic dinoflagellates est~rnated at OSP on 14 (0) and 15 (m) March 1993. The legend in (A) refers only to (A). Error bars represent X* 1 SD ( n = 3)
0
the surface mixed layer at OSP (Fig. 6C, D). By con- trast, tintinnids (>B0 pm in length) were observed at only 1 depth (50 m) and at low abundances. Other ciliates and microheterotrophs were observed at low levels (generally c500 cells I-') over the upper water column (data not shown). The average length of the ciliates (aloricate and others) and heterotrophic dino- flagellates was around 20 pm, with little variation in organismal length over the upper water column.
Mesozooplankton hauls from both years indicated that the 4 major grazers as outlined by Parsons & Lalli (1988), Neocalanus plumchrus, N. cristatus, Eu- calanus bungii and Metridia pacifica, were present (Table 1). In winter 1993, with the exception of M. pacifica (female CV and CV1 stages), the greatest abundances of mesozooplankton were found in the 200 to 500 m depth horizon (Table 1) and the populations were composed mainly of Stage V and V1 copepodids. Therefore the major grazers in summer were present in low abundances in the upper mixed layer during winter. Due to weather conditions in 1994, only the upper 100 m of the water column were sampled; for this depth horizon there was considerable interannual variation in mesozooplankton abundance and in the stages present (Table 1).
0

Boyd et al.. NE Pacific winter stocks 17
HETEROTROPHIC
BACTERIA (* 1 0 9 C e l l = L-'1
HETEROTROPHIC
FLAGELLATES (* 1 0 6 C a l l s L-l)
- 20 Ei V
Fig. 6. Upper water column abun- dances of: (A) heterotrophic bacte- 2 40 ria and ( B ) heterotrophic flagellates a (3 size classes) at Station P23 on 13 W
n February 1994; (C) heterotrophic 6 0 cdiates, and (D) heterotrophic dino- flagellates at OSP on 14 (0) and 15 (0) March 1993. The legend in
B 0
(B) refers only to (B) . Error bars represent X * 1 SD (n = 3) 100
HETEROTROPHIC HETEROTROPHIC
CILIATES (* 1 0 C e l l s L-') DINOFLAGELWTES (* 1 0 3 C e l l s L-l)
0 2 4 6 8 1 0 1 2 0 2 4 6 8 1 0 1 2 0 0 l I B, l
DISCUSSION
Comparison with previous OSP winter data
The availability of a long time senes of physical data (summarized by Tabata 1989) permits a comparison of the temperature and salinity data collected in the pre- sent study (Fig. 2A) with the average winter values from the OSP time series. The upper water column salinity profile in March 1993 corresponds with the zonation described by Dodimead et al. (1963) who dis- tinguished 3 permanent zones in the water column (upper 0 to 100 m, a halocline from 100 to 200 m where salinity increases from 32.8 to 33.8%0, and a lower zone). Also, the estimated mixed layer depth of ca 100 m concurs with the findings of Dodimead et al. (1963) who reported that the upper limit of the halo- cline corresponds to the maximum depth of the surface mixed layer attained in March. In 1994, although no temperature or salinity profiles were obtained, the sur- face temperature (5.5"C) and salinity (32.5%0) were comparable to those noted for the mixed layer in win-
ter 1993. At OSP, surface temperatures increase from about 5°C in winter to 13OC in late summer over the an- nual cycle (Dodimead et al. 1963, Tabata 1989). Thus, although the data presented were obtained over rela- tively short periods during winter, the observed upper water column temperature and salinity structures and the estimated depth of the mixed layer appeared to be representative of winter conditions at OSP.
Parsons & LeBrasseur (1968) estimated the mean PAR for January, February and March 1964 to be 0.28, 0.45 and 0.80 m01 photons m-2 h-'. In March 1993, slightly higher mean hourly PAR values of 1.5 to 1.8 m01 photons m-* h-' over a 4 d period were noted. Secchi disk depths (as representative of the 10 % light level) at OSP were available in the 1960s and 1970s for January, February and March and ranged from 15 to 25 m over this period (Parslow 1981). This compares to a 10 % isolume depth of ca 30 m at OSP in March 1993 (Fig. 2B).
The mean winter mixed-layer levels of nitrate previ- ously measured at OSP were between 10 and 15 pM (Anderson et al. 1969, Parslow 1981, Parsons & Lalli

18 Mar Ecol Prog Ser 128: 11-24, 1995
CV (M + F)
CIV (M + F)
FCV + CV1
Table 1. Mesozooplankton abundances for 14 March 1993 (03:OO h) and for 13 February 1994 (19:OO h) expressed as number of individuals per 100 m2 (r SE from 3 replicate vertical hauls). M and F: male and female animals, respectively
Species Stage Depth (m) March 1993 February 1994
Neocalancls plumchrus CV 0-100 1.3 * 1.3 0 100-200 1.3 * 1.3 200-500 6.4 * 4.0
CIV 0-100 0 294 * 7.4
Neocalanus cristatus CV 0-100 13.3 i 9.3 0 100-200 16.0 i 10.1 200-500 23.5 i 4.6
CIV 0-100 0 0
Eucalanus bungii ( M + F) CV1 0-100 1.3 i 1.3 40 i 2.3 100-200 8.0 * 8.0 200-500 32.0 * 13.0
0-100 18.7 * 5.8 63 * 21.8 100-200 56 i 23.5 200-500 55 + 19.4
0-100 9.3 * 3.5 40 i 12.9 100-200 12.0 * 12.0 200-500 11.2 5 7.0
Metridia pacdica 0-100 436 r 94.4 100-200 21.4 i 11.6 200-500 32.6 * 19.8
MCV + CV1 0-100 161 * 67.4 100-200 87 * 68.8 200-500 165 * 19.5
1988). The nitrate levels fall within this winter range, again suggesting that conditions in 1993 and 1994 were representative. No published data are available for winter silicate, nitrite and phosphate concentra- tions; however, a comparison with the 20 yr data set of C. S. Wong (unpubl.) suggests that the values from the present study are typical of OSP winter concentrations. Reasons for the interannual variability observed for sil- icate and to a lesser extent nitrate in the present study are not known at present. There is no previous record of winter measurements of ammonium or urea at OSP. Frost (1993) and Fasham (1995) in modelling studies assumed a value of 0.1 pM ammonium, comparable to the lower range of observed ammonium concentra- tions in the mixed layer in March 1993.
The range of chlorophyll concentrations (Fig. 4) was of the same order as values reported throughout the annual cycle at OSP and which were observed to remain close to 0.3 pg 1-' (Parslow 1981, Parsons & Lalli 1988, Miller 1993a, Wong et al. 1995). Specifically for winter conditions, Parsons (1960) measured chloro- phyll concentrations in mid-March 1960 ranging from 0.26 to 0.50 pg 1-' from 0 to 75 m, slightly higher than observed in 1993 and 1994. No previous data are avail- able on the partitioning of chlorophyll within different size classes during winter. In addition, with the excep- tion of some observations on winter diatom abun- dances by Clemons & Miller (1984), the winter species
composition of the phytoplankton assemblage is poorly known. Clemons & Miller (1984) reported diatom abundances of 210 to 346 cells 1-' at OSP in February 1981, which were considerably less than those ob- served in the present study (Fig. 5C); this difference was probably due to their sampling methods which used a 73 pm mesh. There are also no literature values for the abundances of heterotrophic flagellates or bac- teria at OSP during winter.
Prior to the SUPER program, little work had been carried out on the abundances of microzooplankton at OSP at any time of the year. During the period 1966 to early 1968, LeBrasseur & Kennedy (1972) sampled mi- crozooplankton retained by 44 pm mesh nets and ob- served that the abundance and biomass of the smaller organisms were greatest in the winter months at OSP. In the 44 to 125 pm size class, they reported >29000 microzooplankton m-3 in the upper 100 m for January, >l300 for February and >g800 for March. In addition, they noted changes in the dominant groups withln the microzooplankton, finding mainly sarcodines (in- cluding Collosphaera spp.), Pseudocalanus nauplu, Oithona nauplii and copepodites in January and Feb- ruary 1967, and mainly dinoflagellates, Globigerina and Pseudocalanus nauplii in March 1967. Unlike the present study, they observed no heterotrophic ciliates; their reported abundances of dinoflagellates, which were mainly Peridinium and Ceratium spp., were 1.8

Boyd et al.: NE Pacific winter stocks 19
and 1.0 cells I-', respectively, within the upper water column. Such dinoflagellate densities are several or- ders of magnitude less than those found in the present study (Fig. 6D). Given that the mean length of the di- noflagellates and ciliates in the present study is around 20 pm the resulting differences in microzooplankton abundance between the 2 studies are not surprising. Indeed, Parslow (1981) reported that the estimates of average zooplankton biomass [including LeBrasseur & Kennedy's (1972) microzooplankton data] still left un- accounted for ca 85 % of the estimated total non-plant protein in seawater.
Due to the nature of the sampling program in winter at OSP, more is known of the mesozooplankton than of the trophic levels above or below (Parslow 1981). Indeed, the time series of zooplankton observations from OSP weatherships extends from 1956 to the mid 1970s and is one of the most extensive open ocean data sets of its type. Based on surface and vertical hauls from 1956 to 1958, McAllister (1961) described a winter minimum in mesozooplankton biomass from Decem- ber to March and a summer maximum from April to July. Mesozooplankton carbon over the annual cycle ranged from < 5 mg C m-3 in winter to >35 mg C m-3 in early summer in the upper water colun~n (data from Fulton 1978, see Fig. 6 in Frost 1987). The magnitude of reported winter biomass levels is similar to that obtained in the present study in the upper water col- umn (0.3 to 1.3 mg C m-3).
Parsons & Lalli (1988) summarized most of the zoo- plankton time series observations and concluded that mainly copepods dominate the mesozooplankton community in spring and early summer. Miller et al. (1984) reported Neocalanus plumchrus and N. crista- tus winter abundances in 1980 from 0 to 100 m tows of 166, 458, and 832 animals m-2 for C l , C2, and C3 stages of N. plumchrus and 33, 166 and 73 animals m-2 for N. cristatus C l , C2, and C3 stages respec- tively. They also observed ca 10 and 20 to 50 N. plum- chrus Stage CV m-2 for the 0 to 100 m and 100 to 2000 m depth horizons, respectively, in early March at OSP in 1981. LeBrasseur (1969) suggested that smaller copepods such as Pseudocalanus, Calanus pacificus and Metndia pacjfjca are important in fall and winter. With the exception of the C1 to C3 stage data, the zooplankton species composition observed by LeBrasseur (1969), Miller et al. (1984) and Batchelder (1985) compare favorably with the data obtained in the present study.
Comparison with summer OSP SUPER program data
The winter data collected during the present study have been assumed to be representative of winter
conditions; however, they were obtained over rela- tively short time periods, and as such cannot provide any information on intraseasonal variations in the abundances of components of plankton. Comparisons of chl a levels and the dominant groups within the phytoplankton between summer and this winter study suggest that the phytoplankton assemblage is similar both in terms of standing stocks and gross tax- onomic composition (Table 2). A comparison between summer and winter heterotroph abundance and com- position data, as represented by our data, also indi- cates that a similar community is present during both seasons (Table 2). However, heterotrophic dinoflagel- lates were considerably more abundant during sum- mer, while heterotrophic ciliates were more abundant in winter (Table 2). The largest difference between winter and summer standing stocks is for mesozoo- plankton biomass which was more than 10-fold higher in summer than in winter, as might be expected from knowledge of zooplankton life histo- ries in this region (Miller et al. 1984, Parsons & Lalli 1988). It is of interest to note that comparable levels of total standing stocks (autotrophs and heterotrophs) between summer and winter were observed even though winter rates of primary production and micro- zooplankton grazing were considerably lower than reported during summer (Boyd et al. 1995). The implications of this are discussed in more detail in Boyd et al. (1995).
Partitioning of winter pelagic planktonic biomass
From this contemporary biological data set for the winter period, it was possible to investigate the parti- tioning of biomass within the autotrophic and het- erotrophic components of the pelagic ecosystem to assess whether the system was at this time balanced with respect to the carbon supply and demand of the autotrophs and heterotrophs (Fig. ?A). As some of the standing stock measurements such as those for het- erotrophic ciliates in 1993 and heterotrophic flagel- lates in 1994 were obtained in one year but not the other, the budget is based on a composite data set and caution must be used when applying it to all winter conditions. Summation of the standing stocks in the winter budget gives a range of carbon of 38 to 49 mg C m-3. This total is similar to upper water column POC measurements (30 to 56 mg C m-3) and suggests that the detrital component of POC is low during winter. The winter stocks of microheterotrophs are similar to those of the autotrophs (Fig. 7A). Model simulations of the ecology of this region (Fasham 1995) have demon- strated that this is a required condition for prevention of a spring bloom.

20 Mar Ecol Prog Ser 128: 11-24, 1995
Table 2. Comparison between winter standing stocks from the present study with summer standing stocks at OSP obtained during the SUPER program
Standing stocks Winter Summer
Total chlorophyll (mg m-2) 20-28 (ca 0-80 m) (n = 3) 19.7-31.7d (0-80 m) Total autotrophic C (mg m-2) 1600 (ca 0-80 m) (n = 2) 842-2181' (0-80 m) Diatoms (X 10' I-') 8.4-19.4 3 1' Autotrophic nanoflagellates ( X 106 1.') 1 3-2.2 2.1a Autotrophic dinoflagellates ( X 103 I-') 1 8-4.4 2.Ea Cyanobacteria ( X 106 I-') 7.1-9.2 10.9" Heterotrophic bacteria (X 10' I-'] 0.6-0.8 0.7-1.0~ Heterotrophic flagellates
Total (X 10' I-') 2.9-15.3 14.6a < 5 pm (X 10' I-') 2.9-4.6 1 .4a 5-10 pm (X 104 1-l) 0.8-3.1 4.3a 10-20 pm (X 104 1-l) 0.2-3.8 4.0a
Heterotrophic ciliates ( X 103 I- ' ) 2.2-10.1 2.0-6.0' Heterotrophic dinoflagellates (X 103 1.') 4.2-11.5 35.aa Mesozooplankton (mg C m-3) 0.3-1.3 >35d Total heterotrophic C (mg m-2) 568-1048 (0-80 m) (n = 2) 769-1311a (0-80 m)
dBooth et al. (1993); range of mean area1 biomass: autotrophic (n = 6) heterotrophic (n = 4) , mean cell concentrations (5-25 m) for all SUPER cruises
bRange of values (May); Kirchman (1990) 'Strom et al. (1993) range of cell concentrations (May and June) dFrost (1987) from Fulton 1978
A comparison of winter with summer stocks sug- gests that, with the exception of mesozooplankton, the biomass of the autotrophic and heterotrophic compo- nents are similar between seasons (Fig. 7). The com- position of the microzooplankton community differs between seasons with ciliates constituting a larger fraction during the winter (65 to 78 % of heterotrophic biomass) while the heterotrophic dinoflagellates were dominant in summer (69 to 81 % of heterotrophic bio- mass). However, the carbon conversion factors for het- erotrophic dinoflagellates in the present study were different from those used by Booth et al. (1993); the former gave a larger estimate of dinoflagellate bio- mass than the latter. Thus the contribution of the dinoflagellates to the winter microzooplankton stocks may be overestimated. While seasonal differences for the mesozooplankton may be understood from zoo- plankton life cycles in this region, reasons for the seasonal variations in the standing stocks of hetero- trophic ciliates and heterotrophic dinoflagellates are less obvious. It is possible that the higher abundances of heterotrophic dinoflagellates in summer are due to different growth rate responses to temperature as compared to the heterotrophic ciliates or to transient effects associated with the high potential growth rates of protists (Fenchel 1982).
Modelling studies of this pelagic ecosystem by Frost (1993) and Fasham (1995) included a general herbivore component, which presumably was com-
posed of the mlcrozooplankton and a proportion of the mesozooplankton community, and predicted win- ter stocks of ca 8 and 6 mg C m-3, respectively. These predicted herbivore stocks are comparable to those observed in the present study (Fig. ?A). How- ever, while the magnitude of observed winter micro- zooplankton stocks are similar to those reported in summer (Fig. ?B) both models predicted considerable increases in herbivore biomass, from mnter to sum- mer, in their simulated annual cycles; Frost's (1993) model predicts a 4-fold increase in herbivore biomass over this period and Fasham's (1995) simulations show a 12-fold increase. While mesozooplankton stocks have been reported to be maximum in sum- mer and minimum in winter (Fulton 1978) it is not known what proportion of the stocks are herbivores and how the magnitude of mesozooplankton herbi- vore stocks change over the annual cycle. However, as mesozooplankton herbivores consume < l 5 % of primary production during summer at OSP (Dagg 1993), the microzooplankton are likely to be the dominant herbivores at OSP. Thus the simulations of herbivore biomass over the annual cycle in both models showed seasonal trends which may not be observed in the field and predicted summer standing stocks which may be too high.
In Fasham's (1995) model, the mesozooplankton were separated into carnivore and herbivore compo- nents: the herbivore component contained both meso-

Boyd et a1 . NE Pacific winter stocks 2 1
WINTER CARBON BUDGET (mg C )
A
Heterotrophic Bacteria 11-14.7
(22-29.4) n Plco- Phytoplankton
Phytoplankton
Micro- Phytoplankton
flagellates 0.5-4.7
Micro- zooplankton 6.6-8.4 (18.9-24.0) n
SUMMER CARBON BUDGET (mg C
B
Heterotrophic Bacteria 12.8-18.3
(25.6-36.6) n Pico- Phytoplankton
7.0-14.7 n flagellates
1.2-9.7
Phytoplankton 3.0-10.5 R
Meso- Zooplankton
0.3-1.3 (1.2-5.2) n Micro-
Phytoplankton 0.5-2.0 n
zooplankton 3.1-8.7
Zooplankton
Fig. 7. A schematic of the part~tioning of biomass between autotrophic and heterotrophic components of the plankton within the surface mixed layer: (A) winter (from present study), and (B) summer (from SUPER program; data derived from Fulton 1978, Booth et al. 1993, IClrchman et a1 1993) at OSP. The value in each box represents mean upper water column standing stock (0 to 80 m); values in parentheses represent calculated mean carbon requirement by each box. Carbon requ~rement is calculated using standing stock multiplied by (I/growth efficiency). Growth efficienc~es used in the budget were: 0.5 (heterotrophic bactena, Krchman et al. 1993), 0.4 (heterotrophic nanoflagellates; Fenchel 1982). 0.35 (heterotrophic dinoflagellates; Hansen 1992). 0.35 (heterotrophic ciliates; Verity 1985, 1991) and 0.25 (mesozooplankton; Michaels & Silver 1988). Arrows indicate the likely trophic relationships between prey and predators. Bacterial carbon supply is not indicated, but is assumed to be obtained from a general
DOC pool
zooplankton and microzooplankton, but used herbi- vore parameters more typical of microzooplankton. This division of the mesozooplankton into different trophic levels is likely to explain the disparities between the predicted and observed stocks. Frost's (1993) 'standard' model also predicted elevated sum- mer herbivore stocks relative to observed values. How- ever, when Frost (1993) re-ran the model using nanoplankton sized herbivores, with associated higher herbivore maximum specific ingestion and mortality rates, the predicted summer herbivore stocks were similar to observed summer values but the predicted winter stocks became lower than observed in the pre- sent study.
As implied by the findings of the present study, Frost's (1993) model predicted low concentrations of detrital material during the winter period. No compar- ison between observed heterotrophic bacteria, pico-,
nano- or microphytoplankton and model simulations could be made as they were not considered by these models.
In an attempt to assess the observed partitioning of biomass between the components within the micro- bial food web, the carbon requirements of each com- ponent were calculated. As there are no measures of growth efficiency at OSP during winter, or indeed during summer (Frost 1991), growth efficiencies were selected from the literature (see Fig. 7 legend). If it is assumed that all components had similar biomass turnover times, heterotrophic bacteria have the largest carbon requirement within the winter pelagic ecosystem (Fig. ?A). As the winter bacterial carbon requirement is greater than the fixed carbon in all 3 fractions of the phytoplankton (Fig. ?A), and as the turnover of phytoplankton carbon is relatively low (Boyd et al. 1995), it is unlikely that sufficient carbon

Mar Ecol Prog Ser 128: 11-24. 1995
substrates can be supplied from phytoplankton exu- dation or due to sloppy feeding by grazers. Kirchman (1990) reported that heterotrophic bacteria in this oceanic region have low growth rates (due to temper- ature or substrate limitation) relative to the dominant autotrophs and microheterotrophs. Thus, under these circumstances it is conceivable that the relatively high bacterial carbon demand could be balanced over a longer period.
Again, assuming similar biomass turnover times for all components, the biomass of the photosynthetic picoplankton and heterotrophic bacteria appears to be sufficient to meet the winter carbon requirements of the heterotrophic flagellates. In addition, microphyto- plankton and microzooplankton stocks are at least equal to the winter carbon requirements of the meso- zooplankton (Stages IV to VI; Fig. ?A). In order to meet the winter carbon requirements of the microzooplank- ton, in addition to the nanophytoplankton and het- erotrophic flagellate carbon, it is necessary to direct at least 50% of the winter picophytoplankton carbon to the microzooplankton.
CONCLUSIONS
(1) Relatively high standing stocks of autotrophs and heterotrophs were observed during the winter period studied at OSP. Data from others indicated that meso- zooplankton standing stocks in the upper water col- umn were higher in summer than observed during this winter study. With the exception of the microzooplank- ton, the gross composition of the planktonic assem- blage was similar dunng this winter study to that observed dunng summer at OSP. Within the microzoo- plankton, heterotrophic dinoflagellate stocks made up a larger proportion of the summer assemblage than the ciliates. The opposite trend was observed during the winter period studied.
(2) The findings of this study concurred with the hy- pothesis of Evans & Parslow (1985), later modified by Miller et al. (1991), that, unlike the NE Atlantic in win- ter where mixed layer depths are far in excess of those observed in the NE Pacific, at OSP the shallow winter mixed layer depth permits relatively high standing stocks of phytoplankton and grazers to be maintained. In this study, winter standing stocks of microzooplank- ton were comparable to those of the autotrophs. Pre- dicted winter standing stocks for herbivores from the results of simulation models for this region (Frost 1993, Fasham 1995) are consistent with the observed values in the present study. However it may be speculated that if the microzooplankton are the dominant herbivores, both models may overestimate summer herbivore stocks and consequently predict different seasonal
trends in the magnitude of herbivore stocks than those observed in the field.
(3) Assuming similar carbon turnover times, an analysis of the partitioning of biomass within the plankton for OSP during this winter study suggests that there is sufficient carbon available to support the observed mesozooplankton, heterotrophic nanoflagel- late and microzooplankton stocks. In order to supply sufficient carbon to the heterotrophic bacteria it is nec- essary to invoke slower turnover times for this group. This is consistent with the recent findings of Kirchman (1990).
Acknowledgements. We acknowledge Captaln Anderson, the officers and crew of the DFO research vessel 'John P Tully'; sh~pboard assistance from H. McClean (UBC), T. Soutar; R. Perkins (Center for Ocean Climate Chermstry, 10s Sidney, Canada);, the provision of CTD data from Ocean Physics Insti- tute of Ocean Sciences, Sidney, Canada (R. Perkins, R. Bing- ham, J . Love and B. Minkley) and of phytoplankton counts (J. Ramirez); E. Lessard for a personal communication. We thank K. Banse, R. Goldblatt, T. R. Parsons and 3 anonymous reviewers for their helpful comments and advice. This research was performed as part of the Canadian JGOFS Pro- gram. Principal support for Canadian JGOFS comes from the Natural Sciences and Engineering Research Council and from the Department of Fisheries and Oceans, Canada.
LITERATURE CITED
Anderson GC, Parsons TR, Stephens K (1969) N~trate distrib- utlon in the subarctic northeast Pacific Ocean Deep Sea Res 16:329-334
Banse K (1990) Does iron really limit phytoplankton produc- tion in the offshore subarctic Pacific? Limnol Oceanogr 35:772-775
Batchelder HP (1985) Seasonal abundance, vertical distribu- tions, and Me history of Metridid pacdica (Copepoda: Calanoida) in the oceanic subarctic Pacific. Deep Sea Res 32:949-964
Booth BC, Lewin J , Poste1 JR (1993) Temporal variation in the structure of autotrophic and heterotrophic communities in the subarctic Pacific. Prog Oceanogr 32:57-99
Boyd PW, Whitney FA, Harrison PJ, Wong CS (1995) The NE subarctic Pacific in winter: 11. B~ologlcal rate processes. h4ar Ecol Prog Ser 128:25-34
Clemons MJ, Miller CB (1984) Blooms of large diatoms in the oceanic subarctic Pacific. Deep Sea Res 31:85-95
Cushiny DH (1975) Marine ecology and fisheries. Cambridge University Press, Cambridge
Dagg M (1993) Grazing by the copepod community does not control phytoplankton production in the subarctic Pacific Ocean. Prog Oceanogr 32:163-183
Dodimead AJ, Favorite F, Hirano T (1963) Revlew of oceanog- raphy of the Subarctic Pacific region. Int North Pac Fish Comm Bull 13:l-195
Evans GT, Parslow JS (1985) A model of annual plankton cycles. Biol Oceanogr 3:327-347
Fasham MJR (1995) Variations in the seasonal cycle of biolog- ical production in subarctic oceans: a model sensitivity analysis. Deep Sea Res 142:11111149
Fenchel T (1982) Ecology of heterotrophic rnicroflagellates: 11. Bioenergetics and growth. Mar Ecol Prog Ser 8:225-231

Boyd et al.: NE Pacif~c w~nte r stocks 23
Frost BW (1987) Grazing control of phytoplankton stock in the open subarctic Pacific Ocean: a model assessing the role of mesozooplankton, particularly the large calanoid copepods, Neocalanus spp. Mar Ecol Prog Ser 39:49-68
Frost B W (1991) The role of grazlng in nutrient-rich areas of the open sea. Llmnol Oceanogr 36:1616-1630
Frost BW (1993) A modelling study of processes regulating plankton standing stock and production in the open sub- arctic Pacific Ocean. Prog Oceanogr 32:17-56
Fulton JD (1978) Seasonal and annual variations of net zoo- plankton at Ocean Station P, 1965-1976 Can Fish Mar Serv Data Rep 49
Gifford DJ (1993) Isolation and laboratory culture of marine oligotrichous ciliates. In: Kemp PF, Sherr BF, Sherr EB, Cole J J (eds) Handbook of methods in aquatlc microbial ecology. Lewis Publ, Boca Raton, FL, p 103-108
Giguere LA, St Pierre JF. Bernier B, Vezina A. Rondeau JG (1989) Can we estimate the true weight of zooplankton samples after chemical preservation? Can J Fish aquat Sci 46:522-527
Grasshoff K, Ehrhardt M, Kremling K (eds) (1983) Methods of seawater analysis. Verlag Chemie, Weinheim
Hansen PH (1992) Prey size selection, feedlng rates and growth dynamics of heterotrophic d~noflagellates with special emphasls on Gyrodinium spirale. Mar Biol 114: 327-334
Joint IR, Pomroy AJ (1983) Production of picoplankton and small nanoplankton in the Celtic Sea. Mar Biol 77:19-27
Kirchman DL (1990) Limitation of bacterial growth by dis- solved organic matter in the subarct~c Pac~flc. Mar Ecol Prog Ser 62 47-54
Krchman DL, Kell RG, Simon M, Welschmeyer NA (1993) Biomass and production of heterotroph~c bacterioplank- ton in the oceanic subarctic Pacific. Deep Sea Res 40: 967-988
Landry MR. Gifford DJ, Kirchman DL, Wheeler PA. Monger BC (1993) Direct and indirect effects of grazing by Neo- calanus plurnchrus on plankton community dynamics in the subarctic Pacific. Prog Oceanogr 32:205-222
LeBrasseur RJ (1965) Seasonal and annual changes in net zooplankton at ocean station 'P', 1956-1964. Fish Res Bd Can MS Rep (Oceanogr Limnol) 202
LeBrasseur RJ (1969) Predator-prey relationsh~ps in the epi- pelagic zone of the north-east Pacific Ocean. PhD thesis, University of Glasgow
LeBrasseur RJ, Kennedy OD (1972) Microzooplankton in coastal and oceanic regions of the Pacific Subarctic water mass: a preliminary report. In: Takenouti AY (ed.) Biologi- cal oceanography of the northern North Pacific Ocean Idernitsu Shoten, Tokyo, p 355-366
Levitus S (1982) Climatological atlas of the world ocean NOAA Professional Paper 13. US Government Printing Office, Washington DC
McAllister CD (1961) Zooplankton studies at Ocean Weather Station 'P' in the North-east Pacific Ocean. J Fish Res Bd Can 18:l-29
Martin JH, Fitzwater SE, Gordon RM, Broenkow WW (1989) VERTEX: phytoplankton/iron studies in the Gulf of Alaska. Deep Sea Res 36:649-680
Martin JH, Gordon RM, Fitzwater SE (1991) The case for iron. Limnol Oceanogr 36: 1793-1802
Michaels AF, Sllver MW (1988) Primary production, sinklng fluxes and the microbial food web. Deep Sea Res 35: 473-490
Miller CB (1993a) Pelagic production processes in the Subarc- tic Pacific. Prog Oceanogr 32:l-15
Miller CB (199313) Development of large copepods during spring in the Gulf of Alaska. Prog Oceanogr 32:295-317
Miller CB, Frost BW, Batchelder HP, Clemons MJ, Conway RE (1984) Life history of large, grazing copepods In the sub- arctic Pacific Ocean Gyre: Neocalanus plumchrus, Neo- calanus cristatus and Eucalanus bungii in the northeast Pacific. Prog Oceanogr 13:201-243
Miller CB. Frost BW, Wheeler PA, Landry MR, Welschmeyer N. Powell TM (1991) Ecological dynamics in the subarctic Pacific, a possibly iron limited system. Limnol Oceanogr 36:1600-1615
Motoda S (1959) Devices of simple plankton apparatus. Mem Fac Fish Hokkaido Unlv 7:73-94
Murphy J , h ley JP (1962) A modified single solutions method for the determination of phosphate in natural waters. Ana- lytica Chim Acta 27:31-36
Omori M (1969) Weight and chemical composition of some important oceanic zooplankton in the north Pacific Ocean. Mar Biol3:4-10
Parslow JS (1981) Phytoplankton-zooplankton interactions: data analysis and modelling (with particular reference to Ocean Station Papa [50° N, 145' W] and controlled ecosys- tem experiments). PhD thesis, University of Bntish Colum- bla, Vancouver
Parsons TR (1960) A data record and discussion of some observations made in 1958-1960 of significance to pri- mary productivity research. Fish Res Bd Can (Oceanogr Limnol) Rept 81
Parsons TR, Lalli CM (1988) Comparative oceanic ecology of the plankton communities of the subarctic Atlantic and Pacific Oceans. Oceanogr mar Biol A Rev 26.317-359
Parsons TR (1965) A general description of some factors gov- erning primary production in the Strait of Georgla, Hecate Strait and Queen Charlotte Sound, and the NE Pacific Ocean. Fish Res Bd Can Manuscr Rep Ser (Oceanogr Lim- nol) 198
Parsons TR, LeBrasseur RJ (1968) A discussion of some critical indices of primary and secondary production for large- scale ocean surveys. CalCOFI Rep 12:54-63
Parsons TR, Maita Y, La111 CIM (1984) A manual of chemical and biological methods for seawater analysis. Pergamon Press, Oxford
Putt M, Stoecker DK (1989) An experimentally determined car- bon:volume ratio for marine 'oligotrichous' cihates from es- tuarine and coastal waters Limnol Oceanogr 34:1097-1103
Reid PC, Turley CM, Burkill PH (1991) Protozoa and their role in marine processes. Springer Verlag, Berlin
Roff JC, Hopcroft RR (1986) High precision microcomputer based measuring system for ecological research. Can J Fish aquat Sci 43:2044-2048
Sherr EB, Caron DA, Sherr BF (1993) Stainlng of het- erotrophic protlsts for visualization via epifluorescence microscopy. In: Kemp PF, Sherr BF, Sherr EB, Cole J J (eds) Handbook of methods in aquatic microbial ecology. Lewis Publ, Boca Raton, FL, p 213-227
Strathrnann RR (1967) Estimating the organic carbon content of phytoplankton from cell volume or plasma volume. Lim- no1 Oceanogr 12:4 11-4 18
Strom SL, Poste1 JR, Booth BC (1993) Abundance, variability, and potential grazlng impact of cillated protozoa in the open subarctic Pac~fic Ocean. Prog Oceanogr 32:185-203
Tabata S (1989) Trends and long term vanab~lity of ocean properties at Ocean Station P in the north-east Pacific Ocean. Geophys Monogr 55:113-132
Technicon (1977a) Industrial method no. 158-71W/A. Nitrate and nitrite, June 1977 Technicon Instruments Corp, Tar- rytown, NY

Mar Ecol Prog Ser 128: 11-24, 1995
Technicon (1977b) Industrial method no. 186-72W/B, Sili- cate, June 1977. Technicon Instruments Corp, Tarrytown, NY
Turley CM, Hughes DJ (1992) Effects of storage on direct estl- mates of bacterial numbers of preserved seawater. Deep Sea Res 393375-394
Utermohl H (1958) Zur V e ~ ~ l l k ~ m m n ~ n g der quantitativen Phytoplankton-Methodik. Mitt int Verein theor angew Limnol 9:l-38
Verity PG (1985) Grazing, respiration, excretion, and growth rates of tintinnids. Limnol Oceanogr 30:1268-1282
This article was presented by D. K. Stoecker (Senior Editorial Advisor), Cambridge, Maryland, USA
Verity P G (1991) Measurement and simulation of prey uptake by marine planktonic ciliates fed plastidlc and aplastidic nanoplankton Limnol Oceanogr 36:729-749
Welschmeyer NA, Strom S, Goericke R, DiTullho G, Belvin B, Petersen W (1993) Primary production in the subarctic Pacific Ocean: Project SUPER. Prog Oceanogr 32:lOl-135
Wong CS, Whitney FA, Iseki K, Page JS, Zeng J (1995) Analy- sis of trends in primary production and chlorophyll-a over two decades at Ocean Station P (50" N, 145" W) in the sub- arctic Northeast Pacific Ocean. Can J Fish aquat Sci 121. 107-1 17
Manuscript first received: January 15, 1995 Revised version accepted: June 1, 1995