The National Welfare Index Ireland a feasibility study · The National Welfare Index Ireland – a...
28
1 Paul Waidelich* Dipl.Volksw. Benjamin Held* Prof. Dr. Hans Diefenbacher* with cooperation of Willi Kiefel** Seán Ó Conláin** Prof. em. John Sweeney.*** The National Welfare Index Ireland – a feasibility study This paper is dedicated to the memory of Richard Douthwaite, economist, ecologist, co-founder of FEASTA and friend for very many years, who died in November 2011. The idea of an Irish application of the National Welfare Index (NWI) first arose in a conversation between Richard Douthwaite and Hans Diefenbacher in 2010. It was subsequently taken up between Hans Diefenbacher, Willi Kiefel and Seán Ó Conláin during a meeting at the Degrowth Conference in Leipzig in 2014, where there had been a workshop on the scientific legacy of Richard Douthwaite. * Institute for Interdisciplinary Research (FEST), Heidelberg ** The Foundation for the Economics of Sustainability (FEASTA), Cloughjordan, Tipperary *** Irish Climate Analysis and Research UnitS (ICARUS), Maynooth University, Maynooth
Transcript of The National Welfare Index Ireland a feasibility study · The National Welfare Index Ireland – a...

1
Paul Waidelich* Dipl.Volksw. Benjamin Held* Prof. Dr. Hans Diefenbacher* with cooperation of Willi Kiefel** Seán Ó Conláin** Prof. em. John Sweeney.***
The National Welfare Index Ireland – a feasibility study
This paper is dedicated to the memory of Richard Douthwaite, economist, ecologist, co-founder of FEASTA and friend for very many years, who died in November 2011. The idea of an Irish application of the National Welfare Index (NWI) first arose in a conversation between Richard Douthwaite and Hans Diefenbacher in 2010. It was subsequently taken up between Hans Diefenbacher, Willi Kiefel and Seán Ó Conláin during a meeting at the Degrowth Conference in Leipzig in 2014, where there had been a workshop on the scientific legacy of Richard Douthwaite.
* Institute for Interdisciplinary Research (FEST), Heidelberg ** The Foundation for the Economics of Sustainability (FEASTA), Cloughjordan, Tipperary *** Irish Climate Analysis and Research UnitS (ICARUS), Maynooth University, Maynooth
2
Abstract
This study applies the National Welfare Index (NWI), an approach from Germany to measure a
society’s welfare, to Ireland. An overview is given of the current discussion on the measurement of
growth and welfare and on the critique on the applicability of Gross Domestic Product (GDP) as a
measure of welfare. The NWI’s methodology is explained, followed by an example-led discussion of
several components. Subsequently, the latest development of the preliminary NWI-Ireland time
series is compared with GDP’s change over time to highlight the differences between the two
approaches, for both Ireland and Germany. The study ends with a conclusion to appraise the
possibilities of the NWI as an alternative measure of welfare for countries other than Germany.

3
Table of contents
I. Introduction .................................................................................................................................. 4
II. The need to go beyond GDP ........................................................................................................ 5
III. The construction of the NWI for Ireland .................................................................................... 7
IV. GDP and NWI in comparison .................................................................................................... 15
V. Future potential of the NWI for Ireland..................................................................................... 23
References ......................................................................................................................................... 24
Appendix: Preliminary component values of the NWI 2000-2014 ................................................... 26
4
I. Introduction
The definition of welfare determines what a society focuses on. Thus, it matters a lot for the well-
being of its people. Since the end of World War II, the predominant concept of welfare measurement
has been the Gross Domestic Product (GDP), the sum of the market value of all final goods and
services produced in a country per year. However, since its beginnings, GDP has repeatedly and
correctly been criticized as an insufficient measure of welfare due to several shortcomings
concerning its capacity to reflect social well-being in an adequate manner.
In the year 2008, the first project to develop the NWI was initiated and supported in Germany by the
Federal Environment Agency (UBA) and the Federal Ministry of Environment (now BMUB) with the
intention to find out to what extent a new concept of welfare measurement could be developed to
supplement GDP. For these reasons, we drew on previous approaches to measure welfare beyond
GDP, and in 2009, together with Roland Zieschank from the Free University in Berlin, FEST created
the National Welfare Index (NWI), a welfare measure that takes the deficiencies of GDP into account.
In the meantime, while in Germany there still is a political will to broaden reporting efforts on the
general development of society, the momentum to challenge GDP by complementing it with a strong
alternative perspective seems to have weakened a bit at federal level – despite some rather popular
and widely discussed publications on the history1 and the critique of gross domestic product that
have been published recently.2 The reception of these publications strengthened scepticism
regarding political decisions made on the basis of GDP and encouraged a willingness to deal with
alternative metrics, if only on a theoretical level. When it comes to practical applications, politics and
the mass media are still rather reluctant to draw appropriate conclusions.
After several methodological improvements, the NWI has been calculated and updated for Germany
regularly in recent years.3 Interest in the NWI and its regional adaption, the Regional Welfare Index
(RWI), has continued to grow, especially at the Länder (federal states) level. The Green party group in
the regional parliament of Schleswig-Holstein was the first to commission a regional calculation in
2011 and the government of Schleswig-Holstein had the study repeated in 2017.4 Since then, RWIs
for six further states have been calculated (Bavaria 2013 and 2014, Thuringia 2013, Saxonia 2013,
1 Speich Chassé, Daniel (2013): Die Erfindung des Bruttosozialprodukts. Göttingen: Vandenhoek und Ruprecht; see also Vanoli, André (2002): Une Histoire de la Comptabilité Nationale. Paris: Editions de la Découverte. 2 Fioramonti, Lorenzo (2013): Gross domestic problem – the politics behind the world’s most powerful number. London: Zed Books; Lepenies, Philipp (2013): Die Macht der einen Zahl – Eine politische Geschichte des Bruttoinlandsprodukts. Frankfurt/M.: Suhrkamp. 3 All national and regional studies can be obtained from http://www.fest-heidelberg.de/fne-themenfeld-wohlfahrtsindizes/ 4 Still to be published.

5
Hamburg 2014, Rhineland-Palatinate 2014 and 2016, North Rhine-Westphalia 2016). While the
majority of them were supported by Green parliamentary groups, the reports for Rhineland-
Palatinate and North Rhine-Westphalia were funded by the Ministry of Economic Affairs and Energy
on the explicit demand of the Minister and, respectively, the Office of the Social Democrat Prime
Minister. The support from regional governmental institutions led to a noticeable change in the
general perception of the NWI/RWI. However, the index has been integrated only in very few
reporting schemes by a German government or statistical agency up to now.5 On the other hand, this
situation leaves the door open for further independent substantial and methodological
improvements to the NWI.
The idea was born to apply the NWI’s methodology on Ireland to create a new and more appropriate
measure of welfare for this country. This feasibility study explores the possibility of a NWI for Ireland
based on a draft version of the Index that was computed by us. In the second chapter, we summarize
the shortcomings of GDP as a sufficient measure of welfare. Inherent weaknesses in utilising the
conventional definition of GDP have been recently highlighted in Ireland where an annual jump in
GDP of 25% was recorded for 2015. This has arisen due to distortions in GDP caused by multinational
profit transfers and once-off issues such as aircraft leasing accounting practices. In addition, several
non-market activities fail to be recorded by conventional measures. As a pure measure of economic
activity conventional GDP methodologies are deeply flawed.
In chapter III, the general methodology is discussed based on four key components. Chapter IV
compares the current time series of the NWI for Ireland with GDP, explains the differences, and
contrasts them to the corresponding results for Germany. The subsequent conclusion highlights the
preliminary shortcomings of this feasibility study and draws attention to what a further study could
contribute to a better-informed discussion about Irish welfare throughout the last two decades.
II. The need to go beyond GDP
Although doubts about using Gross Domestic Product as a measure of welfare have existed since its
creation6, the world economic and financial crisis gave rise to further concerns whether the
prevailing model of economic growth can really cope with the requirements of a development that is
sustainable in an ecological, social and economic perspective. In such a context, the objective of
welfare in society becomes more important – instead of purely quantitative economic growth. We
5 See Umweltbundesamt (Hrsg.) (2017): Daten zur Umwelt. Dessau: UBA. 6 See U.S. Senate (1934): National income 1929-1932. 73rd Congress, 2nd Session, Document No. 124. Washington, DC: Government Printing Office.
6
consider the notion of “welfare” as the total of material and non-material components of
“prosperity” and “well-being” obtained from the available wealth of a country: its economic, natural
and social capital.
The OECD conferences on “Measuring the Progress of Societies” and the EU congress “Beyond GDP”
in 2007 revitalized an existing international discussion, which, unlike that of earlier decades,
transcended the scientific communities. On the one hand, the focus is on the negative external
effects of economic growth. On the other hand, it is increasingly recognized that the traditional
measurement of the economic development of a country by GDP alone can indicate an illusionary
wealth due to several shortcomings. Firstly, GDP is only the sum of all incomes in an economy and by
its definition, does not reflect its distribution in any way. Hence, in a country with considerable GDP
growth it is still possible that only a small share of those already better off experience a real increase,
while incomes of large parts of the population are stagnating or even reducing. Secondly, GDP
neglects all economic activities that are not performed via formal markets such as unpaid work
within households or volunteering. If someone takes care of his or her own children for a
considerable number of hours per day, this does not affect welfare as measured by GDP. But once
the very same activity is performed by a paid babysitter, GDP would indicate an increase in welfare
although the outcome has not changed at all, i.e., children being taken care of.
Besides its disregard for social developments, GDP is also blind towards nature. While environmental
pollution, a usual by-product of economic growth, is not considered, GDP might even grow if a
society occupies firms to undo the damages it caused, something that can hardly be viewed as
welfare contributing. Alas, these so-called “defensive costs” are treated by GDP in the very same way
as investments in education or better health care. It is often ignored that economic growth is to a
large extent dependent on intermediate free inputs from the social and the natural system. Thus,
welfare can only be described accurately if its measures take both social and natural capital into
consideration instead of treating them as “external factors”.
The significance of the National Welfare Index in this discussion is twofold. It is firstly a contribution
to a more robust methodological development of new measurement systems focusing strongly on
social and ecological implications of current production and consumption patterns, and secondly a
contribution to the development of a social market economy and ultimately to an ecologically
sustainable economy.
Moreover, Ireland is currently reforming local government structures to facilitate more extensive
input by citizens into decision-making processes. This is being implemented through the setting up of
Public Participation Networks (PPNs) across the various local government regions which are open to
not-for-profit groups in the social inclusion, environmental and general community and voluntary
7
sectors. One ingredient for their success has been suggested as being the development of local scale
wellbeing statements. In this context, the NWI provides a useful methodology and product at a
national scale which may have utility for the development of smaller scale comparative indices at
PPN level within Ireland.
III. The construction of the NWI for Ireland
The National Welfare Index is based on a so-called accounting method to correct the most important
deficits of GDP as a measure of welfare. To achieve this, the NWI incorporates components to cover
aspects such as social justice, unpaid labour, environmental damages and the use of non-renewable
resources that are relevant to welfare7. All components must be available as a monetized quantity or
– at least – it must be theoretically possible to monetize them. In addition, as for GDP, all
components are measuring flows that refer to a specific year. Stocks like natural capital thus cannot
be considered directly but only by their change in a given year. Like GDP, the NWI is a domestic
index: it contains only costs and benefits that are related to the territory of the country for which the
index is calculated. Therefore, environmental costs caused by the production of consumer goods
abroad that are consumed within the country are not included.
Based on the methodology applied for the German index, the NWI currently consists of 20
components (see table below) that are aggregated in order to obtain a single index. In summary, the
basic component of the calculation is private consumption weighted by the Gini index of the income
distribution. Then, further welfare-creating flows are added, e.g. the economic value by unpaid
household and voluntary work or the part of public expenditure for health and education that is not
merely necessary to avoid potential decreases in well-being, so-called non-defensive expenditures.
Subsequently, components representing welfare-diminishing social and ecological aspects are
subtracted. Among other items, this category comprises environmental damage costs such as costs
of air pollution and greenhouse gas emissions. In addition to that, replacement costs for the use of
non-renewable energy resources are also taken into account.
The green colour and a “+” in the third column signal that the respective component is added
positively due to its welfare creating properties. Orange cells marked with a minus symbol represent
those components which are subtracted to account for their welfare diminishing properties. Note
that component no. 16 and 17 are marked as “+/-“ due to the fact that, depending on their actual
7 For more details see Diefenbacher, H./Zieschank, R.; with contributions from Dorothee Rodenhäuser (2010): Measuring Welfare in Germany. A suggestion for a new welfare index. On behalf of the Federal Environment Agency (Germany). Dessau-Roßlau.

8
value, they can be either welfare creating or diminishing. Moreover, component no. 1 is coloured
grey because it is only used to weigh another component (i.e. the second one) and hence, is not
directly included into the NWI. Once all the components are calculated, the NWI for Ireland in a given
year is computed by adding the green components and subtracting the orange ones.
The components of the NWI for Ireland (source: FEST/FFU)
No. Components + / –
1 Index of income distribution
2 Weighted private consumption +
3 Value of housework +
4 Value of voluntary work +
5 Public expenditure on health care and education +
6 Costs and benefits of durable goods* + / –
7 Costs of travel between home and workplace –
8 Costs of traffic accidents –
9 Costs of criminality* –
10 Costs of alcohol, tobacco and drug abuse –
11 Compensatory social expenditures due to environmental impact –
12 Damage costs of water pollution (“reminder value“) –
13 Damage costs of soil degradation (“reminder value“) –
14 Damage costs of air pollution –
15 Damage costs of noise –
16 Net value of loss/increase of ecosystems (biotope area) (“reminder value“) + /–
17 Net value of loss/increase of agricultural areas +/–
18 Replacement costs due to the consumption of non-renewable energy resources –
19 Damage costs of GHG emissions –
20 Costs of nuclear energy usage** –
* missing due to data availability ** inapplicable since Ireland does not generate nuclear power
9
Three components of the original NWI methodology were not included in the preliminary NWI index
for this feasibility study and hence are marked in red in the table of the components. Their exclusion
has different reasons. For two of them, i.e. the costs of criminality and the costs and benefits of
durable goods, sufficient data were not available and adequate estimations would have gone beyond
the scope of a mere feasibility study. The third one however, the costs of nuclear energy usage, was
left out because Ireland, unlike Germany, is not a producer of nuclear power and hence the
component cannot be applied to the country.
For the NWI for Ireland, we mostly relied on data provided by EUROSTAT and the Irish Central
Statistics Office. We used other data sources when necessary. These sources include official agencies
such as the Road Safety Authority or the European Environment Agency, but also individual scientific
studies. Therefore, the availability and quality of the data for the components vary considerably.
Data quality for many components is already good or at least satisfactory. Others, however, are
currently estimated based on assumptions or only accounted for in a symbolic way. These “reminder
values” stand for aspects that are relevant for welfare calculations but can only be included
symbolically because of the data situation, without having an influence on the development of the
NWI that would be important in any quantitative respect. Concerning the estimations included in
NWI, we try to include the best knowledge available and apply rather conservative methods in case
of uncertainty to avoid exaggerations that otherwise would have been possible.
To give the reader a better understanding of the concept, we will discuss some of the Index’
components for Ireland in detail and explain how they developed within the last one and a half
decades. A further NWI study for Ireland would examine all components in detail and explain those
trends comprehensively, following the example of the National Welfare Index for Germany report for
the German Environment Agency8. However, since this is just a feasibility study, we focus on four
important components only and provide preliminary values for all components calculated or
estimated so far in the appendix. It is important to highlight that this paper represents a first draft
version of the NWI for Ireland only. Due to the eventual availability of further data or better
methodological approaches, the values of the components of the final NWI might differ from the
ones presented here.
To date, the time span for which NWI data are available ranges from 2000 to 2014 since for several
components there are no sufficient data before 2000. In general, the NWI for Ireland could be
calculated with a time lag of approximately two years.
8 Diefenbacher, H./Held, B./Rodenhäuser, D./Zieschank, R. (2016a): Aktualisierung und methodische Überarbeitung des Nationalen Wohlfahrtsindex 2.0 für Deutschland 1991 bis 2012. Dessau-Roßlau: Umweltbundesamt. URL: http://fest-heidelberg.de/images/FestPDF/nwi_2_0_langfassung.pdf

10
70
75
80
85
90
95
100
105
110
2000 2001 2002 2003 2004 2005 2006 2007 2008 2009 2010 2011 2012 2013 2014
Figure 1: Index of income distribution(normalized Gini coefficient, 2000 = 100)
Component no. 1: Index of income distribution
The first component of the NWI is the Gini coefficient as a measure of inequality that expresses a
country’s deviation from total equity. The Gini index ranges from 0 to 1, where a coefficient of zero
represents total equity while a value of 1 means that one person receives 100 percent of the
economy’s income. The data set used for this component of the NWI was obtained from the
European Union Statistics on Income and Living conditions (EU-SILC) and is available via EUROSTAT9.
The Gini coefficient used for the NWI for Ireland is based on the equivalized household net income.
To obtain the equivalized household income, paid direct taxes are subtracted from the household’s
gross income while received social benefits are added. Besides, the measure controls for the
different sizes of households.
To use the index for weighting the private consumption expenditure, the data series was normalized
such that the Irish Gini coefficient in 2000 (0.300) equalled 100. The year 2000 was chosen as base
year for several reasons: Firstly, it is the first year in the NWI time series. Secondly, a Gini index of
0.300 is a rather low value in the period covered by the NWI for Ireland. In fact, between 1995 and
2014 the Gini coefficient was below 0.300 only in 2001, 2008 and 2009. Hence, the choice of 2000 as
the base year expresses the normative presumption of the NWI that a relatively low income
inequality is desirable. Thirdly, the fact that 2000 is also used as the base year of the German NWI
facilitates the comparison of the two indices.
FIGURE 1 shows the normalized Gini index for Ireland between 2000 and 2014. As we can see,
income inequality in Ireland has mostly remained constant (i.e., slightly above 0.3) in the given
period. In fact, the non-normalized values of the Gini coefficient range from 0.288 in 2009 up to
0.319 in both 2005 and 2006. Not captured in FIGURE 1 is the dynamic development in years before
9 Table [ilc_di12], retrieved: May 29, 2017.
Source: EUROSTAT

11
2000: Income inequality in Ireland used to be much higher until the end of the 1990s (up to 0.34 or a
normalized value of 113.3, respectively) and decreased significantly between 1998 and 2000.
Comparing it to other European countries, Ireland’s inequality performance is quite normal.
According to EUROSTAT, the Gini coefficient for the EU-28 ranged between 0.305 and 0.309 from
2010 to 2014.
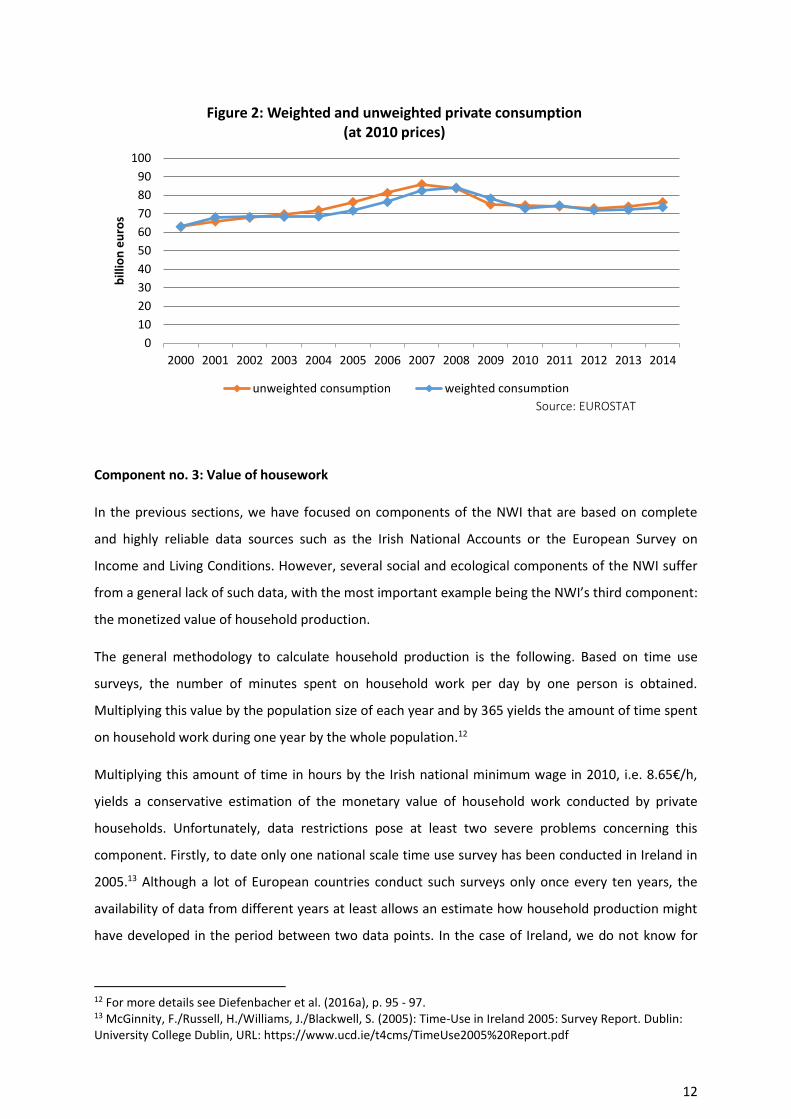
Component no. 2: Weighted private consumption
The second component of the NWI is the consumption expenditure of households in Ireland at 2010
prices. As we have explained in chapter II, we use the normalized Gini coefficient of the previous
section to weigh the final consumption expenditure of private households. The values are adjusted
for inequality by dividing by the normalized Gini index and multiplying the result by 100.
Consequently, in years with a Gini index higher than 0.300, the adjusted consumption expenditure is
lower than the unweighted expenditure and vice-versa. Consumption data were extracted from
EUROSTAT10 and, like all monetary values in this study, expressed at 2010 prices using EUROSTAT’s
Harmonized Indices of Consumer Prices11.
FIGURE 2 shows both the weighted and unweighted consumption of private households between
2000 and 2014. At first, the two curves seem almost identical, because the Gini coefficient remained
roughly constant throughout the given period. Thus, the differences between weighted and
unweighted consumption are rather small, but nevertheless significant: In 2005 for example, the
relatively high Gini coefficient (that is, in comparison to 2000) lowers the consumption expenditure
by almost €5 billion. However, since income inequality does not change that much in the given
period, the main driver of this component is the consumption itself. Between 2000 and 2007, the
unweighted expenditure increased by more than a third from €63 billion to €86 billion. The financial
crisis in 2008 brought a halt to this development. Consumption of private households slumped in the
post-crisis years and did not recover until 2014. Moreover, the rather small increases in post-crisis
consumption were mostly compensated by increases in income inequality after 2011.
10 Table [nama_10_fcs], retrieved: May 25, 2017. 11 Table [prc_hicp_aind], retrieved: March 24, 2017.
12
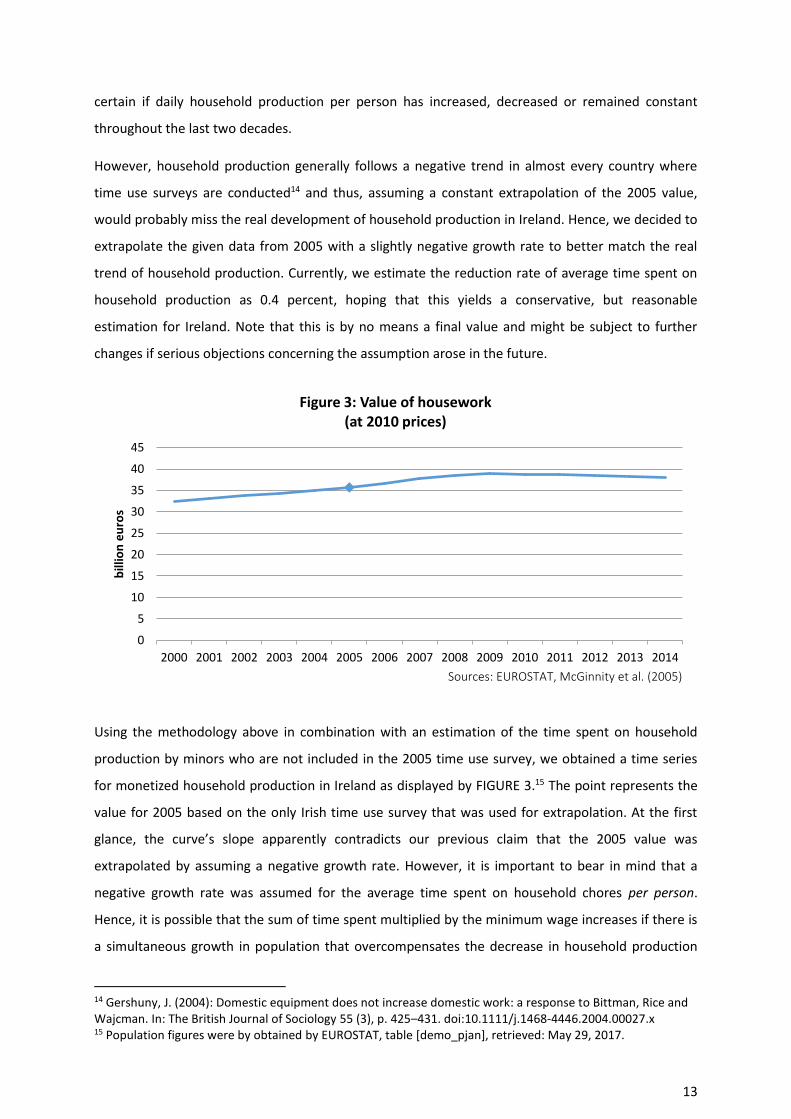
Component no. 3: Value of housework
In the previous sections, we have focused on components of the NWI that are based on complete
and highly reliable data sources such as the Irish National Accounts or the European Survey on
Income and Living Conditions. However, several social and ecological components of the NWI suffer
from a general lack of such data, with the most important example being the NWI’s third component:
the monetized value of household production.
The general methodology to calculate household production is the following. Based on time use
surveys, the number of minutes spent on household work per day by one person is obtained.
Multiplying this value by the population size of each year and by 365 yields the amount of time spent
on household work during one year by the whole population.12
Multiplying this amount of time in hours by the Irish national minimum wage in 2010, i.e. 8.65€/h,
yields a conservative estimation of the monetary value of household work conducted by private
households. Unfortunately, data restrictions pose at least two severe problems concerning this
component. Firstly, to date only one national scale time use survey has been conducted in Ireland in
2005.13 Although a lot of European countries conduct such surveys only once every ten years, the
availability of data from different years at least allows an estimate how household production might
have developed in the period between two data points. In the case of Ireland, we do not know for
12 For more details see Diefenbacher et al. (2016a), p. 95 - 97. 13 McGinnity, F./Russell, H./Williams, J./Blackwell, S. (2005): Time-Use in Ireland 2005: Survey Report. Dublin: University College Dublin, URL: https://www.ucd.ie/t4cms/TimeUse2005%20Report.pdf
0
10
20
30
40
50
60
70
80
90
100
2000 2001 2002 2003 2004 2005 2006 2007 2008 2009 2010 2011 2012 2013 2014
bill
ion
eu
ros
Figure 2: Weighted and unweighted private consumption(at 2010 prices)
unweighted consumption weighted consumption
Source: EUROSTAT
13
0
5
10
15
20
25
30
35
40
45
2000 2001 2002 2003 2004 2005 2006 2007 2008 2009 2010 2011 2012 2013 2014
bill
ion
eu
ros
Figure 3: Value of housework(at 2010 prices)
certain if daily household production per person has increased, decreased or remained constant
throughout the last two decades.
However, household production generally follows a negative trend in almost every country where
time use surveys are conducted14 and thus, assuming a constant extrapolation of the 2005 value,
would probably miss the real development of household production in Ireland. Hence, we decided to
extrapolate the given data from 2005 with a slightly negative growth rate to better match the real
trend of household production. Currently, we estimate the reduction rate of average time spent on
household production as 0.4 percent, hoping that this yields a conservative, but reasonable
estimation for Ireland. Note that this is by no means a final value and might be subject to further
changes if serious objections concerning the assumption arose in the future.
Using the methodology above in combination with an estimation of the time spent on household
production by minors who are not included in the 2005 time use survey, we obtained a time series
for monetized household production in Ireland as displayed by FIGURE 3.15 The point represents the
value for 2005 based on the only Irish time use survey that was used for extrapolation. At the first
glance, the curve’s slope apparently contradicts our previous claim that the 2005 value was
extrapolated by assuming a negative growth rate. However, it is important to bear in mind that a
negative growth rate was assumed for the average time spent on household chores per person.
Hence, it is possible that the sum of time spent multiplied by the minimum wage increases if there is
a simultaneous growth in population that overcompensates the decrease in household production
14 Gershuny, J. (2004): Domestic equipment does not increase domestic work: a response to Bittman, Rice and Wajcman. In: The British Journal of Sociology 55 (3), p. 425–431. doi:10.1111/j.1468-4446.2004.00027.x 15 Population figures were by obtained by EUROSTAT, table [demo_pjan], retrieved: May 29, 2017.
Sources: EUROSTAT, McGinnity et al. (2005)

14
per person. This is exactly the case in Ireland where population increased by almost 20 percent
between 2000 and 2009 before slowing down in the post-crisis period. Due to the changes in
population, the monetized household production rises continuously from €32B in 2000 up to its peak
of €38.8B in 2009 before declining again.
However, in contrast to the weighted consumption expenditure, the monetized household
production component comes with a perhaps unsettling level of uncertainty. Indeed, one might
argue that such a component should rather be excluded from a quantitative welfare measure like the
NWI. But data availability generally tends to reflect political priorities and excludes important aspects
of welfare. Due to missing data, this might reinforce the existing bias towards easily quantifiable and
unidimensional measures such as GDP. The NWI aims not only to view welfare from a much broader
perspective, but also to highlight the severe lack of data in highly relevant social and ecological
aspects. With the inclusion of what to date is an estimation, we hope to create a political momentum
so that future NWI series might be based on more frequent and reliable data sources than the
current version.
Component no. 19: Damage costs of greenhouse gas (GHG) emissions
From the previous section, one might get the impression that the inclusion of non-economic aspects
of well-being inevitably results in the estimation of data based on – ideally plausible – assumptions.
However, there are several of the NWI’s components that are based on robust and highly reliable
data sources, although the topics they cover are absent in national accounting. A good example is the
19th component: the social costs due to greenhouse gas emissions.
The international community has agreed upon a universal system to register national greenhouse gas
emissions on a yearly basis. Thus, Ireland’s emissions expressed in CO2 equivalents can be easily
obtained by EUROSTAT.16 For monetization, we used the German consensus about social costs of
GHG emissions that resulted in the broadly accepted number of €80 per ton of CO2 equivalents.17
Multiplying this value by the emission data, we obtain the time series presented in FIGURE 4. As the
graph shows, damages from GHG emissions that reached their historical peak around €5.7 billion in
2001 have declined substantially after the financial crisis. But this development does not necessarily
represent a shift towards more sustainable ways of production. It could also be a necessary by-
product of an economic recession. The latter view might be supported by the fact that in 2015, a year
16 Table [env_air_gge], “All Sectors (excluding LULUFC and memo items)”, retrieved: May 25, 2017. 17 Schwermer, S./Preiss, P./Müller, W. (2012): Best-Practice-Kostensätze für Luftschadstoffe, Verkehr, Strom- und Wärmeerzeugung. Anhang B der „Methodenkonvention 2.0 zur Schätzung von Umweltkosten“. Dessau/Berlin: Umweltbundesamt, URL: http://www.umweltbundesamt.de/publikationen/methodenkonvention-20-zur-schaetzung-von-1
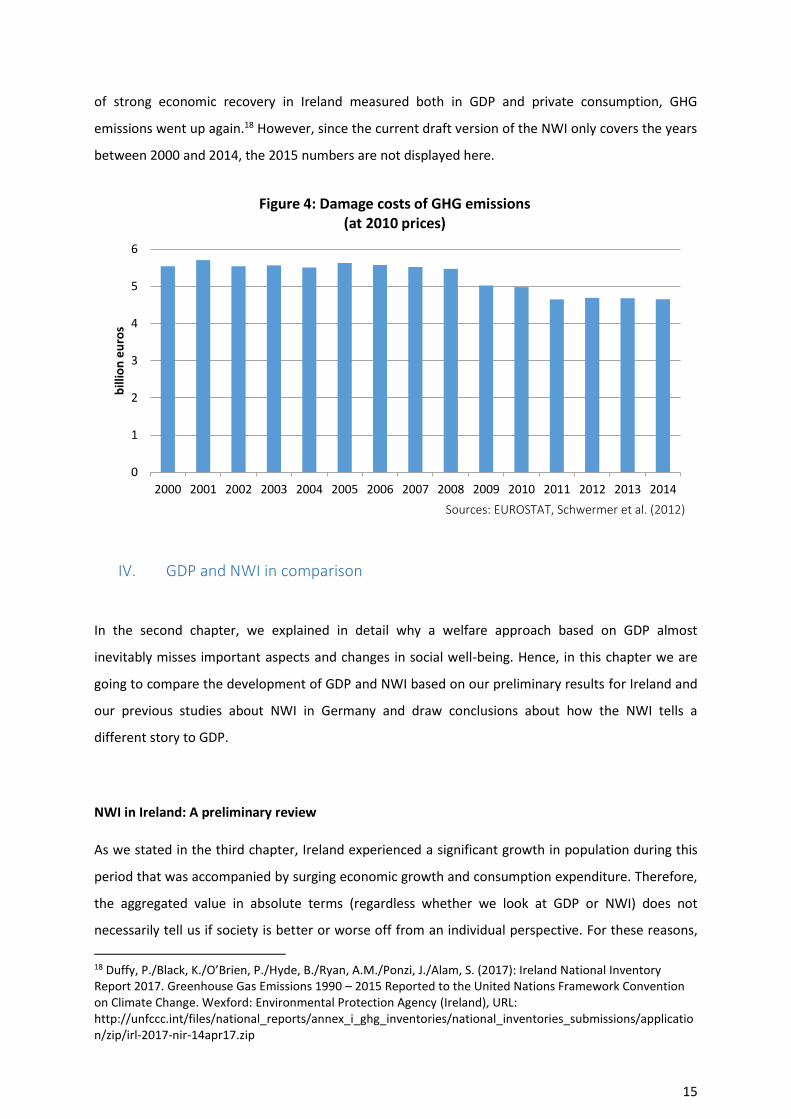
15
of strong economic recovery in Ireland measured both in GDP and private consumption, GHG
emissions went up again.18 However, since the current draft version of the NWI only covers the years
between 2000 and 2014, the 2015 numbers are not displayed here.
IV. GDP and NWI in comparison
In the second chapter, we explained in detail why a welfare approach based on GDP almost
inevitably misses important aspects and changes in social well-being. Hence, in this chapter we are
going to compare the development of GDP and NWI based on our preliminary results for Ireland and
our previous studies about NWI in Germany and draw conclusions about how the NWI tells a
different story to GDP.
NWI in Ireland: A preliminary review
As we stated in the third chapter, Ireland experienced a significant growth in population during this
period that was accompanied by surging economic growth and consumption expenditure. Therefore,
the aggregated value in absolute terms (regardless whether we look at GDP or NWI) does not
necessarily tell us if society is better or worse off from an individual perspective. For these reasons,
18 Duffy, P./Black, K./O’Brien, P./Hyde, B./Ryan, A.M./Ponzi, J./Alam, S. (2017): Ireland National Inventory Report 2017. Greenhouse Gas Emissions 1990 – 2015 Reported to the United Nations Framework Convention on Climate Change. Wexford: Environmental Protection Agency (Ireland), URL: http://unfccc.int/files/national_reports/annex_i_ghg_inventories/national_inventories_submissions/application/zip/irl-2017-nir-14apr17.zip
0
1
2
3
4
5
6
2000 2001 2002 2003 2004 2005 2006 2007 2008 2009 2010 2011 2012 2013 2014
bill
ion
eu
ros
Figure 4: Damage costs of GHG emissions(at 2010 prices)
Sources: EUROSTAT, Schwermer et al. (2012)
16
70
80
90
100
110
120
130
2000 2001 2002 2003 2004 2005 2006 2007 2008 2009 2010 2011 2012 2013 2014
Figure 5: NWI and real GDP per capita(normalized, 2000 = 100)
NWI p.c. GDP p.c.
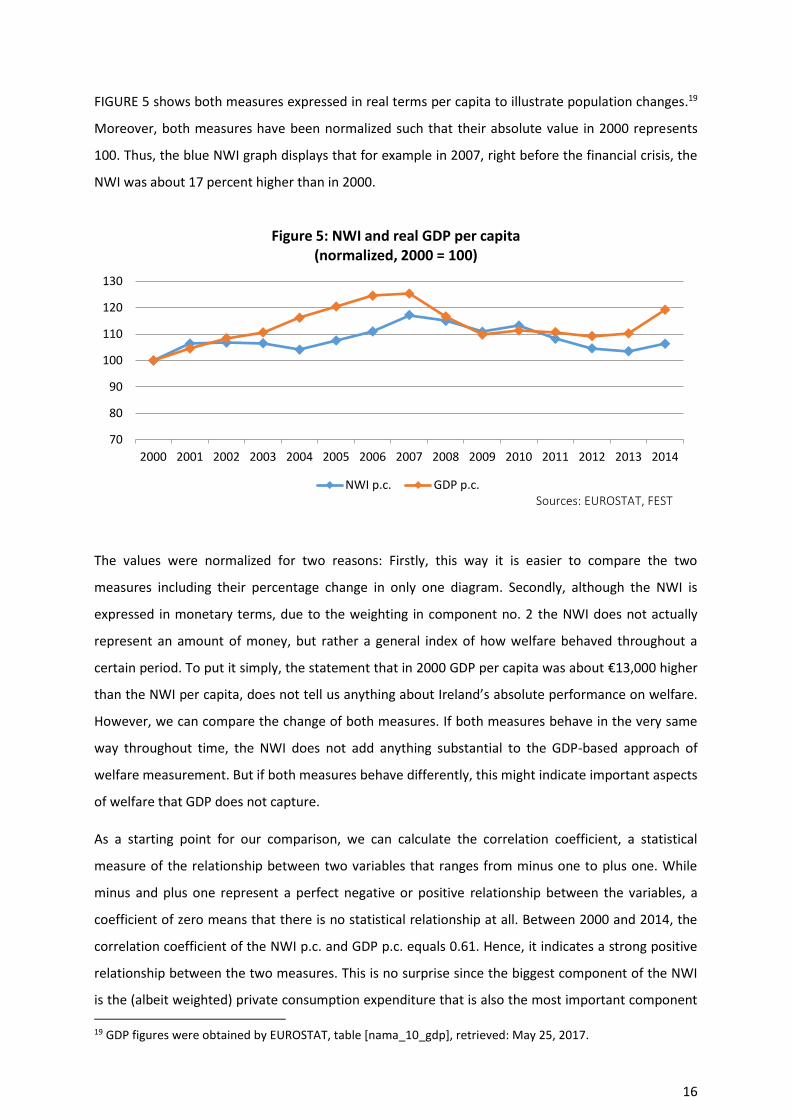
FIGURE 5 shows both measures expressed in real terms per capita to illustrate population changes.19
Moreover, both measures have been normalized such that their absolute value in 2000 represents
100. Thus, the blue NWI graph displays that for example in 2007, right before the financial crisis, the
NWI was about 17 percent higher than in 2000.
The values were normalized for two reasons: Firstly, this way it is easier to compare the two
measures including their percentage change in only one diagram. Secondly, although the NWI is
expressed in monetary terms, due to the weighting in component no. 2 the NWI does not actually
represent an amount of money, but rather a general index of how welfare behaved throughout a
certain period. To put it simply, the statement that in 2000 GDP per capita was about €13,000 higher
than the NWI per capita, does not tell us anything about Ireland’s absolute performance on welfare.
However, we can compare the change of both measures. If both measures behave in the very same
way throughout time, the NWI does not add anything substantial to the GDP-based approach of
welfare measurement. But if both measures behave differently, this might indicate important aspects
of welfare that GDP does not capture.
As a starting point for our comparison, we can calculate the correlation coefficient, a statistical
measure of the relationship between two variables that ranges from minus one to plus one. While
minus and plus one represent a perfect negative or positive relationship between the variables, a
coefficient of zero means that there is no statistical relationship at all. Between 2000 and 2014, the
correlation coefficient of the NWI p.c. and GDP p.c. equals 0.61. Hence, it indicates a strong positive
relationship between the two measures. This is no surprise since the biggest component of the NWI
is the (albeit weighted) private consumption expenditure that is also the most important component 19 GDP figures were obtained by EUROSTAT, table [nama_10_gdp], retrieved: May 25, 2017.
Sources: EUROSTAT, FEST

17
of GDP. Moreover, the non-defensive public expenditures on health and education are included in
both measures and represent two of the biggest NWI components. Thus, both measures display a
general increase up to 2007 and follow a downward trend in the post-crisis period.
Nevertheless, we can observe interesting differences: While Ireland experienced significant and
constant growth in GDP per capita from 2001 to 2004, the NWI per capita decreased from 106 in
2001 to only 104 in 2004. The reason is mainly an increase in inequality: Though consumption does
not rise as fast as GDP in these years, it does increase by 22 percent. But at the same time the
normalized Gini coefficient rises from 97 in 2001 to 105 in 2004. Hence, it is safe to assume that the
at least some part of the increases in material consumption was not at all distributed evenly. Due to
our methodology, the inequality-weighted consumption component remains almost constant.
Does this mean that welfare in general did not increase in this period? To answer this question, it is
important to bear in mind that we are discussing per capita measures. In fact, the NWI keeps
increasing in absolute terms partly due to a huge expansion of public expenditure on health and
education – albeit far less than real GDP does. However, those gains are compensated by the fast
growth of the Irish population, and in consequence, per capita welfare stagnates. From 2005 on up
to the financial crisis, income inequality remains unchanged and thus, the steady growth of private
consumption translates into a NWI rise from 104 in 2004 to 117 in 2007, reinforced by the ongoing
increases in unpaid household production (see chapter III) and in non-defensive public expenditure.
In general, an economic expansion tends to provoke degradations in natural capital as an undesired
by-product. For some components, this was true during the boom up to 2007 when costs due to
noise or commuting rose as well as replacement costs due to the consumption of non-renewable
energy resources. However, at the same time, GHG emissions remained constant, and the costs of air
pollution decreased by €0.8 billion between 2000 and 2007 due to considerable reductions in
pollutant emissions.
In 2008, Ireland was hit by the financial crisis. Real GDP per capita drops by 4.4% and 4.6% in 2008
and 2009 respectively. After a four-year stagnation on the 2009 level, economic recovery sets in in
2014 and proceeds in 2015 (though this is not included in FIGURE 5). In comparison, the NWI also
shows a strongly decreasing trend, but its changes are not that sharp. This can be attributed to
several factors. Firstly, consumption is more unrelenting than other components of GDP and does
not drop as fast as for example investment once a country is hit by a crisis. Secondly, the crisis
reduced income inequality sharply from a normalized Gini value of 104 in 2007 down to 96 in 2009.
So, the weighted consumption expenditure – as the main driver of NWI – at first decreases far less
than real GDP. But there is another difference that catches the eye. While GDP per capita at least
18
70
80
90
100
110
120
130
2000 2001 2002 2003 2004 2005 2006 2007 2008 2009 2010 2011 2012 2013 2014
Figure 6: NWI per capita with and without weighting(normalized, 2000 = 100)
unweighted weighted
remains the same after 2009, the NWI’s trend remains negative with 2010 being an exception when
the NWI suddenly jumps up due to an extraordinary increase in agricultural land.
Why does NWI per capita keep on falling after 2010? Again, one important factor is the increase in
inequality that rises back up since 2012 and thereby lowers the weighted consumption expenditure.
Other reasons are an albeit small decrease in public expenditure on health and education and losses
of agricultural land that compensate other welfare increases such as less greenhouse gas emissions
or air pollution. In 2014, welfare-contributing government expenditure rises again while land losses
decrease, leading to a recovery of the NWI that is further fuelled by increases in private
consumption.
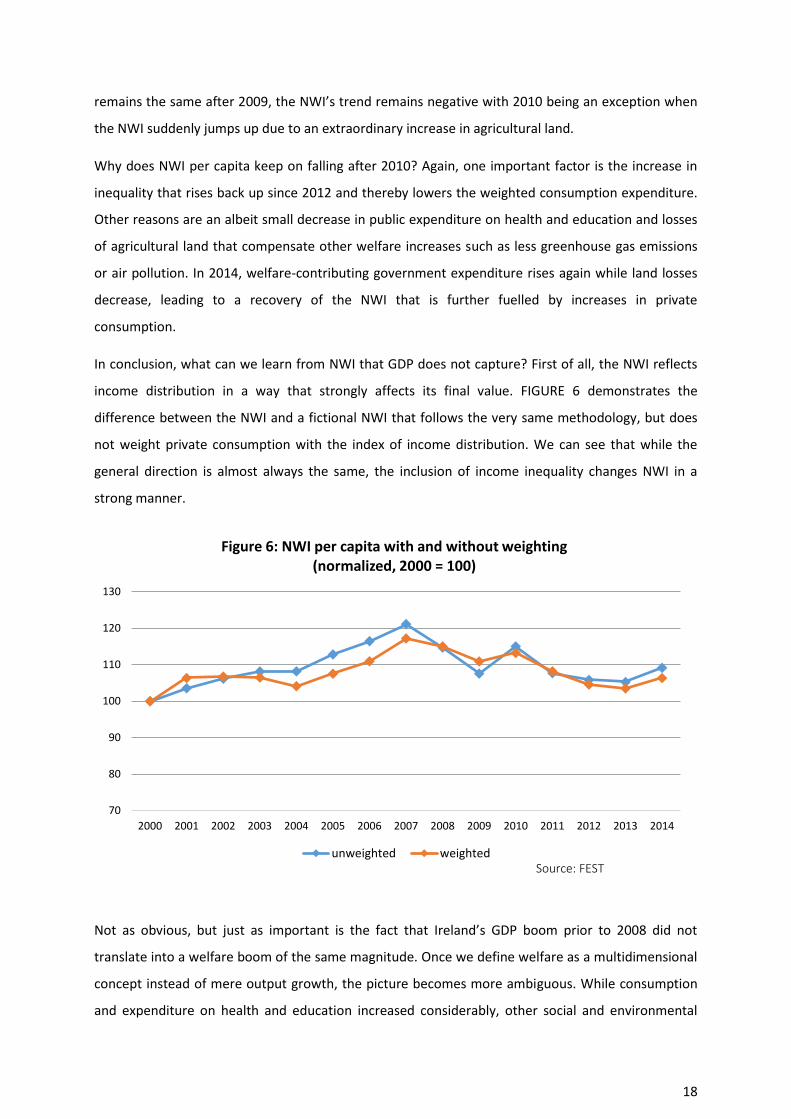
In conclusion, what can we learn from NWI that GDP does not capture? First of all, the NWI reflects
income distribution in a way that strongly affects its final value. FIGURE 6 demonstrates the
difference between the NWI and a fictional NWI that follows the very same methodology, but does
not weight private consumption with the index of income distribution. We can see that while the
general direction is almost always the same, the inclusion of income inequality changes NWI in a
strong manner.
Not as obvious, but just as important is the fact that Ireland’s GDP boom prior to 2008 did not
translate into a welfare boom of the same magnitude. Once we define welfare as a multidimensional
concept instead of mere output growth, the picture becomes more ambiguous. While consumption
and expenditure on health and education increased considerably, other social and environmental
Source: FEST

19
components mostly did not improve. In addition, income inequality increased. As a consequence,
during four years of outstanding economic growth (2001 to 2005), welfare hardly improved at all.
The third conclusion is that, though we are confident that our results can help to understand Irish
welfare in a much broader sense, there is a strong need for better data, especially regarding social
and environmental costs. This concerns especially the components based on time use that have
either been assumed to remain constant, or slightly decreasing, and thus have no big impact on the
NWI’s development. Nevertheless, the real time spent on household production might have
decreased much more rapidly and with more fluctuation over time. Such a development would
strongly affect the NWI since household production is the second-biggest component. Unfortunately,
we do not know and will be unable to know in the future unless more time use surveys are
conducted. Other components suffer from data constraints as well, but this lack of data might be the
most severe due to the dimension of household production in an economy. The more resources that
are dedicated to the measurement of social and ecological welfare, the better a society can judge its
own development beyond GDP.
NWI in Ireland and Germany: A cross-country comparison
The adaptation of the German methodology for the Irish NWI offers an interesting opportunity to
directly compare the welfare development in the two different countries. Nevertheless, despite the
same methodological framework, there are some minor differences in the computation of the two
indices’ components which are mainly due to different data situations in the two countries. More
importantly, two components of the German NWI could not yet be implemented in the Irish NWI
because sufficient data are not available, i.e. the social costs of criminality that is estimated every
year by the German police, and the costs and benefits of durable consumer goods. The latter might
be possible to add to the NWI in the future but for now was left out because its computation would
require resources that would go beyond the scale of this feasibility study. Besides these two
components that require apparently unavailable data, the social costs of nuclear energy were also
left out of the NWI for Ireland since the country, as already mentioned, in contrast to Germany, is not
a producer of nuclear energy. Hence, to allow for comparisons, the components mentioned above
were excluded from the German NWI as calculated in previous publications.20
20 Diefenbacher, H./Held, B./Rodenhäuser, D./Zieschank, R. (2016b): "Wohlfahrtsmessung „Beyond GDP“ – Der Nationale Wohlfahrtsindex (NWI 2016)", IMK Studies Nr. 48, Juli 2016, Düsseldorf, Hans-Böckler-Stiftung.
20
70
80
90
100
110
120
130
Figure 7: NWI and GDP p.c. in Germany and Ireland(standardized, 2000 = 100)
GER GDP p.c. GER NWI p.c. IE GDP p.c. IE NWI p.c.
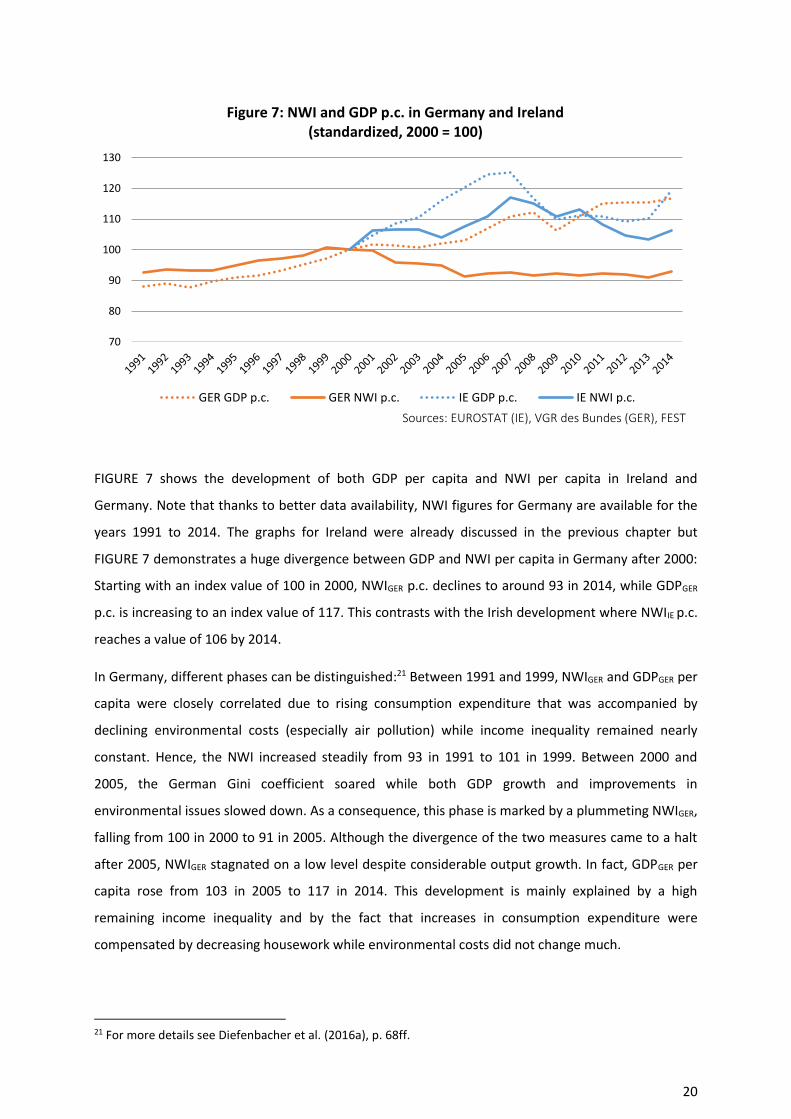
FIGURE 7 shows the development of both GDP per capita and NWI per capita in Ireland and
Germany. Note that thanks to better data availability, NWI figures for Germany are available for the
years 1991 to 2014. The graphs for Ireland were already discussed in the previous chapter but
FIGURE 7 demonstrates a huge divergence between GDP and NWI per capita in Germany after 2000:
Starting with an index value of 100 in 2000, NWIGER p.c. declines to around 93 in 2014, while GDPGER
p.c. is increasing to an index value of 117. This contrasts with the Irish development where NWIIE p.c.
reaches a value of 106 by 2014.
In Germany, different phases can be distinguished:21 Between 1991 and 1999, NWIGER and GDPGER per
capita were closely correlated due to rising consumption expenditure that was accompanied by
declining environmental costs (especially air pollution) while income inequality remained nearly
constant. Hence, the NWI increased steadily from 93 in 1991 to 101 in 1999. Between 2000 and
2005, the German Gini coefficient soared while both GDP growth and improvements in
environmental issues slowed down. As a consequence, this phase is marked by a plummeting NWIGER,
falling from 100 in 2000 to 91 in 2005. Although the divergence of the two measures came to a halt
after 2005, NWIGER stagnated on a low level despite considerable output growth. In fact, GDPGER per
capita rose from 103 in 2005 to 117 in 2014. This development is mainly explained by a high
remaining income inequality and by the fact that increases in consumption expenditure were
compensated by decreasing housework while environmental costs did not change much.
21 For more details see Diefenbacher et al. (2016a), p. 68ff.
Sources: EUROSTAT (IE), VGR des Bundes (GER), FEST

21
70
80
90
100
110
120
2000 2001 2002 2003 2004 2005 2006 2007 2008 2009 2010 2011 2012 2013 2014
Figure 8: Index of income distribution(Gini coefficient, 2000 = 100)
IE GER
While the German NWI depicts a disturbing decoupling of economic growth from social welfare,
these seem to be more correlated in Ireland. This difference between the two countries can be
attributed to at least two reasons: Firstly, in contrast to Germany, there was no similar rise in income
inequality in Ireland after 2000. This contrast is illustrated by FIGURE 8 that displays the normalized
Gini coefficients for both countries between 2000 and 2014. While income inequality in Germany
reaches an index value of 113 in 2005 and remains at this level, the Irish Gini coefficient rises only to
106 and subsequently declines again.
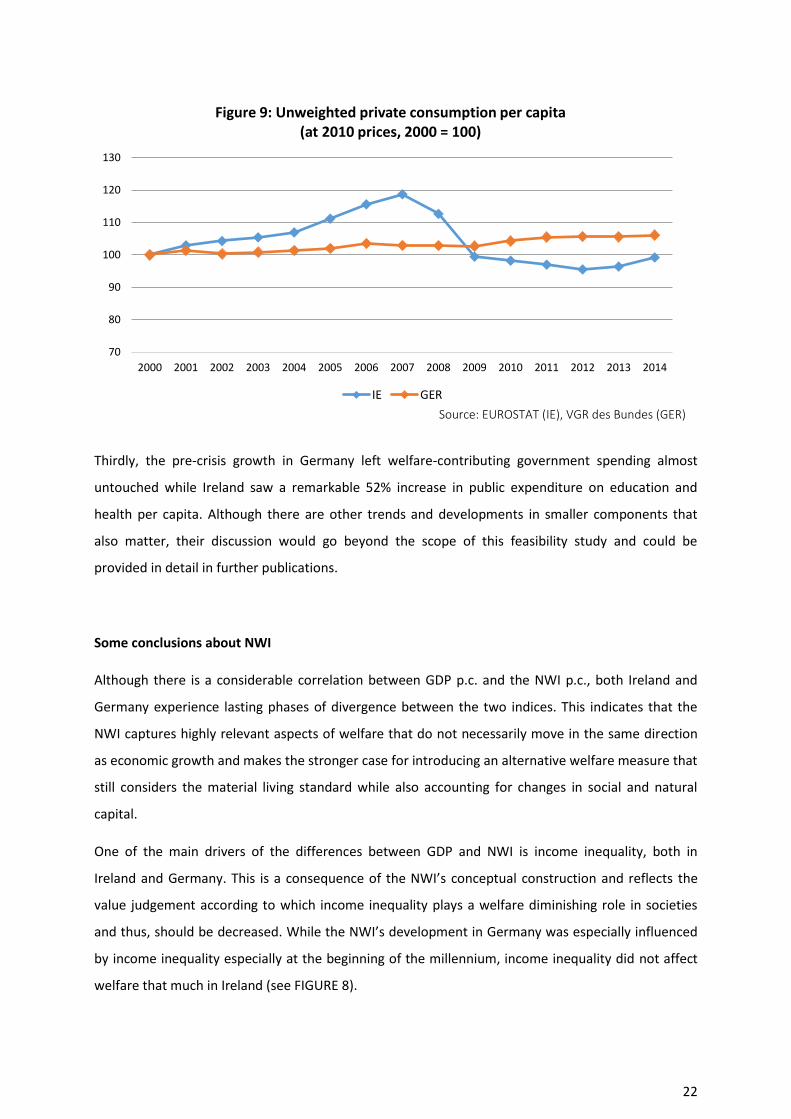
Secondly, consumption behaved in a very distinct manner in both countries as FIGURE 9 displays.
While in Ireland unweighted private consumption per capita increased by 19% from 2000 to 2007,
Germany only experienced a 3% increase at the same time. This pattern was reversed after the
financial crisis that brought down unweighted private consumption per capita to a level below the
value of 2000 while the German per capita consumption kept on rising slowly, but continuously.
Sources: EUROSTAT (IE), SOEP & Mikrozensus (GER)
22
70
80
90
100
110
120
130
2000 2001 2002 2003 2004 2005 2006 2007 2008 2009 2010 2011 2012 2013 2014
Figure 9: Unweighted private consumption per capita(at 2010 prices, 2000 = 100)
IE GER
Thirdly, the pre-crisis growth in Germany left welfare-contributing government spending almost
untouched while Ireland saw a remarkable 52% increase in public expenditure on education and
health per capita. Although there are other trends and developments in smaller components that
also matter, their discussion would go beyond the scope of this feasibility study and could be
provided in detail in further publications.
Some conclusions about NWI
Although there is a considerable correlation between GDP p.c. and the NWI p.c., both Ireland and
Germany experience lasting phases of divergence between the two indices. This indicates that the
NWI captures highly relevant aspects of welfare that do not necessarily move in the same direction
as economic growth and makes the stronger case for introducing an alternative welfare measure that
still considers the material living standard while also accounting for changes in social and natural
capital.
One of the main drivers of the differences between GDP and NWI is income inequality, both in
Ireland and Germany. This is a consequence of the NWI’s conceptual construction and reflects the
value judgement according to which income inequality plays a welfare diminishing role in societies
and thus, should be decreased. While the NWI’s development in Germany was especially influenced
by income inequality especially at the beginning of the millennium, income inequality did not affect
welfare that much in Ireland (see FIGURE 8).
Source: EUROSTAT (IE), VGR des Bundes (GER)
23
Despite the important role of inequality, other factors play decisive roles, too. Decreases in the value
of housework compensated other welfare-contributing developments in Germany and in fact might
have done the same in Ireland if our conservative estimations were too cautious about the decline of
housework per person. Rising public expenditure on health and education consolidated the upward
trend of the NWI Ireland before the financial crisis. Improvements in costs due to environmental
degradation contributed more to the NWI rise in Germany between 1991 and 2000 than all economic
components combined. While there are some “reminder values” without very important significance
for the overall index, most of NWI’s components matter and show us which aspects of welfare
performed well and which should be tackled by adequate policies.
V. Future potential of the NWI for Ireland
While we are confident in the general direction of our current results, the present work is only the
starting point of a possible examination of multidimensional welfare in Ireland based on the NWI. In
a further study, several remaining issues could be tackled. Firstly, possibilities to include the two
components left out to date due to the lack of available data which are the costs of crime and the
costs and benefits of durable consumer goods. For example, the latter might be estimated based on
data collected via the Irish Household Budget Survey that includes highly specific information about
the nature of private consumption expenditure including the purchases of durable consumer goods.
Moreover, several of the environmental components included in the NWI numbers for this study
have been preliminarily monetized by using the predominant cost rates for Germany, such as the
cost rates of traffic noise per km (passengers and tours) used for component no. 15. In a further
study, specific cost rates for Ireland would be researched or even constructed if necessary to yield
better estimates of how changes in natural capital might affect the country.
Besides monetization, extrapolation in case of missing data is another topic that would be tackled
further in subsequent NWI studies for Ireland. For several components, such as costs of traffic
accidents or commutation, the necessary data are only partially available and thus, both inter- and
extrapolation are inevitable. Although for this feasibility study we have predominantly chosen to
interpolate in a linear way and to extrapolate by holding the last value constant in real terms, better
estimations might be possible based on carefully selected anchor variables showing strong
correlations. This especially concerns time use data that to date have been either held constant (in
the case of time spent on volunteering) or extrapolated with very conscious growth rates based on
comparisons with a handful of OECD countries (in the case of household production). Mainly for the
24
latter, further research into its main drivers could lead to more valid estimations that account for
country specific results such as age structure and employment. With better estimates and
extrapolation techniques, it might be possible to expand the time span covered by our study back to
1996 while also adding numbers for more recent years.
A further study would also allow for more reflection and a broader perspective on the NWI. Besides
comparisons with other measures of welfare such as the Human Development Index or the
population’s subjective well-being, all 17 components would be discussed in detail concerning their
specific development and their relative impact on changes in welfare. Furthermore, it would also be
of high interest to view income inequality in Ireland through the perspective of different measures of
inequality since the weighting of private consumption is one of the main factors that can cause NWI
and GDP to diverge. Hence, it would be highly relevant to investigate whether the Gini coefficient’s
depiction of income distribution coincides with the development of other statistical measures.
Furthermore, a closer dialogue with Irish authorities could close data gaps and create possibilities to
encourage the future of collection of necessary data. In Germany, the NWI has even been adopted by
the German Environment Agency as part of its annual indicator report on the state of the
environment,22 8 years after its introduction to the German scientific community. If the NWI for
Ireland was based on a broader research program and computed in better coordination with Irish
statistics officials, it might be possible to reach a similar degree of recognition by officials and
policymakers maybe in a shorter time, a development that could have a lasting impact on
sustainability and well-being in Ireland. Nobel prize laureate in economics Joseph Stiglitz once
emphasized that “what we measure affects what we do”. How Irish welfare behaved during the last
two decades is a complex question, but the introduction of a measure like the NWI for Ireland might
prepare the ground for an economic transformation towards sustainability.
References
Note: The data sources used in this study are not listed here and can be found in each component’s section. All online sources were last accessed on August 19, 2017.
Diefenbacher, H./Zieschank, R.; with contributions from Dorothee Rodenhäuser (2010): Measuring Welfare in Germany. A suggestion for a new welfare index. On behalf of the Federal Environment Agency (Germany). Dessau-Roßlau
Diefenbacher, H./Held, B./Rodenhäuser, D./Zieschank, R. (2016a): Aktualisierung und methodische Überarbeitung des Nationalen Wohlfahrtsindex 2.0 für Deutschland 1991 bis 2012. Dessau-Roßlau: Umweltbundesamt. URL: http://fest-heidelberg.de/images/FestPDF/nwi_2_0_langfassung.pdf
22 Umweltbundesamt (2017).
25
Diefenbacher, H./Held, B./Rodenhäuser, D./Zieschank, R. (2016b): Wohlfahrtsmessung „Beyond GDP“ – Der Nationale Wohlfahrtsindex (NWI 2016). IMK Studies Nr. 48, Juli 2016, Düsseldorf: Hans-Böckler-Stiftung
Duffy, P./Black, K./O’Brien, P./Hyde, B./Ryan, A.M./Ponzi, J./Alam, S. (2017): Ireland National Inventory Report 2017. Greenhouse Gas Emissions 1990 – 2015 Reported to the United Nations Framework Convention on Climate Change. Wexford: Environmental Protection Agency, URL: http://unfccc.int/files/national_reports/annex_i_ghg_inventories/national_inventories_submissions/application/zip/irl-2017-nir-14apr17.zip
Fioramonti, Lorenzo (2013): Gross domestic problem – the politics behind the world’s most powerful number. London: Zed Books
Gershuny, J. (2004): Domestic equipment does not increase domestic work: a response to Bittman, Rice and Wajcman. In: The British Journal of Sociology 55 (3), p. 425–431. doi:10.1111/j.1468-4446.2004.00027.x
Lepenies, Philipp (2013): Die Macht der einen Zahl – Eine politische Geschichte des Bruttoinlandsprodukts. Frankfurt/M.: Suhrkamp
McGinnity, F./ Russell, H./ Williams, J./ Blackwell, S. (2005): Time-Use in Ireland 2005: Survey Report. Dublin: University College Dublin, URL: https://www.ucd.ie/t4cms/TimeUse2005%20Report.pdf
Schwermer, S./ Preiss, P./ Müller, W. (2012): Best-Practice-Kostensätze für Luftschadstoffe, Verkehr, Strom- und Wärmeerzeugung. Anhang B der „Methodenkonvention 2.0 zur Schätzung von Umweltkosten“. Dessau/Berlin: Federal Environment Agency (Germany), URL: http://www.umweltbundesamt.de/publikationen/methodenkonvention-20-zur-schaetzung-von-1
Speich Chassé, Daniel (2013): Die Erfindung des Bruttosozialprodukts. Göttingen: Vandenhoek und Ruprecht
Umweltbundesamt (Hrsg.) (2017): Daten zur Umwelt 2017. Dessau-Roßlau: UBA. URL: https://www.umweltbundesamt.de/sites/default/files/medien/376/publikationen/daten_zur_umwelt_2017_indikatorenbericht.pdf
U.S. Senate (1934): National income 1929-1932. 73rd Congress, 2nd Session, Document No. 124. Washington, DC: Government Printing Office
Vanoli, André (2002): Une Histoire de la Comptabilité Nationale. Paris: Editions de la Découverte

26
Appendix: Preliminary component values of the NWI 2000-2014 All monetized components are given in billion euros. Population figures are given in million, NWI p.c. in euros.
+/- x + + + + + - - - - -
Year Gini
Weighted consumption
Housework Voluntary
Work Health and education
Durable goods
Travel btw. Home and workplace
Traffic accidents
Criminality
Alcohol, tobacco and drug
abuse
Environmental expenditure
Comp. 1 Comp. 2 Comp. 3 Comp. 4 Comp. 5 Comp. 6 Comp. 7 Comp. 8 Comp. 9 Comp. 10 Comp. 11
2000 100 63 32 2.8 6.4 1.2 0.8 5 1.3
2001 96.7 68 33 2.9 7.4 1.1 0.8 5 1.5
2002 99.3 68 34 3 8.3 1.1 0.8 5 1.6
2003 102 68 34 3 8.8 1.2 1.2 5 1.6
2004 105 68 35 3.1 9.4 1.2 1.3 5 1.8
2005 106.3 72 36 3.2 9.9 1.4 1.5 5 2
2006 106.3 76 37 3.2 10.6 1.5 1.4 5 2.2
2007 104.3 82 38 3.4 11.2 1.7 1.4 5 2.4
2008 99.7 84 39 3.4 11.6 1.6 1.2 5 2.4
2009 96 78 39 3.5 11.2 1.3 1 5 2.1
2010 102.3 73 39 3.5 11 1.4 0.9 5 1.9
2011 99.3 74 39 3.5 11.8 1.4 0.8 5 1.5
2012 101.7 72 38 3.5 11.5 1.3 0.7 5 1.5
2013 102.3 72 38 3.5 11.2 1.4 0.8 5 1.3
2014 103.7 74 38 3.5 11.4 1.5 0.8 5 1.2

27
+/- - - - - + + - - - = 2000 = 100
Year
Water pollution
Soil degradation
Air pollution
Noise Ecosystems Agricultural
areas Replacement
costs GHG
emissions Nuclear energy
Total Total
Comp. 12 Comp. 13 Comp. 14 Comp. 15 Comp. 16 Comp. 17 Comp. 18 Comp. 19 Comp. 20 NWI NWI norm.
2000 0.006 0.3 3 0.2 -0.007 -0.1 8 5.5 79 100
2001 0.006 0.3 3 0.2 -0.007 0 9 5.7 85 108
2002 0.006 0.3 2.6 0.2 -0.007 -0.6 9 5.5 87 110
2003 0.006 0.3 2.5 0.2 -0.007 0 9 5.6 88 112
2004 0.006 0.3 2.4 0.2 -0.007 -1.1 9 5.5 88 111
2005 0.006 0.3 2.4 0.3 -0.007 -0.1 10 5.6 92 117
2006 0.006 0.3 2.3 0.3 -0.007 -0.7 10 5.6 98 124
2007 0.006 0.3 2.2 0.3 -0.007 0.3 10 5.5 106 135
2008 0.006 0.3 2 0.2 -0.007 -1.6 11 5.5 107 136
2009 0.006 0.3 1.8 0.2 -0.007 -0.2 10 5 105 133
2010 0.006 0.3 1.6 0.2 -0.007 8.1 10 5 108 136
2011 0.006 0.3 1.5 0.2 -0.007 -0.3 10 4.7 103 131
2012 0.006 0.3 1.5 0.2 -0.007 -0.5 10 4.7 100 127
2013 0.006 0.3 1.5 0.2 -0.007 -1.2 9 4.7 99 126
2014 0.006 0.3 1.4 0.2 -0.007 -0.2 9 4.7 102 130

28
+/- = 2000 = 100
Year Population Total Total
NWI p.c. p.c. norm.
2000 3.8 20,919 100
2001 3.8 22,249 106
2002 3.9 22,326 107
2003 4 22,276 106
2004 4 21,776 104
2005 4.1 22,492 108
2006 4.2 23,210 111
2007 4.3 24,517 117
2008 4.5 24,054 115
2009 4.5 23,196 111
2010 4.5 23,684 113
2011 4.6 22,634 108
2012 4.6 21,872 105
2013 4.6 21,647 103
2014 4.6 22,243 106