20 Indispensable Photo Tips20 Indispensable Photo Tips - Ebook
Upload
truongminhCategory
view
212download
0
SUMMARY - THE NATIONAL STRATEGY OF ENERGY AND PLAN OF ACTION _____________________________________________________________________________
THE NATIONAL STRATEGY OF ENERGY AND
PLAN OF ACTION
SUMMARY
Tirana, June 2003
(Updated on April 2005)
SUMMARY - THE NATIONAL STRATEGY OF ENERGY AND PLAN OF ACTION _____________________________________________________________________________
TABLE OF CONTENTS
1. ENERGY SITUATION IN ALBANIA AND THE OBJECTIVES OF NATIONAL STRATEGY OF ENERGY......................................................................................................................................................…4
1.1 Situation on the consumption side...............................................................................................................4 1.2 Current situation on energy consumption and supply ................................................................................5 1.3 Energy production, importing, transmission and distribution capacities...................................................7 1.4 Energy sources reserves ...............................................................................................................................8 1.5 Pollution for environment from energy sources.........................................................................................9 1.6 Goal and objectives of the National Energy Strategy................................................................................10
2. ENERGY SCENARIOS FOR THE DEVELOPMENT OF ALBANIAN ENERGY SYSTEM ............11
2.1 General macro-economic indicators of the energy sector development ...................................................11 2.2 Summary of energy forecasts according to passive and active scenario ..................................................12
3 ACTION PLAN FOR THE IMPLEMENTATION OF THE NATIONAL STRATEGY OF ENERGY16
3.1 Action plan for the implementation of strategy related with reduction of energy demand through increase of energy efficiency......................................................................................................................16
3.1.1 Shifting from electricity for space heating & cooking to LPG and other energy alternatives .......... 16 3.1.2 Thermal insulation of current stock of public buildings, based on the code of new buildings.......... 17 3.1.3 Penetration of solar thermal energy for hot water supply in households and service sector ......... 18 3.1.4 Promotion of individual central heating, district heating and combined heat and power plants in
service, industry and households sectors ............................................................................................18 3.1.5 Promotion of efficient lighting in households, service and industry sectors…………………19 3.1.6 Substitution of coal, fuel wood, residual fuel oil with heavy fuel oil in boilers/furnaces...................19 3.1.7 Increase of energy efficiency for existing stock of boilers/furnaces in industry and service sectors .20 3.1.8 Improvement of power factor (cosϕ) in industrial enterprises ...........................................................20 3.1.9 Promotion of public transport and other measures in transport sector................................................21 3.1.10 Increase of energy efficiency in Agriculture sector irrigation in particular).......................................22 3.1.11 Promotion of efficient use of energy through awareness campaign in service, transport, industry and agriculture sector ............................................................................................................................................ 22
3.2 Action plan for implementation of the energy supply strategy with different energy sourcesxxii 3.2.1 Power Sector Supply Strategy ............................................................................................................23
3.2.1.1 Master plan for the development of power generation sector .......................................................23 3.2.1.2 Master plan for the development of electricity transmission sector..............................................24 3.2.1.3 Master plan for the development of distribution system...............................................................24 3.2.1.4 Electricity tariff system development ...........................................................................................26
3.2.2 Oil and oil by products supply strategy ..............................................................................................28 3.2.2.1 Strategy for the development and increase of production of oil supply........................................28 3.2.2.2 Refinery and marketing oil sector strategy ...................................................................................29 3.2.2.3 Storage oil by products development strategy ..............................................................................29
3.2.3 Probable strategies for importing natural gas in Albania....................................................................30 3.2.4 The necessary investments for ensuring supply with all energy sources............................................31
3.2.4.1 International Financial Institutions ...............................................................................................32 3.2.4.2 Private financing in the energy sector ...........................................................................................32
3.2.5 Restructuring energy sector very important step for the implementation of the National Strategy of Energy ............................................................................................................................. 32
3.2.6 Indispensable Legal framework for the implementation of the National Strategy of Energy 35
_________________________________________________________________________ Ministry of Industry and Energy, National Agency of Energy
2
SUMMARY - THE NATIONAL STRATEGY OF ENERGY AND PLAN OF ACTION _____________________________________________________________________________
INTRODUCTION The strategy for the development of energy sector is a document that analyses and recommends the future changes that must be undertaken of the energy one in the Republic of Albania. This document analyses and includes the necessary changes that should occur in order to increase the security of the energy supply and the optimization of the energy resources in order to meet the demands and achieve a sustainable economic development in the future. As the changes in the energy sector are not spontaneous, the restructuring process of the energy sector needs essential steps. The new strategy for the energy sector development is considered as an expression of the national demands which provides a sustainable development of the whole national economy and achieves in meantime the environmental protection during the whole cycle of the energy sources utilisation. The strategy for the development of energy sector will be part of general strategy of country economic development, the so-called National Strategy for Socio-Economic Development (NSSED). Meeting the target of sustainable development for the energy sector needs the definition of all objectives and the necessary fiscal steps through a well-defined strategy as well as respective investments. The Energy Strategy too, is necessary to meet our obligations in the framework of the Regional Electricity Market in South East European countries, and due to other international obligations regarding the environmental protection as well as the harmonization and converging of the energy sector development according to EU Directives for the association of Albania in the European family. The strategy for the development of energy sector contains technical, financial, economic, legal, organizational, institutional and environmental aspects as well as the continuous training of the specialists in order to prepare the necessary framework for an easy and not constrained integration of the Albanian energy system into the regional and European one. The strategy deals with a number of issues and answers of many strategic and important questions, such as: • What national interests should be protected and how? • How to deliver those national interests among different energy sub-sectors (oil, hydro-energy,
electricity, natural gas, fuel wood, etc)? • How to increase competition, establish a consumer-oriented market, without impairing the government
responsibilities on the energy system functioning, and security of supply? • What necessary conditions should be established and fulfilled in a defined timetable in order to
harmonize the Albanian power system with the EU one? The strategy is developed by using a well-known software, namely LEAP1. Despite of using such software the Albanian Energy Strategy remains unique in its concepts due to the country’s special conditions that make the job difficult and the fact that no similar solutions can be applied for different countries. Each country of the region including Albania as well, will be integrated into the EU energy market by taking into account particularities of the energy sector according to the Energy Charter Treaty and the Directive 96/92 on the Electricity. Each long-term economic development strategy, including energy strategy of Albania, is based on a clear vision towards future development and expected ones, which should be occur in the energy sector. Some direction guidelines drawn from long historical analysis in different countries, illustrate the future trends: • The future energy system should be more consumer-oriented, • The future power system should be very diversified as regards the use of all energy sources and
technologies,
1 LEAP (Long -range Energy Alternatives Planning ) is a scenario-based integrated energy -environment modeling system designed and disseminated by the Boston Center of the Stockholm Environment Institute. Its methodology is based on a comprehensive accounting of how energy is consumed, converted and produced in a given region or economy under a range of alternative assumptions on population , economic development, technology , price and so on.
_________________________________________________________________________ Ministry of Industry and Energy, National Agency of Energy
3
SUMMARY - THE NATIONAL STRATEGY OF ENERGY AND PLAN OF ACTION _____________________________________________________________________________ • The future energy system should be more decentralized, • More attention should be focused on the efficient energy use, • The technologies selected to meet the demands should be based on the least cost planning principle,
supply reliability and environmental protection, • The renewable energy resources (solar, wind, biomass and especially small HPP) should be stimulated
for a maximal use of indigenous resources, based meantime on least cost planning and environmental protection principles.
The strategy is developed as a national strategy based on the country and its citizens/consumers basic interests. No full or partial private priority (for individuals or particular companies) will be set over the national interest. This crucial issue was taken into consideration during the preparation of the basic concepts for the development of electricity, oil, by-products and natural gas markets, with a clear division between the public and private functions aiming the improvement of energy markets. As a consequence, the remaining part of the government property in the electricity and natural gas transmission infrastructure according to non-discriminating and impartial principles for subjects buying or selling energy, is based on the Constitution of the Republic of Albania. 1. ENERGY SITUATION IN ALBANIA AND THE OBJECTIVES OF NATIONAL
STRATEGY OF ENERGY 1.1 Situation on the consumption side Some of main identified problems that point out the historic development and possible tendencies for Albanian energy sector are as following: • Increase of the electricity consumption by households consumers during the transition period has led to
high levels of technical and non-technical losses and reduction of security of supply; • Lack of electricity price liberalization has led to its massive use for different services in the household
and service sectors (space heating and cooking); • Lack and relatively high prices of other alternative energy sources forced the consumers to focus more
on the electricity use; • Very low efficiency of energy use; • Growth rates in the consumption of diesel and gasoline especially in transport is much higher than what
can be accommodated by the supply of domestic oil by-products affecting therefore the increase of import.
• Production of oil and gas has declined rapidly due to the lack of funds. Efforts to increase oil production in the existing and new sources through production sharing agreements have not yet been successful.
• Generation of electricity is dominated by the hydropower output while the thermal based generation has remained stable around 100 GWh per year. In the course of years 2000-2002 there was a sensitive decline of the electricity production due to drought seasons;
• Supply structure of primary energy sources is becoming less and less diversified due to the increasing role of oil, hydro and fuel woods energy supplies compared to coal and natural gas.
As a conclusion, the last years situation indicates that the electricity balance is very tight and KESH became a net importer of considerable electricity quantities and in the coming years will continue to import even more to meet the growing demand until construction of new power plants.
_________________________________________________________________________ Ministry of Industry and Energy, National Agency of Energy
4
SUMMARY - THE NATIONAL STRATEGY OF ENERGY AND PLAN OF ACTION _____________________________________________________________________________ 1.2 Current situation on energy consumption and supply
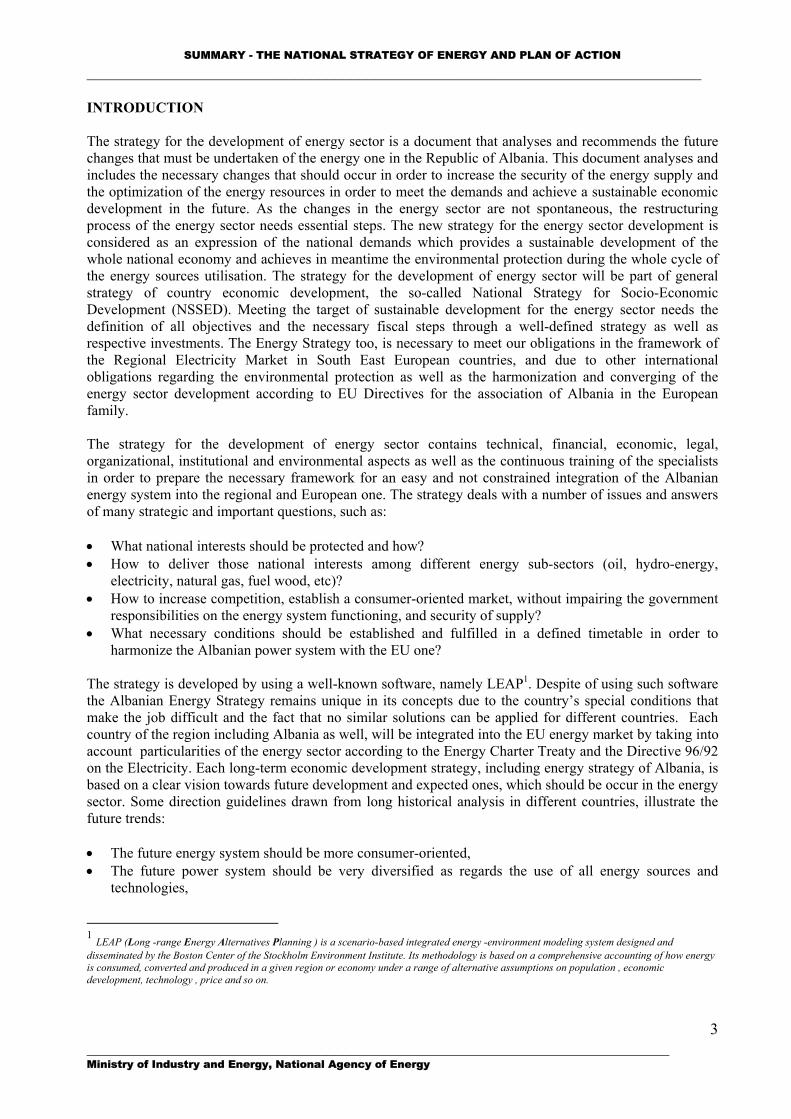
Figure 1 shows the consumption of the energy sources in all economic sectors during 1990-2001. As indicated in respective figures, the consumption has declined from a peak of 2.26 million ton oil equivalent (Mtoe) in 1990 to 1.22 Mtoe in 1992. Since that year the consumption of primary energy sources has increased by reaching a value of 1.84 Mtoe in 2001.
0 200 400 600 800 1000 1200 1400 1600 1800 2000 2200 2400
1990 1991 1992 1993 1994 1995 1996 1997 1998 1999 2000 2001
Households Service Industry Transport Agriculture Other
0250500750100012501500175020002250250027503000325035003750400042504500 Household Industry
Service Agriculture
Others
Figure 1.: Contribution of each sector in energy consumption (ktoe)
Figure 2.: Electricity consumption according to economic sectors (GWh)
In 1990, the industry has consumed 50% of the total sources, declining to 35% in 1992 and 17% in 2001. Transport was the sector that experienced a continuous increase of the energy sources consumption. In 1990 the transport sector has consumed 6% of the total energy consumption, reaching the value of 44% in 2001. Another sector that experienced changes was the residential one, with a consumption of 14.6% of the total in 1990 reaching a level of 21% in 2001. Service sector also experienced high rates of energy consumption increase, ranging from 5.4% in 1990 to 16.5% in 2001. Figure 2 indicates the consumption of electricity according to each economic sector. Household is consuming the biggest part of electricity, which keeps the main share of the consumption.
020040060080010001200140016001800200022002400260028003000
O il H ydro&Im p. ElecW ood N at G asC oal Solar Energy
0
200
400
600
800
1000
1200
1400
1600
1800
2000
2200
2400
Lim estone
Sandstone
C onsum ption
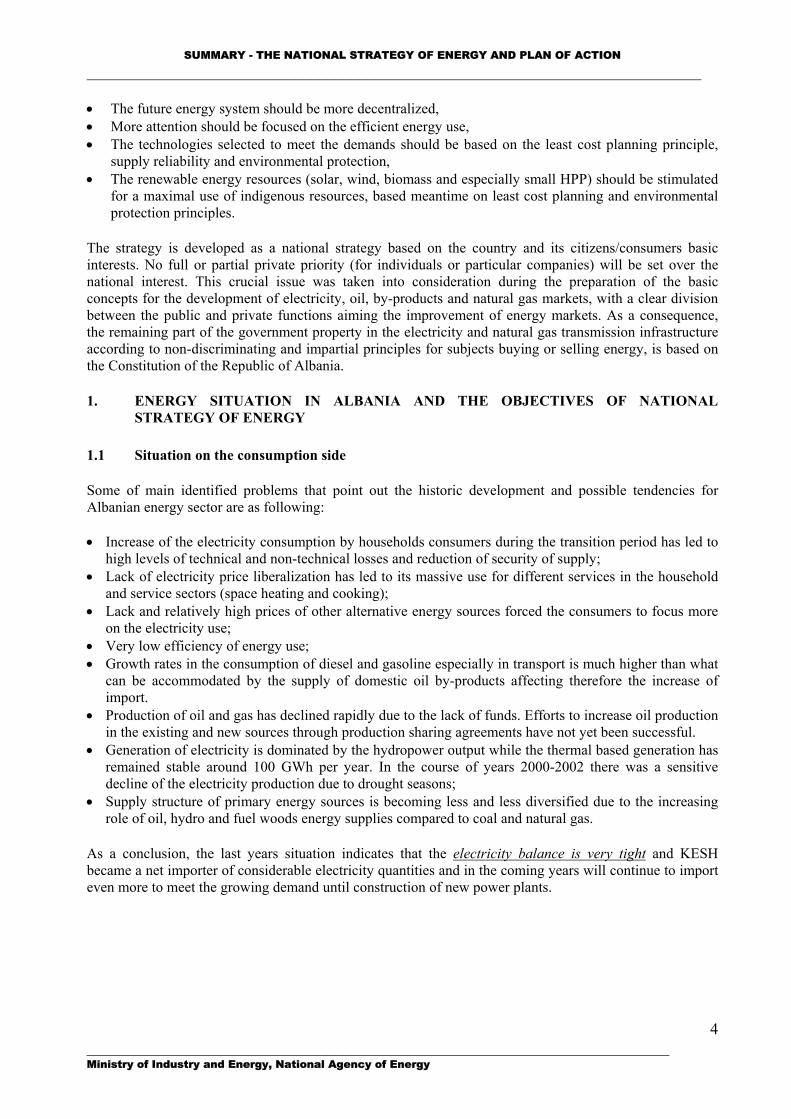
Figure 3.: Supply with primary energy resources (ktoe)2 Figure 4.: Oil generation from sand, limestone rocks and
respective consumption (ktoe)3
2 Source: Figures I.7 and I.8 are based on the National Energy Balances prepared by KESH and the NAE.
_________________________________________________________________________ Ministry of Industry and Energy, National Agency of Energy
5 3 Source: Figures I.9 and I.10 are based on Oil and Gas Balances prepared by Albpetrol and processed by the NAE.
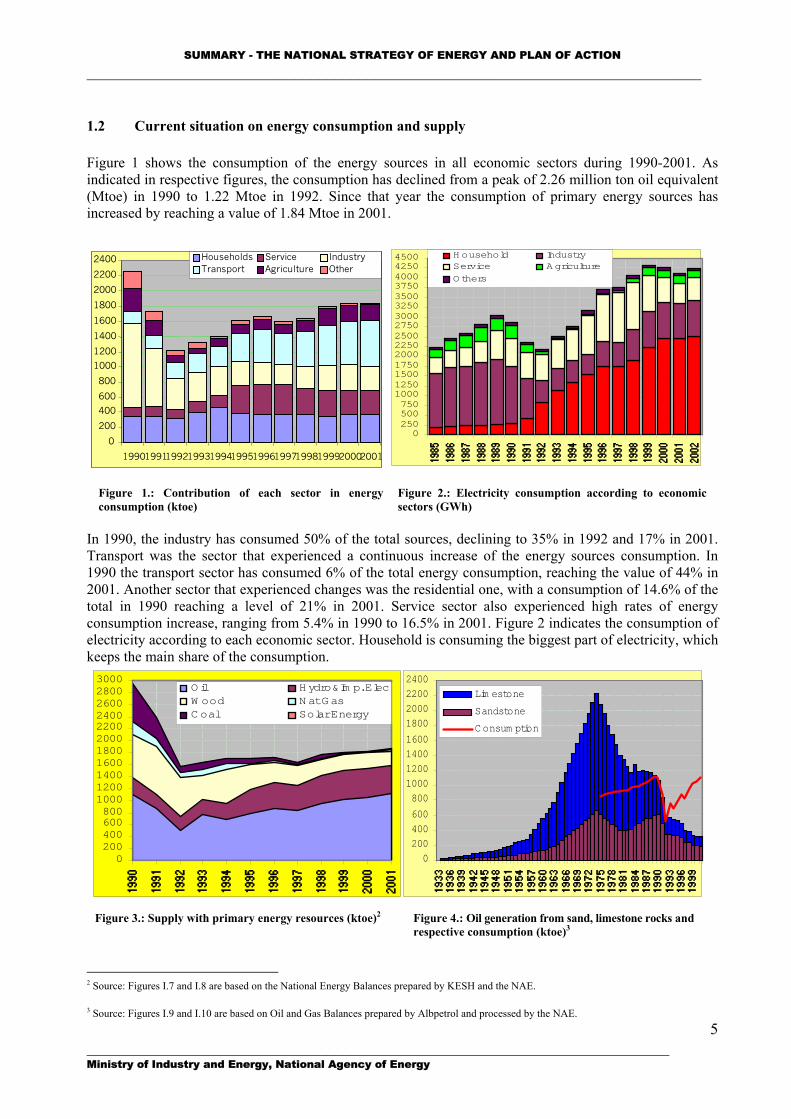
SUMMARY - THE NATIONAL STRATEGY OF ENERGY AND PLAN OF ACTION _____________________________________________________________________________ Figure 3 indicates the supply with primary energy sources during the period 1990-2001. Analysis show that the most significant share on energy balance belongs to oil sector, hydro-energy (electricity imported) and fuel-wood. Figure 4 shows the oil production from sand and limestone rocks as well as the respective consumption. Analysis shows that Albanian is becoming net importer of oil by products ranging values of 73%. Notwithstanding from financial barriers to import, the main problem, which faces today the Albanian power sector, is technical limited capacity by producing and importing, to make possible the electricity supply at maximum total levels of 18-20 million kWh/day. As a consequence, the power system fulfils only 70-80% of the total demand during the peak winter period, causing electricity load shedding to customers. The most urgent problems and challenges that the Albanian power sector is facing today are the following: • Current generation capacity is insufficient to meet the actual demand of 6.60 TWh/year (for 2003, as
indicated in figure 5. • Problem of the so-called “non-technical losses”: Non-technical losses has been very high, but in 2000
and 2001, these kind of losses were reduced due to very strict measures taken by Ministry of Industry and Energy, Group of Donors in cooperation with KESH and ENEL.
• Technical losses in the transmission-distribution network are still high. KESH, in close cooperation with Group of Donors and ENEL, have prepared an Action Plan, updated every year, in order to reduce the losses. Necessary investments for this objective are being funded by the financial package approved by Donors Group.
010020030040050060070080090010001100120013001400
Elec. For SH Consum p.: (1375GW h or 23.8% of total)Elect. Dem and exluding SH:(4400 GW h or 76.2% of total)
6062
525557
4750 4245
3740
303235
2527 2022
1517
1012
02505007500050005000500050005000500050005000500050005000 Im port
Sm all HPP
Therm al Power Plants
Hydro Power P lants
65
Figure 5.: Electricity generation from HPP and TPP and import (GWh)
Figure 6.: Annual continuity curve of electric load with and without space heating for 1999 (total supplied electricity 5775
GWh) • Electric interconnection with other neighbour countries: Electric interconnection with neighbour
countries includes three lines. Due to the instability system, the effective capacity of lines is reduced to 400 MVA. The capacity was considerably increased in 2001 due to increase of transforming capacities in Elbasan substation and the commissioning of a 220 kV line (4 km) between Elbasan 1 and Elbasan 2 substations, in August 2002. This created for KESH the possibility to import large quantities of electricity and reduce the electricity load shedding, but due to the technical limits of Greek system interconnection lines, the importing capacity is considerably reduced, requiring an extension towards the north part of the country.
• High values of electricity consumption for space heating: A strong tendency towards the increase of electricity consumption for space heating is becoming highly evident more and more, although other possibilities to use alternative sources already exist. Figure 6 gives the power system load curve during days with minimal load (summer) and maximal one (winter). Electricity, which is use for heating is the
_________________________________________________________________________ Ministry of Industry and Energy, National Agency of Energy
6
SUMMARY - THE NATIONAL STRATEGY OF ENERGY AND PLAN OF ACTION _____________________________________________________________________________
main reason why the power system is unable to guarantee a regular supply for other services besides space heating (such as lighting, electric appliances, different industrial operations and service sector).
• Unrealistic electricity tariffs: Many studies carried out by international and local institutions indicate that the long term marginal cost of electricity generation/transmission/distribution, taking into consideration the new plants/substations/lines that will be constructed to meet the increasing demand, is approximately 9.64 US cents/kWh (Electricity Tariff Evaluation Module prepared by the World Bank in January, 2003). KESH Action Plan approved by the Albanian Government and the Donors recommend tariff increase in order to improve the financial situation of KESH.
1.3 Energy production, importing, transmission and distribution capacities The total installed power generation capacity is 1659 MW, including 1446 MW hydro and 213 MW thermal. With other TPPs, practically out of work, efforts were concentrated on the rehabilitation of Fier TPP, especially the Czech unit with an installed capacity of 60 MW. The final conclusion of the study carried out by HARZA Company and NAE underlines the urgent need for the rehabilitation of Fier TPP not only for technical and safety reasons but also to reduce the electricity generation unit cost, which is actually very high. The rehabilitation will lead to a higher technical capacity, more security and obviously to a lower electricity generation unit cost. World Bank, European Bank of Investments and European Bank for Reconstruction and Development have expressed their support to finance a new TPP with a considerable capacity. The construction of the combined cycle TPP will be divided in three phases and each phase will have an installed capacity of 135 MW and a first investment of 110 Million USD. Albanian power system must profit from neighbouring power systems which produce electricity based on TPPs. Kosova is a typical case with an installed capacity of 1445 MW based almost on coal operating TPP. Based on this situation, the EU Electricity Directive (92/96) and the Athens Memorandum of November 15, 2002 signed by the Energy Ministers of Southeast European countries, was agreed to establish a regional electricity market (REM), that will require the construction of safe interconnection lines and the 400 kV Elbasan-Podgorica line (or Kosova) as a priority one, which will connect Albania, Greece and Macedonia in a short way (the so-called Adriatic path) with UCTE. There are two options for this line: Elbasan-Podgorica and Elbasan-Kosova B line. Albanian Power Transmission System is facing serious problems due to the insufficient development of the transmission system and the lack actually of rehabilitation and upgrading of the equipment during the last 15 years. This has considerably reduced the reliability of system operation and the quality of electricity supplied, and has limited the exchange capacity with neighbouring countries. The actual distribution equipment is in very bad conditions due to the long operating period. Extreme overload conditions are reached during the winter with the high consumption of electricity for space heating continuously damaging the distribution system. The average number of customers per km2 in Albania is approximately one third of the same figure in developed countries and the inhabitants’ number per km2 is almost half of them. The low number of customers and the low density of the population require big unit investments per customers. Actually World Bank in cooperation with other donors has approved the Transmission and Distribution Rehabilitation Project. The domestic oil fields have good potential capacities since their recovery coefficients are very low due to the lack of modern extraction technologies and sometimes due to exploitation in bad manner of these oil fields. There are actually 12 oil fields administrated by oil and gas company Albetrol. The main reasons causing the significant reduction of oil recovery for the period 1990-2002 are: • Significant reduction of the number of operating wells. • Not utilization of recovery oil methods. • Significant reduction of oil production from the use of working methods in the layers. • Limited investments for oil production sector.
_________________________________________________________________________ Ministry of Industry and Energy, National Agency of Energy
7
SUMMARY - THE NATIONAL STRATEGY OF ENERGY AND PLAN OF ACTION _____________________________________________________________________________ Actually are operating only two refineries, Ballsh and Fier, but due to the decline of crude oil production and their physical depreciation, they use only 30% of their capacity. Ballsh refinery commissioned in 1978 is the only complex refinery of the country. Although built in 1978, the refinery technology belongs to ’60. Ballsh refinery needs to be rehabilitated for the heavy depreciation reasons. The economic effect as regards energy expenses has deteriorated in these refineries. As a consequence, under the new conditions created in the oil-refining sector, which is currently faced to many problems, such as cost of refinery production compare with the Mediterranean refineries and the oil by-products quality, remain first-hand priority. Alternative scenarios include detailed economic analyses regarding the rehabilitation of oil refineries or construction of the new ones. The domestic gas production capacities are in their minimal limits, due to drying up of the reserves and decline of the initial pressure in oil resources. Due to gas reserve decline, 25 wells have an inflow production varying from 1000-8000 m3N/day. The existing natural gas fields are in their final development phase. The only concrete possibility to increase gas production is forecasting to drill of a new well in Delvina. Actually, the capacities of coal mines are, at their minimum, producing around 9000 tons from 2 million tons produced in years 90’, and this production comes mainly from Memaliaj mine and other three small ones in Korca. 1.4 Energy sources reserves Oil reserves in our country, despite predomination of normal technologies of oil exploitation, still conserve relatively high oil resources, which may be extracted applying the enhanced oil recovery. In the existing oil fields, the total reserves are about 450 Mtoe from which 340 Mtoe from sandstone deposits and some 110 Mtoe from limestone deposits. Greater share of the rezerves are situated in Driza deposit estimated in a value of 200 Mtoe and in Kucova in a value of 68 Mtoe, representing both 60% of the total geological oil reserves. Operations of foreign companies for exploration and production of oil in Albania have been completed and during this period 10 wells (6 off shore and 4 on shore) are drilled and 13000 km of new seismic profiles have been completed. Actually, out of five Hydrocarbon Agreements signed for exploration in Albania offshore area, only in the “RODONI-1” block the Hydrocarbon Operations are continuing, while on shore area exploration activities are going on in four blocks of first round and in five blocks of second round. Gas sources in our country have incurred drastic decline since year 1985 reaching the minimum after ‘90 as a consequence of lack of the investments in the existing gas fields and non-discovering of new reserves. Summarizing, the total proven reserves of natural gas in the country are some 57 million m3N. Delvina is another very effective gas field to continue on drillings and to produce associated gas. Coal is one of largest energy sources of Albania and it is spread in four main basins. The forecasted coal reserves are around 226.49 Mtoe. In general, our coal basins have coal with low net calorific value and thin mineral layer that causes a higher cost for energy unit compared to imported coal. These problems led closing down of many coal mines in Tirane-Durres, Pogradec and Korca basins except Bezhani mine, which is almost an open one. The Bezhani mine reserves are around of 2.77 Mtoe and it is the only mine in Korca basin with an efficient coal extraction cost. Proven reserves are approximately 14.7 Mtoe. Albania has a major hydropower potential of which only 35% so far is being exploited. Hydropower capacity installed up to 2002 is 1446 MW. Average output from hydropower is 4162 GWh. Profitability of hydropower exploitation is conditioned by the geological and topographic conditions for construction of dams and particularly by topographic conditions in view of avoiding as much as possible the land flooding. Their construction depends on big capital investment for unit The total hydropower reserves are estimated around 3000 MW and the potential of annual generation may reach 10 TWh. According to the actual system, are considered preferable new plants on the south part of Albania (Vjosa and Devoll) which will make possible and will create more profitability on the geofraphic balance of supply and demand. Based on the studies of
_________________________________________________________________________ Ministry of Industry and Energy, National Agency of Energy
8
SUMMARY - THE NATIONAL STRATEGY OF ENERGY AND PLAN OF ACTION _____________________________________________________________________________ Institute of Hydrotechnic Studies and Designing is made possible the implementation of the fully exploitation schemes of Drin, Devoll and Vjosa rivers. The new probable hydro power plants to be constructed on the future are: on Drin river: Bushati HPP (84 MW), Peshkopi (Skavica 1-130 MW), Skavica 2 (350 MW); on Vjosa river: Kaludha HPP (75 MW), Dragot-Tepelena HPP (130 MW) and Kalivaci HPP (100 MW); on Devoll river: Bratila HPP (115 MW) and Banja HPP (80 MW). Exploitation of hydro energy through small hydropower plant schemes is of interest, too. Until 1988, in Albania were built 83 small HPPs, which capacity varies from 5 to 1200 kW, with a total capacity of 14 MW. These HPPs are mostly of derivation type and exploit the water springs and streams closed to these areas and the average life of these HPPs is 25 years. Based on the different realized hydro-energetic studies of small HPPs they are of the range from 100-120 MW. Biomas can be classified in four major categories: woods or wood residues from various wood processing industries; vegetation residues (stems, seeds etc.) after completion of their production cycle, which are not used in other economic sectors; energetic plants (woods) cultivated to be burned as biomass, and animal residues (bones, skins, manure), which are not used in other economic sectors. According to some approximately estimations, the agriculture residues in Albania in the year 2001 were around 130 [toe/year]. Active exploitation of solar energy is achieved in systems that absorb this kind of energy through flat collectors. Hot water can be used for space heating, when its temperature is high, but it is used largely for Domestic Hot Water (DHW) needs. Nowadays, this technology has resulted as the most viable for exploitation of solar energy. NAE and EEC have carried out a number of studies for installing solar panels in both residential and service sector. Based on these studies, the EEC has achieved providing small grants from various donors, and has installed 15 solar panel systems. Albanian citizens have started installing solar panels for hot water promoted repeatedly by the EEC through various awareness campaigns. If the solar panel systems in Albania would be developed similarly with that in Greece, the potential production of hot water shall be equal with the energy amount of 1000 GWhth (or 125 MWth of installed capacity). Wind energy is another potential possibility to exploit for electricity generation. In most of the countries, instalment of windmills have a common concern, that of not having continuous measurement of the wind speed and long-lasting along several years. For this reason, various companies that are willing to invest in this sector has difficulties to take a decision whether it is feasible to invest in a certain area without these necessary data. Pre-feasibility, have shown the highest wind speed zones and too much longer period are those on the Seashore Lowland. This implies to give priority to the construction of 20 windmills nearby 20 pumping stations that are situated along the Adriatic cost safeguarding the land from floods. If this will be applied, than it is expected to get by year 2020 additional electricity of 400 GWh/year in the energy balance. Potential of municipal solid wastes as fuel is given primarily through their ingredients, calorific value, moisture content and non-combustible quantity municipal. The forecasted energy resources from solid urban wastes in our country for the year 2002 are 1.783 Mtoe and by 2050 will be around 9.517 Mtoe. Solid wasted could be used to produce energy, but must be highlight that their cost is too much higher than other traditional energetic fuels. Most important geothermal resources in Albania are: Geothermal area of Kruja with reserves of a range of 5.9x10⁸-5.1x10⁹ GJ; Geothermal area of Ardenice and Geothermal area of Peshkopi. Geothermal reserves must not be use profitably to the aim of energetic point of view, as their thermal potential is too much low (maximum temperature is about 20-33 0C). 1.5 Pollution for environment from energy sources Fuel production has been the major contributor of environmental pollution in the country. Solid polluters coming from coal and oil extraction, when these industries use to work with full capacity, were estimated to be more than 1.5 million tons in year 1989, and they are reduced approximately by 0.2 million tons/year in 2001. However, the main concern remains spills of crude oil and refinery residues in rivers, lakes and
_________________________________________________________________________ Ministry of Industry and Energy, National Agency of Energy
9
SUMMARY - THE NATIONAL STRATEGY OF ENERGY AND PLAN OF ACTION _____________________________________________________________________________ oilfield land. In all area of hundreds km2 surrounding Ballsh and Fier refineries prevails an unpleasant smell, while the water of rivers and torrents of this area has a high concentration of hydrocarbon residues. SO2 emissions from the energy sector in our country and in some of EU members for year 1998 are compared. SO2 emissions per capita in 1990 have been closely two times higher than the EU average, while for period 1994-2001 it was below that average. But the NOx emissions per capita in our country are 10-15 times lower than those of EU, and this mainly because of low industrialization level of our country. During ’90-’01 period, Albania has had the lowest rate of CO2 emissions per capita, and this is related to the following reasons: Energy consumption per capita in our country is lower compared to the other countries and power generation is almost based on hydropower. Two international conventions on environment are of importance for the energy sector: • Long-term convention on trans-boundary air pollution (LRTAP) under which are signed a number of
protocols pending soon ratification by the Albanian Government, and; • UN Framework Convention on Climate Change, including Kyoto Protocol, which is in final ratification
phase. With the assistance of UNDP/GEF, the Ministry of Environment through its Climate Change Unit has prepared a document namely Albania’s First National Communication to the United Nations Framework Convention on Climate Change. Among others, this document contains calculated emissions and absorptions of greenhouse gases in all economic sectors of the country for the year 1994. In addition scenarios (baseline and abatement scenario) of such emissions up to 2020 are developed. Must be point out that the Baseline Scenario corresponds with that Passive one on the Strategy and the Abatement Scenario of green houses gases corresponds to the Active Scenario of Albanian Energy Strategy. The above mentioned document is drawn up by the National Action Plan of Climate Change, where a significant and considerable share contains measures for the reduction of green houses emissions from energy sector which has the biggest impact on the environment. Albania’s Parliament has recently ratified the Kyoto Protocol. Although this protocol impose no obligation for Albania since it makes part of group of countries not included in Annex I of the Convention. Albania’s First National Communication underlines that there are possibilities to reduce greenhouse gases in a range of 25-28% as a result of using the energy sources in a more efficient way and increasing the use of renewable energy sources. This potential will be considered while designing the future CDM projects under the Kyoto Protocol. 1.6 Goal and objectives of the National Energy Strategy The scope of the National Energy Strategy is to develop an effective energy sector that: • Guarantees the security of the energy supply in general and electricity in particular, • Promote an efficient and economic use of energy, with minimal environmental impacts, in order to
support the sustainable development of the whole economic sectors. Primary objective of the National Energy Strategy is restructuring of the energy sector based on market economy principles and developing a modern energy policy. Specific objectives of the National Energy Strategy are: • Increase of the security and reliability of the energy supply in general and electricity in particular, in
national and regional levels; • Establish of an efficient energy sector from the financial and technical aspects; • Establish of an effective institutional and regulatory framework and restructuring of energy companies;
_________________________________________________________________________ Ministry of Industry and Energy, National Agency of Energy
10
• Increase of the energy efficiency in generation/production and final use of energy sources aiming a minimal environmental pollution;
SUMMARY - THE NATIONAL STRATEGY OF ENERGY AND PLAN OF ACTION _____________________________________________________________________________ • Optimization of the supply system with energy sources based on the least cost planning principle with
minimal environmental pollution; • Considerably increase investments in the energy sector through capital enhancement by International
Financial Institutions as well as private capital; and • Establishment of a competitive electricity market according to EU requirements for the electricity
sector reforms (Directive 96/92 EU) and Albania obligations under the Athens Memorandum (November 15, 2002) to support the energy sector integration into the Southeast Europe Regional Electricity Market and the interconnection with UCTE network.
2. ENERGY SCENARIOS FOR THE DEVELOPMENT OF ALBANIAN ENERGY SYSTEM With the purpose of analysing and forecasting the development of the energy sector in the future as regards of energy supply and demand with energy sources compiled various scenarios representing the possible “path” for the future development of the energy system. Two scenarios will be analysed more in details: • THE PASSIVE SCENARIO: according to which the Government measures in the frame of the
Power Policy Statement for the short-term period (till 2006) are considered not rigorously applied according to the action plan. The scenario indicates that the non- implementation of the measures creates great difficulties and obstacles for the energy sector in general and the electricity sector, in particular. The Scenario provides a quantitative assessment of the energy demands and the cost to fulfil them, indicating the necessity for a rigorous implementation of the Power Sector Policy Statement, in order to avoid the total collapse of the energy system.
• THE ACTIVE SCENARIO: The scenario implies the stability of the Albanian energy sector
development in general and electricity sector, in particular, by rigorously implementing the Power Sector Policy Statement till years 2006-07. The Active Scenario describes the additional measures (besides those provided by the Statement) for the period year till 2007 (especially for the other sectors not analyzed by the Statement) and for the long-term period 2007-2015. The Scenario provides a quantitative description of the measures needed to increase the energy efficiency and to introduce alternative sources in the energy system. The Scenario shows that these measures will transform the energy system into a supporting sector for the development of the Albanian economy and the increase of the general standard of life.
The calculation in the National Strategy of Energy are done by using a general model of energy has been adapted for the Albanian conditions, which is the LEAP software (Long Energy Alternative Planning), which ensure necessary analyses and give recommendations close to the Albanian reality. The soft illustrates the different scenarios till 2015 and the consequences of the energy policy and external effects related to them. 2.1 General macro-economic indicators of the energy sector development The relation between the country’s economic development and the energy demand is considered as a key issue and is represented as a closed cycle. This cycle includes many economic, social and technological analyses and in order to clearly define the correlations between them, many studies are needed in the economic and social development sectors. They are the basis for challenges and commitments of the Albanian energy sector in order to provide the optimization of the energy sources based on the lowest cost, to guarantee the energy supply level to meet the customers demand and establish conditions for a sustainable economic development. Based on the World Bank study “Albanian Power Sector Study”, three economic development scenarios were described for Albania, as shown in table II.1:
_________________________________________________________________________ Ministry of Industry and Energy, National Agency of Energy
11
SUMMARY - THE NATIONAL STRATEGY OF ENERGY AND PLAN OF ACTION _____________________________________________________________________________
Table 1.: GDP growth, 2002-2015 GDP Annual Average Growth (%)
Scenarios
2002 2003-2005 2006-2010 2011-2015 2002-2015 Low 5.00 3.82 3.17 2.33 3.00 Average 5.00 5.94 5.27 4.36 5.07 High 5.00 6.83 6.20 5.29 6.00
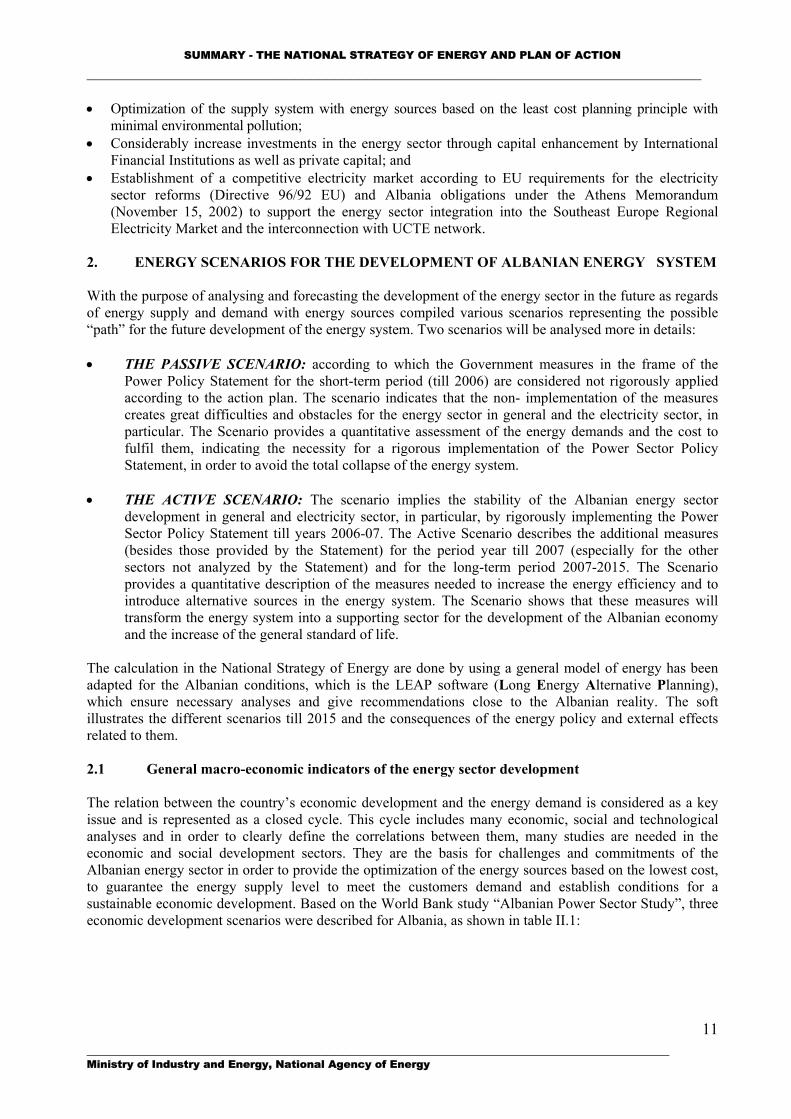
Taking into consideration the economic indicators, Albania is in conformity with the obligations settled by the IMF and the process of the Pact of Stability and Association with EU. Forecasts are based on the National Strategy for the Economic and Social Development either for the economy as a whole or for specific sectors based on short and long term possibilities of development. Passive Scenario and Active Scenario (as well as the others) are based on the same economic-growth rate of +5% per year in GDP. All the analyses were carried out based on GDP increase driving factor. Figure 7 shows GDP forecast for each sector till 2015, which is based on World Bank Study and Consultants with different national and international institutions. Key parameter, which will be use for energy forecast in agriculture, industry and services, is the contribution of GDP per each sub sector versus of total GDP.
0250500750100012501500175020002250250027503000325035003750400042504500475050005250
Service
Transport
Construction
Agriculture
Industry
70
80
90
100
110
120
130
140
150
160
170
180
190Nr. of households
Nr. of m 3 of public buildings
Nr. of passenger-kmNr. of passenger-km
Figure 7.: Forecast of contribution from each economic sector in GDP (US$ million)
Figure 8.: Trend of the main driving factors for calculation of energy demand for both scenarioS
Another important guideline for the preparation of the National Strategy of Energy is the growth rate of the population and the ratio between urban and rural population. The forecast of the population increase for future years is calculated at an average of 1.1% per year, while the tendency of the urban and rural population is based on the migration from rural to urban zones, accompanied with changes in the living standard and economic activities. The main parameter used as driving factor for calculation of the energy demand in the household sector is the number of dwellings for the basic year (1999) and the future forecast. Figure 8 shows a normalized indicator with 100% in 1999 and the analysis indicates that till 2015 the household stock will increase by 35%. In addition, figure 8 indicates the trend of two main driving factors for calculation of the energy demand in the transport sector. According to forecasts, the indicator ton-km is expected to experience an important increase with 85% compared to 1999, while the indicator passenger-km will increase 37% compared to 1999. A more detailed analysis about these parameters, as a base to calculate the energy demand for each sector, will be given in the respective analysis of the energy demand forecast. 2.2 Summary of energy forecasts according to passive and active scenario Based on the sectorial analysis mentioned above as well as realised by LEAP software, is carried out the total amount of energy demand by each scenarios and by each sector. As it is shown in figures 9 and 10, are _________________________________________________________________________ Ministry of Industry and Energy, National Agency of Energy
12
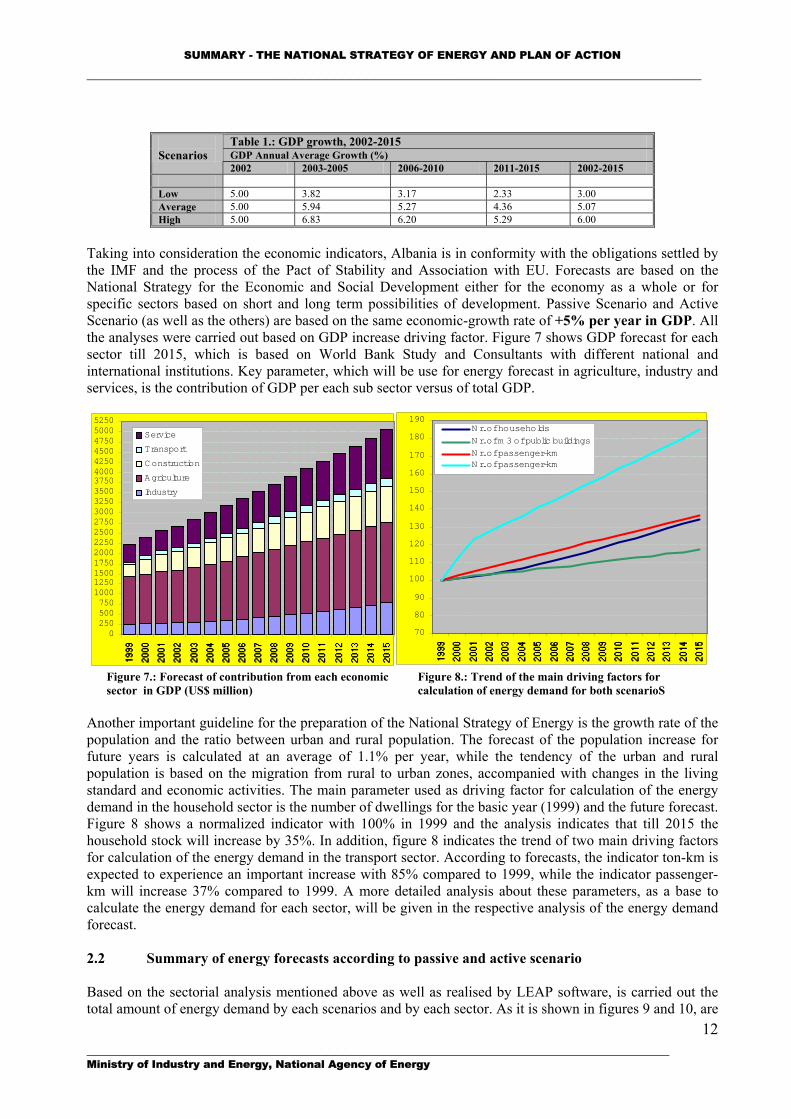
SUMMARY - THE NATIONAL STRATEGY OF ENERGY AND PLAN OF ACTION _____________________________________________________________________________ given the total energy demand forecast in general and electricity in particular by each sector and scenario. Regarding of the Passive Scenario; total energy demand goes up to 2800 ktoe in 2015. Concerning electricity demand respectively for Passive Scenario is 12500 GWh and for Active one 9500 GWh, in year 2015. The energy savings are expected to be around 815 ktoe or 22.48% of the total energy consumption by 2015 according to the Passive Scenario. The contribution in these savings by 2015 shall come from transport sector with 27.28%, industry with 24.58%, agriculture with 24.67%, service with 17.86% and residential sector with 7.4% of the total savings, respectively. Figure 12 shows electricity savings according to different energy efficiency measures and analysis show a level of electricity savings of 3056 GWh in 2015, with the main contribution from reduction of technical losses followed by savings in service, residential and industry. Scenarios are analysed up to 2015 due to the possible changes which could occur in Albanian economy being fully harmonised with World Bank Study in the power sector. In the future, by the updating of Energy Strategy will be done the energy demand forecast up to 2020.
0
200
400
600
800
1000
1200
1400
1600
1800
2000
2200
2400
2600
2800
3000
3200
3400
3600
Energy Savings
Pasive Scenario
Active Scenario
0500100015002000250030003500400045005000550060006500700075008000850090009500100001050011000115001200012500
Electricity Saving
Active Scenario (W orld Bank)
Pasive Scenario
Figure 9.: Forecast of energy demand and energy saving (ktoe)
Figure 10.: Forecast of electricity demand and electricity saving (GWh)
0
50
100
150
200
250
300
350
400
450
500
550
600
650
700
750
800
850
Energy Savings in AgricultureEnergy Savings in TransportEnergy Savings in IndustryEnergy Savings in ServiceEnergy Savings in Households
0150300450600750900105012001350150016501800195021002250240025502700285030003150
R eduction of TechnicalLossesA griculture
Industry
Service
H ouseholds
Figure 11.: Energy saving in each sector according to active scenario compared to passive scenario (ktoe)
Figure 12.: Electricity saving in each sector according to active scenario compared to passive scenario (GWh)
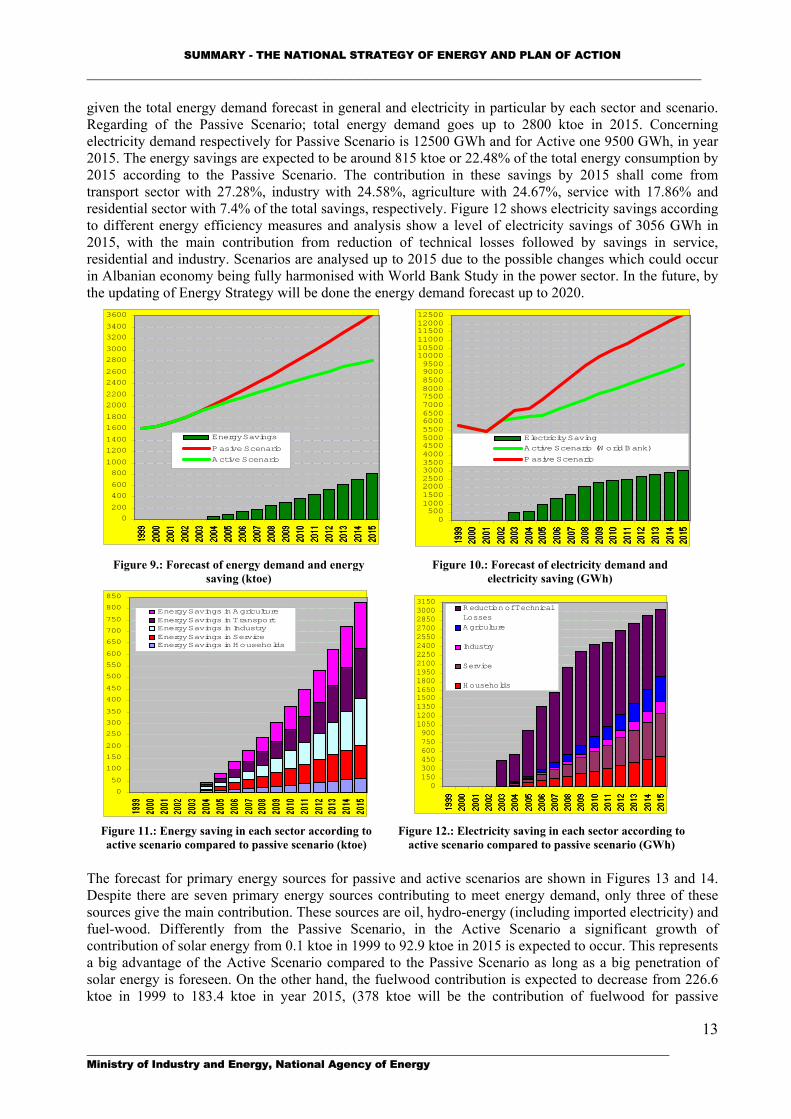
The forecast for primary energy sources for passive and active scenarios are shown in Figures 13 and 14. Despite there are seven primary energy sources contributing to meet energy demand, only three of these sources give the main contribution. These sources are oil, hydro-energy (including imported electricity) and fuel-wood. Differently from the Passive Scenario, in the Active Scenario a significant growth of contribution of solar energy from 0.1 ktoe in 1999 to 92.9 ktoe in 2015 is expected to occur. This represents a big advantage of the Active Scenario compared to the Passive Scenario as long as a big penetration of solar energy is foreseen. On the other hand, the fuelwood contribution is expected to decrease from 226.6 ktoe in 1999 to 183.4 ktoe in year 2015, (378 ktoe will be the contribution of fuelwood for passive
_________________________________________________________________________ Ministry of Industry and Energy, National Agency of Energy
13
SUMMARY - THE NATIONAL STRATEGY OF ENERGY AND PLAN OF ACTION _____________________________________________________________________________ scenario). This is another advantage concerning with forests and environmental protection. Also should be underlined that the import of energy sources is expected to be increased year by year in order to meet the energy demand. It is expected that by year 2015 the indigenous energy sources will meet 36.5%, while those coming from import will meet 63.5% of the total energy demand, which is lower than 70.94% according to the Passive Scenario. This represents another advantage of the Active Scenario compare to the Passive Scenario.
0200
400600800
100012001400
16001800
200022002400
260028003000
32003400
Crude Oil Hydro&Im ported ElectricityW ood Biom ass (unspecified)
Coal (lignite) Natural GasSolar
0250500750100012501500175020002250250027503000325035003750400042504500
Biom ass (unspecified) Coal (lignite)Natural Gas Crude OilHydro&Im ported Electricity SolarW ood
Figure 13.: Forecast of supply with primary energy sources according to the Passive Scenario (ktoe)
Figure 14.: Forecast of supply with primary energy sources according to the Active Scenario (ktoe)
Two other important indicators calculated by LEAP software are the self-sufficiency with oil and self-sufficiency with primary energy sources. This fact gives another advantage to the Active Scenario compare to the Passive one. This difference in the indicators of self- sufficiency with oil and primary energy sources between both scenarios shows that in case that the energy sector will follow the Active Scenario our country will have a lower trade deficit than if the Passive Scenario will be followed.
05001000150020002500300035004000450050005500600065007000750080008500900095001000010500
R eduction of C O2 equivalent
P assive
A ctive
02468101214161820222426283032343638404244
Reduction of SO2 equivalentPassive
Active
Figure 13.: CO2 emission for each scenario and their reduction based on LEAP (1000 ton)
Figure 14.: SO2 emissions for each fuel according to the Passive and Active Scenarios (1000 ton)
_________________________________________________________________________ Ministry of Industry and Energy, National Agency of Energy
14
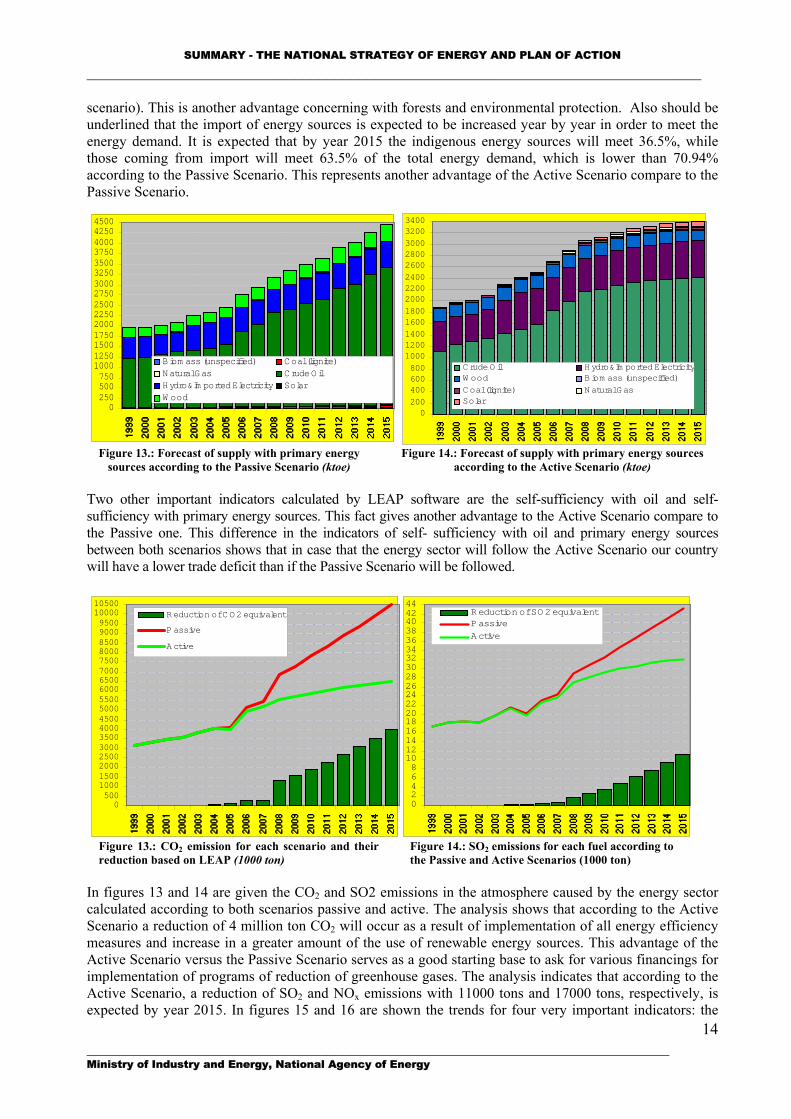
In figures 13 and 14 are given the CO2 and SO2 emissions in the atmosphere caused by the energy sector calculated according to both scenarios passive and active. The analysis shows that according to the Active Scenario a reduction of 4 million ton CO2 will occur as a result of implementation of all energy efficiency measures and increase in a greater amount of the use of renewable energy sources. This advantage of the Active Scenario versus the Passive Scenario serves as a good starting base to ask for various financings for implementation of programs of reduction of greenhouse gases. The analysis indicates that according to the Active Scenario, a reduction of SO2 and NOx emissions with 11000 tons and 17000 tons, respectively, is expected by year 2015. In figures 15 and 16 are shown the trends for four very important indicators: the
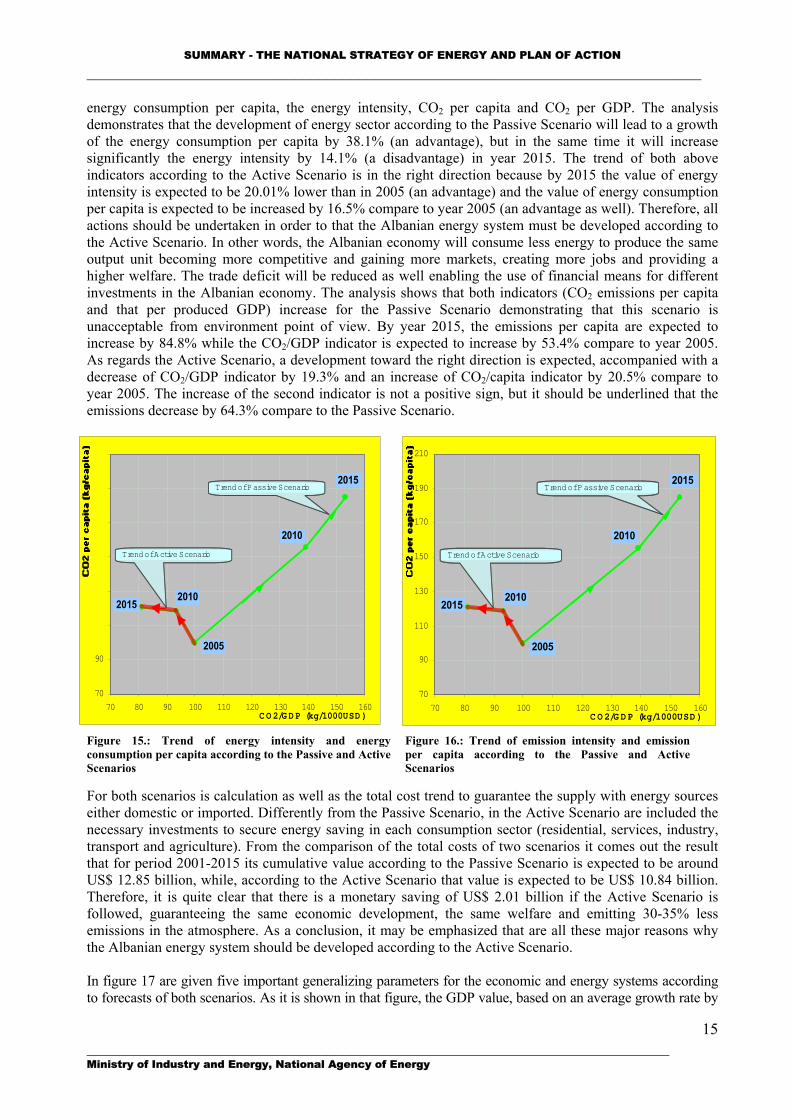
SUMMARY - THE NATIONAL STRATEGY OF ENERGY AND PLAN OF ACTION _____________________________________________________________________________ energy consumption per capita, the energy intensity, CO2 per capita and CO2 per GDP. The analysis demonstrates that the development of energy sector according to the Passive Scenario will lead to a growth of the energy consumption per capita by 38.1% (an advantage), but in the same time it will increase significantly the energy intensity by 14.1% (a disadvantage) in year 2015. The trend of both above indicators according to the Active Scenario is in the right direction because by 2015 the value of energy intensity is expected to be 20.01% lower than in 2005 (an advantage) and the value of energy consumption per capita is expected to be increased by 16.5% compare to year 2005 (an advantage as well). Therefore, all actions should be undertaken in order to that the Albanian energy system must be developed according to the Active Scenario. In other words, the Albanian economy will consume less energy to produce the same output unit becoming more competitive and gaining more markets, creating more jobs and providing a higher welfare. The trade deficit will be reduced as well enabling the use of financial means for different investments in the Albanian economy. The analysis shows that both indicators (CO2 emissions per capita and that per produced GDP) increase for the Passive Scenario demonstrating that this scenario is unacceptable from environment point of view. By year 2015, the emissions per capita are expected to increase by 84.8% while the CO2/GDP indicator is expected to increase by 53.4% compare to year 2005. As regards the Active Scenario, a development toward the right direction is expected, accompanied with a decrease of CO2/GDP indicator by 19.3% and an increase of CO2/capita indicator by 20.5% compare to year 2005. The increase of the second indicator is not a positive sign, but it should be underlined that the emissions decrease by 64.3% compare to the Passive Scenario. 210
190 170 150 130 110
70
90
70 80 90 100 110 120 130 140 150 160C O 2/G D P (kg/1000USD )
20152010
2005
2010
2015Trend of Passive Scenario
Trend of Active Scenario
70
90
110
130
150
170
190
210
70 80 90 100 110 120 130 140 150 160C O 2/G D P (kg/1000USD )
20152010
2005
2010
2015Trend of Passive Scenario
Trend of Active Scenario
Figure 15.: Trend of energy intensity and energy consumption per capita according to the Passive and Active Scenarios
Figure 16.: Trend of emission intensity and emission per capita according to the Passive and Active Scenarios
For both scenarios is calculation as well as the total cost trend to guarantee the supply with energy sources either domestic or imported. Differently from the Passive Scenario, in the Active Scenario are included the necessary investments to secure energy saving in each consumption sector (residential, services, industry, transport and agriculture). From the comparison of the total costs of two scenarios it comes out the result that for period 2001-2015 its cumulative value according to the Passive Scenario is expected to be around US$ 12.85 billion, while, according to the Active Scenario that value is expected to be US$ 10.84 billion. Therefore, it is quite clear that there is a monetary saving of US$ 2.01 billion if the Active Scenario is followed, guaranteeing the same economic development, the same welfare and emitting 30-35% less emissions in the atmosphere. As a conclusion, it may be emphasized that are all these major reasons why the Albanian energy system should be developed according to the Active Scenario. In figure 17 are given five important generalizing parameters for the economic and energy systems according to forecasts of both scenarios. As it is shown in that figure, the GDP value, based on an average growth rate by
_________________________________________________________________________ Ministry of Industry and Energy, National Agency of Energy
15
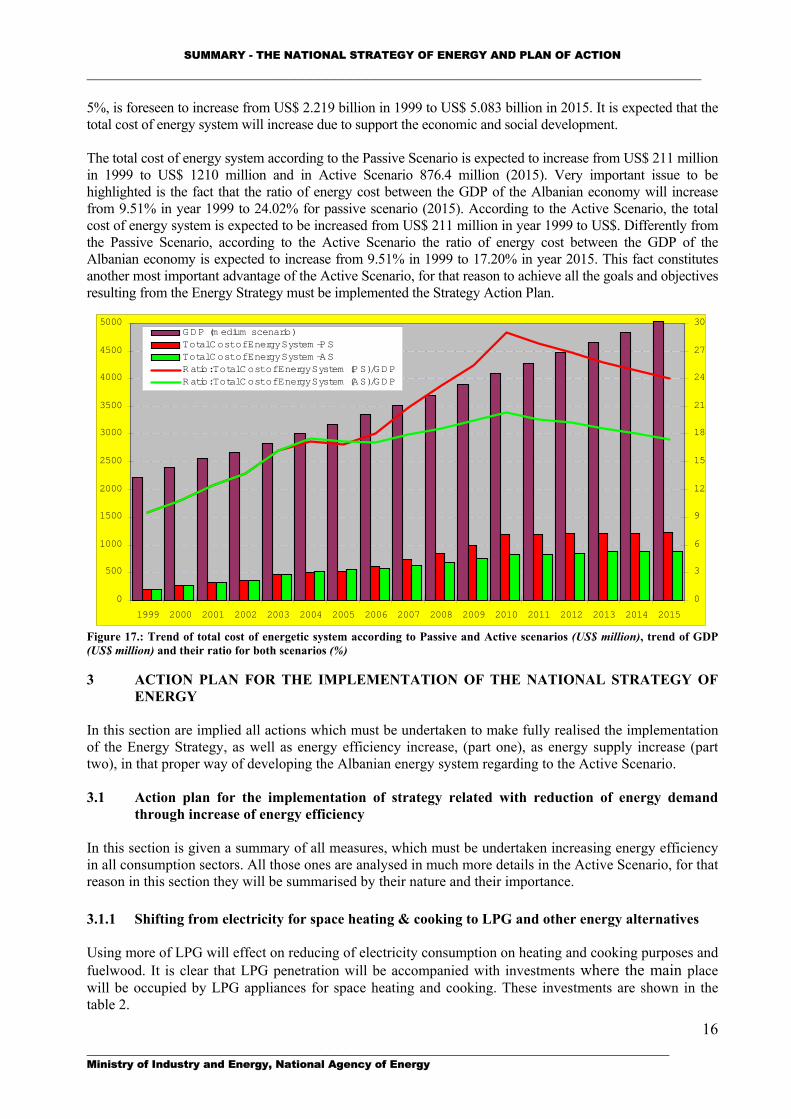
SUMMARY - THE NATIONAL STRATEGY OF ENERGY AND PLAN OF ACTION _____________________________________________________________________________ 5%, is foreseen to increase from US$ 2.219 billion in 1999 to US$ 5.083 billion in 2015. It is expected that the total cost of energy system will increase due to support the economic and social development. The total cost of energy system according to the Passive Scenario is expected to increase from US$ 211 million in 1999 to US$ 1210 million and in Active Scenario 876.4 million (2015). Very important issue to be highlighted is the fact that the ratio of energy cost between the GDP of the Albanian economy will increase from 9.51% in year 1999 to 24.02% for passive scenario (2015). According to the Active Scenario, the total cost of energy system is expected to be increased from US$ 211 million in year 1999 to US$. Differently from the Passive Scenario, according to the Active Scenario the ratio of energy cost between the GDP of the Albanian economy is expected to increase from 9.51% in 1999 to 17.20% in year 2015. This fact constitutes another most important advantage of the Active Scenario, for that reason to achieve all the goals and objectives resulting from the Energy Strategy must be implemented the Strategy Action Plan.
0
500
1000
1500
2000
2500
3000
3500
4000
4500
5000
1999 2000 2001 2002 2003 2004 2005 2006 2007 2008 2009 2010 2011 2012 2013 2014 2015
0
3
6
9
12
15
18
21
24
27
30GDP (m edium scenario)Total Cost of Energy System -PSTotal Cost of Energy System -ASRatio: Total Cost of Energy System (PS)/GDPRatio: Total Cost of Energy System (AS)/GDP
Figure 17.: Trend of total cost of energetic system according to Passive and Active scenarios (US$ million), trend of GDP (US$ million) and their ratio for both scenarios (%) 3 ACTION PLAN FOR THE IMPLEMENTATION OF THE NATIONAL STRATEGY OF
ENERGY In this section are implied all actions which must be undertaken to make fully realised the implementation of the Energy Strategy, as well as energy efficiency increase, (part one), as energy supply increase (part two), in that proper way of developing the Albanian energy system regarding to the Active Scenario. 3.1 Action plan for the implementation of strategy related with reduction of energy demand
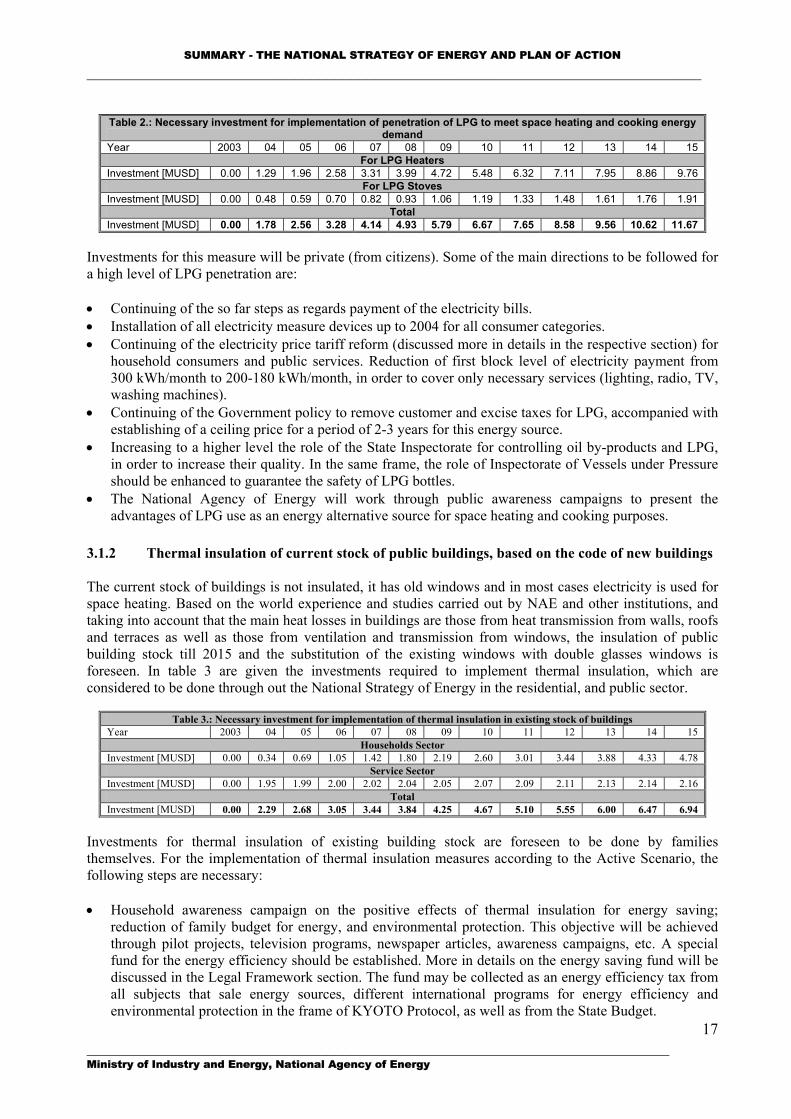
through increase of energy efficiency In this section is given a summary of all measures, which must be undertaken increasing energy efficiency in all consumption sectors. All those ones are analysed in much more details in the Active Scenario, for that reason in this section they will be summarised by their nature and their importance. 3.1.1 Shifting from electricity for space heating & cooking to LPG and other energy alternatives Using more of LPG will effect on reducing of electricity consumption on heating and cooking purposes and fuelwood. It is clear that LPG penetration will be accompanied with investments where the main place will be occupied by LPG appliances for space heating and cooking. These investments are shown in the table 2.
_________________________________________________________________________ Ministry of Industry and Energy, National Agency of Energy
16
SUMMARY - THE NATIONAL STRATEGY OF ENERGY AND PLAN OF ACTION _____________________________________________________________________________
Table 2.: Necessary investment for implementation of penetration of LPG to meet space heating and cooking energy demand
Year 2003 04 05 06 07 08 09 10 11 12 13 14 15 For LPG Heaters
Investment [MUSD] 0.00 1.29 1.96 2.58 3.31 3.99 4.72 5.48 6.32 7.11 7.95 8.86 9.76 For LPG Stoves
Investment [MUSD] 0.00 0.48 0.59 0.70 0.82 0.93 1.06 1.19 1.33 1.48 1.61 1.76 1.91 Total
Investment [MUSD] 0.00 1.78 2.56 3.28 4.14 4.93 5.79 6.67 7.65 8.58 9.56 10.62 11.67 Investments for this measure will be private (from citizens). Some of the main directions to be followed for a high level of LPG penetration are: • Continuing of the so far steps as regards payment of the electricity bills. • Installation of all electricity measure devices up to 2004 for all consumer categories. • Continuing of the electricity price tariff reform (discussed more in details in the respective section) for
household consumers and public services. Reduction of first block level of electricity payment from 300 kWh/month to 200-180 kWh/month, in order to cover only necessary services (lighting, radio, TV, washing machines).
• Continuing of the Government policy to remove customer and excise taxes for LPG, accompanied with establishing of a ceiling price for a period of 2-3 years for this energy source.
• Increasing to a higher level the role of the State Inspectorate for controlling oil by-products and LPG, in order to increase their quality. In the same frame, the role of Inspectorate of Vessels under Pressure should be enhanced to guarantee the safety of LPG bottles.
• The National Agency of Energy will work through public awareness campaigns to present the advantages of LPG use as an energy alternative source for space heating and cooking purposes.
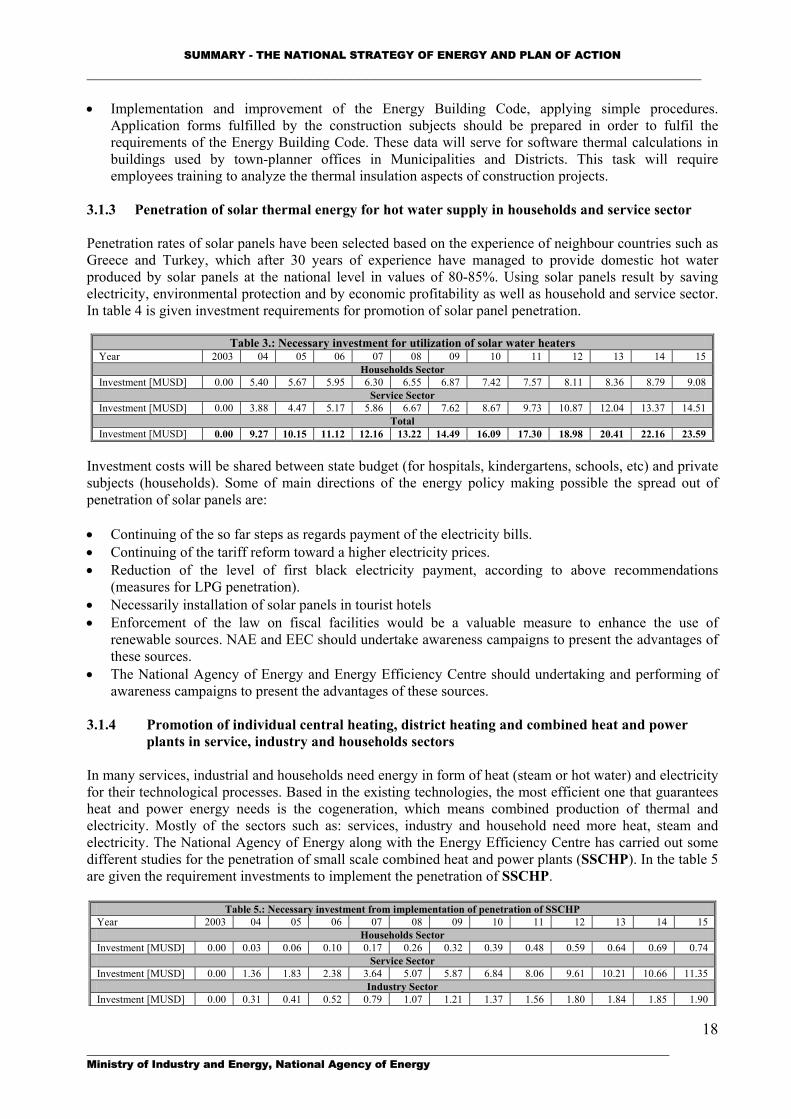
3.1.2 Thermal insulation of current stock of public buildings, based on the code of new buildings The current stock of buildings is not insulated, it has old windows and in most cases electricity is used for space heating. Based on the world experience and studies carried out by NAE and other institutions, and taking into account that the main heat losses in buildings are those from heat transmission from walls, roofs and terraces as well as those from ventilation and transmission from windows, the insulation of public building stock till 2015 and the substitution of the existing windows with double glasses windows is foreseen. In table 3 are given the investments required to implement thermal insulation, which are considered to be done through out the National Strategy of Energy in the residential, and public sector.
Table 3.: Necessary investment for implementation of thermal insulation in existing stock of buildings Year 2003 04 05 06 07 08 09 10 11 12 13 14 15
Households Sector Investment [MUSD] 0.00 0.34 0.69 1.05 1.42 1.80 2.19 2.60 3.01 3.44 3.88 4.33 4.78
Service Sector Investment [MUSD] 0.00 1.95 1.99 2.00 2.02 2.04 2.05 2.07 2.09 2.11 2.13 2.14 2.16
Total Investment [MUSD] 0.00 2.29 2.68 3.05 3.44 3.84 4.25 4.67 5.10 5.55 6.00 6.47 6.94
Investments for thermal insulation of existing building stock are foreseen to be done by families themselves. For the implementation of thermal insulation measures according to the Active Scenario, the following steps are necessary:
_________________________________________________________________________ Ministry of Industry and Energy, National Agency of Energy
17
• Household awareness campaign on the positive effects of thermal insulation for energy saving; reduction of family budget for energy, and environmental protection. This objective will be achieved through pilot projects, television programs, newspaper articles, awareness campaigns, etc. A special fund for the energy efficiency should be established. More in details on the energy saving fund will be discussed in the Legal Framework section. The fund may be collected as an energy efficiency tax from all subjects that sale energy sources, different international programs for energy efficiency and environmental protection in the frame of KYOTO Protocol, as well as from the State Budget.
SUMMARY - THE NATIONAL STRATEGY OF ENERGY AND PLAN OF ACTION _____________________________________________________________________________ • Implementation and improvement of the Energy Building Code, applying simple procedures.
Application forms fulfilled by the construction subjects should be prepared in order to fulfil the requirements of the Energy Building Code. These data will serve for software thermal calculations in buildings used by town-planner offices in Municipalities and Districts. This task will require employees training to analyze the thermal insulation aspects of construction projects.
3.1.3 Penetration of solar thermal energy for hot water supply in households and service sector Penetration rates of solar panels have been selected based on the experience of neighbour countries such as Greece and Turkey, which after 30 years of experience have managed to provide domestic hot water produced by solar panels at the national level in values of 80-85%. Using solar panels result by saving electricity, environmental protection and by economic profitability as well as household and service sector. In table 4 is given investment requirements for promotion of solar panel penetration.
Table 3.: Necessary investment for utilization of solar water heaters Year 2003 04 05 06 07 08 09 10 11 12 13 14 15
Households Sector Investment [MUSD] 0.00 5.40 5.67 5.95 6.30 6.55 6.87 7.42 7.57 8.11 8.36 8.79 9.08
Service Sector Investment [MUSD] 0.00 3.88 4.47 5.17 5.86 6.67 7.62 8.67 9.73 10.87 12.04 13.37 14.51
Total Investment [MUSD] 0.00 9.27 10.15 11.12 12.16 13.22 14.49 16.09 17.30 18.98 20.41 22.16 23.59
Investment costs will be shared between state budget (for hospitals, kindergartens, schools, etc) and private subjects (households). Some of main directions of the energy policy making possible the spread out of penetration of solar panels are: • Continuing of the so far steps as regards payment of the electricity bills. • Continuing of the tariff reform toward a higher electricity prices. • Reduction of the level of first black electricity payment, according to above recommendations
(measures for LPG penetration). • Necessarily installation of solar panels in tourist hotels • Enforcement of the law on fiscal facilities would be a valuable measure to enhance the use of
renewable sources. NAE and EEC should undertake awareness campaigns to present the advantages of these sources.
• The National Agency of Energy and Energy Efficiency Centre should undertaking and performing of awareness campaigns to present the advantages of these sources.
3.1.4 Promotion of individual central heating, district heating and combined heat and power
plants in service, industry and households sectors In many services, industrial and households need energy in form of heat (steam or hot water) and electricity for their technological processes. Based in the existing technologies, the most efficient one that guarantees heat and power energy needs is the cogeneration, which means combined production of thermal and electricity. Mostly of the sectors such as: services, industry and household need more heat, steam and electricity. The National Agency of Energy along with the Energy Efficiency Centre has carried out some different studies for the penetration of small scale combined heat and power plants (SSCHP). In the table 5 are given the requirement investments to implement the penetration of SSCHP.
Table 5.: Necessary investment from implementation of penetration of SSCHP Year 2003 04 05 06 07 08 09 10 11 12 13 14 15
Households Sector Investment [MUSD] 0.00 0.03 0.06 0.10 0.17 0.26 0.32 0.39 0.48 0.59 0.64 0.69 0.74
Service Sector Investment [MUSD] 0.00 1.36 1.83 2.38 3.64 5.07 5.87 6.84 8.06 9.61 10.21 10.66 11.35
Industry Sector Investment [MUSD] 0.00 0.31 0.41 0.52 0.79 1.07 1.21 1.37 1.56 1.80 1.84 1.85 1.90
_________________________________________________________________________ Ministry of Industry and Energy, National Agency of Energy
18
SUMMARY - THE NATIONAL STRATEGY OF ENERGY AND PLAN OF ACTION _____________________________________________________________________________
Total Investment [MUSD] 0.00 1.70 2.30 3.00 4.60 6.40 7.40 8.60 10.10 12.00 12.70 13.20 14.00
Investment costs will be shared between state budget and private subjects (households). Some of main directions of the energy policy making possible the spread out of penetration of SSCHP plants are: • Procedures prepared by MIE, NAE and ERE for the implementation of the New Electricity Law in
such away that the sufficient electricity fuel produced by SSCHP must be absorbed from electric distribution company grid (an obligation to them).
• Encouragement (promoting) of SSCHP installation supported by comfortable fiscals measures followed by proper law for all 5 MW plants. NAE and Energy Efficiency Centre must organise awareness campaigns in the industry and service sectors to promote this kind of alleviates.
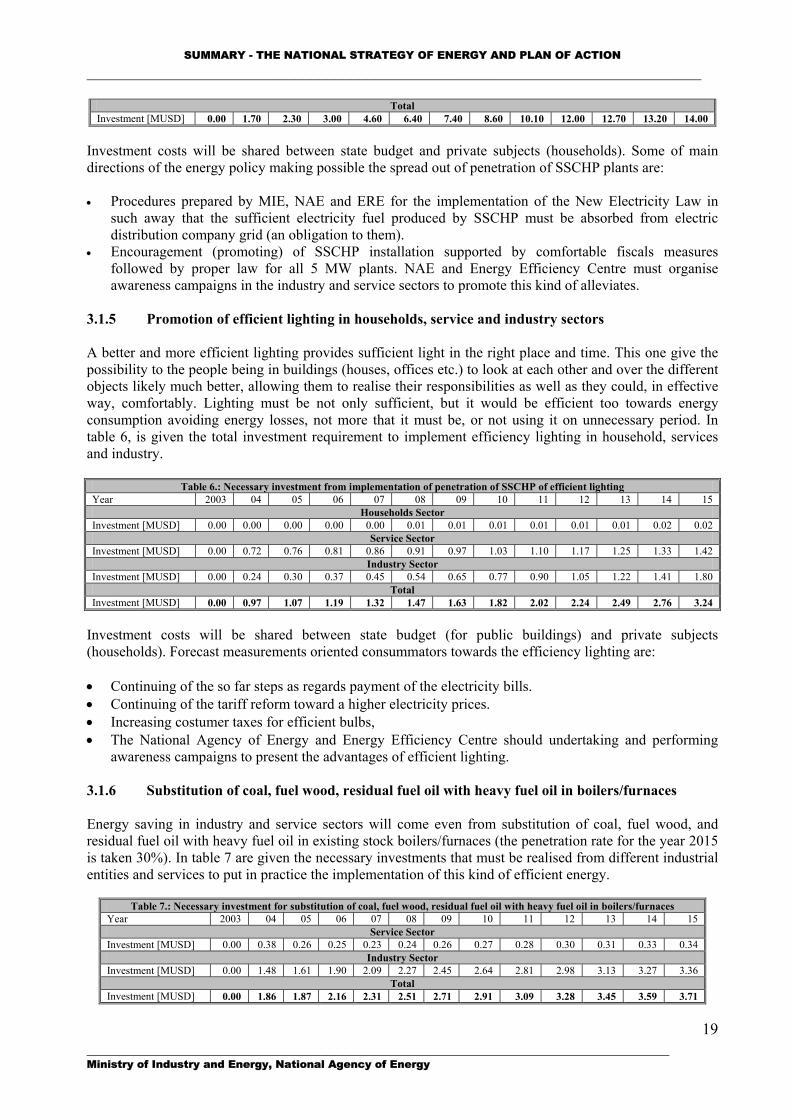
3.1.5 Promotion of efficient lighting in households, service and industry sectors A better and more efficient lighting provides sufficient light in the right place and time. This one give the possibility to the people being in buildings (houses, offices etc.) to look at each other and over the different objects likely much better, allowing them to realise their responsibilities as well as they could, in effective way, comfortably. Lighting must be not only sufficient, but it would be efficient too towards energy consumption avoiding energy losses, not more that it must be, or not using it on unnecessary period. In table 6, is given the total investment requirement to implement efficiency lighting in household, services and industry.
Table 6.: Necessary investment from implementation of penetration of SSCHP of efficient lighting
Year 2003 04 05 06 07 08 09 10 11 12 13 14 15 Households Sector
Investment [MUSD] 0.00 0.00 0.00 0.00 0.00 0.01 0.01 0.01 0.01 0.01 0.01 0.02 0.02 Service Sector
Investment [MUSD] 0.00 0.72 0.76 0.81 0.86 0.91 0.97 1.03 1.10 1.17 1.25 1.33 1.42 Industry Sector
Investment [MUSD] 0.00 0.24 0.30 0.37 0.45 0.54 0.65 0.77 0.90 1.05 1.22 1.41 1.80 Total
Investment [MUSD] 0.00 0.97 1.07 1.19 1.32 1.47 1.63 1.82 2.02 2.24 2.49 2.76 3.24 Investment costs will be shared between state budget (for public buildings) and private subjects (households). Forecast measurements oriented consummators towards the efficiency lighting are: • Continuing of the so far steps as regards payment of the electricity bills. • Continuing of the tariff reform toward a higher electricity prices. • Increasing costumer taxes for efficient bulbs, • The National Agency of Energy and Energy Efficiency Centre should undertaking and performing
awareness campaigns to present the advantages of efficient lighting.
3.1.6 Substitution of coal, fuel wood, residual fuel oil with heavy fuel oil in boilers/furnaces Energy saving in industry and service sectors will come even from substitution of coal, fuel wood, and residual fuel oil with heavy fuel oil in existing stock boilers/furnaces (the penetration rate for the year 2015 is taken 30%). In table 7 are given the necessary investments that must be realised from different industrial entities and services to put in practice the implementation of this kind of efficient energy.
Table 7.: Necessary investment for substitution of coal, fuel wood, residual fuel oil with heavy fuel oil in boilers/furnaces Year 2003 04 05 06 07 08 09 10 11 12 13 14 15
Service Sector Investment [MUSD] 0.00 0.38 0.26 0.25 0.23 0.24 0.26 0.27 0.28 0.30 0.31 0.33 0.34
Industry Sector Investment [MUSD] 0.00 1.48 1.61 1.90 2.09 2.27 2.45 2.64 2.81 2.98 3.13 3.27 3.36
Total Investment [MUSD] 0.00 1.86 1.87 2.16 2.31 2.51 2.71 2.91 3.09 3.28 3.45 3.59 3.71
_________________________________________________________________________ Ministry of Industry and Energy, National Agency of Energy
19
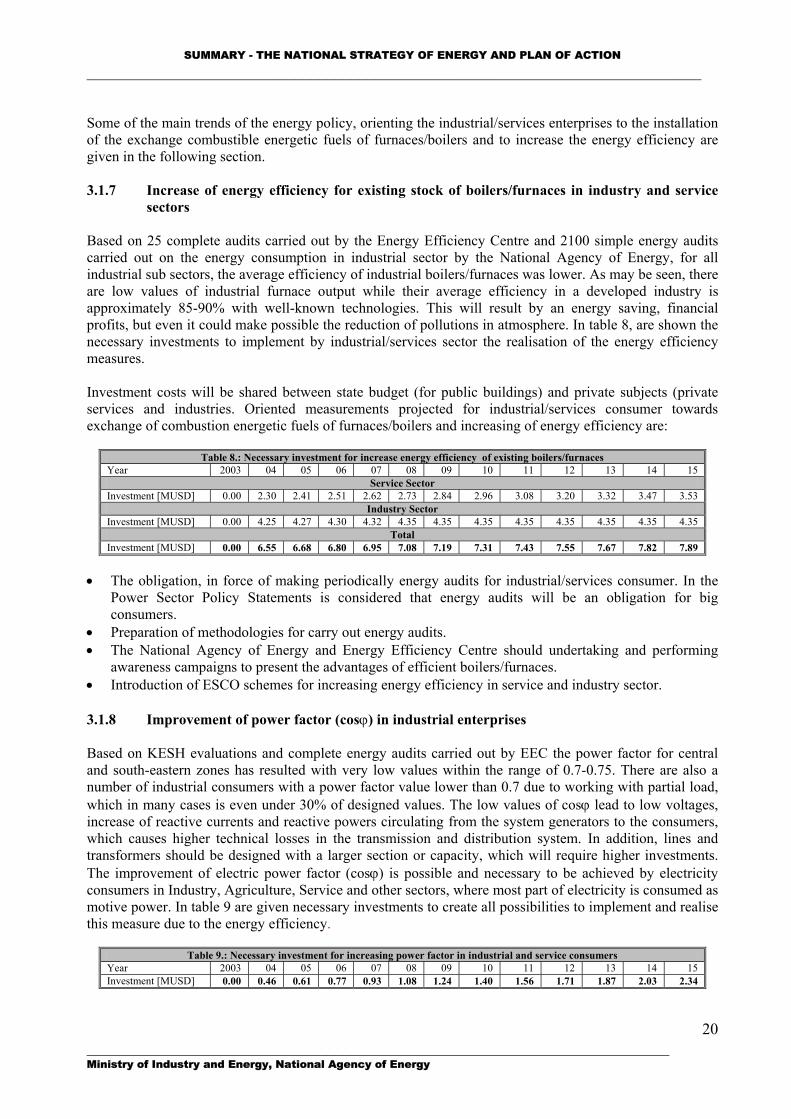
SUMMARY - THE NATIONAL STRATEGY OF ENERGY AND PLAN OF ACTION _____________________________________________________________________________ Some of the main trends of the energy policy, orienting the industrial/services enterprises to the installation of the exchange combustible energetic fuels of furnaces/boilers and to increase the energy efficiency are given in the following section. 3.1.7 Increase of energy efficiency for existing stock of boilers/furnaces in industry and service
sectors Based on 25 complete audits carried out by the Energy Efficiency Centre and 2100 simple energy audits carried out on the energy consumption in industrial sector by the National Agency of Energy, for all industrial sub sectors, the average efficiency of industrial boilers/furnaces was lower. As may be seen, there are low values of industrial furnace output while their average efficiency in a developed industry is approximately 85-90% with well-known technologies. This will result by an energy saving, financial profits, but even it could make possible the reduction of pollutions in atmosphere. In table 8, are shown the necessary investments to implement by industrial/services sector the realisation of the energy efficiency measures. Investment costs will be shared between state budget (for public buildings) and private subjects (private services and industries. Oriented measurements projected for industrial/services consumer towards exchange of combustion energetic fuels of furnaces/boilers and increasing of energy efficiency are:
Table 8.: Necessary investment for increase energy efficiency of existing boilers/furnaces Year 2003 04 05 06 07 08 09 10 11 12 13 14 15
Service Sector Investment [MUSD] 0.00 2.30 2.41 2.51 2.62 2.73 2.84 2.96 3.08 3.20 3.32 3.47 3.53
Industry Sector Investment [MUSD] 0.00 4.25 4.27 4.30 4.32 4.35 4.35 4.35 4.35 4.35 4.35 4.35 4.35
Total Investment [MUSD] 0.00 6.55 6.68 6.80 6.95 7.08 7.19 7.31 7.43 7.55 7.67 7.82 7.89
• The obligation, in force of making periodically energy audits for industrial/services consumer. In the
Power Sector Policy Statements is considered that energy audits will be an obligation for big consumers.
• Preparation of methodologies for carry out energy audits. • The National Agency of Energy and Energy Efficiency Centre should undertaking and performing
awareness campaigns to present the advantages of efficient boilers/furnaces. • Introduction of ESCO schemes for increasing energy efficiency in service and industry sector. 3.1.8 Improvement of power factor (cosϕ) in industrial enterprises Based on KESH evaluations and complete energy audits carried out by EEC the power factor for central and south-eastern zones has resulted with very low values within the range of 0.7-0.75. There are also a number of industrial consumers with a power factor value lower than 0.7 due to working with partial load, which in many cases is even under 30% of designed values. The low values of cosϕ lead to low voltages, increase of reactive currents and reactive powers circulating from the system generators to the consumers, which causes higher technical losses in the transmission and distribution system. In addition, lines and transformers should be designed with a larger section or capacity, which will require higher investments. The improvement of electric power factor (cosϕ) is possible and necessary to be achieved by electricity consumers in Industry, Agriculture, Service and other sectors, where most part of electricity is consumed as motive power. In table 9 are given necessary investments to create all possibilities to implement and realise this measure due to the energy efficiency.
Table 9.: Necessary investment for increasing power factor in industrial and service consumers Year 2003 04 05 06 07 08 09 10 11 12 13 14 15 Investment [MUSD] 0.00 0.46 0.61 0.77 0.93 1.08 1.24 1.40 1.56 1.71 1.87 2.03 2.34
_________________________________________________________________________ Ministry of Industry and Energy, National Agency of Energy
20
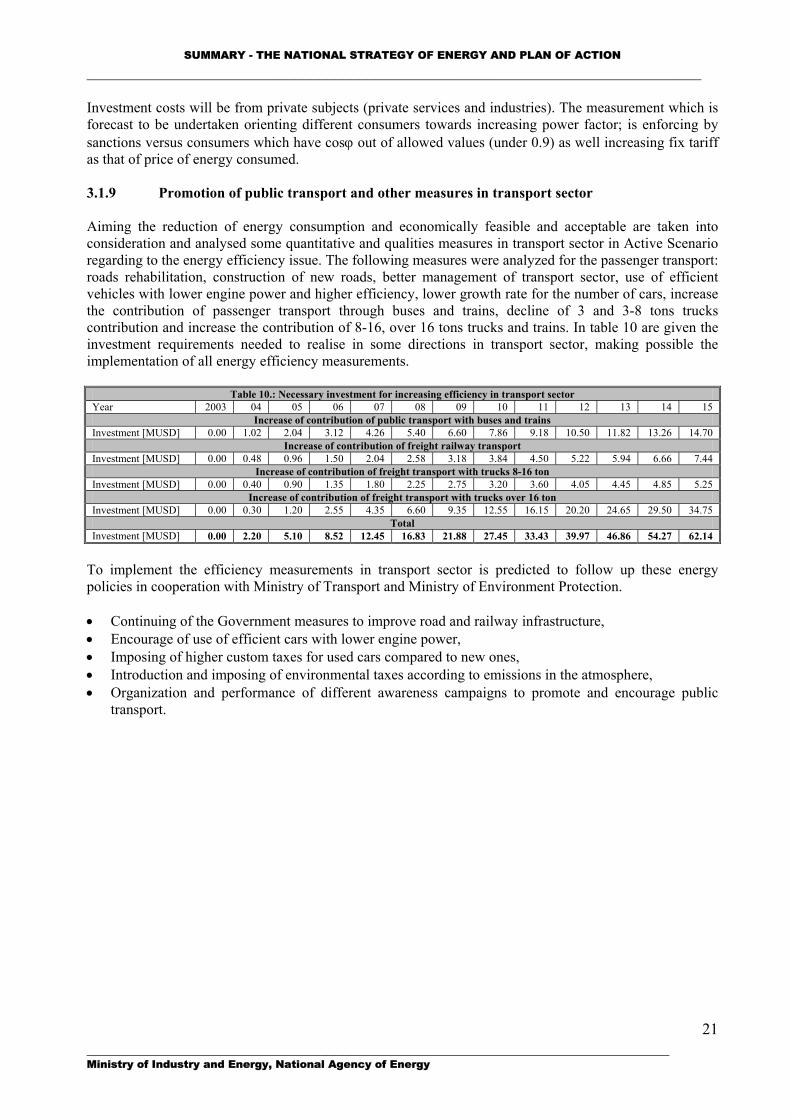
SUMMARY - THE NATIONAL STRATEGY OF ENERGY AND PLAN OF ACTION _____________________________________________________________________________ Investment costs will be from private subjects (private services and industries). The measurement which is forecast to be undertaken orienting different consumers towards increasing power factor; is enforcing by sanctions versus consumers which have cosϕ out of allowed values (under 0.9) as well increasing fix tariff as that of price of energy consumed. 3.1.9 Promotion of public transport and other measures in transport sector Aiming the reduction of energy consumption and economically feasible and acceptable are taken into consideration and analysed some quantitative and qualities measures in transport sector in Active Scenario regarding to the energy efficiency issue. The following measures were analyzed for the passenger transport: roads rehabilitation, construction of new roads, better management of transport sector, use of efficient vehicles with lower engine power and higher efficiency, lower growth rate for the number of cars, increase the contribution of passenger transport through buses and trains, decline of 3 and 3-8 tons trucks contribution and increase the contribution of 8-16, over 16 tons trucks and trains. In table 10 are given the investment requirements needed to realise in some directions in transport sector, making possible the implementation of all energy efficiency measurements.
Table 10.: Necessary investment for increasing efficiency in transport sector Year 2003 04 05 06 07 08 09 10 11 12 13 14 15
Increase of contribution of public transport with buses and trains Investment [MUSD] 0.00 1.02 2.04 3.12 4.26 5.40 6.60 7.86 9.18 10.50 11.82 13.26 14.70
Increase of contribution of freight railway transport Investment [MUSD] 0.00 0.48 0.96 1.50 2.04 2.58 3.18 3.84 4.50 5.22 5.94 6.66 7.44
Increase of contribution of freight transport with trucks 8-16 ton Investment [MUSD] 0.00 0.40 0.90 1.35 1.80 2.25 2.75 3.20 3.60 4.05 4.45 4.85 5.25
Increase of contribution of freight transport with trucks over 16 ton Investment [MUSD] 0.00 0.30 1.20 2.55 4.35 6.60 9.35 12.55 16.15 20.20 24.65 29.50 34.75
Total Investment [MUSD] 0.00 2.20 5.10 8.52 12.45 16.83 21.88 27.45 33.43 39.97 46.86 54.27 62.14
To implement the efficiency measurements in transport sector is predicted to follow up these energy policies in cooperation with Ministry of Transport and Ministry of Environment Protection. • Continuing of the Government measures to improve road and railway infrastructure, • Encourage of use of efficient cars with lower engine power, • Imposing of higher custom taxes for used cars compared to new ones, • Introduction and imposing of environmental taxes according to emissions in the atmosphere, • Organization and performance of different awareness campaigns to promote and encourage public
transport.
_________________________________________________________________________ Ministry of Industry and Energy, National Agency of Energy
21
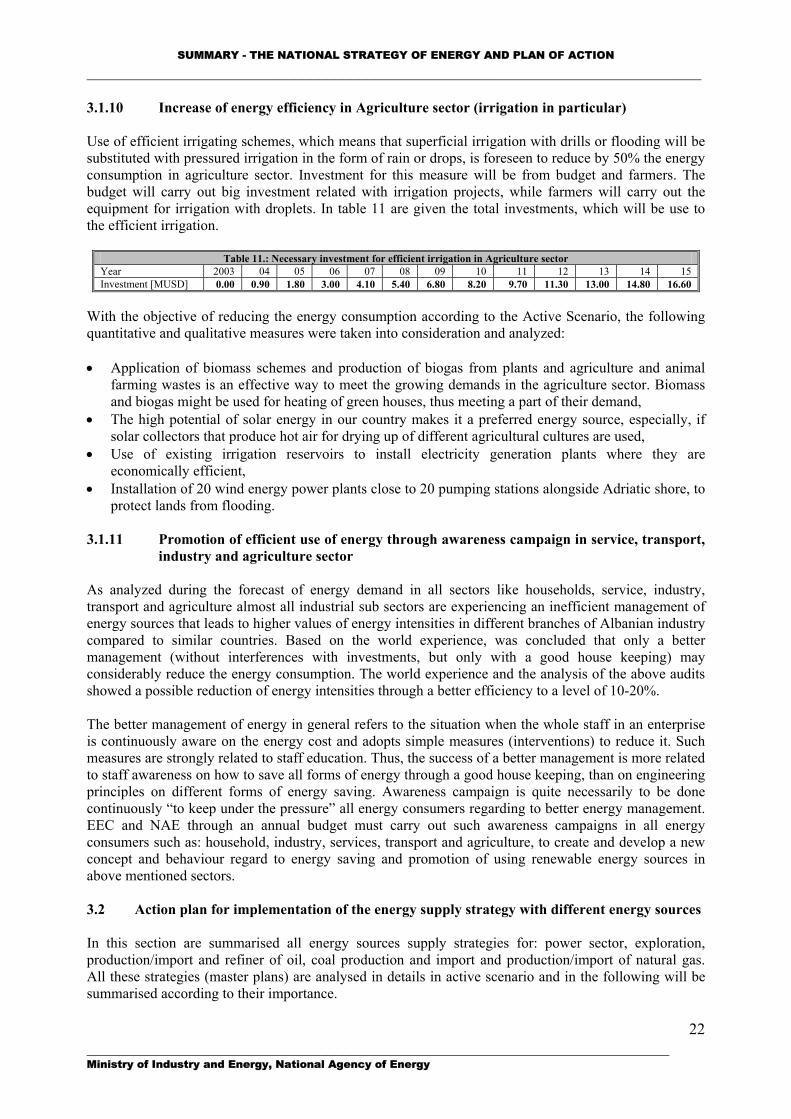
SUMMARY - THE NATIONAL STRATEGY OF ENERGY AND PLAN OF ACTION _____________________________________________________________________________ 3.1.10 Increase of energy efficiency in Agriculture sector (irrigation in particular) Use of efficient irrigating schemes, which means that superficial irrigation with drills or flooding will be substituted with pressured irrigation in the form of rain or drops, is foreseen to reduce by 50% the energy consumption in agriculture sector. Investment for this measure will be from budget and farmers. The budget will carry out big investment related with irrigation projects, while farmers will carry out the equipment for irrigation with droplets. In table 11 are given the total investments, which will be use to the efficient irrigation.
Table 11.: Necessary investment for efficient irrigation in Agriculture sector Year 2003 04 05 06 07 08 09 10 11 12 13 14 15 Investment [MUSD] 0.00 0.90 1.80 3.00 4.10 5.40 6.80 8.20 9.70 11.30 13.00 14.80 16.60
With the objective of reducing the energy consumption according to the Active Scenario, the following quantitative and qualitative measures were taken into consideration and analyzed: • Application of biomass schemes and production of biogas from plants and agriculture and animal
farming wastes is an effective way to meet the growing demands in the agriculture sector. Biomass and biogas might be used for heating of green houses, thus meeting a part of their demand,
• The high potential of solar energy in our country makes it a preferred energy source, especially, if solar collectors that produce hot air for drying up of different agricultural cultures are used,
• Use of existing irrigation reservoirs to install electricity generation plants where they are economically efficient,
• Installation of 20 wind energy power plants close to 20 pumping stations alongside Adriatic shore, to protect lands from flooding.
3.1.11 Promotion of efficient use of energy through awareness campaign in service, transport,
industry and agriculture sector As analyzed during the forecast of energy demand in all sectors like households, service, industry, transport and agriculture almost all industrial sub sectors are experiencing an inefficient management of energy sources that leads to higher values of energy intensities in different branches of Albanian industry compared to similar countries. Based on the world experience, was concluded that only a better management (without interferences with investments, but only with a good house keeping) may considerably reduce the energy consumption. The world experience and the analysis of the above audits showed a possible reduction of energy intensities through a better efficiency to a level of 10-20%. The better management of energy in general refers to the situation when the whole staff in an enterprise is continuously aware on the energy cost and adopts simple measures (interventions) to reduce it. Such measures are strongly related to staff education. Thus, the success of a better management is more related to staff awareness on how to save all forms of energy through a good house keeping, than on engineering principles on different forms of energy saving. Awareness campaign is quite necessarily to be done continuously “to keep under the pressure” all energy consumers regarding to better energy management. EEC and NAE through an annual budget must carry out such awareness campaigns in all energy consumers such as: household, industry, services, transport and agriculture, to create and develop a new concept and behaviour regard to energy saving and promotion of using renewable energy sources in above mentioned sectors. 3.2 Action plan for implementation of the energy supply strategy with different energy sources In this section are summarised all energy sources supply strategies for: power sector, exploration, production/import and refiner of oil, coal production and import and production/import of natural gas. All these strategies (master plans) are analysed in details in active scenario and in the following will be summarised according to their importance.
_________________________________________________________________________ Ministry of Industry and Energy, National Agency of Energy
22
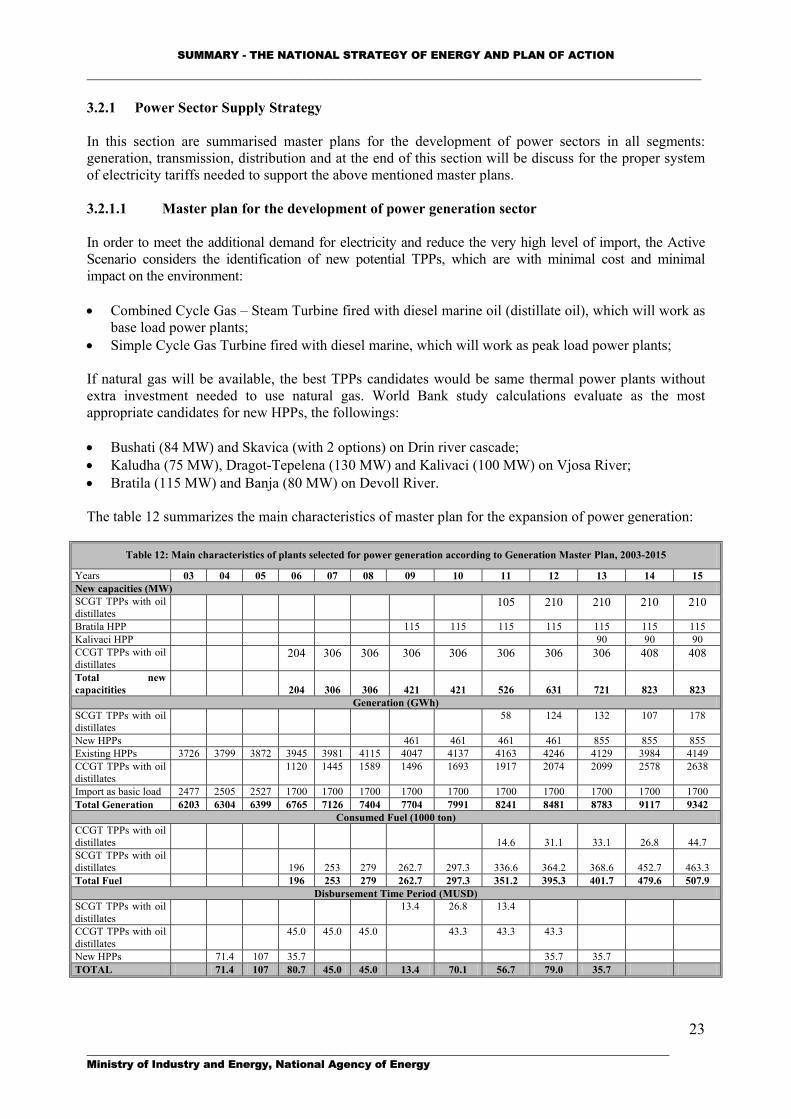
SUMMARY - THE NATIONAL STRATEGY OF ENERGY AND PLAN OF ACTION _____________________________________________________________________________ 3.2.1 Power Sector Supply Strategy In this section are summarised master plans for the development of power sectors in all segments: generation, transmission, distribution and at the end of this section will be discuss for the proper system of electricity tariffs needed to support the above mentioned master plans. 3.2.1.1 Master plan for the development of power generation sector In order to meet the additional demand for electricity and reduce the very high level of import, the Active Scenario considers the identification of new potential TPPs, which are with minimal cost and minimal impact on the environment: • Combined Cycle Gas – Steam Turbine fired with diesel marine oil (distillate oil), which will work as
base load power plants; • Simple Cycle Gas Turbine fired with diesel marine, which will work as peak load power plants; If natural gas will be available, the best TPPs candidates would be same thermal power plants without extra investment needed to use natural gas. World Bank study calculations evaluate as the most appropriate candidates for new HPPs, the followings: • Bushati (84 MW) and Skavica (with 2 options) on Drin river cascade; • Kaludha (75 MW), Dragot-Tepelena (130 MW) and Kalivaci (100 MW) on Vjosa River; • Bratila (115 MW) and Banja (80 MW) on Devoll River. The table 12 summarizes the main characteristics of master plan for the expansion of power generation:
Table 12: Main characteristics of plants selected for power generation according to Generation Master Plan, 2003-2015
Years 03 04 05 06 07 08 09 10 11 12 13 14 15 New capacities (MW) SCGT TPPs with oil distillates
105 210 210 210 210
Bratila HPP 115 115 115 115 115 115 115 Kalivaci HPP 90 90 90 CCGT TPPs with oil distillates
204 306 306 306 306 306 306 306 408 408
Total new capacitities 204 306 306 421 421 526 631 721 823 823
Generation (GWh) SCGT TPPs with oil distillates
58 124 132 107 178
New HPPs 461 461 461 461 855 855 855 Existing HPPs 3726 3799 3872 3945 3981 4115 4047 4137 4163 4246 4129 3984 4149 CCGT TPPs with oil distillates
1120 1445 1589 1496 1693 1917 2074 2099 2578 2638
Import as basic load 2477 2505 2527 1700 1700 1700 1700 1700 1700 1700 1700 1700 1700 Total Generation 6203 6304 6399 6765 7126 7404 7704 7991 8241 8481 8783 9117 9342
Consumed Fuel (1000 ton) CCGT TPPs with oil distillates 14.6 31.1 33.1 26.8 44.7 SCGT TPPs with oil distillates 196 253 279 262.7 297.3 336.6 364.2 368.6 452.7 463.3 Total Fuel 196 253 279 262.7 297.3 351.2 395.3 401.7 479.6 507.9
Disbursement Time Period (MUSD) SCGT TPPs with oil distillates
13.4 26.8 13.4
CCGT TPPs with oil distillates
45.0 45.0 45.0 43.3 43.3 43.3
New HPPs 71.4 107 35.7 35.7 35.7 TOTAL 71.4 107 80.7 45.0 45.0 13.4 70.1 56.7 79.0 35.7
_________________________________________________________________________ Ministry of Industry and Energy, National Agency of Energy
23
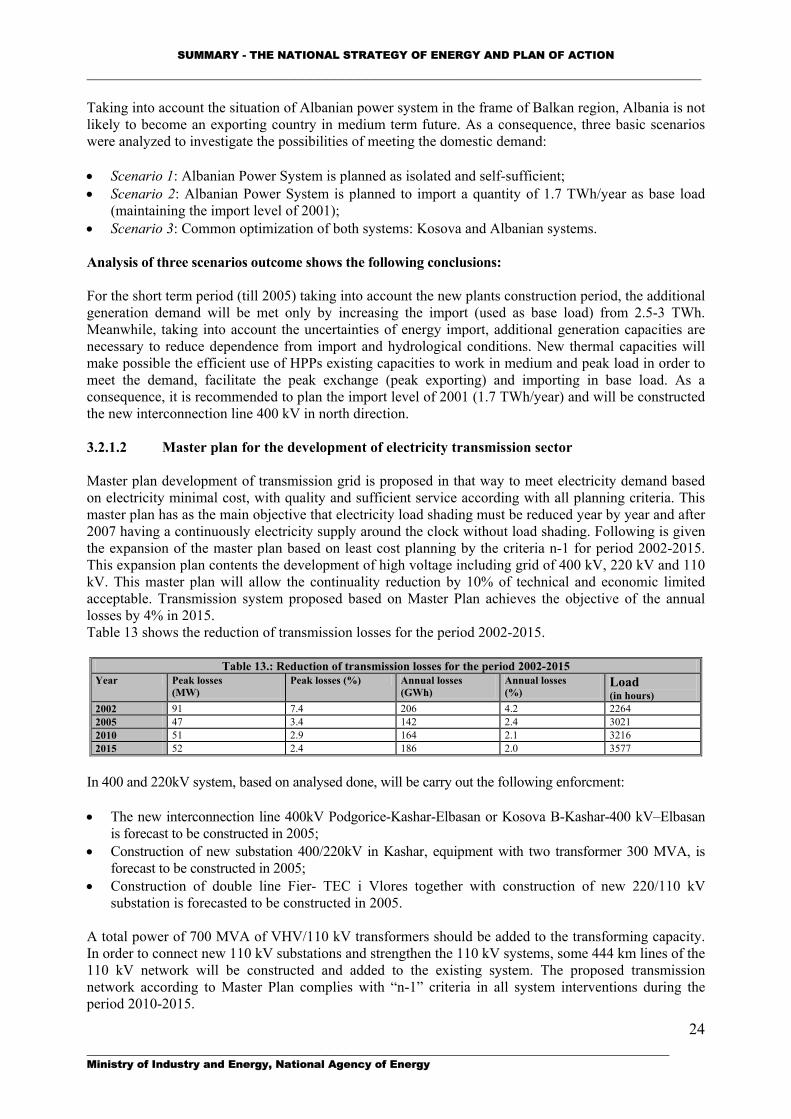
SUMMARY - THE NATIONAL STRATEGY OF ENERGY AND PLAN OF ACTION _____________________________________________________________________________ Taking into account the situation of Albanian power system in the frame of Balkan region, Albania is not likely to become an exporting country in medium term future. As a consequence, three basic scenarios were analyzed to investigate the possibilities of meeting the domestic demand: • Scenario 1: Albanian Power System is planned as isolated and self-sufficient; • Scenario 2: Albanian Power System is planned to import a quantity of 1.7 TWh/year as base load
(maintaining the import level of 2001); • Scenario 3: Common optimization of both systems: Kosova and Albanian systems. Analysis of three scenarios outcome shows the following conclusions: For the short term period (till 2005) taking into account the new plants construction period, the additional generation demand will be met only by increasing the import (used as base load) from 2.5-3 TWh. Meanwhile, taking into account the uncertainties of energy import, additional generation capacities are necessary to reduce dependence from import and hydrological conditions. New thermal capacities will make possible the efficient use of HPPs existing capacities to work in medium and peak load in order to meet the demand, facilitate the peak exchange (peak exporting) and importing in base load. As a consequence, it is recommended to plan the import level of 2001 (1.7 TWh/year) and will be constructed the new interconnection line 400 kV in north direction. 3.2.1.2 Master plan for the development of electricity transmission sector Master plan development of transmission grid is proposed in that way to meet electricity demand based on electricity minimal cost, with quality and sufficient service according with all planning criteria. This master plan has as the main objective that electricity load shading must be reduced year by year and after 2007 having a continuously electricity supply around the clock without load shading. Following is given the expansion of the master plan based on least cost planning by the criteria n-1 for period 2002-2015. This expansion plan contents the development of high voltage including grid of 400 kV, 220 kV and 110 kV. This master plan will allow the continuality reduction by 10% of technical and economic limited acceptable. Transmission system proposed based on Master Plan achieves the objective of the annual losses by 4% in 2015. Table 13 shows the reduction of transmission losses for the period 2002-2015.
Table 13.: Reduction of transmission losses for the period 2002-2015 Year Peak losses
(MW) Peak losses (%) Annual losses
(GWh) Annual losses (%)
Load (in hours)
2002 91 7.4 206 4.2 2264 2005 47 3.4 142 2.4 3021 2010 51 2.9 164 2.1 3216 2015 52 2.4 186 2.0 3577
In 400 and 220kV system, based on analysed done, will be carry out the following enforcment: • The new interconnection line 400kV Podgorice-Kashar-Elbasan or Kosova B-Kashar-400 kV–Elbasan
is forecast to be constructed in 2005; • Construction of new substation 400/220kV in Kashar, equipment with two transformer 300 MVA, is
forecast to be constructed in 2005; • Construction of double line Fier- TEC i Vlores together with construction of new 220/110 kV
substation is forecasted to be constructed in 2005. A total power of 700 MVA of VHV/110 kV transformers should be added to the transforming capacity. In order to connect new 110 kV substations and strengthen the 110 kV systems, some 444 km lines of the 110 kV network will be constructed and added to the existing system. The proposed transmission network according to Master Plan complies with “n-1” criteria in all system interventions during the period 2010-2015.
_________________________________________________________________________ Ministry of Industry and Energy, National Agency of Energy
24
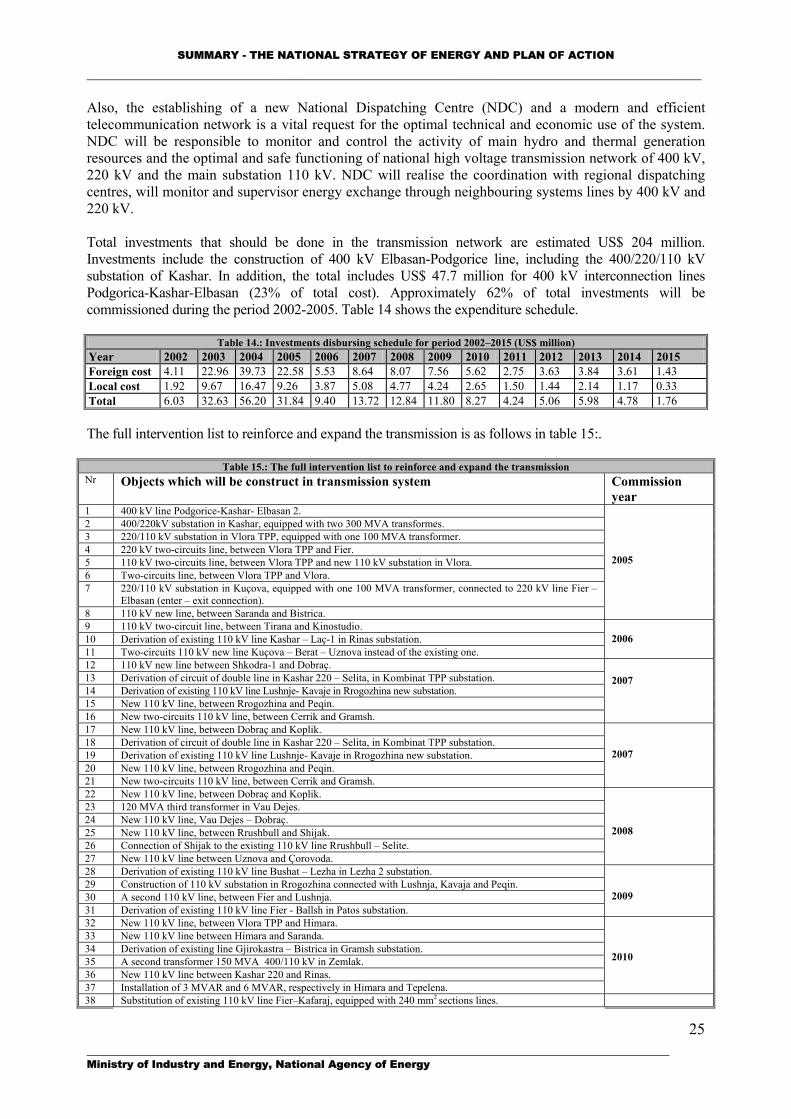
SUMMARY - THE NATIONAL STRATEGY OF ENERGY AND PLAN OF ACTION _____________________________________________________________________________ Also, the establishing of a new National Dispatching Centre (NDC) and a modern and efficient telecommunication network is a vital request for the optimal technical and economic use of the system. NDC will be responsible to monitor and control the activity of main hydro and thermal generation resources and the optimal and safe functioning of national high voltage transmission network of 400 kV, 220 kV and the main substation 110 kV. NDC will realise the coordination with regional dispatching centres, will monitor and supervisor energy exchange through neighbouring systems lines by 400 kV and 220 kV. Total investments that should be done in the transmission network are estimated US$ 204 million. Investments include the construction of 400 kV Elbasan-Podgorice line, including the 400/220/110 kV substation of Kashar. In addition, the total includes US$ 47.7 million for 400 kV interconnection lines Podgorica-Kashar-Elbasan (23% of total cost). Approximately 62% of total investments will be commissioned during the period 2002-2005. Table 14 shows the expenditure schedule.
Table 14.: Investments disbursing schedule for period 2002–2015 (US$ million) Year 2002 2003 2004 2005 2006 2007 2008 2009 2010 2011 2012 2013 2014 2015 Foreign cost 4.11 22.96 39.73 22.58 5.53 8.64 8.07 7.56 5.62 2.75 3.63 3.84 3.61 1.43 Local cost 1.92 9.67 16.47 9.26 3.87 5.08 4.77 4.24 2.65 1.50 1.44 2.14 1.17 0.33 Total 6.03 32.63 56.20 31.84 9.40 13.72 12.84 11.80 8.27 4.24 5.06 5.98 4.78 1.76 The full intervention list to reinforce and expand the transmission is as follows in table 15:.
Table 15.: The full intervention list to reinforce and expand the transmission Nr Objects which will be construct in transmission system Commission
year 1 400 kV line Podgorice-Kashar- Elbasan 2. 2 400/220kV substation in Kashar, equipped with two 300 MVA transformes. 3 220/110 kV substation in Vlora TPP, equipped with one 100 MVA transformer. 4 220 kV two-circuits line, between Vlora TPP and Fier. 5 110 kV two-circuits line, between Vlora TPP and new 110 kV substation in Vlora. 6 Two-circuits line, between Vlora TPP and Vlora. 7 220/110 kV substation in Kuçova, equipped with one 100 MVA transformer, connected to 220 kV line Fier –
Elbasan (enter – exit connection). 8 110 kV new line, between Saranda and Bistrica.
2005
9 110 kV two-circuit line, between Tirana and Kinostudio. 10 Derivation of existing 110 kV line Kashar – Laç-1 in Rinas substation. 11 Two-circuits 110 kV new line Kuçova – Berat – Uznova instead of the existing one.
2006
12 110 kV new line between Shkodra-1 and Dobraç. 13 Derivation of circuit of double line in Kashar 220 – Selita, in Kombinat TPP substation. 14 Derivation of existing 110 kV line Lushnje- Kavaje in Rrogozhina new substation. 15 New 110 kV line, between Rrogozhina and Peqin. 16 New two-circuits 110 kV line, between Cerrik and Gramsh.
2007
17 New 110 kV line, between Dobraç and Koplik. 18 Derivation of circuit of double line in Kashar 220 – Selita, in Kombinat TPP substation. 19 Derivation of existing 110 kV line Lushnje- Kavaje in Rrogozhina new substation. 20 New 110 kV line, between Rrogozhina and Peqin. 21 New two-circuits 110 kV line, between Cerrik and Gramsh.
2007
22 New 110 kV line, between Dobraç and Koplik. 23 120 MVA third transformer in Vau Dejes. 24 New 110 kV line, Vau Dejes – Dobraç. 25 New 110 kV line, between Rrushbull and Shijak. 26 Connection of Shijak to the existing 110 kV line Rrushbull – Selite. 27 New 110 kV line between Uznova and Çorovoda.
2008
28 Derivation of existing 110 kV line Bushat – Lezha in Lezha 2 substation. 29 Construction of 110 kV substation in Rrogozhina connected with Lushnja, Kavaja and Peqin. 30 A second 110 kV line, between Fier and Lushnja. 31 Derivation of existing 110 kV line Fier - Ballsh in Patos substation.
2009
32 New 110 kV line, between Vlora TPP and Himara. 33 New 110 kV line between Himara and Saranda. 34 Derivation of existing line Gjirokastra – Bistrica in Gramsh substation. 35 A second transformer 150 MVA 400/110 kV in Zemlak. 36 New 110 kV line between Kashar 220 and Rinas. 37 Installation of 3 MVAR and 6 MVAR, respectively in Himara and Tepelena.
2010
38 Substitution of existing 110 kV line Fier–Kafaraj, equipped with 240 mm2 sections lines.
_________________________________________________________________________ Ministry of Industry and Energy, National Agency of Energy
25
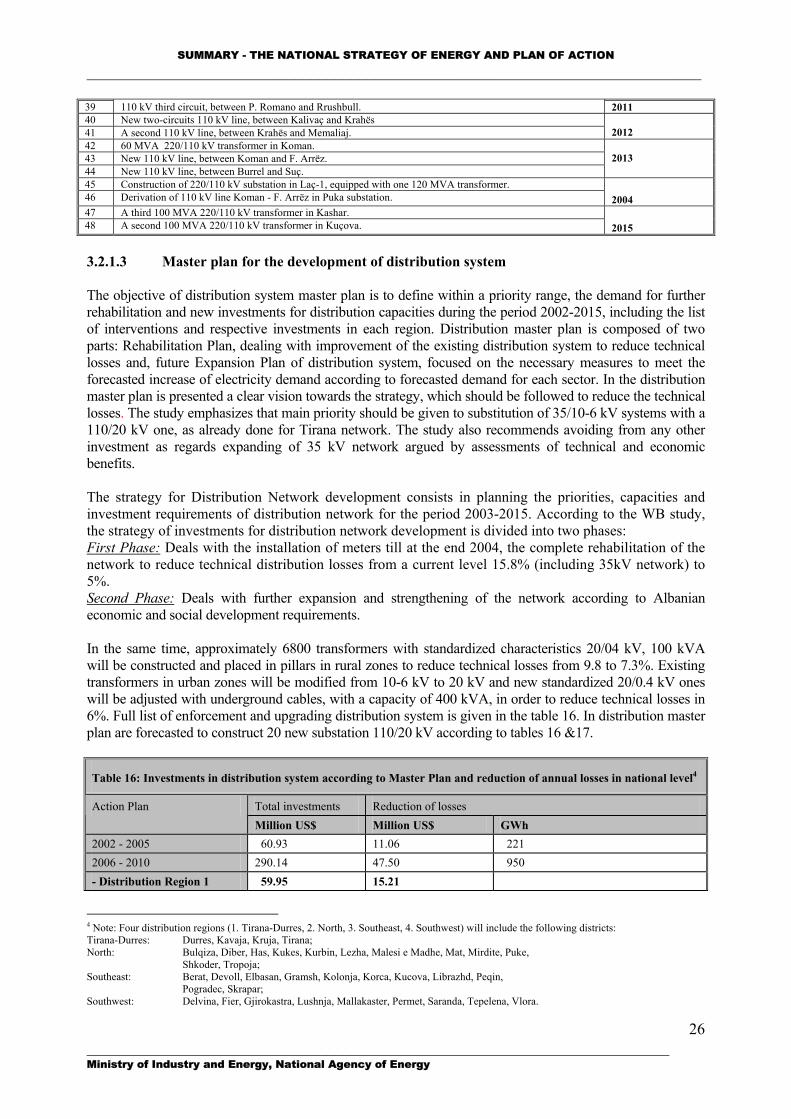
SUMMARY - THE NATIONAL STRATEGY OF ENERGY AND PLAN OF ACTION _____________________________________________________________________________ 39 110 kV third circuit, between P. Romano and Rrushbull. 2011 40 New two-circuits 110 kV line, between Kalivaç and Krahës 41 A second 110 kV line, between Krahës and Memaliaj.
2012
42 60 MVA 220/110 kV transformer in Koman. 43 New 110 kV line, between Koman and F. Arrëz. 44 New 110 kV line, between Burrel and Suç.
2013
45 Construction of 220/110 kV substation in Laç-1, equipped with one 120 MVA transformer. 46 Derivation of 110 kV line Koman - F. Arrëz in Puka substation.
2004
47 A third 100 MVA 220/110 kV transformer in Kashar. 48 A second 100 MVA 220/110 kV transformer in Kuçova.
2015
3.2.1.3 Master plan for the development of distribution system The objective of distribution system master plan is to define within a priority range, the demand for further rehabilitation and new investments for distribution capacities during the period 2002-2015, including the list of interventions and respective investments in each region. Distribution master plan is composed of two parts: Rehabilitation Plan, dealing with improvement of the existing distribution system to reduce technical losses and, future Expansion Plan of distribution system, focused on the necessary measures to meet the forecasted increase of electricity demand according to forecasted demand for each sector. In the distribution master plan is presented a clear vision towards the strategy, which should be followed to reduce the technical losses. The study emphasizes that main priority should be given to substitution of 35/10-6 kV systems with a 110/20 kV one, as already done for Tirana network. The study also recommends avoiding from any other investment as regards expanding of 35 kV network argued by assessments of technical and economic benefits. The strategy for Distribution Network development consists in planning the priorities, capacities and investment requirements of distribution network for the period 2003-2015. According to the WB study, the strategy of investments for distribution network development is divided into two phases: First Phase: Deals with the installation of meters till at the end 2004, the complete rehabilitation of the network to reduce technical distribution losses from a current level 15.8% (including 35kV network) to 5%. Second Phase: Deals with further expansion and strengthening of the network according to Albanian economic and social development requirements. In the same time, approximately 6800 transformers with standardized characteristics 20/04 kV, 100 kVA will be constructed and placed in pillars in rural zones to reduce technical losses from 9.8 to 7.3%. Existing transformers in urban zones will be modified from 10-6 kV to 20 kV and new standardized 20/0.4 kV ones will be adjusted with underground cables, with a capacity of 400 kVA, in order to reduce technical losses in 6%. Full list of enforcement and upgrading distribution system is given in the table 16. In distribution master plan are forecasted to construct 20 new substation 110/20 kV according to tables 16 &17.
Table 16: Investments in distribution system according to Master Plan and reduction of annual losses in national level4
Total investments Reduction of losses Action Plan Million US$ Million US$ GWh
2002 - 2005 60.93 11.06 221 2006 - 2010 290.14 47.50 950 - Distribution Region 1 59.95 15.21
4 Note: Four distribution regions (1. Tirana-Durres, 2. North, 3. Southeast, 4. Southwest) will include the following districts: Tirana-Durres: Durres, Kavaja, Kruja, Tirana; North: Bulqiza, Diber, Has, Kukes, Kurbin, Lezha, Malesi e Madhe, Mat, Mirdite, Puke,
Shkoder, Tropoja; Southeast: Berat, Devoll, Elbasan, Gramsh, Kolonja, Korca, Kucova, Librazhd, Peqin,
Pogradec, Skrapar; Southwest: Delvina, Fier, Gjirokastra, Lushnja, Mallakaster, Permet, Saranda, Tepelena, Vlora.
_________________________________________________________________________ Ministry of Industry and Energy, National Agency of Energy
26
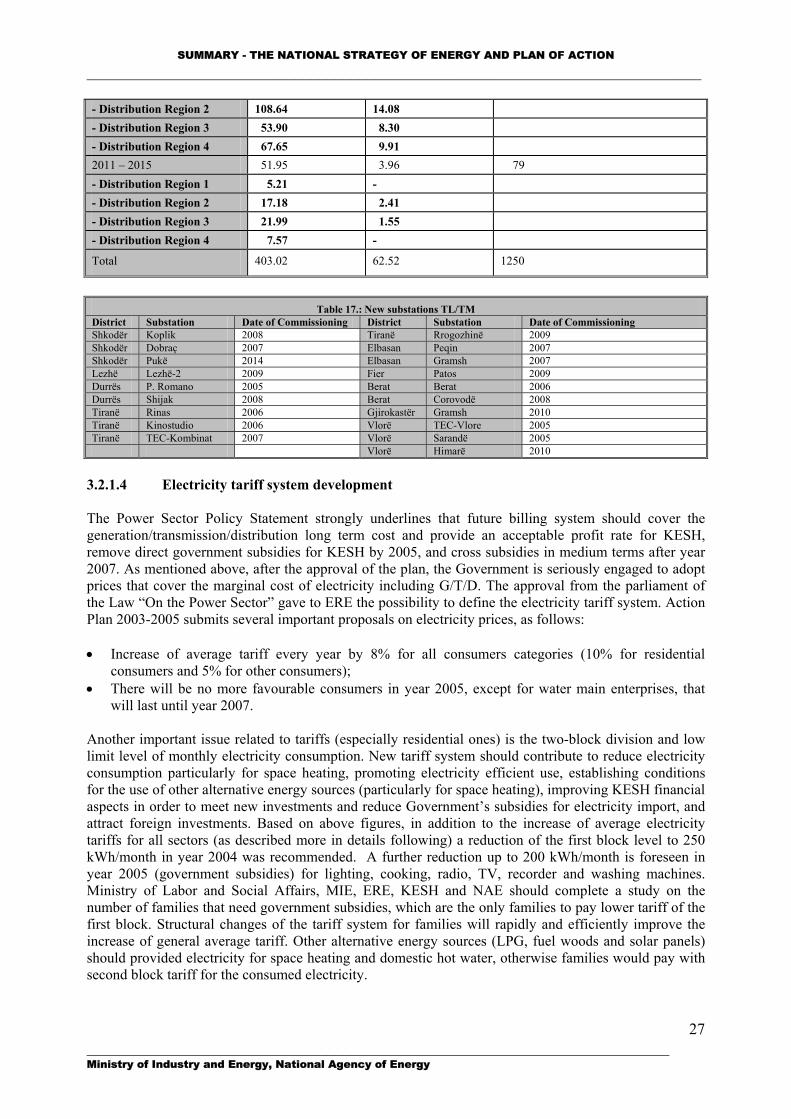
SUMMARY - THE NATIONAL STRATEGY OF ENERGY AND PLAN OF ACTION _____________________________________________________________________________ - Distribution Region 2 108.64 14.08 - Distribution Region 3 53.90 8.30 - Distribution Region 4 67.65 9.91 2011 – 2015 51.95 3.96 79 - Distribution Region 1 5.21 - - Distribution Region 2 17.18 2.41 - Distribution Region 3 21.99 1.55 - Distribution Region 4 7.57 -
Total 403.02 62.52 1250
Table 17.: New substations TL/TM
District Substation Date of Commissioning District Substation Date of Commissioning Shkodër Koplik 2008 Tiranë Rrogozhinë 2009 Shkodër Dobraç 2007 Elbasan Peqin 2007 Shkodër Pukë 2014 Elbasan Gramsh 2007 Lezhë Lezhë-2 2009 Fier Patos 2009 Durrës P. Romano 2005 Berat Berat 2006 Durrës Shijak 2008 Berat Corovodë 2008 Tiranë Rinas 2006 Gjirokastër Gramsh 2010 Tiranë Kinostudio 2006 Vlorë TEC-Vlore 2005 Tiranë TEC-Kombinat 2007 Vlorë Sarandë 2005 Vlorë Himarë 2010
3.2.1.4 Electricity tariff system development The Power Sector Policy Statement strongly underlines that future billing system should cover the generation/transmission/distribution long term cost and provide an acceptable profit rate for KESH, remove direct government subsidies for KESH by 2005, and cross subsidies in medium terms after year 2007. As mentioned above, after the approval of the plan, the Government is seriously engaged to adopt prices that cover the marginal cost of electricity including G/T/D. The approval from the parliament of the Law “On the Power Sector” gave to ERE the possibility to define the electricity tariff system. Action Plan 2003-2005 submits several important proposals on electricity prices, as follows: • Increase of average tariff every year by 8% for all consumers categories (10% for residential
consumers and 5% for other consumers); • There will be no more favourable consumers in year 2005, except for water main enterprises, that
will last until year 2007. Another important issue related to tariffs (especially residential ones) is the two-block division and low limit level of monthly electricity consumption. New tariff system should contribute to reduce electricity consumption particularly for space heating, promoting electricity efficient use, establishing conditions for the use of other alternative energy sources (particularly for space heating), improving KESH financial aspects in order to meet new investments and reduce Government’s subsidies for electricity import, and attract foreign investments. Based on above figures, in addition to the increase of average electricity tariffs for all sectors (as described more in details following) a reduction of the first block level to 250 kWh/month in year 2004 was recommended. A further reduction up to 200 kWh/month is foreseen in year 2005 (government subsidies) for lighting, cooking, radio, TV, recorder and washing machines. Ministry of Labor and Social Affairs, MIE, ERE, KESH and NAE should complete a study on the number of families that need government subsidies, which are the only families to pay lower tariff of the first block. Structural changes of the tariff system for families will rapidly and efficiently improve the increase of general average tariff. Other alternative energy sources (LPG, fuel woods and solar panels) should provided electricity for space heating and domestic hot water, otherwise families would pay with second block tariff for the consumed electricity.
_________________________________________________________________________ Ministry of Industry and Energy, National Agency of Energy
27
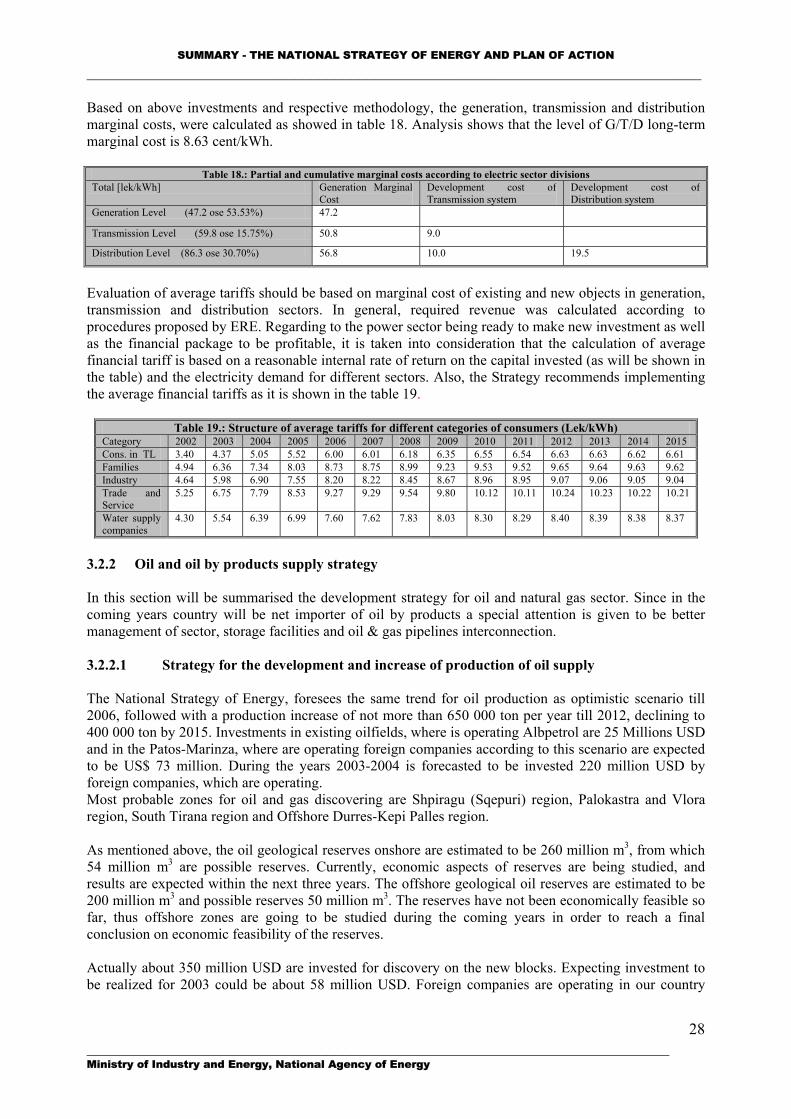
SUMMARY - THE NATIONAL STRATEGY OF ENERGY AND PLAN OF ACTION _____________________________________________________________________________ Based on above investments and respective methodology, the generation, transmission and distribution marginal costs, were calculated as showed in table 18. Analysis shows that the level of G/T/D long-term marginal cost is 8.63 cent/kWh.
Table 18.: Partial and cumulative marginal costs according to electric sector divisions Total [lek/kWh] Generation Marginal
Cost Development cost of Transmission system
Development cost of Distribution system
Generation Level (47.2 ose 53.53%) 47.2
Transmission Level (59.8 ose 15.75%) 50.8 9.0
Distribution Level (86.3 ose 30.70%) 56.8 10.0 19.5
Evaluation of average tariffs should be based on marginal cost of existing and new objects in generation, transmission and distribution sectors. In general, required revenue was calculated according to procedures proposed by ERE. Regarding to the power sector being ready to make new investment as well as the financial package to be profitable, it is taken into consideration that the calculation of average financial tariff is based on a reasonable internal rate of return on the capital invested (as will be shown in the table) and the electricity demand for different sectors. Also, the Strategy recommends implementing the average financial tariffs as it is shown in the table 19.
Table 19.: Structure of average tariffs for different categories of consumers (Lek/kWh) Category 2002 2003 2004 2005 2006 2007 2008 2009 2010 2011 2012 2013 2014 2015 Cons. in TL 3.40 4.37 5.05 5.52 6.00 6.01 6.18 6.35 6.55 6.54 6.63 6.63 6.62 6.61 Families 4.94 6.36 7.34 8.03 8.73 8.75 8.99 9.23 9.53 9.52 9.65 9.64 9.63 9.62 Industry 4.64 5.98 6.90 7.55 8.20 8.22 8.45 8.67 8.96 8.95 9.07 9.06 9.05 9.04 Trade and Service
5.25 6.75 7.79 8.53 9.27 9.29 9.54 9.80 10.12 10.11 10.24 10.23 10.22 10.21
Water supply companies
4.30 5.54 6.39 6.99 7.60 7.62 7.83 8.03 8.30 8.29 8.40 8.39 8.38 8.37
3.2.2 Oil and oil by products supply strategy In this section will be summarised the development strategy for oil and natural gas sector. Since in the coming years country will be net importer of oil by products a special attention is given to be better management of sector, storage facilities and oil & gas pipelines interconnection.
3.2.2.1 Strategy for the development and increase of production of oil supply The National Strategy of Energy, foresees the same trend for oil production as optimistic scenario till 2006, followed with a production increase of not more than 650 000 ton per year till 2012, declining to 400 000 ton by 2015. Investments in existing oilfields, where is operating Albpetrol are 25 Millions USD and in the Patos-Marinza, where are operating foreign companies according to this scenario are expected to be US$ 73 million. During the years 2003-2004 is forecasted to be invested 220 million USD by foreign companies, which are operating. Most probable zones for oil and gas discovering are Shpiragu (Sqepuri) region, Palokastra and Vlora region, South Tirana region and Offshore Durres-Kepi Palles region. As mentioned above, the oil geological reserves onshore are estimated to be 260 million m3, from which 54 million m3 are possible reserves. Currently, economic aspects of reserves are being studied, and results are expected within the next three years. The offshore geological oil reserves are estimated to be 200 million m3 and possible reserves 50 million m3. The reserves have not been economically feasible so far, thus offshore zones are going to be studied during the coming years in order to reach a final conclusion on economic feasibility of the reserves. Actually about 350 million USD are invested for discovery on the new blocks. Expecting investment to be realized for 2003 could be about 58 million USD. Foreign companies are operating in our country
_________________________________________________________________________ Ministry of Industry and Energy, National Agency of Energy
28
SUMMARY - THE NATIONAL STRATEGY OF ENERGY AND PLAN OF ACTION _____________________________________________________________________________ according to the Agreement by sharing of production in term of those companies have taken under their selves the investment risk which will be recover in the case of successfully exploration.
3.2.2.2 Refinery and marketing oil sector strategy Imported oil by-products will continue to dominate in our market. The oil by-products such as diesel, gasoline and LPG are foreseen to occupy approximately 88% of import of oil by-products and gas. Consumption trend of oil by-products is foreseen to grow from 1118 ktoe in 2002 to 2200 ktoe in 2015. The decline of demand for oil by-products, foreseen to reach to 1225 ktoe by 2015, where are expected to start by 2006 with a value of US$ 18 million, reaching a value of US$ 410 million by 2015. In strategy is given high priority LPG penetration, as a fast alternative to substitute electricity consumption, so the penetration of LPG in residential and service sector is forecasted to be 23% and 8% respectively. Refinery sector is actually facing extreme difficulties due to old inefficient technology and lack of a modern system of operations, maintenance and control system. There are also serious problems due to the total lack of control on environmental pollution. Production standards are very problematic preventing competitiveness with international standards, except for diesel, kerosene and bitumen that approach those standards. Other by-products have unattractive characteristics for the consumers. Investments are inexistent in our refineries, a fact that leads to complete depreciation of their assets and deterioration of financial indicators. For this reason, a rapid investment of approx. US$ 27 million would be necessary to stop the exacerbation of the situation, although investments are not expected to improve the economic indicators. Based on the analyses done or carried out in the oil sector in general taking into consideration the suggestion from the World Bank, it is foreseen undertaking a study for oil sector in general and refinery sector explicitly. The main objective of the study will be: “Evaluation of economic feasibility of domestic refineries to become competitive in national and regional markets”. Concerning to Ballsh refinery are forecast to invest on the rehabilitation of the production units by 20 million UDS and TPP rehabilitation too with investment value by 5.5 million USD. These investments are projected to realize on the period 2003 -2008. Fier refinery needs an investment on value of 1.5 million USD due to physical rehabilitation of the technological units. Total investment for all of these issues (three ones) reach a value of 27 million USD. As ARMO company has not financial budget to carry out all this amount of investment, there exists only a choice to make the refinery rehabilitation in cooperation with internationals partners.
3.2.2.3 Storage oil by products development strategy Fuel market infrastructure in our country includes a large number stations which are in total 744 fuel stations and 82 LPG stations distributed in the whole territory. It is necessary all retailing stations should be better to optimize according to European norms and standards. Albania Government has taken the proper measurements to concentrate in two storage facilities zones (Vlora and Bishti i Palles) of by products of oil and gas, which will impact in positive sence of the reduction of by products price, and minimizing of environmental pollution. All of this will be in corporate with sea transport based on minimal cost of that and based on the big quantities that this kind of transport can realize. Oil storage investments are calculated on value of 35-40 Million for constructing deposits oil by products and liquid petroleum gas by products. The construction plan foresees a capacity of 340 000 m3 for oil by-products deposits and 28 800 m3 for LPG deposits. Investments during the first phase are estimated to have a value of approx. US$ 35-40 million. To improve the portal infrastructure is forecast the rehabilitation of Vlora terminal within international standards in a value 3-4 million USD. AMBO project will be a priority, as a very important project with high impact for three countries where the project will pass through. Oil pipeline AMBO represents an important regional object at East-West
_________________________________________________________________________ Ministry of Industry and Energy, National Agency of Energy
29
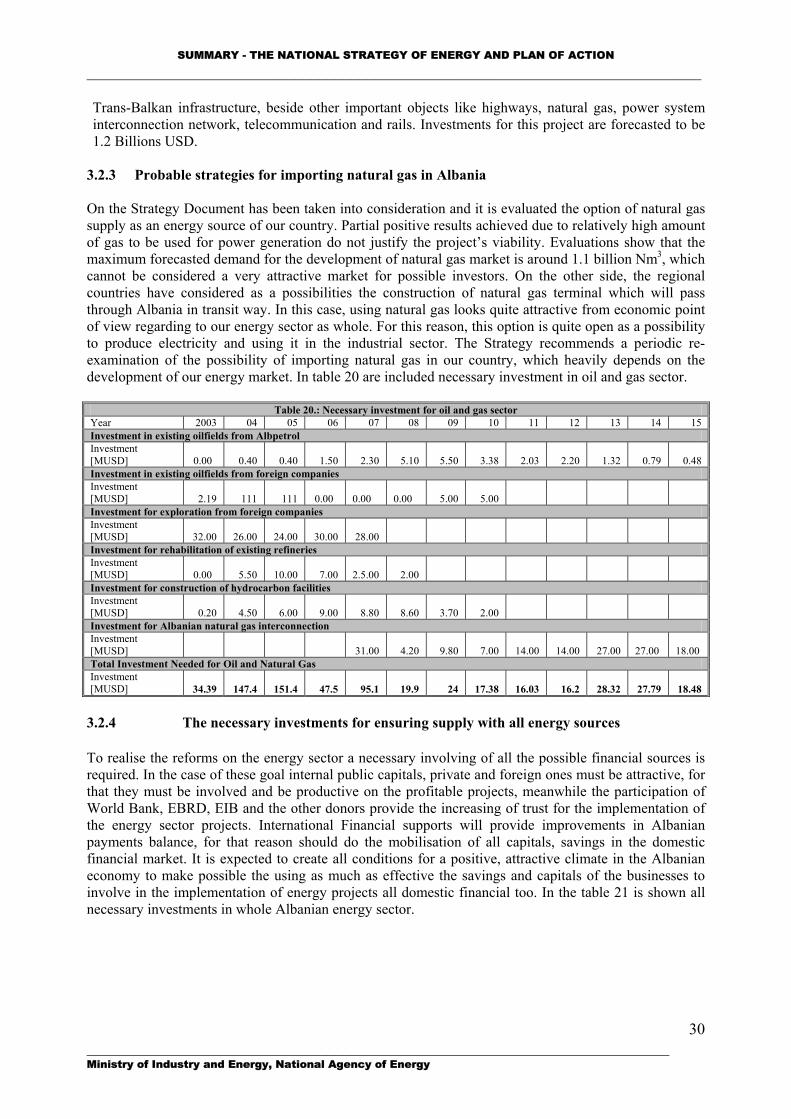
SUMMARY - THE NATIONAL STRATEGY OF ENERGY AND PLAN OF ACTION _____________________________________________________________________________ Trans-Balkan infrastructure, beside other important objects like highways, natural gas, power system interconnection network, telecommunication and rails. Investments for this project are forecasted to be 1.2 Billions USD.
3.2.3 Probable strategies for importing natural gas in Albania On the Strategy Document has been taken into consideration and it is evaluated the option of natural gas supply as an energy source of our country. Partial positive results achieved due to relatively high amount of gas to be used for power generation do not justify the project’s viability. Evaluations show that the maximum forecasted demand for the development of natural gas market is around 1.1 billion Nm3, which cannot be considered a very attractive market for possible investors. On the other side, the regional countries have considered as a possibilities the construction of natural gas terminal which will pass through Albania in transit way. In this case, using natural gas looks quite attractive from economic point of view regarding to our energy sector as whole. For this reason, this option is quite open as a possibility to produce electricity and using it in the industrial sector. The Strategy recommends a periodic re-examination of the possibility of importing natural gas in our country, which heavily depends on the development of our energy market. In table 20 are included necessary investment in oil and gas sector.
Table 20.: Necessary investment for oil and gas sector Year 2003 04 05 06 07 08 09 10 11 12 13 14 15 Investment in existing oilfields from Albpetrol Investment [MUSD] 0.00 0.40 0.40 1.50 2.30 5.10 5.50 3.38 2.03 2.20 1.32 0.79 0.48 Investment in existing oilfields from foreign companies Investment [MUSD] 2.19 111 111 0.00 0.00 0.00 5.00 5.00 Investment for exploration from foreign companies Investment [MUSD] 32.00 26.00 24.00 30.00 28.00 Investment for rehabilitation of existing refineries Investment [MUSD] 0.00 5.50 10.00 7.00 2.5.00 2.00 Investment for construction of hydrocarbon facilities Investment [MUSD] 0.20 4.50 6.00 9.00 8.80 8.60 3.70 2.00 Investment for Albanian natural gas interconnection Investment [MUSD] 31.00 4.20 9.80 7.00 14.00 14.00 27.00 27.00 18.00 Total Investment Needed for Oil and Natural Gas Investment [MUSD] 34.39 147.4 151.4 47.5 95.1 19.9 24 17.38 16.03 16.2 28.32 27.79 18.48
3.2.4 The necessary investments for ensuring supply with all energy sources To realise the reforms on the energy sector a necessary involving of all the possible financial sources is required. In the case of these goal internal public capitals, private and foreign ones must be attractive, for that they must be involved and be productive on the profitable projects, meanwhile the participation of World Bank, EBRD, EIB and the other donors provide the increasing of trust for the implementation of the energy sector projects. International Financial supports will provide improvements in Albanian payments balance, for that reason should do the mobilisation of all capitals, savings in the domestic financial market. It is expected to create all conditions for a positive, attractive climate in the Albanian economy to make possible the using as much as effective the savings and capitals of the businesses to involve in the implementation of energy projects all domestic financial too. In the table 21 is shown all necessary investments in whole Albanian energy sector.
_________________________________________________________________________ Ministry of Industry and Energy, National Agency of Energy
30
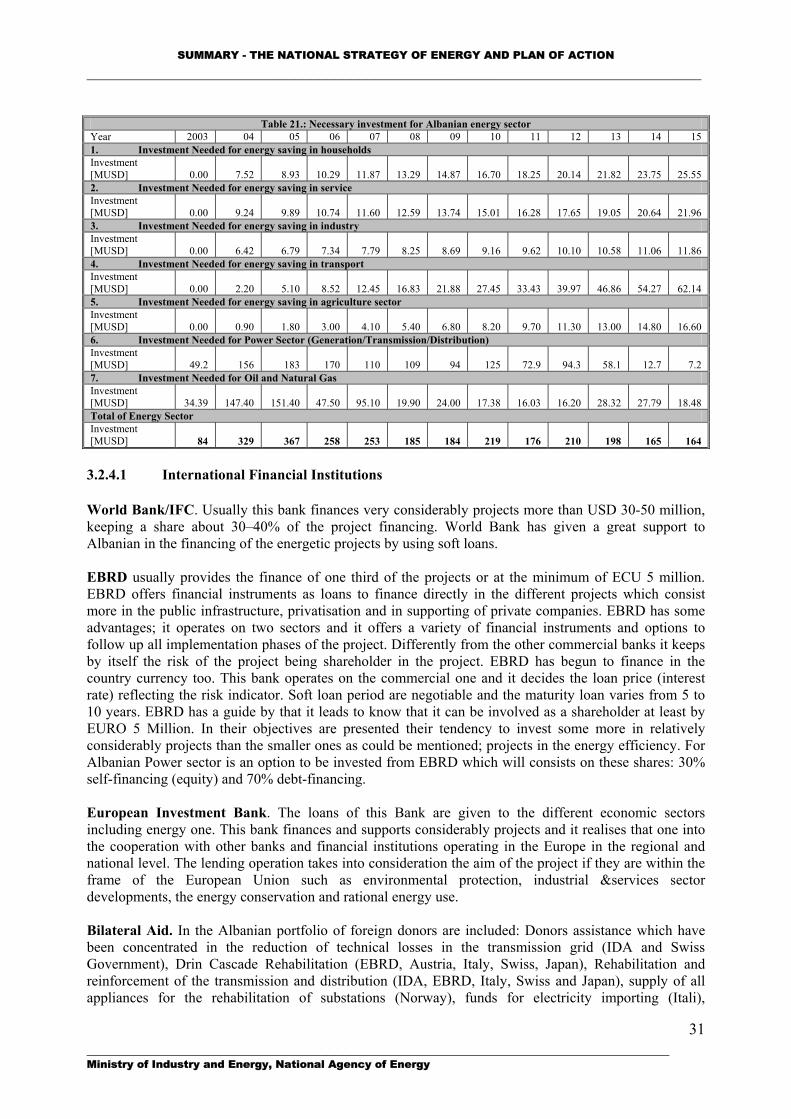
SUMMARY - THE NATIONAL STRATEGY OF ENERGY AND PLAN OF ACTION _____________________________________________________________________________
Table 21.: Necessary investment for Albanian energy sector Year 2003 04 05 06 07 08 09 10 11 12 13 14 15 1. Investment Needed for energy saving in households Investment [MUSD] 0.00 7.52 8.93 10.29 11.87 13.29 14.87 16.70 18.25 20.14 21.82 23.75 25.55 2. Investment Needed for energy saving in service Investment [MUSD] 0.00 9.24 9.89 10.74 11.60 12.59 13.74 15.01 16.28 17.65 19.05 20.64 21.96 3. Investment Needed for energy saving in industry Investment [MUSD] 0.00 6.42 6.79 7.34 7.79 8.25 8.69 9.16 9.62 10.10 10.58 11.06 11.86 4. Investment Needed for energy saving in transport Investment [MUSD] 0.00 2.20 5.10 8.52 12.45 16.83 21.88 27.45 33.43 39.97 46.86 54.27 62.14 5. Investment Needed for energy saving in agriculture sector Investment [MUSD] 0.00 0.90 1.80 3.00 4.10 5.40 6.80 8.20 9.70 11.30 13.00 14.80 16.60 6. Investment Needed for Power Sector (Generation/Transmission/Distribution) Investment [MUSD] 49.2 156 183 170 110 109 94 125 72.9 94.3 58.1 12.7 7.2 7. Investment Needed for Oil and Natural Gas Investment [MUSD] 34.39 147.40 151.40 47.50 95.10 19.90 24.00 17.38 16.03 16.20 28.32 27.79 18.48 Total of Energy Sector Investment [MUSD] 84 329 367 258 253 185 184 219 176 210 198 165 164
3.2.4.1 International Financial Institutions World Bank/IFC. Usually this bank finances very considerably projects more than USD 30-50 million, keeping a share about 30–40% of the project financing. World Bank has given a great support to Albanian in the financing of the energetic projects by using soft loans. EBRD usually provides the finance of one third of the projects or at the minimum of ECU 5 million. EBRD offers financial instruments as loans to finance directly in the different projects which consist more in the public infrastructure, privatisation and in supporting of private companies. EBRD has some advantages; it operates on two sectors and it offers a variety of financial instruments and options to follow up all implementation phases of the project. Differently from the other commercial banks it keeps by itself the risk of the project being shareholder in the project. EBRD has begun to finance in the country currency too. This bank operates on the commercial one and it decides the loan price (interest rate) reflecting the risk indicator. Soft loan period are negotiable and the maturity loan varies from 5 to 10 years. EBRD has a guide by that it leads to know that it can be involved as a shareholder at least by EURO 5 Million. In their objectives are presented their tendency to invest some more in relatively considerably projects than the smaller ones as could be mentioned; projects in the energy efficiency. For Albanian Power sector is an option to be invested from EBRD which will consists on these shares: 30% self-financing (equity) and 70% debt-financing. European Investment Bank. The loans of this Bank are given to the different economic sectors including energy one. This bank finances and supports considerably projects and it realises that one into the cooperation with other banks and financial institutions operating in the Europe in the regional and national level. The lending operation takes into consideration the aim of the project if they are within the frame of the European Union such as environmental protection, industrial &services sector developments, the energy conservation and rational energy use. Bilateral Aid. In the Albanian portfolio of foreign donors are included: Donors assistance which have been concentrated in the reduction of technical losses in the transmission grid (IDA and Swiss Government), Drin Cascade Rehabilitation (EBRD, Austria, Italy, Swiss, Japan), Rehabilitation and reinforcement of the transmission and distribution (IDA, EBRD, Italy, Swiss and Japan), supply of all appliances for the rehabilitation of substations (Norway), funds for electricity importing (Itali),
_________________________________________________________________________ Ministry of Industry and Energy, National Agency of Energy
31
SUMMARY - THE NATIONAL STRATEGY OF ENERGY AND PLAN OF ACTION _____________________________________________________________________________ reinforcement of South part of Albania of power sector (KfW Germany). There is the proper place to mention the USAID (American Agency for International Development) for the very useful help that they have given and are giving still nowadays in the technical assistance. 3.2.4.2 Private financing in the energy sector Concessional loan. These kinds of loans could make more possible that the projects must consider more acceptable and favourable from bankable point of view. For Concessional Loans is required that the projects must have a high profit rates stimulating the market development and resulting with a low environmental pollution. Commercial loan. From pre-evaluation done before, regarding to the basis of the loan conditions of the above mentioned loans has resulted that: Concessional Loans have an interest rate about 4% with a grace period 6 years; while for commercial loan the interest rate is about 12 % with grace period about 2 years. Independent Power Producers (IPP). Potential advantages of IPP project financing are: Additional credit support and leverage; more efficient allocation of risks; project and credit risks easier to evaluate than in the case of traditional loans (corporate financing); no financial involvement of Government (off-budget), and finally, conducive to efficient project management and corporate control. Making attractive and creating the positive clime for foreign investors was approved the law of “Power Sector Reforming“, which created a legal framework minimising the risk in the Albanian power sector. • Foreign Sources – are those that could be considered likely financial mechanisms based on bilateral
or multilateral agreements (Banks), foreign financing companies etc. • Third Party Financing (TPF): is presented as a technical and financial instrument which combines the
proper technical solution with necessary financing resources to create and implement a specific project. The investor can be public or private one, and offers the reduction of the energy cost. Some kinds of financial mechanisms in the frame of TPF are: BOT - Build, Operate and Transfer and BOOT Build, Own, Operate and Transfer.
Joint-Ventures companies: They consist on putting in operation efficiently their own capitals to develop new companies or existing ones in the energy sector. They take part on the ownership of the state companies and create the possibilities to return the capitals invested profitable from financing point of view. Although in short term and medium term, concessional loans and technical assistance will remain as the much important financial resources from out of the country. This one is considered as an obligation to undertake some implementation measurements to support the donors that their investments and their capitals must be rentable and profitable. In the energy efficiency field; ESCO-s offer to the energy consumers not only ideas but also their technical capacity and capital necessary to invest for the implementation of the energy efficiency improvement.
3.2.5 Restructuring energy sector very important step for the implementation of the National Strategy of Energy
Future energy sector reform, take into consideration a definition and sharing of making-policy, regulation and state management roles as well as a legal and (regarding) to the economic development, social and market requirements necessities of regional energy market, to ensure more effective system function in Albanian power system. To achieve these objects is necessary: • Compiling of a full legal framework (including an Energy Policy Law)
_________________________________________________________________________ Ministry of Industry and Energy, National Agency of Energy
32
SUMMARY - THE NATIONAL STRATEGY OF ENERGY AND PLAN OF ACTION _____________________________________________________________________________ • Establishing of energy markets enabling all participants a free, transparency and non-discriminate
competition, aiming private investments attraction through privatisation process as well as absorbing new investments in energy sector.
• Enlargement and reinforcement of ERE institutional role will bring the trust toward to increase the foreign investors.
• New ERE establishing as a guaranty institution of interests protection of different operators and consumers in energy sector.
Energy Institutions and Companies in new restructuring framework • Ministry of Industry and Energy will continue to remain the responsible institution for making
medium and long-term energy policies as well of the preparation of the whole Albanian energy system and National Strategy of Energy. MIE, through its National Agency of Energy and General Directorates should prepare and define the action plans for implementation of the National Strategy of Energy. MIE, must through its Directorates, NAE and NPA should prepare short-term policies for hydrocarbons sector, while through Energy Efficiency Centre Albanian-EU should implement different programs undertaken in the energy efficiency area.
• Extension of the role of NAE is considered and estimated as a necessity in the light of preparation and implementation of the National Strategy of Energy. It should functions as a co-coordinating and monitoring institution in the implementation process of the Strategy. Regards to the energy efficiency, based on the conclusions of the World Bank study, the NAE should be responsible for preparation of the Energy Efficiency Program, and may also be chosen as the proper institution which will manage a possible energy efficiency fund that the Albanian government has in its future plans. In order to accomplish as good as possible its responsibilities and duties, the NAE will collaborate tightly with the departments of local authorities (mainly in counties) responsible for energy, which may be going to be transformed in regional energy agencies or offices.
• Extension and strengthening of the institutional role of the Electricity Regulatory Authority (ERE) remains one of most important institutional challenges in the energy sector. The new power sector law provides the legal bases for an independent functioning of this institution assigning to it full responsibilities for issuing licenses and setting the electricity tariffs. The existence of an independent and credible regulator in power sector will increase the confidence of strategic foreign investors, which may invest either through construction of new generation plants or through participation in a possible privatization process of this sector. This Authority in the future will regulate all the activities having to do with cost evaluation, prices, quality and security of energy resources, consumer protection based on a transparent and non-discriminative process and on the economic and technical capacities of energy operators. This should be an independent institution, which will function in compliance with the relevant legislation based on which this institution is established and will function. Creation of such institution is proposed to be established in a long-term perspective taking into account the modest experience of the existing ERE in the field of regulation.
New organization of Albanian Power Corporation (KESH) The essence of the Statement is to initiate institutional reforms that will more clearly define the policy-making and regulatory roles of various government entities and create a market structure that will strengthen commercial operations through privatization and attracted needed private investment. Unbundling and corporatization of KESH activities Statement envisages unbundling of KESH according to generation, transmission and distribution functions, in view not only of having a better management of this sector, but also in view of creating an open and competitive market in electricity generation and supply services. Unbundling of KESH will enable Albania to meet its commitments in frame of the association process with EU (requirements of EU Directive 96/92/EC) and of the establishment of electricity regional market in South East Europe and its further integration into the European energy market (Athens Memorandum November 15,2002). _________________________________________________________________________ Ministry of Industry and Energy, National Agency of Energy
33
SUMMARY - THE NATIONAL STRATEGY OF ENERGY AND PLAN OF ACTION _____________________________________________________________________________ Unbundling of vertically integrated companies is a requirement of EU Directive 96/92 and Athens Memorandum of Understanding. Selection and application of market model Restructuring of the KESH, the establishment of the Transmission System Operator (TSO) and approval of power sector legislation will be followed by the process of selection and application of an appropriate electricity market applied. From the experience of developed countries on electricity markets there are a number of models summarized in two representing models: a) single buyer model, and b) model of bilateral contracts providing third parties the access in transmission and distribution networks. The single buyer model can be seen as a transitional stage before the conditions for a competitive wholesale market and for a model of bilateral contracts are satisfied. Taking into account the conditions of our country, the Power Sector Policy Statement points out that, before Albania apply a developed model such as of the third party financing Access (TPA), a transitory phase should be passed. During this phase a decision to apply either the single buyer model or a mixed model with application of the single buyer model for captive consumers (with lower yearly electricity consumption than eligible consumers) and the bilateral contracts for a category of consumers classified as eligible consumers. Role of ERE in regulation market Whereas the “market” is in principle expected to lead to long-term equilibrium in an efficient way, the path from a non-competitive market to a competitive one is long and tends to create forces impeding the introduction of further competition. For these reasons the role of ERE in this process will be critical. ERE must establish itself as an authority accepted and respected by all participants ensuring the smooth and unobstructed operation of the market.
Sector of Hydrocarbons Despite the involvement of private operators in all activities of hydrocarbons sector, for three companies Albpetrol, ARMO, and SERVCOM, actually operate as joint-stock companies completely separated from each other after liquidation of APC. In order that this new scheme do not create problems it is very important that Directorate of Management Public Ownership (Ministry of Economy) to carry out in short term period duties of coordination and supervision for three above mentioned companies. Taking into consideration that this Directorate can’t carry out this function for long term period poses an immediate obligation that under boosting of privatization process of these companies to establish as soon as possible a specialized authority which could be named as the Agency for Management of Public Properties and Assets. This agency will manage the public companies and will be responsible for preparation and realization of the privatization process for the companies operating in the hydrocarbons sector. State Inspectorate for Controlling of Oil, Gas and their by-products One of the weak spots noticed, as the hydrocarbons market was liberalized, was non-observance of the rules on oil by-products quality and technical safety of equipments and vessels used in this sector. Despite for the oil by-products quality and the technical safety rules of equipment are established two inspectorates that of controlling of fuels and the inspectorate of vessels under pressure, it should be emphasized that there are various concerns, which should be resolved in the short term period for the improvements of working environment and enforcement role of both inspectorates. This should be one commitment for the implementations of the strategy in this sector. _________________________________________________________________________ Ministry of Industry and Energy, National Agency of Energy
34
SUMMARY - THE NATIONAL STRATEGY OF ENERGY AND PLAN OF ACTION _____________________________________________________________________________ Inspectorate for Electrical Equipment and Installation Taking into consideration all problems, which are dealing with exploitation and the standards of the insulation of electric appliances, the State of Electricity Inspectorate, must be supported too much more in the near future. This one is foreseen to play a great role in the future more consisted on the control of power factor (cos Ǿ) in all industrial enterprises and service ones. Institutions responsible for energy efficiency Our country is aware for the importance of energy efficiency, express that in the Document of National Strategy of Energy. Also our Government in close collaboration with EU have established Albanian -EU Energy Efficiency Center (EEC-EU) with the main goal the implementation of different projects in the area of energy efficiency. However, various projects are carried out in this field, there remains a lot to be done. Establishment of an energy efficiency fund by the government based on the necessary legislation to be adopted would represent a good step forward for this purpose. The fund could also be financed by big industrial consumers, which may be legally obliged to carry out mandatory energy audits. All these activities require to be managed and leaded by an appropriate institutional structure, which would be subordinated by the Ministry of Industry and Energy. Notwithstanding such a structure will be finally defined by the law, NAE represents the most qualified and specialized institution to be involved in the elaboration and preparation of energy efficiency programs. Here, it should be mentioned the important role of EU-EEC or other efficiency centers that may be established either as a non-profit organization or energy service companies (ESCO-s or TPFs) that are spread out and considerably supported in almost all developed countries and many developing countries. 3.2.6 Indispensable Legal framework for the implementation of the National Strategy of
Energy New draft of energy policy law Despite every specific energy by-sector is govern by specific laws, it is necessary the elaboration and adoption of a law which would deal and would establish with the general principles for the development and making policies and the national strategy of energy, particularly the principles for the consumers behavior for a more efficient use of the energy resources. First, this law would establish the legal obligation for the responsible institutions (Ministry of Industry and Energy through NAE) to prepare the National Strategy of Energy for a determined period 10, 15 or more years and the reviewing and updating of this strategy every 4 or 5 years due to the dynamics of development of the Albanian society in general and of the energy sector in particular. Taking into consideration a great attention to the process of gathering the technical and economic energy data not only because based on them the short and long-term energy demand forecasts are made, but also for preparation of annual energy balances, which has been a practice implemented by the NAE for our country as well. For this reason, the law would oblige all big energy consumers that consume more than a certain quantity of all kind of energy commodities energy reports according to formats prepared by the NAE and INSTAT that will be used for preparation of energy balances. Energy efficiency improvement will constitute one of the major objectives of energy policies and strategies. The law would require preparation and adoption of 2-year program of energy efficiency and saving. The responsible institutions and the rules for administration and disbursement of monies from this fund, would be established through a decree approved by the Council of Ministers. Such a fund may finance studies and activities on developing energy efficiency, demonstrative projects that investigate and test new energy technologies, energy audits in various sectors, consumers’ awareness campaigns for the importance and benefits of energy efficiency and savings etc.
_________________________________________________________________________ Ministry of Industry and Energy, National Agency of Energy
35
SUMMARY - THE NATIONAL STRATEGY OF ENERGY AND PLAN OF ACTION _____________________________________________________________________________
_________________________________________________________________________ Ministry of Industry and Energy, National Agency of Energy
36
Legal framework of power sector Another law of great importance for restructuring of power sector was the law “On Regulation of electric power sector”, which marked the first step toward a restructuring policy in this vital sector. The purpose of the law “On Power Sector” is to ensure the conditions for a safe and reliable electricity supply through an efficiently functioning power market. Based on this law, the regulation of power sector shall be done by the Electricity Regulatory Authority (ERE), which is a legal independent institution from the Government. In frame of an assistance program provided by USAID, the Albanian Government approved by the Power Sector Policy Statement, which constitutes a basic document for the reforms undertaken by the Albanian Government in this sector. According to this document, the objective of the government policy in the power sector is to develop an electricity market that provides for reliable, safe, and adequate electric supply at reasonable prices in an economically and environmentally sound manner and in accordance with accepted commercial and market principles and the rule of law. To alleviate and eliminate this problem, along with many actions of organization and managerial character undertaken by state institutions and KESH itself, was considered necessary the establishment of a special structure that would monitor and punish the abuses in the power sector, particularly the abuses with electricity consumption. Based on the law no.8637, dated 6.07.2000 “On electrical police”, the Electrical Police as a specialized executive body for controlling the enforcement of legislation and use of electricity was established. Rapid growth of electricity consumption in all economic sectors, especially in the residential sector, made necessary the introduction of measures for electricity saving and promotion of use of other alternative sources, especially for heating purposes. For this reason, the Government approved the Decree “On energy saving and conservation in buildings” and the Technical Norms of Heat Conservation in Buildings. MIE through NAE will continue to train all energy specialists in municipalities to be able to give permission for the construction of new buildings according to this law. International agreement and treaties in energy field The main political initiative in the field of development of the cooperation between countries in energy sector is the European Energy Charter Treaty (ECT), which constituted an important political document for cooperation of European countries in the energy sector. The purpose of ECT was to create a legal frame, which would promote the long-term cooperation within energy sector, through decisions on investments, trade, and transit, sovereignty over energy resources, environment, competition, taxes and technology. Albania has been active also in other regional initiatives. Of a great importance for the energy sector is the initiative on creation of electricity market in South East Europe and its further integration into the European energy market. Under this initiative, the Misters of energy of South-Eastern European countries have signed a number of documents as the Thessalonica Declaration on September 10, 1999, Athens Memorandum of Understanding on June 2, 2000, and recently, Athens Memorandum of Understanding on November 15, 2002. Through these documents, the countries of the region are committed to create by year 2005 a regional electricity market in South-Eastern Europe. This market will be based on the principles of the EU electricity Directive 96/92/EC and other legal acts.