
THE NATIONAL COUNCIL FOR SOVIET AND EAST ...I . Introduction Between 1989 and 1991, the collapse of...
74
TITLE : HOW TO STABILIZE : LESSONS FROM POST-COMMUNIS T COUNTRIE S AUTHOR : Anders Ausland, Carnegie Endowment for International Peac e Peter Boone . London School of Economic s Simon Johnson . Duke University THE NATIONAL COUNCI L FOR SOVIET AND EAST EUROPEAN RESEARC H TITLE VIII PROGRA M 1755 Massachusetts Avenue, N .W . Washington, D .C . 20036
Transcript of THE NATIONAL COUNCIL FOR SOVIET AND EAST ...I . Introduction Between 1989 and 1991, the collapse of...

TITLE : HOW TO STABILIZE : LESSONS FROM POST-COMMUNIS TCOUNTRIE S
AUTHOR : Anders Ausland, Carnegie Endowment for International Peac ePeter Boone . London School of Economic sSimon Johnson . Duke University
THE NATIONAL COUNCI LFOR SOVIET AND EAST EUROPEAN RESEARC H
TITLE VIII PROGRA M
1755 Massachusetts Avenue, N .W .Washington, D .C. 20036
COPYRIGH T
This paper was not produced under Council contract, an dthe authors retain copyright on it . They have grante dpermission to the National Council for Soviet and Eas tEuropean Reseach, and to the United States Government,to duplicate and disseminate this paper in written an delectronic form, as follows: Such dissemination may bemade by the Council solely (a) for its own internal use ,and (b) to the United States Government (1) for its ow ninternal use; (2) for further dissemination to domestic ,international and foreign governments, entities an dindividuals to serve official United States Governmen tpurposes; and (3) for dissemination in accordance wit hthe Freedom of Information Act or other law or policy o fthe United States Government granting the public right sof access to documents held by the United StatesGovernment. Neither the Council, nor the United State sGovernment, nor any recipient of this Report by reason o fthat dissemination may use this Report for commercia lsale.
APR

April 17, 199 6Revised
Forthcoming in Brookings Papers on Economic Activity, 1996:1 .
HOW TO STABILIZE : LESSONS FROM POST-COMMUNIST COUNTRIES
by
Anders AslundCarnegie Endowment for International Peac e
Peter BooneLondon School of Economic s
Simon JohnsonDuke University
AbstractThe leading formal models of the post-communist transition predict that more radical reform
results in a larger loss of output, higher social costs, and a greater chance of political failure . Wereview the evidence from the previously communist-controlled countries of Central Europe an dthe former Soviet Union, and find very little support for these propositions . The usual concernwith economic and political adjustment costs appears to be misplaced and misses importan tcomplementarities between economic policies and other positive externalities .
More important, and ignored by most of the literature, is rent-seeking by a subset of the ol delite . This behavior is pervasive and potentially very dangerous, although it has been more of aproblem in the former Soviet Union . Tough stabilization policies have proven effective i ncontrolling this rent-seeking, particularly if combined with institutional changes which "lock-in "reforms . We also find that radical reform has done relatively well with public opinion and i nelections . For these post-communist countries, democratization appears to be strongl ycomplementary to radical economic reform because it helps to break the power of the old elite .

CONTENTS
Introduction 1
II. Stabilization and Structural Transformation 6
The Case for Negative Externalities 7
Disruption of Production 7
Unemployment 1 0
Private Sector Development 1 3
Institutional Development 1 4
The Role of Complementarities and Positive Externalities 1 5
III. The Politics of Reform 1 6
A Model of Rent-Seeking in Transition 1 7
Evidence on Rents after Communism 1 9
Summarizing the Reformer's Political Choices 2 1
IV. The Electoral Fortunes of Reform 23
Which Policies Lose Elections 24
Does the Public Prefer Gradual or Rapid Reform? 26
V. Economic Strategies for Irreversible Reform 27
The Main Ingredients of Reform Packages 28
Preemptive Policy Changes 29
Poison Pills 3 1
Conditional Assistance 3 2
Budget Process and Deadlines : Checks and Balances 3 3
VI. Implications for the Design of Political and Economic Reform 35
References 3 8
Tables 4 1
Figures 59

I . Introductio n
Between 1989 and 1991, the collapse of the Soviet bloc brought down the established politica l
system in 25 countries .' With the rapid decline of the communist party's power throughout the region .
and particularly following the collapse of the Soviet Union, it proved impossible to maintain an economi c
system based on hierarchical subordination, predominant state ownership, and a command-rationin g
allocation mechanism (Kornai 1992) . All previously communist-controlled countries therefore inherited
an economic system which no longer functioned properly, and a political struggle for power .
The central problem has proved to be one of controlling inflation . In theory, liberalization and
privatization can take place without macroeconomic stabilization, but in practice this combination has no t
proved effective . At least in these countries, the budget cannot be balanced and monetary emissio n
cannot be controlled without large cuts in subsidies and far-reaching price liberalization . Macroeconomi c
stabilization is therefore the necessary, although not sufficient, condition for effective reform .2
The large literature on macroeconomic stabilization and economic transformation in these countries
is divided into three parts : policy prescription, formal models, and individual country studies . The
policy prescription work, by both academics and international organizations, has been overwhelmingly i n
favor of complete stabilization supported by all other reforms being carried out with as much intensity a s
possible (e .g ., Lipton and Sachs 1990, Fischer and Gelb 1991) . In contrast, the formal models hav e
almost unanimously argued that radical reform is too costly and a slower approach is preferable (e .g . ,
Dewatripont and Roland 1992a . 1992b, 1995, Murrell and Wang 1993, Laban and Wolf 1993) . Taking
an intermediate position, individual country studies find that radical policy has important advantages, bu t
that slower reform can also have positive results (Aslund 1995, Gomulka 1992, Hansson 1994 . Johnson
and Loveman 1995, Leitzel 1995, Slay 1995) .
So far, however, there has been relatively little work comparing the reform experiences in all post -
communist countries . Among the important retrospective studies, Blanchard (1995) analyzes th e
experience in five Central European countries, Gomulka (1995) compares Poland and Russia, and Citri n
'We will focus on 23 countries : the fifteen countries which emerged from the Soviet Union, the seven commonl yreferred to as Central or Eastern Europe (Poland, the Czech Republic, Slovakia, Hungary, Romania, Bulgaria, an dAlbania), and Mongolia . We do not deal in detail here with former Yugoslavia, because it had a very differentstarting point, or with East Germany, since it was incorporated into unified Germany with unique resources an dproblems . However, some aspects of the stabilization experiences in Slovenia . Serbia . Macedonia, and Croatia wil lbe brought in where relevant . Similarly, because of their structural economic differences, we do not deal wit hChina and Vietnam (Sachs and Woo 1994) .
The leading retrospective studies of reform experiences focus on the importance of liberalization measures wit hstabilization given a supporting role . For example, in a background paper for the World Development Report . deMelo, Denizer . and Gelb (1995) measure the transition primarily in terms of the cumulative liberalization of interna lprices, external markets, and private sector entry . In its 1995 transition report the European Bank fo rReconstruction and Development does not include stabilization policy or inflation as part of its otherwis ecomprehensive indices which measure reform . This presumably reflects the view that liberalization rather than lowinflation is of primary importance for reform. For a related discussion in a broader set of countries see Sachs an dWarner (1995) .
1

et al (1996) reviews the evidence from the former Soviet Union . Only European Bank fo r
Reconstruction and Development (1995), and de Melo, Denizer, and Gelb (1995) discuss all th e
reforming countries, but these papers do not emphasize how reform policy is affected by and feeds bac k
into political considerations .
There are four main questions . Has radical reform proved more costly or more beneficial tha n
slower reform? What considerations have determined the choice of reform strategy? To what extent ha s
radical or slow reform prevailed in elections and with public opinion? Which tactics have prove d
particularly effective for introducing and maintaining reform ?
First we must define what we mean in discussing the intensity and timing of reform, particularl y
because the terms "radical" and "gradual" have sometimes been misused . Table 1 shows the pattern o f
inflation, including the year in which inflation peaked and what happened subsequently . Table 2
supplements this with information about the pattern of liberalization over time, using the World Bank
index which is presented in de Melo . Denizer, and Gelb (1995) .
By "radical" we mean a country that has tried to undertake a maximum of reform given its initia l
conditions . Our definition of radical reform focuses on two criteria : how rapidly inflation was brough t
under control, and the change in the level of the liberalization index . In all the radical reform countries .
inflation peaked in the year of price liberalization and then fell . Gradual reformers have a peak i n
inflation usually one year after liberalization, while in the remaining countries inflation continues t o
accelerate . While stabilization is only one component of reform, in post-communist countries it is highl y
correlated with liberalization. Figure 1 shows that high inflation countries tended to carry out the leas t
liberalization as measured by de Melo, Gelb and Denizer's (1995) liberalization index . '
We should strongly caution the reader against placing too much reliance on data from post -
communist countries . Below we focus on those measures of economic performance, particularly output ,
which are measured reasonably well, although we emphasis (in footnotes) the problems with each series .
We also use measured inflation and the liberalization index as crude but reliable indicators of economi c
policy . Our empirical goal is to draw robust conclusions, in the sense that they are not affected by likely
measurement errors .
A striking correlation exists between political regime and economic policies . In these terms, post -
communist countries can be divided into five groups . First, one group of countries opted fo r
democratization, were initially ruled by liberal governments, and chose radical stabilization and
liberalization . With the first year of radical reform given in brackets, these countries are : Poland (i n
'This correlation does not simply reflect differences in conditions between the former Soviet Union and Centra lEurope . When we include dummy variables for the former Soviet Union and war-torn areas, the cross countrycorrelation between inflation and liberalization remains strong . The Soviet Union dummy captures differen tunderlying structural factors, such as greater reliance on military-industrial production, a longer history o fcommunism, greater reliance on trade within the communist bloc, and membership in the rouble zone when contro lover money creation disintegrated .
1990), Czechoslovakia (in 1991), Estonia (in 1992), Latvia (in 1992), and Albania (in 1992) . 4 In each
country inflation peaked in the year of reform and was then brought rapidly under 50 percent (Table 1) .
Table 2 shows the liberalization index jumped by at least 0 .3 (although Latvia had an increase of only
0.22) and reform continued over the following years until the index reached the 0 .8-0 .9 range (Albania
has remained at 0 .7 because of poor conditions for private sector entry) .
A second group of countries had democratic regimes and initially non-socialist governments, bu t
chose, or ended up with, slower or less radical reform : Hungary, Lithuania, Bulgaria . Russia, and the
Kyrgyz Republic .' Various reasons accounted for postponing reforms or making them more gradual .
Hungary had a conservative and nationalist government that won elections against two liberal parties tha t
desired more radical reforms. Table 2 shows Hungary had less change in its liberalization index than
Poland but because its 1989 liberalization was greater than Poland, by 1993 both countries had reached
the same level .° Lithuania had a strongly nationalist government that focussed initially on privatizatio n
rather than liberalization or macroeconomic stabilization . Both Bulgaria and Russia attempted radical
economic reform, but their non-socialist governments were so politically weak that they faltered afte r
about a year and their radical reform attempts collapsed before the reforms had taken hold (in contrast t o
Poland where the reform government collapsed after the reforms had taken hold) . The jump in
Bulgaria's liberalization index in its most intense reform year was of a similar size to that in Poland, an d
this was not reversed, but change over the next two years was slow and inflation crept higher .
According to the liberalization index, Russia's initial jump was as large as in Poland and chang e
continued over the next two years . But Russia started from a lower level, so needed to do more, and
inflation was not brought under control as quickly . The Kyrgyz Republic simply started its reform s
relatively late .
In all these cases we can identify the year in which reform began : Bulgaria in 1991, Hungary i n
1990, Lithuania in 1992, Russia in 1992, and the Kyrgyz Republic in 1993 . With the exception of
Hungary, all these countries had higher inflation, both initially and subsequently, compared with the
early radical reformers and none had inflation under 50 percent by 1994 . These countries either had a
relatively small initial jump in their liberalization index (Hungary, Lithuania) or a very slow subsequen t
increase (Bulgaria), or both (Russia) . The Kyrgyz Republic is an exception because the initial jump wa s
low but the following years were quite radical .
'The split of Czechoslovakia into the Czech Republic and Slovakia created two new countries which had alread yembarked on radical reform . Slovakia slowed privatization significantly, but kept the other dimensions of refor mclose to those of the Czech Republic (see the Appendix in De Melo, Denizer, and Gelb 1995 . or EBRD 1995, Tabl e2 .1) .
5A "non-socialist" is a centrist or right-wing government as distinct from a government formed around a forme rcommunist party .
'Although Hungary had undertaken the most far-reaching economic reform under communism, the post -communist Hungarian government took pride in being gradual and maximizing current consumption (Kornai 1995) .In particular, the Hungarian government allowed its public expenditure to rise to a much higher share of GDP tha nunder communism, while the radical reformers brought down the share of their public spending in GDP .
3

Third, wherever the same group of communist rulers stayed in power, reform was initially delaye d
and only began to occur later . This was the case both where there was some democratization, i .e . in
Romania . Moldova, Belarus, and Ukraine, and also where there was very little : Kazakhstan, Uzbekistan ,
and Turkmenistan . In Romania and Moldova inflation was brought down, but remained above 100
percent in 1994, while in the others it remains unclear if inflation has been controlled . In terms of
liberalization, there was some slight improvement in 1992, but the subsequent pace has been very slo w
and all the countries remain in the 0.3-0 .4 range on the liberalization index . For these gradual reformers
it is often difficult to date the beginning of reform, and the first column of Table 2 generally shows th e
earliest possible date . '
Fourth, high inflation and postponed reform characterize the war-torn countries of the forme r
Soviet Union: Georgia, Armenia, Azerbaijan, and Tajikistan . The former Yugoslav republics, Croati a
and Macedonia, show relatively high liberalization and an improvement over time, but inflation remain s
a problem. Slovenia is hard to classify because it emerged from Yugoslavia without much fighting ; we
include it and Mongolia here only for completeness . '
To assess to what extent people agree on this ordering of reform outcomes across countries, and
aware that various international organizations attach different weight to attributes of economic policie s
and environment, we evaluated four rankings for countries in the former Soviet Union in 1994 and 1995 :
the World Bank, IMF, EBRD, and Ernst & Young . The World Bank and EBRD rankings do no t
include macroeconomic issues (such as the inflation rate), while the EBRD has more emphasis o n
institutional development .' All four organizations agree that the "best" five reformed countries ar e
Estonia, Latvia, Lithuania, the Kyrgyz Republic, and Russia . They also agree that the worst countrie s
are Turkmenistan, Tajikistan, and Azerbaijan. Kazakhstan gets a higher ranking from the IMF (6th) an d
Ernst & Young (4th) than it does from the World Bank and the EBRD (9th according to both), bu t
almost all the other countries have the same position within a place or two across the rankings . The
'The EBRD (1995, p .68) puts price liberalization in same year as the "year of most intense reform" in Tabl e2, with the following exceptions : Lithuania is in 1992 rather than 1991 ; Bulgaria starts in 1991 but ends in 1992 ;Russia and the Kyrgyz Republic start in 1993 rather than 1992 ; Romania starts in 1993 rather than 1990 ; Moldova ,Armenia, Uzbekistan and Georgia start in 1994 rather than 1992 ; and Azerbaijan, Belarus, Kazakhstan ,Turkmenistan, and Ukraine are shown as not having price liberalization through 1994 .
'Mongolia could reasonably be considered to have had a non-socialist government which followed gradua lreform. In fact, a minority pro-reform lobby pressured for radical reform but only partially succeeded before afinancial scandal contributed to electoral defeat .
The World Bank's categories are : internal prices, external markets, and private sector entry (de Melo . Denizer ,and Gelb 1995). The IMF's categories are : fiscal consolidation, privatization/land restitution, institutional reform .government/legal framework, social safety net, and trade liberalization (Citrin et al 1995) . The EBRD 199 5evaluates : "enterprises" (large-scale and small-scale privatization, as well as restructuring), "markets and trade "(price liberalization, trade and foreign exchange system, competition policy), "financial institutions" (banking reformand interest rate liberalization, securities markets and non-bank financial institutions), and "legal reform ." Erns t& Young ranks : business opportunity, political risk, credit rating, status of economy, stability, and busines sinfrastructure (Financial Times October 24, 1995) .
4

notable exception is Ukraine on which the rankings differ widely ; for 1994 the World Bank puts it i n
14th place while the IMF puts it in 8t h place.10
Based on our classification above we use the cross-country evidence to obtain new answers to th e
standard four questions . First, the statistical evidence shows that a substantial loss of output associate d
with ending the communist system is inevitable, and the cross-country evidence does not support th e
proposition that rapid reform results in a more rapid output decline . Instead we find the timing o f
reform determines the timing of the output decline and recovery : countries that entered into reform early
faced early output declines, but they also were the first to renewed growth .
If we compare groups of countries with similar starting conditions, in every case the radica l
reformer does better or no worse . This is true for : Poland compared with the rest of Central Europe ;
Estonia compared with other Baltic countries ; and Russia compared with other parts of the former Sovie t
Union. Furthermore, contrary to most formal models we find radical reform does not result in highe r
unemployment, does not slow private sector development, and does not prevent institutiona l
development . In fact, in most of these regards there is strong evidence that radically reforming countries
have done better, particularly with regard to the growth of new private firms and pro-market institutions .
Second, there is strong evidence that the timing and intensity of reform is determined by th e
position of the old communist elite after the fall of communism . Governments controlled by members o f
the old communist elite, particularly state enterprise managers, have initially pursued inflationary policie s
which transfer large amounts of resources to their supporters . Delayed or slow reform has facilitate d
this elite's acquisition of economic resources . Interestingly, as these transfers have declined and parts of
the old elite have acquired enormous wealth, the overall resistance to reform has weakened . Some
members of the old elite have gained so much wealth that they now want policies that safeguard thei r
acquisitions .
In contrast, reforms introduced by anti-communist governments invariably involve measure s
designed to break the extraordinary power of the old elite . In hindsight we can conclude that radica l
reform has proved the best way to eliminate subsidy-seeking behavior . In many cases it has not bee n
possible for the government to remain in power, but in all cases to date a reform "breakthrough" has
been achieved so that the reforms have so far proved irreversible . Once the old communist elite i s
broken, its power cannot be rebuilt .
Third, cross-country experience indicates several lessons for the design and implementation o f
stabilization policy . Democratization can be strongly complementary to economic reform . In particular .
reformers have found the creation of new political institutions, producing new norms as well as check s
and balances, to be valuable means of "locking-in" reform . The combination of an independen t
monetary authority and a fixed exchange, most noticeably in some form of a currency board system, ha s
proved particularly effective . A preemptive strike by a small reform group may also he effective i n
10The explanation may be the exact time of measurement . Ukraine undertook a major liberalization in earl yNovember 1994 .
5

changing the preferred actions of other groups . Foreign aid can play a key role, but only when it i s
highly conditional on policies that break the power of the old elite and permanently reduce the scope fo r
rent seeking . Rules for drawing up budgets, and resolving any political deadlock, also appear to have
been important .
Fourth, contrary to the predictions of most political economy models of reform, we find tha t
radical reform does not lead to much of a popular backlash . Radical reformers have lost election s
primarily because the pro-reform forces have been less united than the former communists . Gradualist s
are even more likely to lose elections . The public opinion poll data is quite clear : people want faste r
reforms ; and there is much more dissatisfaction in countries which have not had effectiv e
macroeconomic stabilization .
The remainder of this paper is divided as follows . Section II examines the theoretical debate an d
empirical evidence concerning the optimal intensity of stabilization . Section III considers why many
countries have pursued stabilization policies which have been less intense than appears optimal fo r
society as a whole . Section IV makes the case that immediate reform is popular and can win elections .
Section V considers lessons for the design of stabilization policy packages .
II . Stabilization and Structural Transformatio n
There is broad agreement that the overall goal of policy in post-communist countries should be t o
move in the direction of a market economy based on private property . Even Amsden, Kochanowicz and
Taylor (1994), who represent an extreme in terms of their preference for a greater role for the state an d
industrial policy during and after the transition, agree there is a need for such a transition at both th e
firm- and macroeconomic-level . There is also agreement that some degree of macroeconomi c
stabilization is required, and that this forces state enterprises to contract and pushes people into the ne w
private sector . However, there is strong disagreement about how fast and how far the budget deficit an d
subsidized credits to firms should be reduced .
Once subsidies for industry are removed, the demand for labor in the industrial sector falls . In the
standard neoclassical model, if real wages do not adjust downwards to maintain full employment, i f
workers need time to find new employment, or if the private sector takes time to create new jobs, the n
there may be unemployment during the adjustment ." The economic policy and theoretical literatur e
has presented several arguments as to why the state should intervene to slow this process . In this sectio n
we examine to what extent the theoretical reasoning is supported by the data .
"A good example of this model, applied to trade reform, is in Mussa (1986) . Blanchard (1995) uses th eframework for his discussion of transition in Eastern Europe .
6

The Case for Negative Externalitie s
According to the standard argument for early and radical reform, in the absence of externalitie s
and market imperfections, the optimal policy is to reform the economy as fast as possible .' Delay or
more gradual change can only be optimal if private adjustment costs differ from social adjustment costs .
For formerly planned economies, most of the arguments against radical reform are based on th e
idea that social adjustment costs are larger than private adjustment costs . Thus negative externalitie s
mean that economic agents will adjust too fast if left to their own devices, and the goal of policy shoul d
be to slow down the necessary changes . Four main concerns have emerged in the discussion : the
disruption of production, the creation of excessive unemployment, constraints on private sector growth .
and problems for institutional development . We review each of these arguments in turn and asses s
which theoretical points are confirmed by the evidence .
Disruption of Productio n
Probably the most hotly debated question in post-communist countries concerns whether mor e
radical reform leads to a larger fall in output . The controversy began when the Balcerowicz Plan .
implemented in Poland at the beginning of 1990, resulted in a much larger contraction in output than ha d
been expected . 13 At the same time it appeared that Hungary's more gradual reform would avoid thi s
loss. A range of explanations have appeared concerning why radical policy causes excessive falls i n
output. Other measures of performance may have more merit, but output has gained most attention . 1 4
Two main sets of theories have been developed .
First, several models assume the presence of sector specific capital which cannot be utilized i n
alternative activities . In Atcheson and Kehoe (1993) reform destroys established information capital i n
declining sectors, while new information capital takes time to develop . A similar argument is made in
Murrell and Yang (1994) . Li (1995) and Blanchard (1995) argue that reform disrupts inter-fir m
12This proposition was clearly stated by Mussa (1986) . For the case of a tariff reduction, he showed that "whe nprivate economic agents who control the disposition of productive resources have rational expectations which allo wthem to calculate correctly the values of locating these resources in alternative activities, and when there are nodistortions of the adjustment process that cause these agents to see private adjustment costs that differ from socia ladjustment costs, then the adjustment process subsequent to an immediate change of commercial policy to its lon grun optimum will be socially efficient . By implication, a slowing down of the implementation of the policy of trad eliberalization, which would reduce the privately perceived incentive to relocate resources outside of previousl yprotected industries, would result in a less socially desirable adjustment path for the economy . "
13The policies were named after Leszek Balcerowicz, Minister of Finance and Deputy Prime Minister . Theinitial official estimate of the GDP decline in 1990 was 20 percent, although this number does not appear to hav ebeen published . The latest revisions suggest instead a fall of 11 .6 percent . Taken together the latest revisednumbers suggest that GDP fell by only 8 percent from 1989 to 1994 (Luthman 1995) .
14 Output does not necessarily reflect living standards, and consumption has increased as a percentage of GD Pas post-communist countries stabilize . EBRD (1995) presents evidence that living standards increase with reform .However, living standards are harder to measure and this debate remains inconclusive . While there does appearto have been an increase in mortality and a reduction in life expectancy in Russia following the collapse of th eSoviet Union, the evidence strongly indicates that this is not the case in other reforming countries (Skolnikov 1995) .
7
relationships, particularly between suppliers and their customers . In these models, slower reform implie s
lower output losses because it allows the new sector to develop faster relative to the decline of the ol d
sector .
Second, models with important nominal rigidities also predict lower output losses when reform i s
less radical . For example, Calvo and Coricelli (1992) argue that imperfections in the credit market mea n
that state firms are starved of credit, and that output can be boosted by providing more credit . A similar
argument is made by Amsden, Kochanowicz, and Taylor (1994) who emphasize wage and pric e
rigidities. Both sets of authors argue the output fall was unnecessarily large because the anti-inflatio n
policy was "too tight ." Both imply that overly tough stabilization policy actually slowed the economi c
transition .
These theoretical arguments have been refuted by de Melo, Denizer, and Gelb (1995) who argu e
empirically that more reform has positive effects on the economy . 15 Their cross-country regressio n
results show that cumulative liberalization is positively correlated with output performance, and the y
infer that output fell less in countries where there was more reform .
However, this cross-country statistical result is not robust and disappears under reasonabl e
modifications of the specification . The first two columns of Table 3 show the effect of regressing the
cumulative output decline (from 1990 to 1995) on de Melo . Denizer, and Gelb's (1995) index o f
cumulative liberalization (1990-94), both with and without a dummy variable for the former Sovie t
Union . 16 For output change between 1990 and 1995 the liberalization index becomes insignificant onc e
this dummy variable is included .17
The last two columns in Table 3 show the relationship between cumulative output decline and
inflation for the 22 countries for which we have data .18 Again there is an apparently strong
relationship : the coefficient on inflation is significant and negative . In this case, the effect remains if we
include a dummy for the former Soviet Union . but it disappears if we include also a dummy for bein g
affected by war .
Counter to both the formal models in the literature and the empirical arguments of de Melo ,
Denizer, and Gelb (1995), there is no robust significant correlation between cumulative output loss an d
any measure of reform . Figures 2 and 3 help to explain this result . A strong relationship betwee n
reform and output decline is apparent in the large graph, but the two smaller graphs immediately sho w
15Further informal arguments, particularly that lowering inflation helps investment to recover, are offered b yEBRD (1995) . Johnson, Kouvelis, and Sinha (1996) model formally the idea that sufficiently radical reform reduce suncertainty and prevents firms from simply waiting for further developments .
16The regressions of cumulative output on cumulative liberalization (the first two columns in Table 3) exclud eMongolia and Macedonia because we could not obtain data for the full cumulative decline . With those exceptionswe use data from all the listed in Tables 1 and 2 . When we exclude Croatia and Slovenia, so no countries fro mthe former Yugoslavia are included, this does not affect the significance of any coefficients .
17Exactly the same effect of including dummies occurs if we use the level of 1995 liberalization instead o fcumulative liberalization . These results are not affected if we exclude countries from former Yugoslavia .
The missing countries are now Macedonia . Mongolia . Tajikistan . and Turkmenistan .
8

that the pattern in Central Europe and the former Soviet Union is quite different . The most plausibl e
explanation is that while every country in our sample had to endure an output decline as part of its post -
communist structural adjustment, former Soviet republics had a worse legacy due to a larger militar y
industrial sector, and their longer history of state planning, heavy industry, and allocation decision s
without an economic basis. Despite policies which ranged from the very radical to the very gradual ,
only one country in the former Soviet Union (Estonia) lost less than 40 percent of its measure d
output . 19 These countries also tended to have higher inflation and less liberalization for politica l
economy reasons, and because of the turmoil in the rouble zone particularly during 1992 .
Given this problem with cross-country data, we need to look more closely at what happened i n
countries with similar starting conditions . With the average output level in 1989 as the base, Table 4
shows how output fell before reform began, at the beginning of reform, and over the next two years . 20
Furthermore, through comparing the 1994 and 1995 numbers we can gain an overall comparative pictur e
of performance .
Countries differed markedly in terms of their initial level of reform, the extent of disruption cause d
by the break-up of previous trading arrangements, and size of the military-industrial sector . We focus
on comparisons on three sets of countries with similar starting conditions : Central Europe, particularl y
Poland compared to the other countries ; the Baltics, particularly Estonia and Lithuania : and the rest o f
the former Soviet Union, particularly Russia and Ukraine .
Within Central Europe, Poland has undoubtedly had the best cumulative performance so far . Its
1995 output was 97 .4 percent of its 1989 level, while in no other country was this measure above 8 5
percent. In 1990, when Poland was the first country to introduce radical reform, its initial outpu t
decline seemed severe . Seen now in comparative perspective, the measured fall of 11 .6 percent in 1990
and 7 percent in 1991 seem remarkably mild, and the return to growth in 1992 is impressive ,
particularly as the growth rate has steadily increased to 6-7 percent in 1995 .
How much of the Polish advantage is simply due to starting reform earlier? To take into accoun t
the timing of reform, Table 4 shows the decline in output both prior to reform, in the first year o f
reform, and subsequently . The Czech Republic and Slovakia both show a larger output fall than that o f
Poland, but better performance than in slower reforming Romania and similar results to those i n
Hungary . As is evident from Tables 1 and 2, Romania attempted some initial reforms in 1990, but
proceeded at a much slower pace . The initial output decline was smaller than in Poland, but th e
141t is unfortunately not possible to ascertain the precise size of the military-industrial sector in various countries .
However, it seems likely that while the share of this sector may have been as high as 25 percent in the USS R
(Aslund 1989), it was probably an order of magnitude less, in the range 3-5 percent, in Eastern Europe .
Output in the 1980s is also important, but here the numbers are much less reliable . For 1989, the World Bank
numbers show most countries with positive growth, ranging from the very modest in Poland (0 .2 percent) and th e
Czech Republic (0 .4 percent) to high figures in Albania (9 .8 percent) and Moldova (8 .8 percent) . These number s
do not match up at all with what we know about economic performance, particularly because there were pervasiv e
shortages and prices were often extremely distorted . We do not use them in this paper .
9

downward slide was larger and continued through 1992 . Subsequent growth has picked up but output i n
1995 was still under 82 percent of its 1989 level .
Within the former Soviet Union, Estonia -- the country with the most radical reforms -- stands out
as having done relatively well . Again the fall in 1992 seemed steep at nearly 26 percent, but th e
position in 1994 and in 1995 turns out to be relatively good . In contrast, Tables 1 and 2 show Lithuani a
began reform a little earlier but proceeded much more gradually, and Table 4 shows that while the initia l
decline was small, by 1994 Lithuanian output had fallen by almost a third more than Estonia's output .21
Russian reform was not very radical, but it was the most radical in the former Soviet Unio n
outside of the Baltics and the Kyrgyz Republic . 22 It was certainly more radical than Ukrainian reform .
And yet by 1995 we find Russian output has declined less than Ukrainian output, and much less tha n
most of the former Soviet Union (with the curious exception of Uzbekistan) . 2 3
At the very least, these direct comparisons suggest there is no evidence supporting the argumen t
that radical reform leads to a greater fall in output . Even if viewed in the least favorable light, they ar e
highly suggestive that more radical reform results in a lower output decline, other things being equal .
Furthermore, in contrast to the rather weak statistical results for cumulative output decline, Table 5
shows a significant negative relationship between the growth rate in 1995 and inflation in 1995, and a
positive relationship between growth in 1995 and the level of cumulative liberalization through 1995 . 24
Figure 4 shows that in both Central Europe and the former Soviet Union, those countries which
stabilized earlier have now started to recover . By 1996 we can expect most countries, regardless of thei r
early reform strategies, will have halted the output decline . Thus countries that entered reform early
also recovered most quickly, and hence the timing of reform affected the timing of adjustment, but th e
cross country differences in output decline in formerly socialist countries primarily reflect underlying
structural factors as well as reform strategies during 1991 to 1995 .
Unemploymen t
In the model of Blanchard, Commander, and Coricelli (1995), which is closely related to Aghio n
and Blanchard (1994), reform means a reduction in subsidies which directly causes employment cuts i n
21Lithuania also did worse than Latvia which was more radical in terms of stabilization, and about the same o nliberalization, but which was not as radical as Estonia .
22A recent study by the IMF concluded that within the former Soviet Union through 1994, the Baltics, th eKyrgyz Republic, and Moldova had done best against inflation, while the Baltics, the Kyrgyz Republic, and Russi ahad achieved most structural change (Citrin et al 1996) . This is essentially the same relative ranking as given i nour Tables 1 and 2 .
It seems likely that Uzbekistan continues to maintain subsidies that support industry . Sooner or later thes ewill fall in real terms and industrial output will decline. However, its data appear highly unreliable and reporte doutput may well remain overstated .
'Mongolia is excluded, due to lack of data, from the regression with cumulative liberalization on the right-han dside. Mongolia, Tajikistan, and Turkmenistan are excluded from the regression with 1995 inflation on the right -hand side. If the 3 former Yugoslav countries for which we have data are dropped, the only effect is that the wa rdummy becomes significant and negative in the regression with inflation on the right-hand side .
1 0

the state sector . People fired from the state sector become unemployed and need to search for a new jo b
in the private sector . Search externalities mean that it takes time to find new work and unemployment i s
created . The optimal policy for a government which takes into account this externality is to slow refor m
(compared to the standard neoclassical prescription, for example in the Mussa (1986) model) .
The relevance of this model depends on whether faster reform leads to higher unemployment .
This view is again influenced by the early experience of Poland, which had radical early reform an d
relatively high unemployment, but again cannot be maintained as a general proposition . Table 6 shows
the overall unemployment rates across the region, using the same classification of countries . Radical
reform does not necessarily imply high unemployment, and slow reform does not always mean lo w
unemployment . The Czech Republic has reformed very rapidly, and has low unemployment . Bulgaria
and Romania have proceeded much more slowly, but have high unemployment . The former Sovie t
Union has consistently lower unemployment than most of Central Europe .
The theoretical model assumes the creation of new jobs is either constant regardless of refor m
strategy or slower if reform is more radical . The empirical evidence, on the contrary, suggests there i s
no consistent relationship between output and employment across countries . Throughout the forme r
Soviet Union unemployment has remained low despite the much higher falls in output and a highl y
flexible labor market . When unemployment benefits are low in real terms, people do not register as
unemployed . Direct survey evidence suggests labor markets are extremely flexible and workers tend t o
find new jobs at the same time as they leave their old jobs . No less than one fifth of all Russian workers
found new jobs in 1993 . Thus they do not enter the pool of unemployed (Layard and Richter 1995) .
This lack of correlation between unemployment and reform strategies is confirmed by cross -
country regression analysis . As Table 8 shows, there is no correlation between unemployment (e.g ., in
1994) and cumulative liberalization through 1994 or log inflation 1991-94 (measuring the intensity o f
reform), once we include a dummy for the former Soviet Union and being adversely affected b y war.25Unemployment outcomes remain a considerable puzzle .26 Table 8 shows unemployment i s
actually higher if a country's 1994 output is higher relative to its 1989 level . However, once we includ e
the usual two dummies, this coefficient also loses its significance .27 Surprisingly, it appears that
unemployment is simply not correlated with the output decline or with any measure of the intensity o f
The coefficient on cumulative liberalization ceases to be significant when the rouble zone dummy is included .The coefficient on log cumulative inflation is insignificant when both the rouble zone and war-affected dummies ar eincluded . The same results are obtained if we use the 1993 level of unemployment, regressed on policy measure sthrough 1993 .
26Again there is measurement error, but taking this into consideration is likely to make more radical reform loo kbetter not worse . Registered unemployment is almost certainly lower than real unemployment in the former Sovie tUnion . For example, in Ukraine estimates suggest that unemployment may be above 10 percent and significantl yhigher than in Russia, where there has been more reform (International Labour Office 1995) .
The war dummy is not itself significant, but adding it reduces the absolute value of the t-statistic for the outpu tdecline from 1 .77 to 1 .14 . Dropping the ex-Yugoslav republics does not change the significance of any coefficients .
1 1

reform. Figure 5 provides a visual representation of this result with a plot of 1994 unemploymen t
against the log of inflation from 1991 to 1993 .
Direct comparisons between similar countries are again useful, particularly because there appear s
to be a large difference in outcomes between Central Europe and the former Soviet Union and, in this
case, some evidence that radical reform is more costly . Table 6 shows Poland's unemployment rose by
6 percentage points in the first year of reform, and then increased by a further 7 .5 percentage point s
over the next two years . In Albania too there was a large increase in unemployment during the most
radical reform year, although there was a subsequent fall . Slow reforming Bulgaria had an increase o f
9 .6 percentage points in its relatively intense reform year of 1991 . Unemployment in Hungary ,
however, has risen by almost as much (to 10 .9 percent in 1994) . Unemployment in Romania grew
steadily, and even surged 5 .4 percentage points in 1992, despite slow reform . The case against radical
reform is weakened substantially by the experience of the Czech Republic which had intense refor m
(measured by the liberalization index) but has experienced rather low unemployment : a 3 .3 percentag e
point increase in the year reform began, and a 0 .6 percent fall over the next two years . 2 8
In general, output decline in the former Soviet Union has been larger but unemployment remain s
lower than in Central Europe . 29 Estonia's reform policies were almost as intense as those in Poland, i n
terms of liberalization, and the stabilization was even more dramatic, but unemployment increased onl y
3.7 percentage points in the first year and 3 .3 percentage points in the following two years . The
increase in Latvia was similarly moderate . Within the Baltics there is some confirmation that more
radical reformers might have more unemployment . In 1994, Estonian unemployment was 8 .1 percent .
only slightly higher than in Latvia (6 .5 percent) but considerably above that of Lithuania (3 .8 percent) .
The Baltics also have significantly higher unemployment than the rest of the former Soviet Unio n
(although as we saw above the Baltic countries' output losses are comparable or perhaps a little less) .
The explanation is that in most of the former Soviet Union, there has been very little unemploymen t
irrespective of reform intensity . Russia's 1992 reform hardly produced any unemployment, and i n
November 1995 the official rate of registered unemployed was only 3 .1 percent, while the officia l
estimate of actual unemployment was 8 .1 percent (Russian Economic Trends 1996, p .13) . Presumably ,
registered unemployment remained below actual unemployment because unemployment benefits were s o
low . However, even the estimated actual unemployment, which is based on OECD/ILO methodology, i s
The unemployment differential between the Czech Republic and Slovakia fits the sectoral shift model of Mussa(19861 and Blanchard (1995) . Heavy industry and other contracting sectors were concentrated more in Slovakia .The high growth service sector, particularly related to tourism, is more in the Czech Republic .
'A full explanation of this phenomenon is outside the scope of this paper, and requires more empirical work .But it appears likely that a large self-employment sector offers opportunities to earn a survival wage for some, an dthat inter-household transfers take care of the rest (Johnson, Kaufmann . and Ustenko 1995) . Also labor force surve ydata generally show higher unemployment rates than those calculated using registration data . Nevertheless, it i sstill something of a mystery why more people do not register as being unemployed .
1 2

not very high. Other former Soviet republics had even lower registered unemployment in spite of hug e
declines in official output .
Reasonably interpreted, these data suggest that unemployment has been a surprisingly limite d
problem in the post-communist transition, and they give very little support to the proposition that radica l
reform leads to higher social costs .
Private Sector Development
In Aghion and Blanchard (1994) there is an additional negative externality because unemploymen t
benefits are assumed to be paid for by taxes on the private sector . If faster cuts in subsidies mean highe r
taxes, then they can slow private sector development and worsen unemployment : "even if restructurin g
increases output, its indirect effects through unemployment on private job creation may make i t
undesirable if unemployment is already high (p .317) ." Their prediction is that more radical reform lead s
to slower private sector growth, and this position is supported by the "evolutionary" arguments o f
Murrell (1992) . However, the evidence does not appear to support this position .
It is empirically hard to separate out private sector development and privatization, but som e
conclusions are possible . Private sector development is generally higher in countries with mor e
liberalization and stabilization . Figure 6 shows the relative size of the private sector plotted against lo g
inflation from 1991 to 1995 . Figure 7 shows the same measure of private sector development plotte d
against cumulative liberalization .
Table 9 shows cross-country regression results using our usual sample . Both cumulative
liberalization and the log of cumulative inflation are significant with the right signs (positive and negativ e
respectively) in a regression with share of the private sector in 1995 on the left-hand side and the usua l
dummies also on the right-hand side . 30 We obtain similar results when the dependent variable is instea d
the change in the share of the service sector in GDP from 1989-94 (measured at current prices) . The
growth of the service sector reflects the rise of new activities, usually provided by private entrepreneurs .
Table 7 shows the detailed pattern of private sector development as far as it can be ascertained .
Rapid growth in the private sector's share of the economy is only seen in radical reforming countries ,
although Hungary has also done well . In some of these countries the private sector has grown throug h
privatization (e .g ., the Czech Republic) while in the others the driving force has been the creation o f
new start-up firms (e .g ., Poland) . 31 Bulgaria and Romania . on the other hand, now have privat e
30This result is not affected if we drop the Czech Republic and Russia (the countries in which most of the privat esector growth is due to mass privatization .) Dropping the ex-Yugoslav republics causes the war-torn dummy to losesignificance in the regression of service sector change on cumulative liberalization, and causes the rouble zon edummy to lose significance in the regression of private sector share on log cumulative inflation .
31The EBRD 1995 (pp . 147-152) provides a very useful survey of the available quantitative and qualitativ eevidence on small enterprises . The latest numbers indicate that 60 percent of total employment is in small andmedium scale enterprises in Poland (p .150), compared with only 37 percent in the Czech Republic and 10 percen tin Russia . Estonia has 45 percent of total employment in this sector, while Romania has 27 percent, and Belaru shas only 6 percent (EBRD 1995, Table 9 .1) . Economies which have completely broken down may also have a lo t
1 3

sectors significantly smaller than that in Poland . The pattern in Estonia and Poland looks very similar ,
although Latvia's private sector may have grown somewhat faster . For the rest of the former Soviet
Union the numbers are not very reliable -- see for example the odd discrepancy between the 1994 an d
1995 levels in Russia and Uzbekistan . Once again, however, there is no evidence that faster reformer s
have done worse in this regard .
If anything, the cross-country regression evidence suggests that radical reformers have had mor e
private sector development, and more growth in the service sector (which tends to be mostly start-u p
firms), irrespective of whether they have also managed to introduce a mass privatization program . The
Aghion and Blanchard (1994) externality has not proven empirically important . The explanation is firs t
that the new private sector has invariably begun in the service sector, where companies are small, and i t
has proved extremely difficult for the authorities to collect taxes from these firms . In fact governments
have generally faced the opposite problem : as the private sector grows, tax revenues decline and they are
forced to cut state expenditure or raise taxes on the state sector . Second, as discussed above . a low level
of unemployment benefits has kept registered unemployment down in many countries .
Institutional Developmen t
There is also an argument, put forward by Murrell (1992) that rapid reform slows the development
of new institutions . The idea is that institutions take time to develop and gradualism provides th e
necessary opportunity . In addition, the argument is often made that without new institutions, such as a
judiciary that enforces property rights, economic reforms such as privatization may be ineffective o r
harmful (Frydman and Rapaczynski 1994, chapter 6) .
The first question to ask is whether institutional development is hindered by more rapid reform .
Measuring institutional development is hard, but the EBRD has attempted to do this for two importan t
measures : laws and legal practices : banking and financial markets (EBRD 1995, Table 2 .1) . 32 The
IMF has also ranked institutional reform and development of the government/legal framework in the
former Soviet Union (Citrin et al 1996) .
Table 10 shows regression results with these alternative indices of institutional development as th e
dependent variable, and the usual right-hand side regressors . The cumulative liberalization index i s
positive and significant in both cases, and the log of cumulative inflation 1991-95 is significant an d
negative for the IMF's measure for the former Soviet Union (and misses being significant for the EBR D
measure by the narrowest possible margin . )
The early stabilizing countries show at least as much institutional change as those with slowe r
overall reforms . The key problems, such as with the banking system or lack of enforcement fo r
of activity in the small scale sector, although this is very hard to measure . The EBRD estimates Georgia had 5 8percent of employment in this sector in 1994 .
32The EBRD index is available for all 26 countries shown in Tables 1 and 2, with the exception of Mongolia.
1 4

property rights, can usually be attributed to the postponement of real reform . If anything, the evidence
suggests institutional development is stimulated by early and radical reforms .
There is a good deal of logic behind a positive correlation between radical reform and th e
evolution of pro-market economic institutions . A government that embraces radical macroeconomi c
stabilization and fast liberalization is also likely to speed up the introduction of all kinds o f
accompanying legal changes -- these are complementary policies . At the same time, the existence o f
private enterprise and market relations creates demands for the defense of property rights, th e
enforcement of contracts and similar institutions -- this is an example of positive externalities at work .
The Role of Complementarities and Positive Externalitie s
Most of the formal academic literature on transition has focused on reasons why marke t
externalities and imperfections would lead a benevolent reformer to choose to slow reform relative to th e
prescriptions of Mussa's (1986) standard neoclassical model . In fact there are two important economi c
mechanisms that might induce such a reformer to accelerate reforms : policy complementarities, an d
positive externalities . These factors have been implicit in some of the policy analysis literature, but unti l
recently have been missing from formal models .
There are at least six categories of policy change required in moving from a planned to a marke t
economy: macroeconomic stabilization, price liberalization, liberalization of trade, privatization ,
promotion of new business development, and development of a supportive legal framework . The impact
of each of these policies may depend on whether the other reforms are pursued . For example, freein g
domestic prices will encourage firms to alter their operations to take advantage of the new opportunities .
Firms will be prompted to upgrade their operating efficiency and to alter their product mix an d
marketing strategies . But if particular industries are monopolistic, then welfare may be reduced wit h
price liberalization . This can be countered by trade liberalization so that domestic industries face foreig n
competition . The two policies combined may increase overall welfare .
When reform policies are complementary as described above, then any one has greater benefits i f
it is introduced along with others, and changing one kind of policy to be more "market-system" does no t
preclude changing other policies in the same direction . To take the obvious example . merely liberalizing
prices will have fewer benefits than liberalizing prices at the same time as stabilizing the macroeconom y
and opening up to international trade .
Friedman and Johnson (1995) develop a general formal model with complementarities . while
retaining the convex adjustment costs of other formal models (so that taking large reform measures i s
more costly than taking small measures) . 33 Even when there are market imperfections and externalitie s
33This work builds on recently developed mathematical tools which make it possible to model complementaritie sformally and to incorporate assumptions about complementarities in a wide range of models (see Athey 1995 ,Milgrom and Roberts 1990 and 1994, Milgrom and Shannon 1994) . Gates, Milgrom, and Roberts (1996) also stud ycomplementarities in transition economies .
1 5

imposing social costs, it may be more beneficial to conduct reforms in a package, and hence tak e
advantage of the complementarities across measures, rather than postpone particular reform measures . A
benevolent planner would want to consider both benefits and costs of various reform speeds . In general ,
it is not the case that the optimal reform path minimizes adjustment costs .
The complementarites approach can be extended to allow also for positive externalities . As far a s
we know there are no other models of positive externalities applied to the economic transition process .
This is surprising since they appear more obvious than negative externalities . For example, if rapid
adjustment of one firm permits others to learn how to operate more efficiently in a market system, the n
there will be externalities associated with learning . A greater number of private suppliers means mor e
competition and hence a better functioning market, with more widely available information and lowe r
costs of doing business .
The Friedman and Johnson (1995) model provides a stronger theoretical basis for thinking tha t
radical reform had important advantages in Central Europe and the former Soviet Union . Established
models probably have the right assumptions in terms of adjustment costs, but by ignorin g
complementarities they inaccurately represent the benefits of reform . Because it fails to take advantag e
of these complementarities and positive externalities, slow reform has not proved superior to radica l
reform .
III . The Politics of Refor m
The fact that slow reforms had no positive impact on social costs or economic outcomes beg s
several questions. Why did so many nations choose to introduce gradual reforms? Was it due to fals e
expectations that gradual reform would improve the situation, in which case slow reform was simply a n
error arising from misjudgment? Or was there a deeper reason in the political economy of transition ?
When analyzing these questions, it is essential to keep in mind the initial political conditions i n
these countries . With the collapse of communism, there was a political vacuum in many countries . This
vacuum had two major aspects which varied according to regions and countries .
First, there was a lack of well-defined political process for choosing leaders and defining their
powers . Elections are the most clear means of picking leaders, and where early compromises were
resolved by elections, such as in Poland and Czechoslovakia, the powers of the leadership could b e
consolidated . In other nations, such as most of central Asia with the exception of the Kyrgyz Republic ,
the former elite simply reinforced their position when Moscow's hegemony collapsed . But in othe r
countries, most visibly Russia, a battle emerged where parliaments, presidents . and government leader s
fought actively for power. Invariably this battle set the interests of the old elite, such as enterpris e
directors and former communist party officials, against the goals of younger liberal reformers that aimed
to break the old system .
Regardless of who managed to gain power, the second key characteristic of the political proces s
was that there were few checks and balances on the behaviour of the groups who became leaders . There
1 6

were no political parties with long reputations to uphold, there was limited press and investigative
journalism, and there had never been a fair system of courts and judiciary prepared to challenge an d
penalize leaders who took actions for personal gain . Historical legacy added to the problems :
communism left society deprived of moral or religious standards . Everything was allowed to those wh o
controlled public resources, and they prided themselves on exploiting their opportunities .
The lack of political process, lacks of checks and balances, and the historical legacy of exploitatio n
provided great opportunities to political leaders for both abuse of power and for enlightened change .
The ultimate outcome and economic policies can best be understood in this light . The crucial issues in
analyzing outcomes are hence : which factors determined who would gain the levers of power at the star t
of reform ; and once a power structure is in place, what incentives did the political leadership face whe n
making economic policy decisions ?
A Model of Rent-Seeking in Transition3 4
The relative power of interest groups at the start of reforms gave clear advantage to the forme r
elites . Both politically and economically, the state enterprise managers entered the transition period a s
the strongest organized group . This was most pronounced in the former Soviet Union where they
became dominant (Aslund 1995) .
The market socialist reforms that started in Hungary in 1968 and spread to the Soviet Union in th e
late 1980s aimed at making enterprises more independent of branch ministries . The idea was to
depoliticize state enterprises and thus make the managers focus on economic performance . As a result ,
state enterprise managers were relieved of most supervision by the branch ministries, their forma l
owners, but no other owners entered the stage, with partial exceptions in the workers' councils of Polan d
and Hungary . In effect, the state enterprise managers gained ever more freedom but no responsibility .
As communism and the state collapsed, the enterprise managers became more firmly in charge o f
the formally state-owned enterprises, and the formal threat of their sacking was removed . Contrary t o
many predictions, no labor or social unrest erupted, and unions remained weak and disorganized . Their
disorganization made them unable to fight as a student of the logic of collective action (Olson 1965 )
would predict .
These observations place the interests of enterprise directors, along with private interests of leaders ,
at the heart of the decision making process . This motivates our simple formalization of rent seeking a s
an explanation of inflation which is illustrated in Figur e8.35
34A rent is defined as those earnings above what is necessary to attract a factor into a particular use . "Rent -seeking" activities serve no social purpose other than to create or transfer rents . For further discussion se eBuchanan, Tollison and Tullock (1980) .
35Throughout this section we consider the government as a single agent with leaders that maximize own welfare .Uncoordinated decision making can also lead to socially costly polices - see Shleifer and Vishny (1993, 1994) o ncorruption and Aizenman (1992) on inflation .
1 7

At the end of communism most countries had a political elite that was in control of the mone y
creation process . The revenues from credit issue directly leads to inflation (denoted π) . The benefits to
the political leaders of credit issue associated with a given level of inflation is U( π) .
The perceived costs of inflation to the elite depend on who they represent, and more generally o n
the penalties imposed by the political process on leaders that take socially harmful actions . We define
their costs as αC(π), where 0 < a< 1 is a number which indexes the representativeness of politica l
leaders - i .e ., their willingness to take society's social costs of resulting inflation, C(π) into account in
their calculations of welfare . We also assume that a captures the system of checks and balances on a
politician's behavior : when a is low society and the political system do not penalize leaders who tak e
socially costly actions .
A benevolent reformer cares about all of society, so a=l, while a rent seeking elite might
represent only a fraction of the population . Figure 8 shows a static characterization of socially optima l
inflation in this rent seeking political environment . The government weighs the marginal costs an d
benefits of inflation when deciding how much credit to issue . Higher credit issue leads to highe r
inflation, and this raises marginal costs since the inflation tax is distortionary . The marginal benefits of
credit issue falls as the inflation rate rises . 3 6
If the government represents only the rent-seeking elite, and if there are no checks and balances i n
the political system that penalize self-interested leaders, then a will be low and hence the politica l
leadership's perceived costs of inflation may be quite low . This is shown by a marginal cost curv e
shifted to the right in Figure 8 . Likewise, if the financial system is undeveloped so that enterprises an d
households have difficulty avoiding the inflation tax, then money demand will stay high even when th e
credit issue is large . This will raise the marginal benefits to the political leaders from higher inflation a t
every level of inflation, so the marginal benefit curve shifts to the right . In such a situation credit issu e
would be high leading to high inflation 7r * in Figure 8 . This leads to several explanations as to wh y
credit issue may be so large, and why it should fall over time in reforming countries .
High inflation countries will be characterized by governments that represent narrow elites, and
where it is difficult to avoid the inflation tax due to archaic payments systems and financial sectors . But
if a new leader comes to power who is more representative of the population, this model predict s
inflation would fall since the new leader perceives higher costs of inflation .
Also, if the political system "normalizes" over time, for example as new interest groups develo p
and a free press emerges, so that more checks are placed on the leader's behaviour, then the incentive t o
inflate will be reduced . As people realize that the leader's actions are harmful, and that "subsidized "
36A sufficient assumption here is that the marginal revenue from credit issue associated with a unit increase i ninflation declines as the inflation rate rises . Steady-state marginal revenues would be constant in a model wher emoney demand is insensitive, but in a model such as the Cagan model, where agents conserve on money balance sas inflation rises, there will be a maximum level of seigniorage the government can obtain (i .e . U'(π) eventuall yreaches zero) .
1 8

bread does not reach the stores, they will be less tolerant of governments that use such policies to mak e
transfers .
Finally, if the financial sector gradually improves, seigniorage will be lower for every level o f
inflation and the benefits of inflation decline, so we can expect inflation to fall . As the unwillingness to
hold domestic currency increases, dollarization proceeds, and the velocity of money rises, the revenue s
from the inflation tax will fall sharply .
Evidence on Rents after Communis m
In the political vacuum at the start of reforms, it is no wonder that some leaders chose or accepted a
regime of high inflation and restrictive policies . The extent of potential gain to leaders choosing to us e
office to make transfers has been staggering, particularly in the former Soviet Union . To understan d
how these incentives impede reforms, we need to scrutinize the prime methods of rent-seeking used b y
state enterprise managers and government officials .
Table 11 shows the revenues from net credit and export rents in 16 formerly socialist countries fo r
which we could obtain data . Beside subsidized credits, the most popular means of capturing rents wa s
probably through trade restrictions . In virtually all FSU countries there are substantial quantitativ e
restrictions on natural resource exports . In Turkmenistan . Tajikistan and Kazakhstan extensive system s
of trade taxes, licenses, and quantitative controls secured a near monopoly for the state over sales o f
cotton and energy . In each case the President's office or government Ministries would directly approv e
export licenses and sales . The result is an opaque system of transfers which generates little direc t
revenue to the budget and undoubtedly breeds corruption .
The potential rents from subsidized credits, import subsidies and export controls added up to a
staggering 55-75% of GNP in Russia in 1992 .37 The battle for such resources is bound to be politicall y
difficult and it is no wonder the reformers faced strong battles against liberalization . These rents varied
substantially across countries . Countries without natural resource exports, or countries where potentia l
seigniorage revenues were smaller (notably small countries) would be predisposed to less rent seekin g
behaviour . It is not surprising that Russia and the cotton and energy rich Central Asian republics are th e
ones that have experienced the greatest resistance against foreign trade liberalization and stabilization .
There are of course many other methods by which rents can be extracted which we have no t
quantified . The most straightforward means to extract rents was to demand subsidies from the state
37During 1992 the Russian central bank issued 32 .7% of GNP in net credits to commercial banks an denterprises, the government, and former republics of the Soviet Union at minimal interest rates (see Table 11) . Inaddition the government received $12 .5 billion in bilateral credits which financed import subsidies that covered 9 9percent of the cost of some imports . Finally, the potential revenues from export taxes and the implicit values o fexport quotas and remaining quantitative trade restrictions had an approximate value of $10-25 billion (see Aslun d1995 and 1996, Boone and Fedorov 1996) . Considering that Russia's GNP was approximately $80 billion in 1992 ,these gross rents add up to 55%-75% of GNP. Of course a part of the seigniorage gains were simply transferre dback to the same enterprises that paid the inflation tax, so these numbers are in gross terms and do not reflect th enet redistribution resulting from seigniorage .
1 9

budget . The bargaining power of enterprises rested primarily with their ability to threaten strikes an d
unemployment . It was primarily large enterprises, coal mines, and other well organized groups o f
importing enterprises that gained from these threats . Direct credits from the budget were used onl y
modestly, because they have been relatively transparent and therefore difficult to defend in the political
process . 3 8
Finally, it would appear that the greatest scope for gains was through directly stealing stat e
enterprises, particularly those possessing large natural resources, notably oil and gas . The reform s
opened enormous scope for joint ventures, asset sales, and other means to effectively transfer assets an d
profits to the non-state sector and personal control . Confusion over asset ownership and pricing policie s
naturally aids those trying to transfer resources . As an indication of the scale of this transfer, the market
capitalization of the 200 biggest Russian companies traded on the stock market -- many of which are i n
the energy sector -- was only 6 percent of GDP in early 1996 (Brunswick Brokerage 1996) . However ,
such transfers may ultimately force full reform . The asset transfers strengthened the private sector, and
when transfers were legal (or later legalized) they helped define property rights over resources . While
the transfer may be extremely unequal, we can expect that as additional resources are fully transferred t o
new owners, the new owners will begin to lobby for greater liberalization in their sectors .
Could this large transfer of resources be explained as benevolence and economic rationale rathe r
than rent-seeking? The answer for most countries is decisively no . The enormous size of rents in thes e
countries shows they are well beyond the scope needed for benevolent social programs or well targete d
subsidies . A 1991 study by the IMF and other international organizations estimated that a well targete d
social safety net would have cost approximately 2 .4% of GNP, 39 and it would be hard to justify other
subsidies to industry and sensitive sectors more than 5% of GNP . In most reforming countries lo w
wages generally ensured high profitability of industry, thus it would be hard to justify much additiona l
subsidies to sensitive industries .
Yet Russian credit issue in 1992 was 33% of GNP, and all of it was highly subsidized . For the
bulk of these credits, the interest rate was 10 or 25 percent per annum, while annual inflation in 199 2
was 2500 percent . The only plausible explanation for this massive issue of subsidized credits is that th e
political system was too weak to hold it back, and that these credits permitted the anti-reform leaders t o
transfer enormous gifts or rents to their supporters (Aslund 1995) .
38Tax breaks have been widely used because they are less transparent . The most blatant example here has bee nthe exemption of the enormously profitable Russian gas monopoly Gazprom from most taxes . Similarly, the Russia n"Sports Foundation" run by President Yeltsin's tennis trainer imported most alcohol to Russia in 1994 and 1995 a sit was exempt from import tariffs and excise taxes . For 1995, the Russian Ministry of Finance valued the ta xexemptions of the Sports Foundation at no less than $6bn, or 2 percent of Russia's GDP in 1995 . Anatoli Chubais 'opposition to this exemption probably contributed to his dismissal as deputy Prime Minister in January 1996 .
39See OECD (1991), page 188 .
2 0

This explanation also provides the most convincing rationale for the close correlation betwee n
inflation and liberalization shown in Figure 1 . It is not only ignorance or poor judgement that leads to
such extreme levels of distortionary policies . Those governments that avoided a period of extreme ren t
seeking avoided both large credit issue and trade and price regulations causing rent seeking . It could be
argued that an optimizing benevolent planner would have carefully planned subsidies and interventions to
minimize social costs, but the pattern of restrictions and credit issue in slow reforming formerly socialis t
countries do not reflect such a purpose .
A simple rent-seeking explanation matches empirical outcomes well, and it is a useful framework to
understand the time pattern of reform . Several purely economic factors tend to reduce the scope fo r
rents after reform has begun .
First, as the financial system improves enterprises and households can better economize on mone y
balances, seigniorage will fall . Second, with financial stabilization the real exchange rate tends to
appreciate and this reduces the rents from natural resources, as domestic costs rise towards world prices .
Finally, commodity credits from foreign sources, as distinct from the IMF or other donors insisting o n
financial conditionality, dried up in 1992 and this reduced the third main source of financing to th e
government .
The diagram in Figure 8 shows that a reduction in seigniorage -- which all countries hav e
experienced with the improvement in the financial sector -- would reduce the benefits of rents, thu s
causing the marginal benefit curve to shift leftwards . Indeed, as shown in Figure 9, the net credit issue
in Russia declined sharply after 1992. Improvements in the financial system, and the ensuin g
opportunity to avoid the inflation tax, gave enterprises and households more opportunities to conserve o n
rouble balances, thus reducing state revenues from credits sharply after mid-1992 .
There are also important political factors that explain changing incentives for rent seeking . In
democratic countries politicians were increasingly held responsible for harmful policies by a free pres s
and popular opinion (see section IV below) . This reduces their incentives to maintain a regime o f
distortionary policies, i .e. the cost curve in Figure 8 shifts left . Even when elections were not held ,
opposition groups gained strength and organization over time both as their economic powers changed an d
with improved logistics . The harmful effects of high inflation helped unite society against inflationar y
policies . Ever more people understood -- and reacted against -- the ongoing rent-seeking .
Summarizing the Reformer's Political Choice s
The political vacuum at the start of reforms, and the enormous opportunities for rent seeking, mean t
that any group vying for reform faced an uphill battle . Hardly any norms existed . The state was wea k
as were popular representation, civil society, and public understanding of economics . The legal system
was rudimentary with irrelevant laws and a weak judiciary . The legacy of price distortions wa s
staggering, and a multitude of obsolete economic regulations persisted .
2 1

But this need not prevent reforms from being carried out and the political vacuum gave both
reformers and rent-seekers great opportunities . The political leaders in formerly socialist countries cam e
to power for many different reasons, and once in power they generally had leeway to design and carr y
out policies as they chose . President Leonid Kravchuk of Ukraine was elected on a wave of nationalis m
and then chose to buy support from vested interests through credits . But Prime Minister Tadeus z
Mazowiecki and Deputy Prime Minister Leszek Balcerowicz in Poland chose to implement real reform .
Similarly, Russian President Boris Yeltsin decided to back Yegor Gaidar and his radical reform program .
In all these cases leaders had choices based on a popular mandate to conduct reform .
The main question facing a benevolent reformer is : what is the optimal speed and design of refor m
so as to maximize social welfare? Just as with the economic arguments discussed in Section I, there ar e
political arguments that would suggest optimal reform could be either slow or fast .
For example, Dewatripont and Roland (1995) argue that gradual reform is politically optimal sinc e
it allows the government to buy compliance from interest groups that are hurt by reforms . If the
government does not buy off the opposition, the opposition will prevent or reverse reforms . In their
framework it can become too costly to buy off all groups at once, so instead the government sequence s
its reforms and buys off each group in a piecemeal fashion . Gradual reform becomes the only politicall y
sustainable outcome . "
An alternative view of the political process is that a politician, once coming to power, has a brie f
grace period in which to succeed or fail . Balcerowicz (1994) calls this period the time of "extraordinary
politics" when much can be done with relative ease that later will prove all but impossible. Soon
opponents will mobilize strength and coordinate to oppose him . Once opponents are strong, a politica l
battle ensues, and either the reformer maintains power or is eventually toppled . In such an environment
the goal of a politician in favor of broad reform will be to maximize overall social welfare to raise hi s
chances of winning these battles, and also ensuring that reforms are irreversible .
We can formalize this argument by modifying our political economy model . Suppose a benevolen t
politician who wants to conduct reform comes to power . This is a politician who cares about a larg e
fraction of the population in our previous framework, i .e ., α=1 . His subsequent choice of policies wil l
affect both the returns to society today, and his chances to win an election . If in the next period an
antireform group comes to power, they choose a different (high) inflation path π=π* . He wins the
election with probability p(pi) which depends on policy choices today . In a two period framework th e
benevolent reformer today then chooses πt , to maximize :
40 The same result is in Wei (1993), who expands on a paper by Fernandez and Rodrik (1991) to show why i tmay be optimal to gradually reform . Laban and Wolf (1993) argue that more radical reform can lower real wage sand lead to social backlash preventing reform . In these models, if the government could buy off the losers, the ycould ensure reforms were rapid .

which has a solution based on the first order conditions with :
where πst, is the socially optimal inflation rate . 41 This illustrates two clear mechanisms by which today' s
choices affect future outcomes. First, if today's policies have no effect on the probability of staying in
power next period, then p' =0, and it is clear that the leader would choose to reduce inflation accordin g
to broad social benefits (setting the marginal social benefit equal to the marginal social cost of inflation) .
But in theory, the effect of current policies on the probability of reelection can go either way .
Consistent with the model of Dewatripont and Roland (1995), if a rapid reduction in inflation reduces the
probability of winning the next election then even a benevolent reformer would prefer gradual reform .
In contrast, if reform actually raises the probability of winning elections, then p' >0, and the part y
in power would generally want to move more rapidly . This could be the case if reform undermine s
opposition and builds support sufficiently rapidly .
The second mechanism through which today's choices affect the next period outcome is throug h
their impact on the antireformer's optimal choice of it , . As we discuss in section V, it may be possible
to introduce policies which change the payoffs to subsequent politicians from high inflation . There are
both economic measures and modifications to the political process which can reduce the scope for furthe r
distortionary policies . If today's policies reduce the optimal level of inflation for all future leaders, then
reforms may be sustainable even when the government that introduces the reforms loses subsequen t
power struggles . Section V examines several examples of lessons from post-communist countries .
The framework here also demonstrates the critical role empirical analysis can play to better answe r
questions which are essential when deciding the speed of reform . Does the public tend to penalize rapi d
reform or support it? Are the chances of reform being sustained enhanced by rapid change or hurt by it ?
These are questions which theory cannot unambiguously answer . A careful examination of political an d
social outcomes can help to sort through plausible answers to these questions . We turn to these issues in
the next section .
IV . The Electoral Fortunes of Refor m
This section addresses two questions . Which policies lose elections? And does the public prefe r
gradual or rapid reform?
41Assuming U and C are strictly concave and convex respectively.
23

Which Policies Lose Elections?
Since 1992 a general impression has formed that reformers have lost most elections in the forme r
communist countries to revived communist parties, sometimes in alliance with other anti-reform group s
such as peasant parties . This perception began when the former communist party regained a
parliamentary majority in Lithuania in November 1992, and strengthened as pro-reform losses followe d
in Poland in September 1993, Russia in December 1993, Hungary in May 1994, Bulgaria in Decembe r
1994, Estonia in March 1995, and Latvia in fall 1995 . Leaving not very democratic Central Asia and
the war-torn Caucasus aside, there are fourteen formerly Soviet-type countries in Europe with at leas t
formal democracy, which makes a backlash against pro-reform parties in seven countries appear t o
represent a serious trend .
However, the election results are not as straightforward as these numbers suggest . In almost al l
countries the center-right parties have been much more fragmented than the former communist partie s
and the peasant parties . Because of mostly proportional representation with a minimum threshold fo r
obtaining seats (e .g., five percent of the votes cast), the popularity of former communists amongst the
voters has generally been lower than their share of the parliamentary seats .
Table 12 shows results for each country in the first two or three freely contested parliamentar y
elections leading up to or following the end of the communist regime.42 In the table, an ex-communis t
party is rather narrowly defined as a party arising directly out of a former communist party . In severa l
cases the communist party split into more than one party which should be considered ex-communist i n
the sense that they have a clear organizational legacy .
Table 12 shows that only in Moldova did ex-communist parties gain an absolute majority of th e
votes cast in the second parliamentary elections . In two other countries . Bulgaria and Lithuania, suc h
parties surpassed 40 percent of the votes . However, throughout the region . the electoral system
repeatedly turned a modest plurality of votes into an absolute majority of legislative seats .
In Lithuania the ex-communist Democratic Labour party received 43 percent of the votes cast i n
October 1992 but 52 percent of the seats . In the Hungarian parliamentary elections, the Socialist Party
increased its share of the votes cast from 10 .9 percent in April 1991 to only 33 .0 percent in May 1994 ,
but that sufficed for 54.4 percent of the seats . In Poland, the ex-communist Democratic Left Allianc e
increased its share of the votes cast from 12 .0 percent in October 1991 to 20 .4 percent in September
1993, while its ally the Polish Peasant Party rose from 8 .7 percent to 15 .4 percent. However, their
combined 35 .8 percent of the votes was enough to win 66 percent of the parliamentary seats, because n o
less than 34 .5 percent of the votes were cast for centrist and right-wing parties that did not cross th e
minimum threshold . A reasonable conclusion is that if the non-socialist parties had maintained sufficien t
cooperation, the ex-communists would have remained a minority in Lithuania, Hungary and Poland .
"To help comparisons we show only the first two Estonian elections, but discuss the third one below .
24

Table 12 can also be used to examine further the relation between the speed of reform and the ex -
communist comeback. Of the six countries which pursued immediate radical reform, in four case s
similar party coalitions have won the ensuing parliamentary elections . We might exclude Slovaki a
because although it has effectively been a radical reformer, the reforms originated in the former
Czechoslovakia, and the Slovakian governments have been highly unstable because of vagaries withi n
parliament . This leaves three out of five radical reforming governments having won the subsequent
elections (the Czech Republic, Albania, an d Latvia.)43
Only two governments pursuing radical reform were beaten in post-reform parliamentary elections :
the Polish government in September 1993, and the Estonian government in the third elections in March
1995 (Table 12 gives only the first and second Estonian elections) . The primary cause of the Polis h
result was the fragmentation of the non-communist vote discussed above . The Estonian governmen t
headed by Mart Laar was arguably the most purely liberal government in the region . It insisted on fully
liberal trade, cut subsidies massively, liberalized all prices, cut entitlements (notably pensions), raised th e
retirement age, and implemented a Treuhand-style privatization which sold enterprises to the rich an d
foreigners . While their radical reforms appear to gone beyond what was publicly acceptable, the
subsequent centrist coalition has not revoked these policies so far .
But what happens to governments which choose not to reform? Table 12 shows that all of the fou r
European gradualist non-socialist governments lost the next election . Furthermore, few governments
have been as badly beaten as the Hungarian and Lithuanian governments . The Russian government
managed to hang onto power but effectively lost the elections in December 1993 . The Bulgarian Union
of Democratic forces has suffered splits, and the government fell apart after an attempt at rapid refor m
in February 1991, but there was also a substantial swing to the ex-communist party in the elections o f
December 1994 .
Ex-communist governments that delay reform can also have electoral troubles (assuming the y
accept some democracy) . Although none of these countries has been fully democratic (Freedom 1995) ,
two out of four governments in this group have lost elections . In spite of several restrictions on th e
electoral process, the incumbent Presidents in Ukraine and Belarus were beaten in the summer of 1994 .
In Moldova the government won the election after delaying reform, and subsequently embraced radica l
economic policies . The Romanian government won but with a sharply reduced majority -- the ex -
communist vote fell from 67 .4 percent in May 1990 to 37 .9 percent in September 1992 .
This analysis of election results does not suggest that slowing reform raised the odds of winnin g
elections . The simple empirical record shows that as a strategy for survival radical reform may actually
raise chances of winning subsequent elections . Further, apart from Estonia . there is no clear sign of a
43 1n Albania, radical reforms were launched by democrats in a communist-led coalition government and th edemocrats won the 1992 elections . The Latvian parliament was effectively hung after the third elections in fal l1995 .
2 5

popular backlash against radical reform, and in all the cases where a reforming government has lost th e
elections, the reforms have not been reversed .44
The second conclusion is that under post-communist transition most incumbent government s
become unpopular regardless of their economic programs . In countries with slower reforms, incumben t
governments were likely to be thrown out if democratic elections were permitted . In all countries th e
ex-communist parties benefitted from better organization and less fragmentation than newer parties, an d
this helped them gain disproportionately large representation after the initial reform period .
Finally, the former communist parties have in many cases transformed themselves so that they ar e
effectively social democratic parties . There is very little backtracking even in the countries with th e
most radical early reform programs . The observer is left with the impression that people have taken al l
the economic suffering surprisingly well, and once reforms are implemented they appear irreversible .
Does the Public Prefer Gradual or Rapid Reform ?
Most of these elections have been characterized by low participation, and do not necessarily revea l
broader public opinion . In fact it has been claimed that disillusionment with reform goes much deepe r
than actually reflected in election results . To assess this position we turn to opinion poll data . In order
to have comparable numbers for the most possible countries over several years, we shall use th e
Eurobarometer, carried out by the European Commission for up to six years in 18 post-communis t
countries (European Commission 1995) .
The first relevant question is whether people perceive that their country is moving in the righ t
direction or not . Table 13 contains only the net, that is, the percentage of positive replies minus th e
percentage of negative responses . The overall pessimism is striking . Only three nations displayed a
positive outlook in 1994 : Albania, the Czech Republic and Estonia . Curiously, these three happen to b e
the three most radical reformers . In 1995, the average among the radical reformers is a net of 1 3
percent positive, in comparison with 44 percent negative among the non-socialist gradualists . Again ,
Slovakian politics are an anomaly . Not all radical reforming countries show optimism . Yet, irrespective
of regime, gradual reforms do not appear to breed greater optimism .
Table 14 shows responses to a question directly about the desired speed of reform . Strikingly ,
more people find reforms too slow, or simply absent, compared with those who find reforms too fast i n
all the countries investigated . Only the Czech Republic maintains a balance between the two . Even after
a great deal of difficult structural change with radical reform in Albania and Estonia, a large majorit y
desires faster reforms .
This picture can be further corroborated with other questions such as future expected househol d
incomes and alternative systems . showing that while the market economy is not all that popular in itself,
44In both the de Melo, Denizer, and Gelb (1995) and EBRD (1995) indices there has been almost n obacktracking. According to these measures the only country to have gone backwards on any dimension of polic yis Ukraine in 1993, i .e ., before it started real reform .
26

households expect their future incomes to rise and few see any alternative to the market economy .
Although radical reforms hardly raise the standard of living immediately, people expect they will do s o
later on. In most of the former Soviet republics, however, people are deeply dissatisfied .
In terms of the reversibility of reforms, an important indicator should be people's attitudes to th e
market economy overall . Table 15 shows attitudes were positive in all of the fast reforming countries ,
but negative among most gradual reformers in 1995 . The market economy is distinctly unpopular i n
countries where the reforms remain far from complete .
Thus, our conclusions from the election results are reinforced by the opinion polls : rapid reform
does not meet with a groundswell of political opposition that would threaten to reverse it . If we were to
use this evidence to infer the impact of rapid change on probabilities of winning elections, we would a t
worst conclude there is no correlation . Second, this evidence suggests that rapid and early reform raise s
the odds of the reform government winning elections and diminishes the risk of reversal . Experience so
far indicates that once entered into, even subsequent ex-communist governments generally support th e
continuation of reform and do not try to reverse reformist policies .
V. Economic Strategies for Irreversible Reform s
In Sections II and IV we showed there is no strong empirical evidence that economic outcomes o r
popular support were adversely affected by rapid reforms . Further, gradual reform reflected underlying
rent-seeking which contributed to slow structural adjustment and enormous income redistribution . And
country examples suggest that once reforms are embarked on, they become extremely difficult t o
reverse .
The goal of a reform leader should hence be to promote reforms by limiting the possibilities o f
rent-seeking through multiple methods . Programs should include : rules which limit policies aimed a t
squandering resources including full price and trade liberalization : measures to raise the penaltie s
associated with distortionary policies such as legislation on corruption and activities of public secto r
employees ; and also measures to ensure more intense monitoring of political leaders . Thus both
economic and political measures should form part of well-designed stabilization programs in the pos t
communist countries .
But implementing such measures is no easy task . A stark battle rages over stabilization . On the
one hand, the state enterprise managers insist on receiving subsidized credits and the like from th e
government . They use the ongoing sharp decline in output -- both before and after stabilization has bee n
attempted -- as an argument for more funds . However, the more subsidies or rent they obtain, the les s
effort they put into restructuring and raising production . The managers benefit from a prior hig h
reputation and the system in place already subsidizes them . They argue they need time for adjustment ,
but when they get the money they use it for anything but adjustment . This lobby demands loose credit
as the principal means to postpone the decline, and transfers resources to itself .
27

The reformers are in an unenviable position . They need to stop the flow of subsidies to the bi g
state enterprises, which will force them to adjust and after some time put an end to the decline i n
national output (Bruno and Easterly 1995) . However, it is counterintuitive that a disruption of subsidie s
to producers would lead to the revival of production . Moreover, post-socialist society maintains a
Marxist preoccupation with material production and large-scale industry .
Despite the apparent difficulties for reformers, post-communist experience shows an immediat e
stabilization can be politically self-sustaining . Whenever a stabilization is launched, the industrial lobb y
cries out . However, its resistance is highly dependent on the determination and intellectual and politica l
credibility of the reformers . When stabilization starts to bite, many industrial managers give up hope o f
state subsidies and start adjusting to survive in the market . At this point the industrial lobby breaks up
and reform wins .
The best example is Czechoslovakia where, at the time of radical reform, the reformers had wo n
the public debate, prevailed in parliamentary elections, and controlled all relevant government agencies .
In Poland all these mandates were weaker but that was partly compensated for with a vigorou s
introduction and pursuit of a radical reform program . In Russia, on the contrary, lacking credibility o f
radical reform aroused massive resistance from the industrial lobby, which succeeded in breaking the
attempted radical reform .
The conclusion is unequivocal : the more determined and thus credible a stabilization attempt is, th e
less the state industry protests and the earlier it starts adjusting . Soon industry is divided into
progressive market-oriented managers and regressive state-oriented managers, and the militant subsidy -
seeking industrial lobby fades away .
We now consider elements of stabilization programs that have played an important role in makin g
policies hard to reverse . We focus on five issues : the main ingredients of reform packages, preemptiv e
policy changes . poison pills, conditional assistance, and deadlines within the budgetary process .
The Main Ingredients of Reform Package s
The best way to ensure continued reforms is to break rent-seeking . In this regard our analysi s
provides further support for the position of Balcerowicz (1995) and Lipton and Sachs (1990) . Programs
must include near complete price and trade liberalization, elimination of subsidies to and preferential
treatment of producers, and early measures to better define property rights and governance over stat e
assets . Programs must also include measures which limit political payoffs and opportunities for rent -
seeking and corruption . For example, in Poland the old communist associations which threatened
reforms were dismantled : including the formal structures of the coal lobby, the union of cooperatives ,
and other important bastions of the nomenklatura (Johnson and Kowalska 1994) .
These policies must be matched by measures that penalize corruption : this must include a clear
commitment to democracy and transparency . There is no greater force to seek out corruption than a free
press . And a democratic process in combination with a free press can limit the most extreme forms o f
28

rent-seeking . Facing social criticisms, the threat of losing power, and even punishment, politicians wil l
undoubtedly weigh the costs of corruption carefully .
One clear lesson from the post-communist countries is that political checks and balances should b e
added at the top of the list of policy changes . Many of these can be added directly to IMF programs a s
part of regular conditionality . But such measures are sometimes impossible to implement at the start o f
reforms, or out of control of the leaders attempting to carry out reforms . In the following subsection s
we examine a range of more specific policies which have proven successful in particular circumstance s
in these countries .
Preemptive Policy Change s
Partial or preemptive policy changes may change the payoffs to political actors so that reforms ar e
maintained. In Ukraine there was a relative power vacuum in fall 1993 after a coal miners' strike incite d
a political battle between the parliament and President . The result of the struggle was a compromis e
agreement to hold new elections for the parliament and President . As the various groups waited for th e
elections, in December 1993 the governor of the central bank launched a single handed attempt to reduc e
inflation from hyperinflationary levels . He virtually stopped credit issue and there was an immediat e
decline in inflation and output (Figure 10) . The policies met with substantial criticism from Presiden t
Leonid Kravchuk, and he vowed to fire the governor once elections were over .
In surprise results Kravchuk lost the elections to former Prime Minister Leonid Kuchma, and onc e
Kuchma came to power he faced the choice of reversing the stabilization or agreeing to it . Given that
many of the costs of stabilization had already been borne, and if stabilization was maintained he woul d
receive conditional aid from the IMF, Kuchma was faced with a much different environment from that o f
December 1993 . By making a preemptive attack on inflation the central bank governor changed th e
incentives enough for Kuchma, which presumably contributed to his decision to continue with relatively
tight monetary policies . 4 5
A similar pattern was seen in Serbia . After hyperinflation in 1993, in January 1994 the Minister
of Finance announced a stabilization program with a pegged exchange rate . At the same time the Ser b
government announced their budget deficit would be 15% of GNP, and without other sources of
financing this could only be financed through money issue . Since they had built up enough reserves to
more than cover outstanding reserve money, the pegged exchange rate was credible for approximatel y
four to five months if the budget deficit was implemented as planned . 46 After this time we could hav e
45It was not at all clear that Kuchma would have chosen stabilization in any case . He had previously been PrimeMinister in Ukraine during a high inflation period, and in the election campaign he did not advocate stabilizatio nor radical reform .
46See the discussion in Rostowski (1995) and Beogetic, Dragutinovic, and Petrovic (1995) .
2 9

expected a run on reserves and move to higher inflation as domestic money rose above outstandin g
reserves .47
As in the Ukrainian case, the initial public support for the stabilization changed the nature of th e
political game. The reformist ministers within the government were strengthened by the early support
and success of the program as inflation fell . It was then clear that unless the budget was adjusted th e
program would break down . In April the cabinet finally agreed on a reduced deficit so failure wa s
avoided. Once again it seems likely that the early stabilization, and the subsequently changed payoffs t o
those supporting and opposing budget cuts, turned out to be sufficient to shift the balance of opinion i n
favor of budget cuts by April .
The game tree in Figure 11 helps to explain what happens . A preemptive action on the part of a
small group with some temporary power over exchange rate policy, or monetary policy, change s
subsequent incentives for political actors . The essential point in Figure 11 is that the costs of adjustmen t
(labelled E) are sunk and occur at the start . Thus the cost of maintaining stabilization is less for leaders
who come to power after the sunk costs are paid .
This is consistent with the discussion of the industrial lobby above . A partial stabilization program
that hits hard enough and remains in place long enough will cause the industrial lobby to lose power .
Before the first attempt at stabilization the industrial lobby is at its strongest, but its power steadil y
weakens if reform continues . The reformer's problem is therefore getting the policy started an d
achieving sufficient reform before the opposition becomes too strong . In order to break the asocial
endeavors of the industrial lobby and turn it to industrial restructuring, as hard a stabilization as possibl e
seems desirable .
In practice it will not be clear whether these temporary changes will be enough to ensure tha t
reforms are not reversed . In Ukraine the decision to maintain course was in part due to the change o f
leadership, but also IMF financing and a growing popular understanding . In Serbia the decision to stop
financing the war ensured the budget could be kept in reasonable balance, and fingers had already bee n
burnt from the severe hyperinflation in 1993 .
Preemptive strikes will obviously work best in an environment where the costs and benefits o f
inflation are nearly balanced, but when there are still some actors opposing deflation . It requires that
one group favoring stabilization gains control of money issue for some period . It is also helpful if th e
temporary stabilization creates costs of undoing the reform, for example because a fixed exchange rat e
has become popular, or people learn the benefits and possibilities of low inflation . In this case the
temporary policy not only incurs the sunk cost, but also sets up a type of poison pill -- any policy retrea t
will run counter to popular opinion .
In the case of perfect foresight, the run on reserves occurs in theory when the difference between the existin gstock of base money and the stock of base money demanded at the subsequent higher inflation rate, equal soutstanding foreign reserves of the central hank .
30

Poison Pill s
Poison pills are a well known device employed against corporate takeovers, but some post -
communist countries have used similar methods in their macroeconomic policies .48 The leading
example is a currency board. For example, in July 1992 the Estonian central bank governor announced
a fixed exchange rate, and introduced a currency board system . This was just prior to elections . By
introducing such a system they effectively changed the incentives of subsequent governments .
The poison pill aspect of a currency board is that it is extremely difficult to reverse without risk o f
financial turmoil . 49 Under the rules of operation: the Bank of Estonia must always buy or sell foreign
exchange on demand at a given exchange rate from all domestic entities ; there are no provisions for
suspension of foreign currency sales ; and the exchange rate is pegged with onerous procedures require d
to change it . The parliament must approve any change in the exchange rate, and this ensures there wil l
be a real risk of news leakage and hence a run on foreign reserves prior to an agreement being reache d
in parliament . Unless there was wide consensus on changing the rules, it would be dangerous for any
one group to open a Pandora's box by trying to change the system."
The second example of a poison pill also comes from Estonia . After fixing their exchange rate th e
Bank of Estonia sold future contracts up to eight years ahead, at low fees, promising to sell foreig n
exchange at 8 Kroon per DM . Approximately 4% of GNP in contracts have been sold to date - this is a
very clear example of a poison pill . Any central bank governor who in the future chooses to devalue the
currency will face losses on these outstanding future s contracts.51
The poison pill aspect of the currency board system means that it changes the political payoffs t o
policy reversals . Figure 12 shows how payoffs might change . Suppose in the first stage of a game th e
government is unsure of whether it will win an election and stay in power in the second stage . The
alternative second period government is less representative of social interests (a< 1) and hence ha s
greater incentive to cause inflation .
Suppose further that if reforms last long enough, which in this case means two periods, they wil l
not be reversed since the major proponents of reversal will be sufficiently weakened . The payoffs to
alternative policies are shown in Figure 12. If in the second stage of the game the opponents come to
power the net payoff from reversing reforms is U(πh)-αC(πh)-P when there is a poison pill and simply
U(πh)-αC(πh) when there is no pill . Here "P" is the cost imposed on the political leaders who initiat e
the poison pill . This makes it clear that there are two key criteria necessary for a poison pill to work :
48See Dower, Johnson. and Jensen (1995) for a discussion of poison pills in corporate finance .49Boone and Horder (1996) discuss issues related to poison pills in stabilization policy .
50 Of course politicians might not want to tie themselves irrevocably to such rules . For this reason it may makesense to limit the legal duration of such rules, and to prespecify the transition to a more flexible system (e .g ., acrawling peg) .
51 Personal communications with Ardo Hansson, adviser to the Prime Minister and Bank of Estonia 1992-1995 .This is obviously a dangerous policy . The Bank of Estonia runs the risk of creating interest groups, i .e . thos eholding the futures contracts, which will lobby for a devaluation !
3 1

the opponent must pay and expect a penalty when they reverse reforms : and the opponent's expecte d
penalty must be greater than the perceived net gains from policy reversal . Note that a poison pill may
also be painful for other members of society, and the risk is that if the two criteria are not satisfied ,
poison pills will backfire . It is also important to be able to limit the duration of th e pill.52
The Estonian examples are clear cases of poison pills, but the argument can be extended to othe r
policies . As described below, conditional foreign aid can have the attributes of a poison pill . Pegged
exchange rates can also lock in policies if they are popular with the public so that politicians are
penalized if they revoke the peg . Short term debt also serves as a pill . If financial markets believe the
government may alter monetary policy in the future, they will bid up interest rates today, thu s
immediately penalizing a government that needs to roll over outstanding bonds .
However, when potential gains from breaking the rules are large, such a system would be
politically ineffective . It is also a question of whether those who would suffer are those who decide .
For example if a poison pill were used to lock in stabilization which reduced rents reported in Table 11 ,
then in countries and periods where potential seigniorage revenues were largest . any plausible pill migh t
be too insignificant to prevent reversals . Seigniorage revenues are likely to be greatest in large countries
where there is less indexing to the exchange rate, and opportunities for other rents are largest i n
countries where there are substantial natural resources . In these countries poison pills are likely to b e
infeasible as mechanisms to lock in stabilization or liberalization since they would not satisfy the secon d
criterion - i .e . that the penalty is greater than potential benefits of breaking the rules . 5 3
Conditional Assistanc e
In post-communist countries where rent seeking is an important hindrance to reform, and wher e
reforms eventually weaken the opposition . conditional aid can shift the balance of power in favor of
reform when it is highly conditional on reform measures . Such reforms will be sustainable if the y
change the future political equilibrium - in this case weaken the old elite, or prevent the old elite fro m
reversing reforms or returning to power .
The chief mechanism of conditionality in the formerly socialist countries has been IMF programs .
These generally contained requirements that countries aim to reduce seigniorage/inflation, remove pric e
and trade restrictions, and liberalize foreign exchange markets . Each of these measures sharply reduce s
the scope for rents and hence will meet with opposition . These conditions illustrate how the success o f
conditional aid programs will depend on the scope for rents . For example similar amounts of aid when
measured as a fraction of GNP would be more effective in the Kyrgyz Republic or Latvia, both countrie s
"It may be possible to find a poison pill which should not be of limited duration . In his analysis of restitution ,Costello (1996) suggests that returning property to the original owners may be more politically costly to undo tha nother forms of privatization . Under the right conditions restitution could act as a form of poison pill .
The standard argument is that currency boards do not work in large countries because they are less open .However, our reasoning is different because it is based on political economy .
32

with few natural resource and little scope for seigniorage, than in Russia or cotton and energy ric h
Turkmenistan .
The main question facing reformers and aid agencies is whether once implemented, such reform s
will eventually become irreversible . If reforms do become irreversible in a short period of time, the n
early financial assistance provided highly conditional on reform measures will ensure policy measure s
remain implemented. But if reforms are reversible, then aid risks being wasted as measures are changed
the moment conditionality ends, or a new government reverses the measures .
There are good reasons to believe that the post communist era has unique aspects which made
sustainable reform more likely . The power of the old state enterprise managers peaks just before radica l
economic reforms are launched . If the reforms are successful, the old industrial elite will lose out .
They no longer have free access to state funds, and they are checked by both domestic and foreig n
competition . The main resistance against reform tends to coalesce around mechanisms generating rents .
Energy pricing has been one mainstay of rents ; collective action among kolkhoz chairmen for state
procurement backed by budget financing has been another focus ; a third kind of resistance has been th e
largest enterprises because of their sheer size. The political instability and redrawing of forces in CI S
countries has made the case for sustainability particularly strong . This makes a strong case in favor of
large and early up front aid to buttress governments that are implementing reform programs .
Aid can also be designed specifically to raise the chances of sustainability . The most clear
example of this is a conditional stabilization fund . In the cases of Poland and Czechoslovakia, a larg e
stabilization fund gave political benefits to leaders, and it also came with implicit monetary and exchang e
rate rules . If a stabilization fund is withdrawn it would substantially reduce the government's credibility
in financial markets and provide direct evidence to the population that policies are not consistent wit h
stabilization and liberal market reforms . Thus stabilization funds can then act like poison pills . A
program designed with such a fund is more likely to be sustainable than a program with conditional ai d
only . But of course, if the potential rents are large, then a country would still refuse to enter into suc h
an agreement .
Budget Process and Deadlines : Checks and Balances
While we have focused on cases where reformers are fighting off opposition from those demandin g
subsidies or rents, sometimes the risk to reforms comes from a breakdown of political process which i s
used by opponents of reform . Then it is vital to have checks and balances that defend the achieve d
system .
In theory poor economic policies can represent lack of coordination or rational indecision rathe r
than outcomes chosen by any single agent . Alesina and Drazen (1992) argue that wars of attrition ,
where one party has a veto right over decisions needed to stabilize the economy, can result in lon g
periods of socially costly inflation . In their model it is possible to introduce mechanisms that change th e
incentives of each group such that they are more willing to make early agreements and concessions .
33

According to Aizenman (1989), lack of coordination amongst policy makers drives the inflation process .
In his model each Ministry has the opportunity to effectively issue credits, say by precommiting t o
spending and building up arrears . If each of the spending agencies does not take into account the cost s
to other groups of their actions, there is a potential for high subsequent inflation in part driven by lack o f
coordination .
Similarly in post-communist societies rent-seeking groups use the lack of coordination to their own
advantage . As opposition to reform grows, rent-seeking groups find ways to obstruct and delay change .
Rules which force coordination and early decision making may help the reformer to ensure stabilizatio n
is sustainable. Indeed, in many countries lack of coordination between agencies has been an importan t
contributing cause of inflation .
In Ukraine the parliament had the legal right to make special demands for emergency credits an d
spending . This meant the government, parliament, and central bank were all effectively able to issu e
credit demands . In Russia in the early years after stabilization there was no clear process for credi t
coordination . This was further exacerbated by the right of both the government and President to gran t
tax waivers and make spending promises, and of the parliament to legislate similar changes . A grea t
deal can be done to introduce more transparency and rigor in the process and control of budgeting .
First, it is vital to bring all expenditures under the central control of the Ministry of Finance .
Under communism, the Ministry of Finance was weak and did not control all central expenditures . In
the early transition period, quasi-fiscal expenditures such as subsidized credits, exchange rate subsidies ,
and extrabudgetary funds proliferated, as well as tax exemptions .
Second, another weak institution is the central bank . Financing of the government must no longe r
be automatic nor at a minimal interest rate . The central bank should receive statutory independence . so
that it not only can but is also supposed to refuse funding for the budget .
Third, the budget process should be regularized with penalties attached which help to limit debates ,
and measures that ensure coordination between the main political actors .
In Russia the stabilization program was designed with a set of clear rules to ensure coordination .
The budget has to be adopted by the state Duma in three readings . Next it must be adopted by th e
Federation Council -- the upper chamber of parliament . The President can veto draft budget laws thre e
times and then call for the resignation of the parliament . The program also integrated a Presidential
decree which required that any spending outside of the budget agreement must be explicitly approved b y
the President . Otherwise the budget can only be revised by going through all the above procedures onc e
again . There was also a clear mechanism under the new constitution which outlined the formation o f
reconciliation teams including delegated members of the parliament and government .
The Russian rules effectively make the President the main coordinating agent . He must approve
the budget agreement reached between the parliament and the government, and he also can dismiss th e
parliament if they miss the prescribed deadlines for approval of the budget . He is responsible to ensure
that the budget is subsequently implemented as planned and he can veto spending order from all othe r
34

groups that are outside the budget . The rules have lead to an effective system that prevents excessiv e
credit issue for reasons related to lack of coordination .
The Estonians have put in place similarly stringent rules . Under the currency board system it i s
illegal for the Bank of Estonia to issue credits, hence there can be no monetary financing of th e
government deficit . In addition they have extremely rigid rules ensuring policy coordination in th e
budget process . The constitution requires that the Parliament approve a budget no later than two month s
into the fiscal year . If no budget is approved the Parliament is automatically dissolved and new election s
are held .
In the formerly socialist countries the disintegration of the political decision making process mean t
that such rules and processes were often lost . There is both the need and opportunity to design th e
budget process anew at the beginning of a stabilization program . The specifics will depend on th e
country in question, but the following are some basic rules :
(1) There should be an ultimate arbiter who has the opportunity to penalize groups which do no t
make decisions . Such penalties should be obligatory though there may be discretion as to which group i s
penalized :
(2) there must be a mechanism which ensures participation and encourages agreement between al l
major political groupings in the process :
(3) there should be clear costs which can be attributed to each group when the process break s
down and deadlines are not met, and there must also be means for resolving the crisis (such as an
election) if no ultimate agreement can be obtained :
(4) there should be a mechanism for ensuring implementation of the budget as planned and a lega l
requirements that prevent deviations outside of emergencies . There must be one arbiter held responsibl e
for deciding when deviations are legitimate .
Even when such procedural rules are included in a stabilization program, there may still be a
problem of adherence . Such rules can only work when they are part of a program which is legitimatel y
accepted by most political groups . In practice the new leaders in these countries appeared to have th e
most power at the start of their period in office . If there is a "window of opportunity" when a leade r
can implement such rules, than they may in turn become difficult to change later in time, thus locking i n
a stable budget making process which prevents wars of attrition, or inflation driven by uncoordinated
policy making .
VI . Implications for the Design of Political and Economic Refor m
The first six years of post-communist economic transformation strongly suggest the way in whic h
macroeconomic stabilization is undertaken is a key determinant of both overall performance and th e
distribution of benefits from reform . Macroeconomic stabilization and economic liberalization are
closely related because effective stabilization requires both price and trade liberalization .
35
The experiences of various countries make clear that governments can make important choices .
Some governments have tried to undertake early and radical stabilization and liberalization, while other s
have chosen to delay implementation of these policies .
Is there an economic case for delaying reform or slowing it down? On this point there is a star k
contrast between the policy prescription literature, which tends to favor radical macroeconomi c
stabilization policies, and most of the formal models, which advocate considerably slower stabilization .
The formal models tend to be based on the perception that radical stabilization causes negative
externalities which lead to some combination of larger output decline, less private sector growth, highe r
unemployment, and less pro-market institutional development .
Empirically, the evidence appears rather to suggest that immediate radical reform leads to a n
earlier but smaller total decline in output, and to an faster and larger development of the private sector .
Unemployment does not vary systematically with the pattern of reform .' The development of pro -
market institutions is more difficult to measure, but the early stabilizers appear to do rather well . Given
this evidence, it appears quite plausible that complementarities and positive externalities at least balanc e
the adjustment costs and negative externalities . In fact, the balance of evidence available so far suggest s
radical reforming countries perform better .
Why then do governments opt for gradual or delayed reform? One of the most striking facts abou t
post-communist economies is that a limited number of people have gained greatly from rent-seeking .
Unlike the externalities discussed in all the formal models, rent-seeking is closely correlated with slow o r
delayed stabilization .
The delay of reform is best explained by a model of rent-seeking in transition in which the transfe r
of resources occurs through cheap credits, which in turn directly influences the development of inflation .
The other main source of rents appears to have been arbitrage in foreign trade made possible by
domestic price controls, multiple exchange rates, and foreign trade controls . The beneficiaries of these
kinds of rents are a small elite of traders, financiers, enterprise managers, and corrupt officials .
It therefore follows that a more representative government will tend to restrict rent-seeking more ,
it understands the effects of its policies . For a limited subset of rents (subsidized credits and arbitrage i n
regulated foreign trade) we find that the gross rents were probably as high as 75 percent of GDP in
Russia in 1992, but these rents have declined sharply with subsequent liberalizations to just severa l
percent of GDP in 1995 .
Greater rent-seeking explains why inflation has been higher in the former Soviet Union than i n
Central Europe . Thus inflation reflects primarily the strength of the elite of old economic managers . It
can also be seen as a reflection of the extent to which ordinary social norms and the "rule of law" exis t
in society .
54The variation in unemployment rates is probably due more to labor market policies -- wage controls, wag eflexibility, and unionization -- than to overall economic policies . But there is still no fully satisfactory theoretica land empirical explanation for cross-country unemployment pattern .
3 6

When reformers have a real opportunity, they must aim to minimize the rent-seeking early on, a s
protracted rent-seeking leads both to greater inequality and higher social costs of transition . It is true
that sooner or later most countries do stabilize, but in the cases of late stabilization, the cause appears t o
be that the scope for extracting rents falls as enterprises, banks, and the new private sector find means t o
avoid the inflation tax . It is probably also the case that a sufficient number of members of the old
economic elite have accumulated sufficient wealth . In any case, the costs to society are almost certainl y
higher than if stabilization had been earlier .
From this perspective, the democratic political task is complementary to the essential economi c
package of stabilization and liberalization . Politically, the task is to deprive the old communist economi c
elite of its disproportionate political power . Economically, the task is to prevent these people fro m
receiving a disproportionate share of GDP. The aim is to establish a new political and economic system
through "locking-in" reforms .
The most sensible policy is to undertake an early full-fledged economic reform which is a s
consistent as possible . Any lingering trade or price regulation invariably leads to the emergence o f
rents . Reforms lead to effective adjustment in state enterprises when managers decide that they ar e
better off trying to make profits on the market rather than garner extra subsidies from th e
govemment . 5 5
If the full-fledged reform is not an immediate possibility for any reason, the standard analysi s
suggests that little can be done . The evidence from previously communist countries, however, suggests
at least four useful measures are still available . One option is to introduce a preemptive blow whic h
makes firms adjust to lower inflation . Another is to introduce a "poison pill," i .e ., pro-reform measure s
which are hard to undo . Currency boards have worked well in this regard . A third means is conditiona l
international assistance, which is the basis of IMF programs . A fourth means is a regularized budge t
process with the introduction of checks and balances . Ideally, bad decisions should be blocked and
sound decisions "locked-in" so they cannot be undone .
The conventional wisdom has become that radical reformers lose elections. Of six countries whic h
pursued radical reform, four won the first elections after launching the reforms . Of these countries, th e
Czech Republic stands out as the country which has done everything right, introducing a radical libera l
reform in such a way as to minimize rent-seeking . Moreover, the only countries in which the population
is reasonably optimistic are three of the radical reformers . Contrary to expectations, there has so far
been no backtracking in any of the reform countries . In fact it appears that a more radical reform mean s
that its achievements are safer .
In contrast, non-socialist governments that pursue gradual reform or fail to carry out radica l
reform invariably lose elections . Voters do not like massive rent-seeking and, quite rightly, blame th e
55For instance, in hindsight, we can see that Russian oil executives who resisted price hikes for oil have mad emassive fortunes by selling oil on their private account abroad, reaping a hefty profit margin, rather than botherin gabout the profits of the state enterprises they are supposed to run .
3 7

incumbent government ." Nor do the post-communist governments do well . The presidents of Ukraine
and Belarus were thrown out by the voters in 1994 following hyperinflation . Gradual reform is very
unpopular, and whoever is responsible is likely to lose any election .
Reference s
Aizenman, Joshua 1992 . "Competitive Externalities and the Optimal Seigniorage," Journal of Money Credit andBanking, 24(1), February 1992, pp . 61-71 .
Aghion, Philippe and Blanchard, Olivier 1994 . "On the Speed of Transition in Central Europe ." NBERMacroeconomics Annual . 283-318 .
Alesina, Alberto and Drazen, Allan 1991 . "Why are Stabilizations Delayed ?" American Economic Review, 81(5) ,December 1991, pp . 1170-88 .
Amsden, Alice H., Kochanowicz, Jacek and Taylor, Lance 1994 . The Market Meets its Match: Restructuring theEconomies of Eastern Europe, Harvard University Press, Cambridge .
Aslund, Anders 1989 . Gorbachev's Struggle for Economic Reform . St . Martin's Press .Aslund, Anders 1995 . How Russia Became a Market Economy . Brookings Institution, Washington D .C .Aslund, Anders 1996. "Reform vs . 'Rent-Seeking' in Russia's Economic Transformation ." Transition, January 26 ,
pp .12-16 .Athey, Susan 1994 . "Monotone Comparative Statics in Stochastic Optimization Problems ." Mimeo, November 14 ,
Graduate School of Business, Stanford University .Atkeson, Andrew and Kehoe, Patrick 1993 . "Industry Evolution and Transition : The Role of Information Capital . "
Federal Reserve Bank of Minneapolis Research Department . Staff Report 162 .Balcerowicz, Leszek 1994 . "Understanding Postcommunist Transitions," Journal of Democracy, Vol . 5, No. 4 ,
October, pp .75-89 .Beogetic, Zelijko, Dragutinovic, Diana, and Pavle Petrovic 1995 . "Anataomy of Hyperinflation and the Beginning o f
Stabilization in Yugoslavia 1992-94", unpublished paper, World Bank and Center for Economic Studies i nBelgrade .
Blanchard, Olivier 1995 . Three Clarendon Lectures . Unpublished paper, November .Blanchard, Olivier, Commander, Simon, and Concelli, Fabrizio 1995 . "Unemployment and Restructuring in Easter n
Europe and Russia ." In Simon Commander and Fabrizio Concelli editors, Unemployment, Restructuring, and theLabor Market in Eastern Europe and Russia, The World Bank, Washington D .C .
Boone, Peter and Fedorov, Boris 1996 . "The Ups and Downs of Russian Economic Reforms," in Sachs, Jeffrey an dWing-Thye-Woo editors : Comparing East Asian and East European Reform, MIT Press, forthcoming .
Boone, Peter and Horder, Jacob 1996 . "Why Formerly Socialist Countries Maintained High Inflation," mimeo ., LondonSchool of Economics .
Bruno, Michael and William Easterly 1995 . "Inflation Crises and Long-Run Growth ." National Bureau of Economi cResearch, Working Paper No .5209 .
Brunswick Brokerage 1996 . Personal Communication .Buchanan, James, Tollison, Robert, and Tullock, Gordon 1980 . Toward a Theory of the Rent-Seeking Society . Texas
A&M University Press .Calvo, G.A. and Concelli, F . 1992 . "Stabilizing a Previously Centrally Planned Economy : Poland 1990 ." Economic
Policy, April .Citrin, Daniel A., Anderson, Jonathan, Brau, Edward, Hernandez-Cata . Ernesto, Cheasty, Adrienne, Hemming,
Richard, Lahiri, Ashok K ., and Zettelmeyer, Jeromin 1996 . "Policy Experiences in the Baltics, Russia, and th eOther States of the Former Soviet Union." IMF Occasional Paper #133 .
Costello, Humphrey 1996 . " The Fox or the Farmer? An Experience Goods Approach to Property Restitution an dInvestment ." Unpublished paper, Duke University .
56Rent-seeking is the focal point of popular disapproval, even if it is frequently diverted to other objects, suc has privatization . Privatization is noticed because it is more apparent and transparent than the manipulation o ffinancial flows, but these flows tend to be worth far more than the enterprises that are privatized .
3 8

de Melo, Martha, Denizer, Cedevet and Gelb, Alan 1995 . 'From Plan to Market : Patterns on Transition . "Unpublished paper, The World Bank .
Dewatripont, Mathias and Roland, Gerard 1992a . "The Virtues of Gradualism and Legitimacy in the Transition to aMarket Economy ." The Economic Journal, 102, March, 291-300 .
Dewatripont, Mathias and Roland, Gerard 1992b . "Economic Reform and Dynamic Political Constraints ." Review ofEconomic Studies, 59, 703-730 .
Dewatripont, Mathias and Roland, Gerard 1995 . "The Design of Reform Packages Under Uncertainty," The AmericanEconomic Review, December, pp .1207-1223 .
Dower, Richard, Johnson, James and Jensen, Gerald 1995 . Applied Financial Economics, pp . 305-313 . EuropeanCommission 1995 . "Central and Eastern Eurobarometer . Public Opinion and the European Union (18 Countries 'Survey) ." No. 5, March .
EBRD (European Bank for Reconstruction and Development) 1993 . Annual Economic Outlook . London .EBRD (European Bank for Reconstruction and Development) 1993 . Transition Report . London .Fernandez, Raquel and Dani Rodrik 1991 . "Resistance to Reform : Status Quo Bias in the Presence o f
Individual-Specific Uncertainty ." American Economic Review, Vol .85, No .5, December .Fischer, Stanley and Gelb, Alan 1991 . "The process of Socialist economic transformation ." Journal of Economi c
Perspectives, Fall, 5, pp .91-106 .Freedom 1995 . "Freedom around the World," Freedom Review, January-February .Friedman, Eric and Simon Johnson 1995 . "Complementarities and Optimal Reform ." Unpublished paper, Duke
University, November .Frydman, Roman and Andrzej Rapaczynski 1994 . Privatization in Eastern Europe: Is the State Withering Away ?
Central European Press, Budapest, London, New York .Gaidar, Yegor and Karl Otto Pohl 1995 . Russian Reform/International Money, MIT Press, Cambridge .Gates, Susan, Milgrom, Paul and Roberts . John 1996 . "Complementarities in the Transition from Socialism : 34A Firm-
Level Analysis ." Forthcoming in John McMillan and Barry Naughton, editors, Reforming Asian Socialism ,University of Michigan Press, Ann Arbor .
Gomulka, Stanislaw 1992 . "Polish Economic Reform 1990-91 : Principles, Policies, and Surprises ." Cambridge Journa lof Economics, 16, 3 :355-372, September .
Gomulka, Stanislaw 1995 . "The IMF Supported Programs in Poland and Russia 1990-94 : Principles, Errors, an dResults ." Journal of Comparative Economics, 20:316-346 .
Hansson, Ardo 1994 . "The Baltic States : Poised for Growth", Ostekonomisk Rapport, Ostekonomiska Institutet ,Stockholm Institute of East European Economics, 22 April, Vol .6, No.5 .
International Labour Office, Central and Eastern European Team (1995) . The Ukrainian Challenge: Reforming Labou rMarket and Social Policy . Central European University Press, Budapest .
Johnson, Simon . Daniel Kaufmann, and Oleg Ustenko 1995 . "Complementarities . Formal Employment, and Surviva lStrategies ." Mimeo, Duke University .
Johnson . Simon, Panos Kouvelis, and Vikas Sinha 1996 . "On Optimal Reform Under Uncertainty," Mimeo . DukeUniversity .
Johnson, Simon and Loveman, Gary 1995 . Starting Over After Communism : Entrepreneurship and Economic Renewal .Harvard Business School Press .
Johnson, Simon and Kowalska, Marzena 1994 . "Poland : The Political Economy of Shock Therapy," in StephanHaggard and Stephen B . Webb, editors, Voting for Reform, Oxford University Press .
Kornai, Janos 1992 . The Socialist System : The Political Economy of Communism, Princeton University Press .Kornai . Janos 1995 . "The Political Economy of the Hungarian Stabilization and Austerity Program ." Unpublished paper .Laban . Raul and Wolf, Holger C . 1993 . "Large-Scale Privatization in Transition Economies ." The American Economi c
Review . December, 1199-1210 .Layard, Richard and Andrea Richter 1995 . "Labour Market Adjustment -- the Russian Way ." Pp . 119-147 i n
A.Aslund, editor, Russian Economic Reform at Risk, St . Martin ' s Press, New York .Leitzel, Jim 1995 . Russian Economic Reform . Routledge, London and New York .Li, Wei 1995 . "A Tale of Two Reforms ." Mimeo, Duke University .Lipton, David and Sachs . Jeffrey 1990 . "Creating a market economy in Eastern Europe : The case of Poland ." in
Brookings Papers on Economic Activity, no .1, pp .75-133 .Luthman, Sten . Personal communication . 1995 .
39

Milgrom, Paul and Roberts, John 1990 . "Rationalizability, Learning, and Equilibrium in Games with Strategi cComplementarities ." Econometrica, Vol .58, No.6 (November, 1990), 1255-1277 .
Milgrom, Paul and Roberts, John 1994 . "Comparing Equilibria ." The American Economic Review, June, vol .84, No.3 ,pp .441-459 .
Milgrom, Paul, and Shannon, Chris 1994 . "Monotone Comparative Statics ." Econometrica, Vol .62, No .1, January, 157-180.
Murrell, Peter 1992 . "Evolution in Economics and in the Economic Reform of the Centrally Planned Economies . "Chapter 3 in The Emergence of Market Economies in Eastern Europe, edited by Christopher Clague and GordonC. Rausser, Blackwell, pp .35-53 .
Murrell, Peter and Wang, Yijang 1993 . "When Privatization Should Be Delayed: The Effect of Communist Legacies o nOrganizational and Institutional Reforms ." Journal of Comparative Economics, 17, 385-406 .
Mussa, Michael 1986. "The Adjustment Process and the Timing of Trade Liberalization" In Economic Reform inDeveloping Countries, edited by A .Choksi and D .Papargeogiou, Basil Blackwell, Oxford, pp .68-124 .
OECD 1991 . A Study of the Soviet Economy . Organization for Economic Cooperation and Development, Paris .Olson, Mancur 1965 . The Logic of Collective Action . Harvard University Press, Cambridge, MA .Rostowski, Jacek 1996. "The Yugoslav Hyperinflation and Stabilization of 1992-1994 ." Centre for Economi c
Performance Discussion Paper, London School of Economics, forthcoming .Russian Economic Trends 1996 . Monthly Update . January 16 .Sachs and Warner 1995 . "Economic Reform and the Process of Global Integration ." Brookings Papers on Economic
Activity, ed . William Brainard and George Perry, 1 :1995, pp .1-95, 108-118, August .Sachs, Jeffrey D. and Woo, Wing Thye 1994 . "Reform in China and Russia," Economic Policy, April, pp.101-145 .Shleifer, Andrei and Vishny, Robert 1993 . "Corruption." The Quarterly Journal of Economics, August, pp .599-617 .Shleifer, Andrei and Vishny, Robert 1994 . "Politicians and Firms." The Quarterly Journal of Economics ,
November, pp .995-1025 .Slay, Ben 1995 . "The Polish Economy : Six Years After," Middlebury College Working Paper #95-6 .Skolnikov, Vladimir M . "Recent trends in Russian mortality : 1993-94 ." Mimeo, Moscow .Wei, Shang-Jei 1993 . "Gradualism versus Big Bang : Speed and Sustainability of Reforms ." Faculty Research Workin g
Paper Series, R93-2, John F . Kennedy School of Government, Harvard University, March .
40

Table 1 : Inflatio n
Country Year ofPeak
HighestInflation
Level inNext
Level Tw oYears
Level i n1994
Level in1995
Inflation Year Late r
Type 1 : Poland 1990 586 .0 70 .3 43 .0 32 .2 31 . 7Non-socialist Czech Rep . 1991 56 .7 11 .1 20 .8 10 .2 10 . 0
government Slovakia 1991 61 .2 10 .1 23 .0 14 .0 11 . 4
Radical Albania 1992 225 .9 85 .0 28 .0 28 .0 9 . 3Reform
Estonia 1992 1069 .0 89 .0 48 .0 48 .0 30 . 0
Latvia 1992 951 .2 109 .0 36 .0 36 .0 27 . 4
Type 2 : Hungary 1991 34 .2 22 .9 22 .5 19 .0 29 . 0Non-Socialist Bulgaria 1991 333 .5 82 .0 72 .8 89 .0 70 . 0
government Lithuania 1992 1020 .3 390 .2 72 .0 72 .0 25 . 0
Gradual Russia 1992 1353 .0 896 .0 220 .0 220 .0 184 . 0Reform
Kyrgyzstan 1993 1208 .7 280 .0 n .a . 280 .0 48 . 6
Type 3: Ex- Romania 1993 256 .0 131 .0 n .a . 131 .0 33 . 4Communis twith Moldova 1992 1276 .0 789 .0 327 .0 327 .0 25 . 4
Democratiz- Belarus 1994 2200 .0 n .a . n .a . 2200 .0 703 . 1ation
Ukraine 1993 4735 .0 842 .0 n .a . 842 .0 342 . 0
Type 4 : Ex- Kazakhstan 1994 1980 .0 n .a . n .a . 1980 .0 177 . 1Communis twithout Uzbekistan 1994 746 .0 n .a . n .a . 746 .0 254 . 0
Democratiz -ation Turkmenistan 1993 3102 .0 2400 .0 n .a . 2400 .0 2,500
(EBRD )
Type 5 : Georgia 1994 18000 .0 n .a . n .a . 18000 .0 163 . 9War-torn
Armenia 1994 5458 .0 n .a . n .a . 5458 .0 179 . 0
FormerSoviet Azerbaijan 1994 1500 .0 n .a . n .a . 1500 .0 535 . 7
UnionTajikistan 1993 2195 .0 452.0 n.a . 2195 .0 24 0
(EBRD )
Macedonia 1992 1925 .2 248 .0 65 .0 65 .0 17 . 8FormerYugoslavia Croatia 1993 1516 .0 98 .0 n .a . 98 .0 2 . 9
Other Slovenia 1992 201 .0 32 .0 19 .8 19 .8 10 . 0
Mongolia 1992 321 .0 183 .0 145 .0 145 .0 65 .0
41

Notes to Table 1
The series used is the Consumer Price Index, average in current year to average in previous year .
n .a . denotes not applicable .
Source: World Bank and IMF, as reported in de Melo, Denizer, and Gelb (1995) for all columns except the last .The last column is also World Bank data, but from a computer database, with the exception of Tajikistan andTurkmenistan which are EBRD estimates .
Notes to Table 2
n .a . denotes not applicable or not available .
Source : World Bank and IMF, as reported in de Melo . Denizer, and Gelb (1995) for all columns except the last .The last column is an average calculated by Sten Luthman (1995) from the EBRD (1995) .
The EBRD index is out of 4 (although a 4* rating is used for some measures) .World Bank index is a weighted average of change from 0 to 1 along three dimensions : internal prices, externa lmarkets, and private sector entry . It does not include the level of inflation .
4.2

Table 2 : Liberalization
Country Year ofMostIntenseReform
Prio rReformLevel
Mos tIntenseReform
Chang eover nex t2 years
Level i n1994(WorldBank)
Level in1995(EBRD)
Type 1 : Poland 1990 0 .24 0.44 0 .14 0.86 3 . 4
Non-socialist Czech 1991 0 .16 0 .63 0 .11 0 .9 3 . 6
government Republi c
Slovakia 1991 0 .16 0.63 0 .07 0.86 3 .4
Radical Albania 1992 0.24 0.42 0 .04 0 .7 2 . 6
ReformEstonia 1992 0.32 0.32 0.25 0.89 3 . 4
Latvia 1992 0.29 0.22 0.26 0.78 2 . 9
Type 2 : Hungary 1990 0 .34 0.23 0 .21 0 .86 3 . 6Non-socialist Bulgaria 1991 0 .19 0.43 0.04 0 .7 2 . 6
governmentLithuania 1991 0 .33 0.22 0.22 0 .82 3 . 0
Gradual Russia 1992 0 .1 0 .39 0.17 0 .66 2 . 7Reform
Kyrgyzstan 1992 0 .04 0.29 0.43 0 .76 3 . 0
Type 3 : Ex- Romania 1990 0 0.22 0.23 0 .71 2 . 6
Communis twith Moldova 1992 0 .1 0 .28 0.19 0 .55 2 . 7
Democratiz- Belarus 1993 0 .2 0 .13 n .a . 0 .36 2 . 1ation
Ukraine 1994 0 .13 0 .13 n .a . 0 .26 2 . 3
Type 4 : Ex- Kazakhstan 1992 0 .14 0 .21 0 .04 0 .39 2 . 1
Communis twithout Uzbekistan 1992 0.04 0 .22 0 .17 0 .43 2 . 1
Democratiz -ation Turkmenistan 1994 0.16 0 .06 n .a . 0 .22 1 . 1
Type 5 : Georgia 1992 0.22 0 .1 0 .03 0 .35 2 . 1
War-tornArmenia 1992 0.13 0 .26 0 .03 0 .42 2 . 3
FSUAzerbaijan 1992 0.04 0 .22 0 .09 0.35 1 . 7
Tajikistan 1992 0 .11 0 .09 0 .1 0 .3 1 . 7
---------- Macedonia 1990 0 .41 0 .21 0 .06 0.78 2 . 7FormerYugoslavia Croatia 1990 0 .41 0 .21 0 .1 0 .86 2 . 9
Other Slovenia 1990 0 .41 0 .21 0 .16 0.82 3 . 3
Mongolia 1991 0 .0 0 .44 0 .17 0.67 n .a .

Table 3 : Explaining Cumulative Output Decline
Dependent Variable
CumulativeOutpu tDecline
CumulativeOutpu tDecline
CumulativeOutputDecline
CumulativeOutpu tDecline
Constant 0 .32 *(0 .074)
0 .84*(0 .13)
0 .89*(0 .056)
0 .86 *(0 .046)
CumulativeLiberalizationIndex
0 .13 *(0 .029)
0 .00 3(0 .35)
- -
Log o fCumulativ eInflation1991-95
- - -0 .045*(0 .0075)
-0 .0054(0.013)
Dummy forRouble Zone
- -0 .32*(0.082)
- -0 .31 *(0 .09 )
Dummy forWar-torn
- -0 .19 *(0 .059)
- -0 .19 *(0 .081)
R2 0 .46 0 .77 0.64 0.79
Number o fObservations
24 24 22 22
* denotes significant at the 5 percent level .
Standard errors are in parentheses" denotes that a variable was not used in this regressio n
Sources :1) The war-torn dummy is one for Armenia, Azerbaijan, Croatia, Georgia, Macedonia, and Tajikistan .The rouble zone dummy is one for all members of the former Soviet Union, including the Baltics .2) The cumulative liberalization measure is from de Melo, Denizer, and Gelb (1995) . Output and inflation data ar efrom a computerized World Bank data set .
Data from all the countries listed in Tables 1 and 2 are used in these regressions, with the following exceptions dueto lack of information : the first two columns exclude Macedonia and Mongolia ; and the last two columns exclud eMacedonia, Mongolia, Tajikistan, and Turkmenistan .
44

Table 4 : Output Decline
Country Year ofMos tIntenseReform
Decline fro mend 1989 t ostart Year o fMost Intense
Decline i nYear of Mos tIntenseReform
Level 2year slate r(end
Leve lat endof1994
Levelat endo f199 5
Reform (percent) 1989 =(percent) 100 )
Type 1 : Poland 1990 n .a . -11 .6 84 .3 91 .9 97 . 4
Non -socialist Czech Rep . 1991 -1 .0 -14 .2 78 .6 80 .7 83 . 8
government Slovakia 1991 -2 .5 -14.5 74 .3 77 .9 81 .4
Albania 1992 -35 -7 .2 72 .1 72 .1 77 . 7
Radical Estonia 1992 -18 .8 -25 .8 60 .1 60 .1 63 . 7
Reform Latvia 1992 -11 .2 -43 .9 42 .6 42 .6 42 . 6
Type 2 : Hungary 1990 n .a . -3 .5 82 .5 83 .5 84 . 2
Non-socialist Bulgaria 1991 -9 .1 -11 .7 72 .3 73 .3 74 . 8
government Lithuania 1991 -6 .9 -15.0 36 .6 37 .3 39 . 2
Gradual Russia 1992 -15 .9 -18.5 51 .2 51 .2 49 . 1Reform
Kyrgyzstan 1992 -2 .0 -19.0 49 .0 49 .0 49 . 5
Type 3 : Ex- Romania 1990 n .a . -5 .6 75 .0 78 .6 81 . 9
Communis twith Moldova 1992 -19.9 -25.0 42 .7 42 .7 43 . 3
Democratiz- Belarus 1993 -15 .5 -10 .6 52 .0 60 .4 52 . 0ation
Ukraine 1994 -31 .3 -23 .0 n .a . 52 .9 47 . 6
Type 4 : Ex- Kazakhstan 1992 -12.8 -13.0 49 .6 49 .6 43 . 2
Communis twithout Uzbekistan 1992 +3 .4 -9 .5 88 .2 88 .2 83 . 6
Democratiz-ation Turkmenistan 1994 -18.6 -20 .0 n .a . 36 .0 62 . 7
Type 5 : Georgia 1992 -36 .1 -43 .4 14 .2 14 .2 13 . 5
War-tornArmenia 1992 -16.4 -52 .3 35 .7 35 .7 37 . 4
FSUAzerbaijan 1992 -12.4 -35 .2 35 .7 35 .7 32 . 6
Tajikistan 1992 -9 .3 -28 .9 45 .1 45 .1 43 . 6
---------- Macedonia 1990 n .a . n .a . n .a . n .a . n .a .FormerYugoslavia Croatia 1990 n .a . -8 .5 67 .8 66 .2 68 . 5
Other Slovenia 1990 n .a . -3 .4 82 .8 88 .5 92 . 9
Mongolia 1991 -5 .6 -9 .2 75 .2 73 .7 n .a .

Notes to Table 4
Source: The World Bank (computer database) .
Notes to Table 6
Source: The World Bank, as reported in de Melo, Denizer, and Gelb (1995) .
46

Table 5 : Explaining Growth in 199 5
Dependent Variabl e
Growth in Growth in Growth in Growth in1995 1995 1995 1995
Constant -8 .6*(2 .03)
-7 . 7(5 .3)
13 .4*(2 .36)
13 .2*(2 .65 )
CumulativeLiberalizatio nIndex
3 .52*(0 .78)
3 .31 *(1 .43)
- -
Log Inflatio nin 1995
- - -3 .47 *(0 .57)
-3 .40*(0 .83 )
Dummy fo rRouble Zone
- -0 .60(3 .45)
- -0 .28(2 .38 )
Dummy fo rWar-torn
- -0 .1 4(2 .26)
- -0 .1 0(2 .08 )
R2 0 .47 0 .47 0 .64 0 .64
Number o fObservations
25 25 23 23
* denotes significant at the 5 percent level .
Standard errors are in parenthese s"-" denotes that a variable was not used in this regression
Sources :1) The war-torn dummy is one for Armenia, Azerbaijan, Croatia . Georgia, Macedonia, and Tajikistan .The rouble zone dummy is one for all members of the former Soviet Union, including the Baltics .2) The cumulative liberalization measure is from de Melo, Denizer, and Gelb (1995) . Growth and inflation dataare from a computerized World Bank data set .
Data from all the countries listed in Tables 1 and 2 are used in these regressions, with the following exceptions du eto lack of information : the first two columns exclude Mongolia ; and the last two columns exclude Mongolia ,Tajikistan, and Turkmenistan .
L.7

Table 6 : Unemployment
Country Year ofMostIntenseReform
Unemploy -ment Prior t oMost IntenseReform Year
Unemploymen tRise MostIntense Refor mYear
Changeover nex t2 years
Level in1994(Worl dBank)
Type 1 : Poland 1990 0 .1 6 .0 7 .5 16 . 0Non-socialist Czech Rep . 1991 0 .8 3 .3 -0 .6 3 . 2
government Slovakia 1991 1 .5 10 .3 2 .6 14 . 8
Albania 1992 8 .6 18 .6 -7 .4 19 . 5
Radical Estonia 1992 0 .1 3 .7 3 .3 8 . 1Reform
Latvia 1992 0 .1 2 .0 4 .4 6 . 5
Hungary 1990 0 .3 2 .2 9 .8 10 . 9
Type 2 : Bulgaria 1991 1 .5 9 .6 5 .3 12 . 8Non -socialist Lithuania 1991 0 .0 0 .3 4 .1 3 . 8government
Russia 1992 0 .1 0 .7 1 .4 2 . 2Gradua lReform Kyrgyzstan 1992 0 .0 0 .1 0 .6 0 . 7
Type 3 : Ex- Romania 1990 0 .0 0 .0 8 .4 10 . 9Communistwith Moldova 1992 0 .0 0 .7 0 .5 1 . 2
Democratiz- Belarus 1993 1 .0 0 .5 n .a . 2 . 1ation
Ukraine 1994 0.4 0 .0 n .a . 0 . 4
Type 4: Ex- Kazakhstan 1992 0 .1 0 .4 0 .5 1 . 0Communis twithout Uzbekistan 1992 0.0 0 .1 0 .2 0 . 3
Democratiz -ation Turkmenistan 1994 0.0 0 .0 n .a . 0 .0
Type 5 : Georgia 1992 0.0 5 .4 n .a . 8 .4 (1993 )War-torn
Armenia 1992 3 .5 2 .7 2 .1 5 . 6
FSUAzerbaijan 1992 0 .1 0 .1 0 .7 0 . 9
Tajikistan 1992 0 .0 0 .3 1 .4 1 . 7
---------- Macedonia 1990 n .a . n .a . n .a . 19 . 0FormerYugoslavia Croatia 1990 0 .0 9 .3 8 .5 18 . 0
Other Slovenia 1990 2 .9 2 .8 6 .4 14 . 5
Mongolia 1991 n .a . n .a . n .a . n .a .
48

Table 7 : Private Sector Developmen t
Country Year ofMost
Prio rPrivate
Increasein Year
Chang eover next
Level i n1994
Level i n199 5
Intense Sector of Most 2 years (rough
Reform Share of Intense estimate )GDP Refor m
Type 1 : Poland 1990 28 .6 2 .8 16 .8 56 .0 60
Non-socialist Czech 1991 12 .3 5 .0 17 .8 56 .3 70
government Republi c
Slovakia 1991 n .a . n .a . n.a . 43 .8 60
Albania 1992 n .a . n .a . n .a . n .a . 60
Radical Estonia 1992 17 .7 4 .3 13 58 .0 6 5
Reform Latvia 1992 12 .0 19 .0 16 .0 53 .0 60
Type 2 : Hungary 1990 14 .9 n .a . n .a . n .a . 60Non-socialist Bulgaria 1991 7 .2 n .a . 19 .3 40 .2 4 5
governmentLithuania 1991 11 .6 3 .8 n .a . n .a . 55
Gradual Russia 1992 10 .1 3 .9 11 .0 25 .0 5 5Reform
Kyrgyzstan 1992 n .a . n .a . n .a . 58 .0 40
Type 3 : Ex- Romania 1990 12 .8 3 .6 10 .0 35 .0 40
Communistwith Moldova 1992 36 .0 2 .0 n .a . n .a . 3 0
Democratiz- Belarus 1993 8 .1 n .a . n .a . n .a . 1 5anon
Ukraine 1994 7 .5 n .a . n .a . n .a . 3 5
Type 4 : Ex- Kazakhstan 1992 12 .2 n .a . n .a . 20 .2 25
Communistwithout Uzbekistan 1992 9 .8 -3 .2 n .a . 54 .2 3 0
Democratiz-ation Turkmenistan 1994 n.a . n .a . n .a . n .a . 1 5
Type 5 : Georgia 1992 27 .3 12 .7 19 .6 60 .0 3 0
War-tornArmenia 1992 24 .2 12 .5 n .a . n .a . 45
FSU Azerbaijan 1992 n.a . n .a . n .a . n .a . 25
Tajikistan 1992 n.a . n .a . n .a . n .a . 1 5
---------- Macedonia 1990 n.a . n .a . n .a . n .a . 40
FormerYugoslavia Croatia 1990 8 .5 n .a . 16 .0 44 .9 4 5
Other Slovenia 1990 8 .1 3 .3 8 .1 n .a . 4 5
Mongolia 1991 n.a . n .a . n .a . n .a . n .a .
14.9
Notes to Table 7
Sources : All columns except the last are from EBRD 1995, Table 1, p .28, and Table 3, p .30 . The last column i sfrom EBRD 1995, Table 2 .1, with the following exceptions .Bulgaria and Croatia "previous level" is for 1989 and from EBRD Annual Economic Outlook, September 1993 ,Table 3 .1, p .62 .The first two columns for Estonia and Uzbekistan are from EBRD Annual Economic Review, September 1993 ,Table 3 .2, p .63 . For Estonia the first two columns are not consistent with the numbers given in the next tw ocolumns .The second column for Armenia is calculated as the difference between numbers in EBRD Annual Economi cReview, September 1993, Table 3 .2, p .63 and EBRD 1995, Table 2 .1 .
All estimates are for the "pure" private sector, i .e ., excluding cooperatives and, as far as possible, for 100 percen tprivately owned companies, but the Moldovan number is the share of employment in the "non-state" sector . Thenumbers include agriculture (e .g ., this is why the prior private sector share is so high in Poland . )
The decline in private sector share from 1994 to 1995 in Kyzgyzstan, Uzbekistan, and Georgia probably reflect smeasurement problems .
50

Table 8Explaining Unemploymen t
Dependent Variabl e
1994Unemploy-ment
1994Unemploy -ment
1994Unemploy -ment
1994Unemploy -ment
1994Unemploy -ment
1994Unemploy -ment
Constant -2 .65(1 .91)
7 .44(3 .84)
13 .7*(2 .19)
13 .2*(1 .47)
-1 .86(3 .71)
19 .4*(5 .64)
CumulativeLiberalizationIndex
4.29 *(0 .73)
1 .67(1 .04)
- - - -
Log o fCumulativ eInflation1991-94
- - -1 .1 *(0 .33)
-0 .0022(0.43)
- -
CumulativeOutpu tDecline1990-94
- - - - 14 .42 *(5 .86)
-7 .68(6 .76 )
Dummy forRouble Zone
- -8 .02*(2 .5)
- -11 .3*(2 .72)
- -13 .0*(2 .41 )
Dummy forWar-torn
- 3 .3 1(1 .64)
- 3 .14(2 .15)
- 1 .00(2 .3 )
R2 0 .6 0 .76 0 .33 0 .73 0 .22 0.72
Number o fObservations
25 25 25 25 24 24
* denotes significant at the 5 percent leve l
Standard errors are in parentheses" denotes that a variable was not used in this regressio n
Sources :1) The war-torn dummy is one for Armenia, Azerbaijan, Croatia, Georgia, Macedonia, and Tajikistan .The rouble zone dummy is one for all members of the former Soviet Union, including the Baltics .2) Unemployment and the cumulative liberalization measure are from de Melo, Denizer, and Gelb (1995) . Inflationdata are from a computerized World Bank data set . We use 1994 unemployment levels, except for Georgia wher ewe use the 1993 level (due to not having the 1994 number) .
Data from all the countries listed in Tables 1 and 2 are used in these regressions, with the following exceptions du eto lack of information : the first four columns exclude Mongolia ; and the last two columns exclude Macedonia andMongolia .
e l

Table 9Explaining Private Sector Developmen t
Dependent Variabl e
Private Sector Share o fEconomy (1995)
Change in Service Secto rShare (1989-94 )
Constant 9 . 3(12.1)
64 .1*(3 .7)
-12 . 6(9 .7)
17 .1 *(3 .77)
CumulativeLiberalizationIndex
12 .8*(3 .28)
- 7 .0*(2 .7)
-
Log o fCumulativ eInflation1991-94
- -4 .9 *(1 .05)
- -2 .7*(1 .1 )
Dummy forRouble Zone
9 . 6(7 .9)
16 .2*(7 .4)
8 . 0(6 .3)
11 . 6(7 .3)
Dummy forWar-torn
-9 . 5(5 .2)
8 . 8(6 .2)
-14.9*(4 .5)
-6 . 5(6 .2)
R2 0 .61 0 .66 0 .49 0 .49
Number o fObservations
25 23 26 24
* denotes significant at the 5 percent leve l
Standard errors are in parentheses" denotes that a variable was not used in this regressio n
Private sector share is the EBRD (1995) estimate .Service sector share is from de Melo, Denizer, and Gelb (1995), Table 6a, "Sectoral Shifts at Current Prices, 1989 -94 .
Data from all the countries listed in Tables 1 and 2 are used in these regressions, with the following exceptions du eto lack of information : the first column excludes Mongolia ; the second excludes Mongolia, Tajikistan . andTurkmenistran ; and the last two columns exclude Tajikistan and Turkmenistan .
52

Table 10Explaining Institutional Developmen t
Dependent Variable
EBRD measure ofinstitutions
IMF measure o finstitutions(FSU only)
Constant 3 .2*(0 .92)
9 .14(0 .44)
1 .04*(0 .47)
6 .6*(0 .89 )
CumulativeLiberalizatio nIndex
1 .5 *(0 .25)
- 1 .5 *(0 .26)
-
Log ofCumulativeInflatio n1991-95
- -0 .25(0 .13)
- -0 .36 *(0 .1 )
Dummy fo rRouble Zone
0.34(0 .6)
-0 .87(0 .88)
- -
Dummy fo rWar-torn
-1 .2*(0 .4)
-0 .2 8(0 .74)
-0 .83**(0 .38)
-0 . 3(0 .7)
R2 0 .85 0.65 0 .81 0 .67
Number o fObservations
25 23 15 13
* denotes significant at the 5 percent leve l** denotes significant at the 6 percent leve l
In the EBRD measure regression, the log of cumulative inflation is significant at the 6 percent level .Standard errors are in parentheses"-" denotes that a variable was not used in this regressio n
The EBRD measure is taken from EBRD (1995, Table 2 .1) by adding the scores for legal reform, banking reform ,and security market reform (the last three columns of this table) .The IMF measure is taken from Citrin et al (1996) by assigning a numerical value of 1 to "little," 1 .5 to"little/moderate," 2 to "moderate," 2 .5 to "moderate/substantial," and 3 to "substantial ." The scores for institutiona lreform and government/legal framework are then added together .
Data from all the countries listed in Tables 1 and 2 are used in these regressions . with the following exceptions du eto lack of information : the first column excludes Mongolia; the second column excludes Mongolia, Tajikistan an dTurkmenistan ; and the last two columns exclude all countries not previously in the Soviet Union . as well a sTajikistan and Turkmenistan .
53

Table 1 1
Net Revenue from Credit Issue and Extent of Natural ResourceEndowments in Various Formerly Socialist Countrie s
at the start of transitio n
Net Revenue fromCredit Issue
( %GNP: 1992)
Natural ResourceExports Outside FS U
($ million )
Albania 3 .2 0
Armenia - 5 1
Belarus 23 .7 0
Estonia -0 .4 0
Kazakhstan n . a . 1052
Latvia 2 .1 0
Lithuania - 0
Moldova 9 .7 0
Russia 32 .7 26000
Tajikistan 30 .9 31 3
Turkmenistan 13 .0 105 6
Ukraine 28 .7 -
Poland 2 .1 -
Czech 2.4 -
Bulgaria 5 .9 -
Romania - -
Notes :1. Net revenue from credits is calculated as the total net increase in creditsfrom the monetary authorities to the government and commercial bank sdivided by GNP . Quarterly figures based on IMF estimates were averagedto get year totals .2. Natural resource exports included energy, minerals and other raw materials .3. Figures still to be updated .
54

1 These countries are classified as unfree by Freedom House . Freedom Review 19 0 5, v 2' . No . 1 pp . 12-1 32 Political parties were not allowed during these elections.3 Includes the Agrarian part yna = not applicabl e
Sources . Inter-Parilamentary Union . Chronicle of Parliamentary Elections and Developments, Vol 23(1988)-29119951 .
CSCE . Elections in Central and Eastern Europe . December 19 9 0 . Facts on File World News Digest

Table 13Opinion about Direction of the Country
Net Percentage Positiv e
Country 1990 1991 1992 1993 1994 199 5
Type 1 : Poland 13 -41 -29 -4 -30 7Non -socialist Czech Republic 37 17 24 28 25 24
governmentSlovakia 13 -30 -1 -32 -39 -27
Albania n .a. 41 60 56 29 63
RadicalReform
Estonia n .a. 30 7 23 17 24
Latvia n .a. 47 -17 7 -9 -1 3
Type 2 : Hungary n.a. -19 -14 -47 -34 -6 9
Non -socialist
Bulgaria 4 38 2 -37 -39 - 8
government Lithuania n .a. 28 -39 -47 -49 -52
GradualRussia n .a. -12 -24 -16 -51 -46
Reform Kyrgyzstan n.a. n .a . n .a . n .a . n .a . n .a .
Type 3 : Ex- Romania n.a. 26 -7 -6 -6 -1 3Communistwith Moldova n.a. n .a . n .a . n .a . n .a . n .a .
Democratiz -ation
Belarus n .a. n .a . -16 -51 -32 -3 6
Ukraine n.a. n .a . -24 -63 -55 -5 1
Type 4 : Ex -Communist
Kazakhstan n .a . n .a . n .a . n .a . -33 6
without Uzbekistan n .a . n .a . n .a . n .a . n .a . n .a .
Democratiz-ation Turkmenistan n .a . n .a. n .a . n .a . n .a . n .a .
Type 5 : Georgia n .a . n .a. n .a . n .a . -39 1 3War-torn
Armenia n .a . n .a. -49 -49 -60 -3 1
FSUAzerbaijan n .a . n .a . n .a . n .a . n .a . n .a .
Tajikistan n .a . n .a . n .a. n .a . n .a . n .a .
--------- -Former
Macedonia n .a . n .a . n .a. n .a . n .a . n .a .
Yugoslavia Croatia n .a . n .a . n .a . n .a. n .a . 5 0
Other Slovenia n .a . n .a . 40 -5 8 9
Mongolia n .a . n .a . n .a . n .a . n .a . n .a .
n .a . denotes not available .
56

Table 1 4Opinion in 1994 About Speed of Reform
Country (1) Too Slow (2) Too Fast (1) minus (2)
Type 1 : Poland 51 15 3 6
Non-socialist Czech Republic 28 26 2
government Slovakia 64 13 5 1
Albania 39 18 2 1
Radical Estonia 48 9 3 9
Reform Latvia 62 11 5 1
Hungary 48 13 3 5Type 2 :Non- Bulgaria 67 7 60
socialis tgovernment
Lithuania 52 19 3 3
Russia 59 18 4 1GradualReform Kyrgyzstan n .a . n .a . n .a .
Type 3: Ex- Romania 58 15 4 3Communis twith Moldova n .a . n .a . n .a .
Democratiz- Belarus 67 8 59ation
Ukraine 65 12 5 3
Type 4: Ex- Kazakhstan 59 14 45Communis twithout Uzbekistan n .a . n .a . n .a .
Democratiz -ation Turkmenistan n .a . n .a . n .a .
Type 5 : Georgia 74 4 70War-torn
Armenia 72 12 70
FSUAzerbaijan n .a . n .a . n .a .
Tajikistan n .a . n .a . n .a .
---------- Macedonia n .a . n .a . n .a .FormerYugoslavia Croatia n .a . n .a . n .a .
Other Slovenia n .a . n .a . n .a .
Mongolia n .a . n .a . n .a .
n .a . denotes not available .The Table shows responses to the question : Are Your Country's Economic Reforms Too Fast or Too Slow ?
.5 7
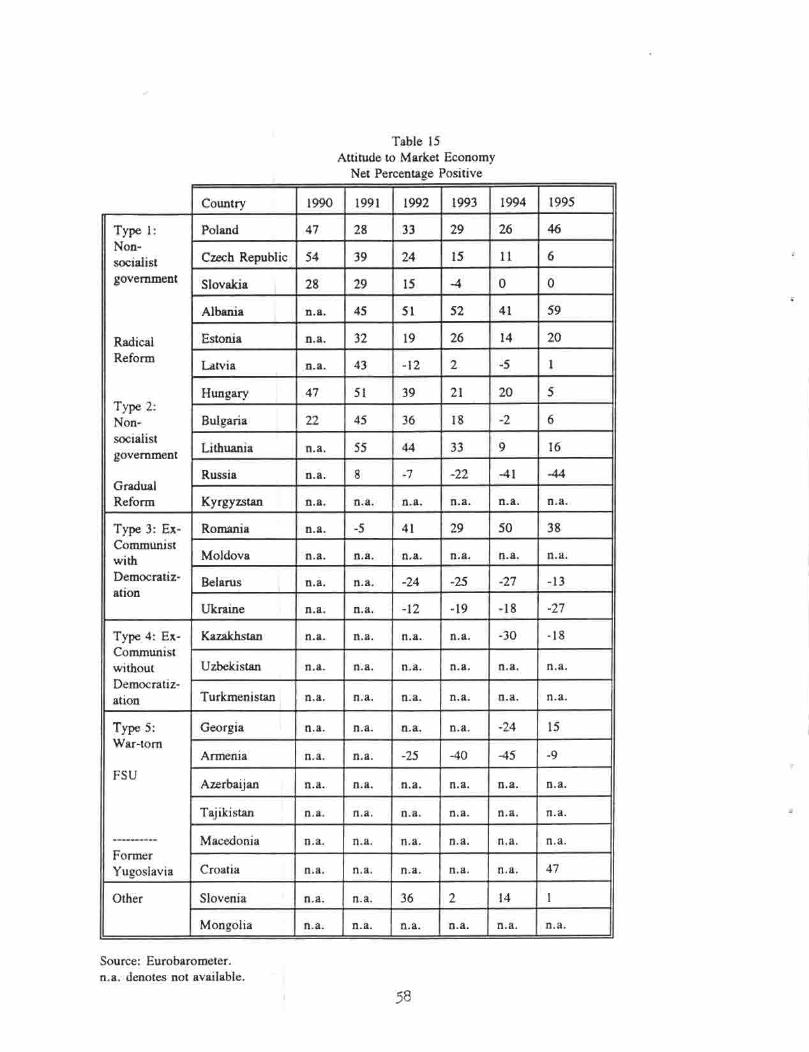
Table 1 5Attitude to Market Economy
Net Percentage Positiv e
Country 1990 1991 1992 1993 1994 199 5
Type I : Poland 47 28 33 29 26 46Non-socialist Czech Republic 54 39 24 15 11 6
government Slovakia 28 29 15 -4 0 0
Albania n.a . 45 51 52 41 59
Radical Estonia n .a . 32 19 26 14 20
ReformLatvia n .a . 43 -12 2 -5 1
Type 2 :Hungary 47 51 39 21 20 5
Non- Bulgaria 22 45 36 18 -2 6
socialistgovernment Lithuania n.a . 55 44 33 9 1 6
GradualRussia n .a . 8 -7 -22 -41 -44
Reform Kyrgyzstan n.a . n .a . n .a . n .a . n .a . n .a .
Type 3 : Ex- Romania n.a . -5 41 29 50 3 8Communis twith Moldova n.a . n .a . n .a . n .a . n .a . n .a .
Democratiz-ation
Belarus n .a . n .a . -24 -25 -27 -1 3
Ukraine n .a . n .a . -12 -19 -18 -27
Type 4: Ex-Communist
Kazakhstan n.a . n.a . n .a . n .a . -30 -1 8
without Uzbekistan n .a . n .a . n .a . n .a . n .a . n .a .
Democratiz-ation Turkmenistan n .a . n .a . n .a . n .a . n .a . n .a .
Type 5 :War-torn
Georgia n .a . n .a . n .a . n .a . -24 1 5
Armenia n .a . n .a . -25 -40 -45 - 9
FSUAzerbaijan n .a . n .a . n .a . n .a . n .a . n .a .
Tajikistan n .a . n .a . n .a . n .a . n .a . n .a .
FormerMacedonia n .a . n .a . n .a . n .a . n .a . n .a .
Yugoslavia Croatia n .a . n .a . n .a . n .a . n .a . 47
Other Slovenia n .a . n .a . 36 2 14 1
Mongolia n .a . n .a . n .a . n .a . n .a . n .a .
Source : Eurobarometer .n .a . denotes not available .
58

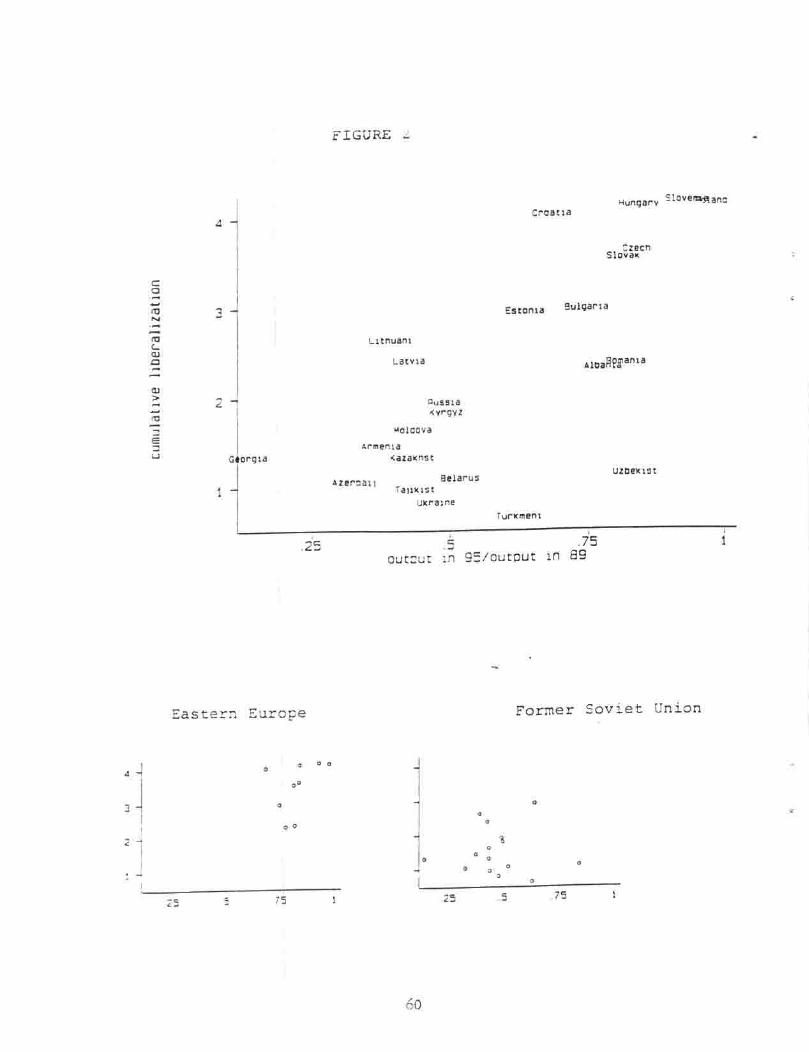
60

6 1

62


64


FIGURE 9
.57

FIGURE 1 0
Ukrainian Output and Inflatio n(CPI monthly, ind . prodn 1990=100
68

FIGURE 1 1
69
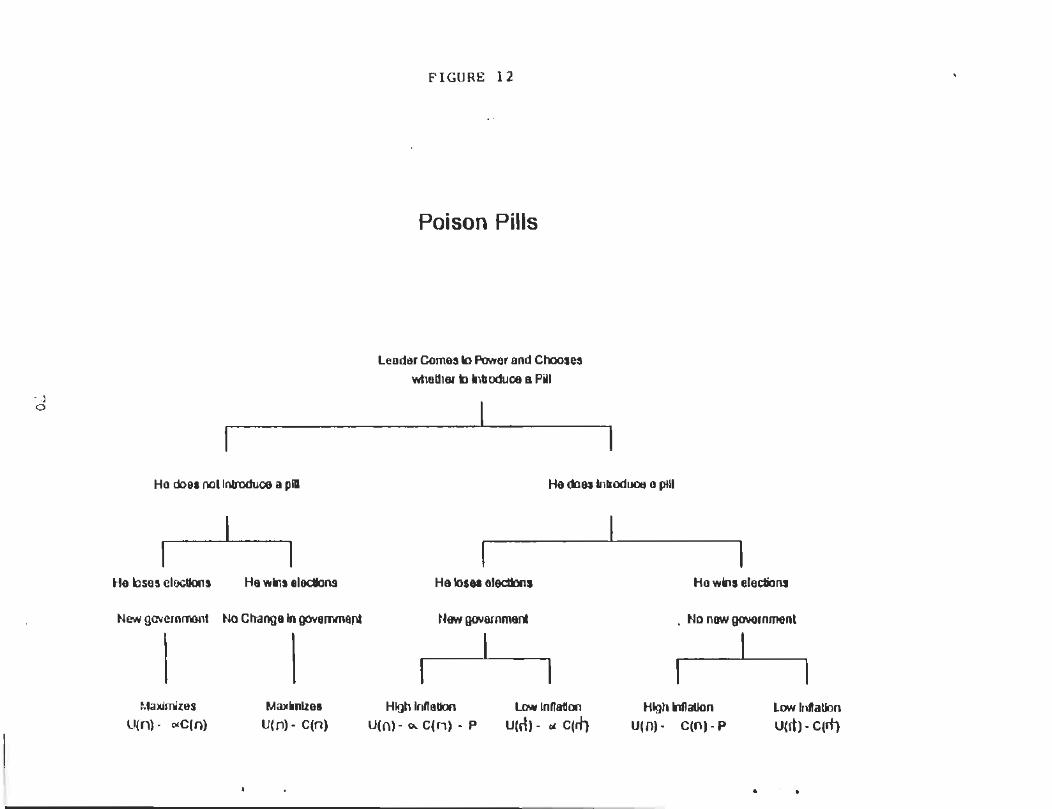
FIGURE 1 2
Poison Pills


![& Beyond The Ideological Struggle Soviet & Eastern Bloc Nations [“Iron Curtain”] US & the Western Democracies GOAL spread world- wide Communism GOAL.](https://static.fdocuments.in/doc/165x107/56649f1f5503460f94c3820a/-beyond-the-ideological-struggle-soviet-eastern-bloc-nations-iron-curtain.jpg)

