The nasdaq dozen
15
The NASDAQ Dozen: Analyze a Stock in 12 Easy Steps Do you suffer from analysis paralysis? Do you have a stock you are interested in buying but you don't have the foggiest idea of where to even start a proper analysis? We can help. Investing today is much different than it was 50, or even 20 years, ago. Whereas your parents and grandparents could only get a limited amount of stock data in the daily newspaper, you have access to a seemingly unlimited amount of data on every publicly traded stock. This is both a blessing and a curse. With access to so much information, many investors get lost in the details and are never able to make a decision. However, if you know where to look, having access to the information can help you make more informed investment decisions. Let's take a look. You can actually conduct a thorough analysis of any stock in 12 easy steps: a process we call the NASDAQ Dozen. As we get started, it is important to remember that the NASDAQ Dozen is neither a crystal ball nor a guarantee of success. Rather, it is a rational, repeatable process for analyzing the most important fundamental and technical aspects of any stock. You also need to remember that no stock is perfect. If you look hard enough, you can always find something that is wrong with a stock. On the other hand, if you look hard enough, you can always find something good about a stock. The trick is to invest in stocks that have more good qualities than bad. Here's where the NASDAQ Dozen comes in. By looking at 12 key aspects of any stock you are interested in, you can quickly determine if the stock is one worth pursuing or one better left alone. To score the 12 factors of the NASDAQ Dozen, you need to assign each factor either a passing or a failing grade. After you have scored all 12 factors, add up the passing grades and compare them to the failing grades. If you have a high ratio of passing grades compared to failing grades, you can be more confident in the stock. Conversely, if you have a low ratio of passing grades compared to failing grades, you would be less confident in the stock. For instance, you would feel more comfortable investing in a stock that had 10 passing grades and only two failing grades-a ratio of 10:2-than you would investing in a stock that only had four passing grades and eight failing grades-a ratio of 4:8. Let's get started and learn how to score each of the 12 factors in the NASDAQ Dozen. When you go to the NASDAQ.com home page, look for the Get Stock Quotes window and enter the ticker symbol for the stock you are interested in evaluating. In this example, we will enter WMT , the ticker symbol for Wal-Mart Stores, Inc. (see Figure 1). Figure 1-NASDAQ.com Home Page Once you have entered the ticker symbol, a drop-down menu will appear. Click on the Revenue/EPS link under Fundamentals to get started with the first step in the NASDAQ Dozen (see Figure 2).
-
Upload
joanmgaig -
Category
Economy & Finance
-
view
61 -
download
3
Transcript of The nasdaq dozen
The NASDAQ Dozen: Analyze a Stock in 12 Easy Steps
Do you suffer from analysis paralysis? Do you have a stock you are interested in buying but you
don't have the foggiest idea of where to even start a proper analysis? We can help.
Investing today is much different than it was 50, or even 20 years, ago. Whereas your parents and
grandparents could only get a limited amount of stock data in the daily newspaper, you have access to a
seemingly unlimited amount of data on every publicly traded stock. This is both a blessing and a curse.
With access to so much information, many investors get lost in the details and are never able to make a
decision. However, if you know where to look, having access to the information can help you make more
informed investment decisions. Let's take a look.
You can actually conduct a thorough analysis of any stock in 12 easy steps: a process we call the
NASDAQ Dozen.
As we get started, it is important to remember that the NASDAQ Dozen is neither a crystal ball nor a
guarantee of success. Rather, it is a rational, repeatable process for analyzing the most important
fundamental and technical aspects of any stock.
You also need to remember that no stock is perfect. If you look hard enough, you can always find
something that is wrong with a stock. On the other hand, if you look hard enough, you can always find
something good about a stock. The trick is to invest in stocks that have more good qualities than bad.
Here's where the NASDAQ Dozen comes in. By looking at 12 key aspects of any stock you are interested
in, you can quickly determine if the stock is one worth pursuing or one better left alone.
To score the 12 factors of the NASDAQ Dozen, you need to assign each factor either a passing or a
failing grade. After you have scored all 12 factors, add up the passing grades and compare them to the
failing grades. If you have a high ratio of passing grades compared to failing grades, you can be more
confident in the stock. Conversely, if you have a low ratio of passing grades compared to failing grades,
you would be less confident in the stock.
For instance, you would feel more comfortable investing in a stock that had 10 passing grades and only
two failing grades-a ratio of 10:2-than you would investing in a stock that only had four passing grades and
eight failing grades-a ratio of 4:8.
Let's get started and learn how to score each of the 12 factors in the NASDAQ Dozen.
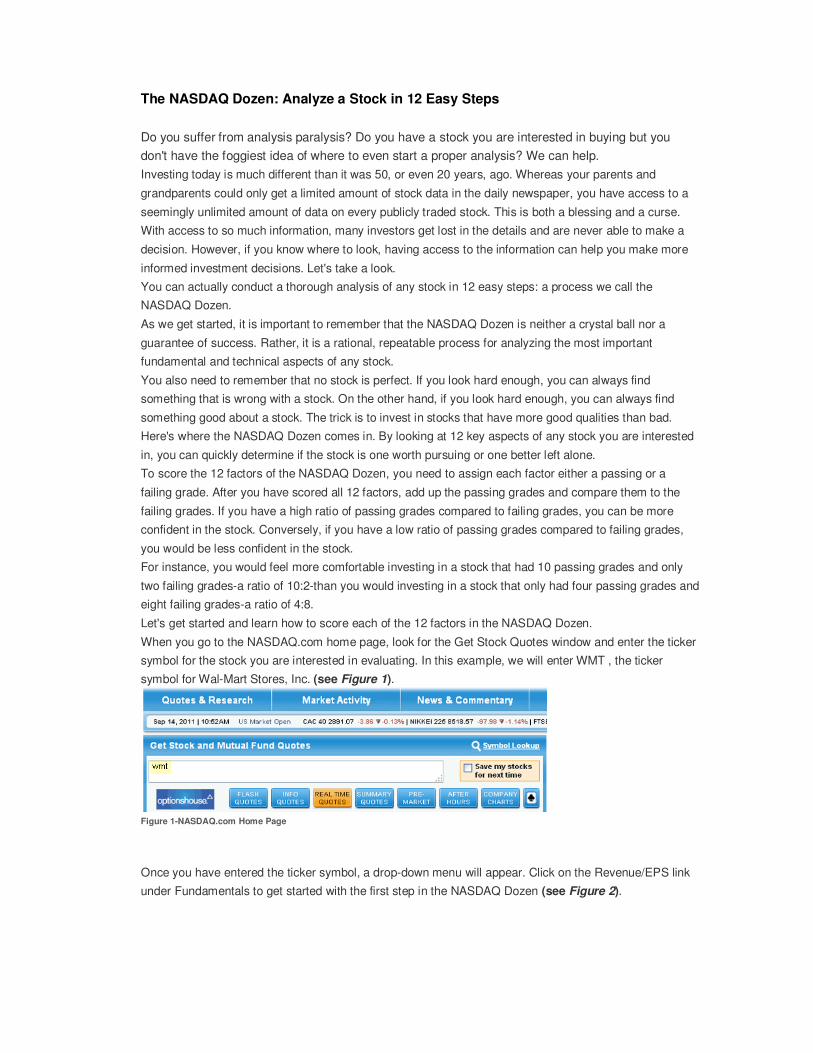
When you go to the NASDAQ.com home page, look for the Get Stock Quotes window and enter the ticker
symbol for the stock you are interested in evaluating. In this example, we will enter WMT , the ticker
symbol for Wal-Mart Stores, Inc. (see Figure 1).
Figure 1-NASDAQ.com Home Page
Once you have entered the ticker symbol, a drop-down menu will appear. Click on the Revenue/EPS link
under Fundamentals to get started with the first step in the NASDAQ Dozen (see Figure 2).

Figure 2-Stock Quote Menu
1. Revenue - The NASDAQ Dozen
We start the NASDAQ dozen with an analysis of revenue because at its basic level, stock growth starts with a
company making money. Fundamentally, if a company isn't bringing in any money, it can't pass profits along to
its shareholders. In other words, it all starts with revenue. Why We Look at Revenue
Revenue will give you an idea of how much money the company is making. If revenue is consistently increasing,
this means the company is growing. As the company continues to grow, the stock price will appreciate in value. How to Score Revenue
• Pass—Give revenue a passing score if revenue is increasing. Start first by comparing the annual totals.
But if the most recent fiscal year is incomplete, compare the most recent quarter with the same quarter in
the previous year.
• Fail—Give revenue a failing score if revenue is decreasing
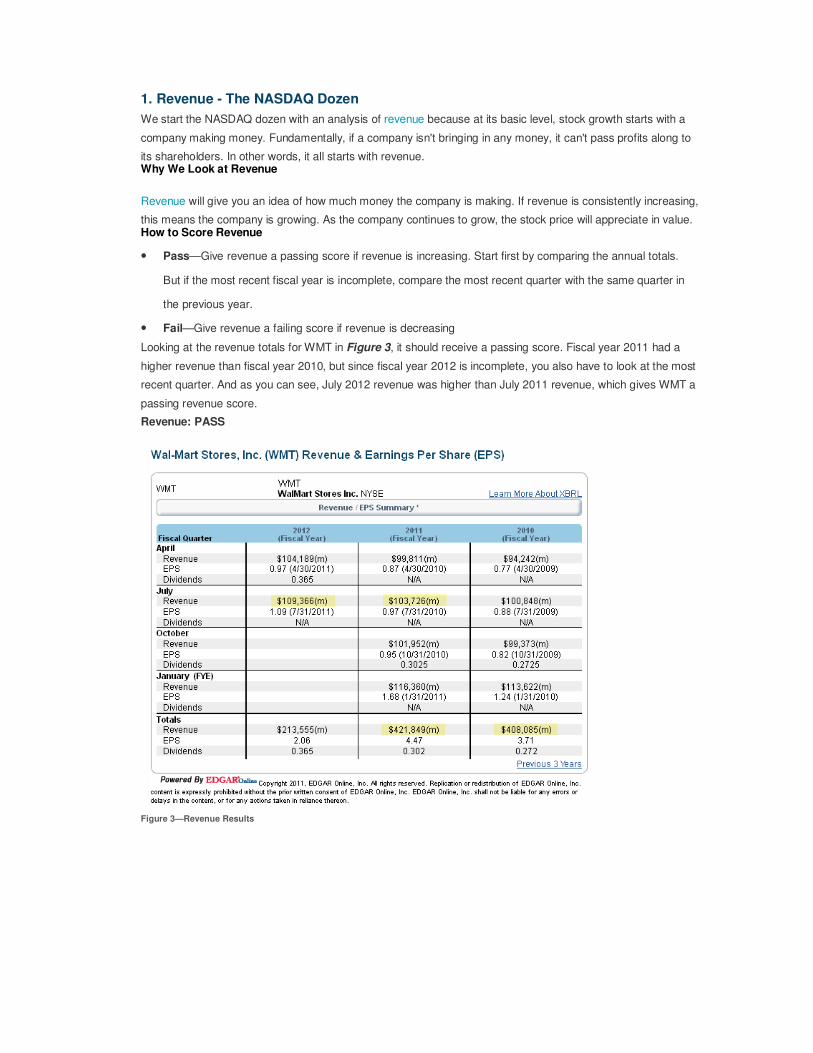
Looking at the revenue totals for WMT in Figure 3, it should receive a passing score. Fiscal year 2011 had a
higher revenue than fiscal year 2010, but since fiscal year 2012 is incomplete, you also have to look at the most
recent quarter. And as you can see, July 2012 revenue was higher than July 2011 revenue, which gives WMT a
passing revenue score.
Revenue: PASS
Figure 3—Revenue Results
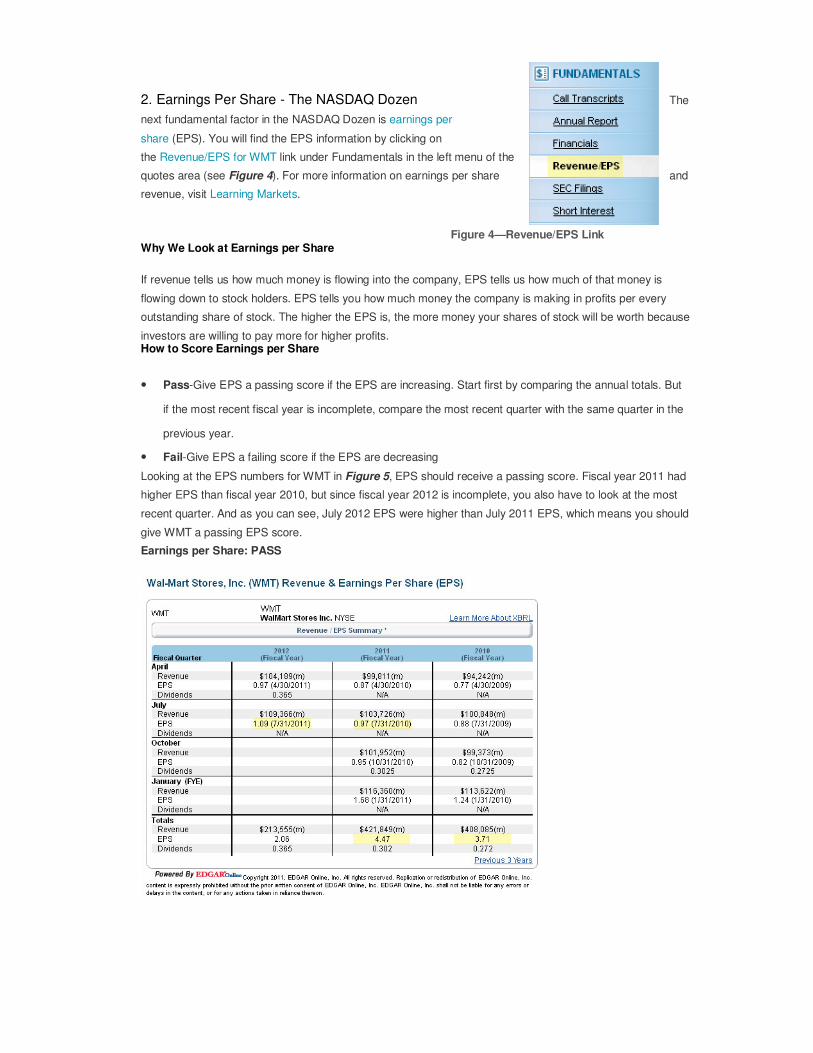
The 2. Earnings Per Share - The NASDAQ Dozen
next fundamental factor in the NASDAQ Dozen is earnings per
share (EPS). You will find the EPS information by clicking on
the Revenue/EPS for WMT link under Fundamentals in the left menu of the
quotes area (see Figure 4). For more information on earnings per share and
revenue, visit Learning Markets.
Figure 4—Revenue/EPS Link Why We Look at Earnings per Share
If revenue tells us how much money is flowing into the company, EPS tells us how much of that money is
flowing down to stock holders. EPS tells you how much money the company is making in profits per every
outstanding share of stock. The higher the EPS is, the more money your shares of stock will be worth because
investors are willing to pay more for higher profits. How to Score Earnings per Share
• Pass-Give EPS a passing score if the EPS are increasing. Start first by comparing the annual totals. But
if the most recent fiscal year is incomplete, compare the most recent quarter with the same quarter in the
previous year.
• Fail-Give EPS a failing score if the EPS are decreasing
Looking at the EPS numbers for WMT in Figure 5, EPS should receive a passing score. Fiscal year 2011 had
higher EPS than fiscal year 2010, but since fiscal year 2012 is incomplete, you also have to look at the most
recent quarter. And as you can see, July 2012 EPS were higher than July 2011 EPS, which means you should
give WMT a passing EPS score.
Earnings per Share: PASS

The Return on Equity (ROE) - The NASDAQ Dozen
next fundamental factor in the NASDAQ Dozen is return on equity (ROE). You will
find the ROE information by first clicking on the Financials link
under Fundamentals in the left menu (see Figure 6) and then clicking on
the Financial Ratios link at the top of the Company Financials page
(see Figure 7).
Figure 6—Financials Link Why We Look at Return on Equity
ROE gives us a glimpse into how efficiently company management is producing a return for the owners of the
company---based on the amount of equity in the company. To calculate ROE, you divide the average
shareholders equity during the past 12 months by the net profit the company has made during those same 12
months.
How to Score Return on Equity
• Pass—Give ROE a passing score if ROE has been increasing for two consecutive years.
• Fail—Give ROE a failing score if ROE is decreasing
Looking at ROE for WMT in Figure 7, ROE should receive a passing score since it remained the same from
2009 to 2010 and increased from 2010 to 2011.
Return on Equity: PASS
Figure 7—Financial Ratios Link
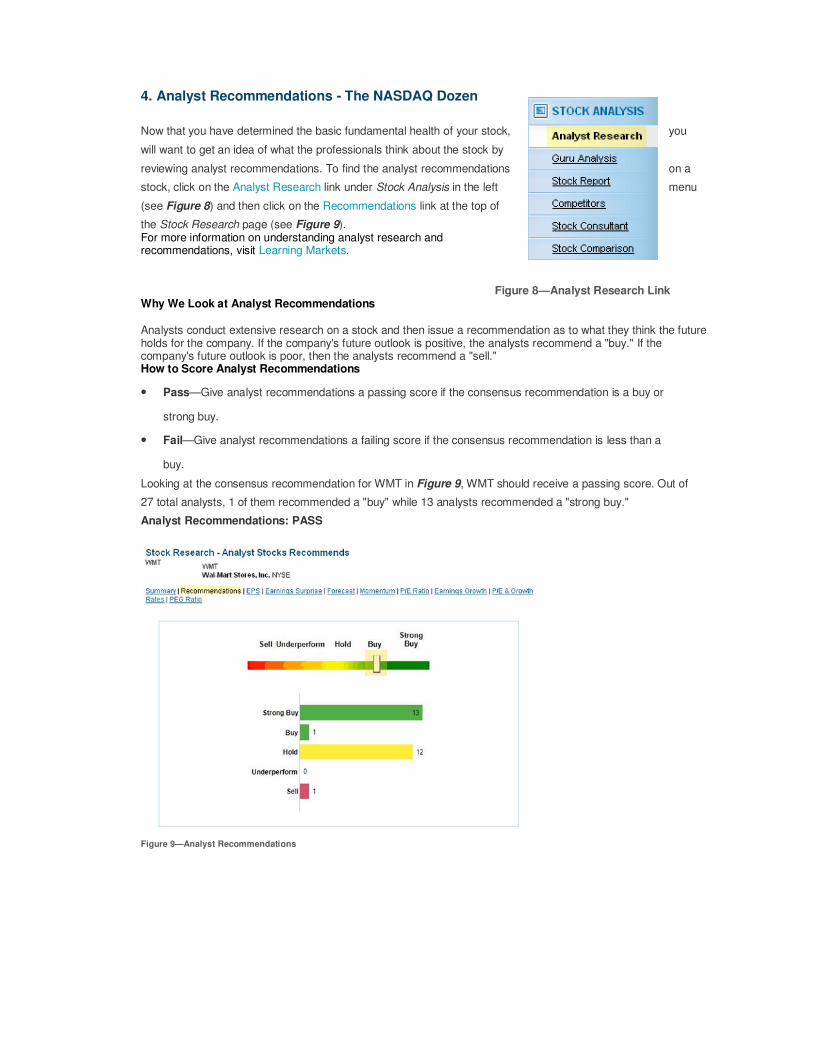
4. Analyst Recommendations - The NASDAQ Dozen
Now that you have determined the basic fundamental health of your stock, you
will want to get an idea of what the professionals think about the stock by
reviewing analyst recommendations. To find the analyst recommendations on a
stock, click on the Analyst Research link under Stock Analysis in the left menu
(see Figure 8) and then click on the Recommendations link at the top of
the Stock Research page (see Figure 9). For more information on understanding analyst research and recommendations, visit Learning Markets.
Figure 8—Analyst Research Link Why We Look at Analyst Recommendations Analysts conduct extensive research on a stock and then issue a recommendation as to what they think the future holds for the company. If the company's future outlook is positive, the analysts recommend a "buy." If the company's future outlook is poor, then the analysts recommend a "sell." How to Score Analyst Recommendations
• Pass—Give analyst recommendations a passing score if the consensus recommendation is a buy or
strong buy.
• Fail—Give analyst recommendations a failing score if the consensus recommendation is less than a
buy.
Looking at the consensus recommendation for WMT in Figure 9, WMT should receive a passing score. Out of
27 total analysts, 1 of them recommended a "buy" while 13 analysts recommended a "strong buy."
Analyst Recommendations: PASS
Figure 9—Analyst Recommendations
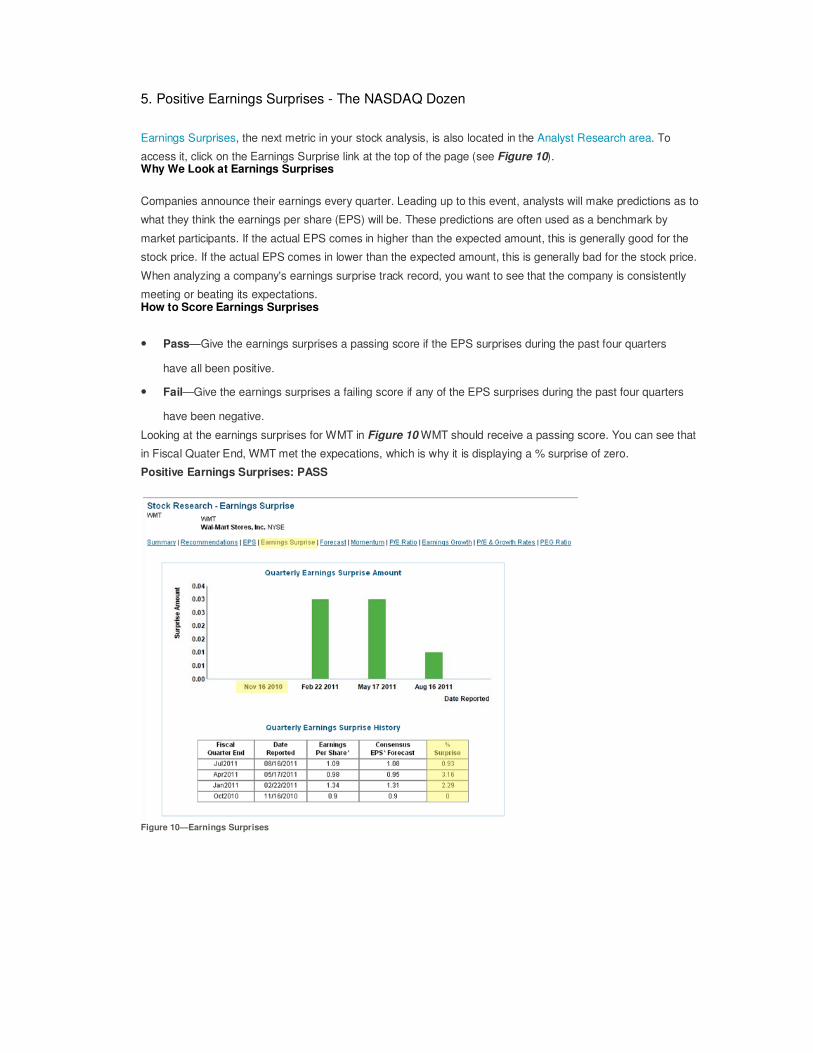
5. Positive Earnings Surprises - The NASDAQ Dozen
Earnings Surprises, the next metric in your stock analysis, is also located in the Analyst Research area. To
access it, click on the Earnings Surprise link at the top of the page (see Figure 10). Why We Look at Earnings Surprises
Companies announce their earnings every quarter. Leading up to this event, analysts will make predictions as to
what they think the earnings per share (EPS) will be. These predictions are often used as a benchmark by
market participants. If the actual EPS comes in higher than the expected amount, this is generally good for the
stock price. If the actual EPS comes in lower than the expected amount, this is generally bad for the stock price.
When analyzing a company's earnings surprise track record, you want to see that the company is consistently
meeting or beating its expectations. How to Score Earnings Surprises
• Pass—Give the earnings surprises a passing score if the EPS surprises during the past four quarters
have all been positive.
• Fail—Give the earnings surprises a failing score if any of the EPS surprises during the past four quarters
have been negative.
Looking at the earnings surprises for WMT in Figure 10 WMT should receive a passing score. You can see that
in Fiscal Quater End, WMT met the expecations, which is why it is displaying a % surprise of zero.
Positive Earnings Surprises: PASS
Figure 10—Earnings Surprises
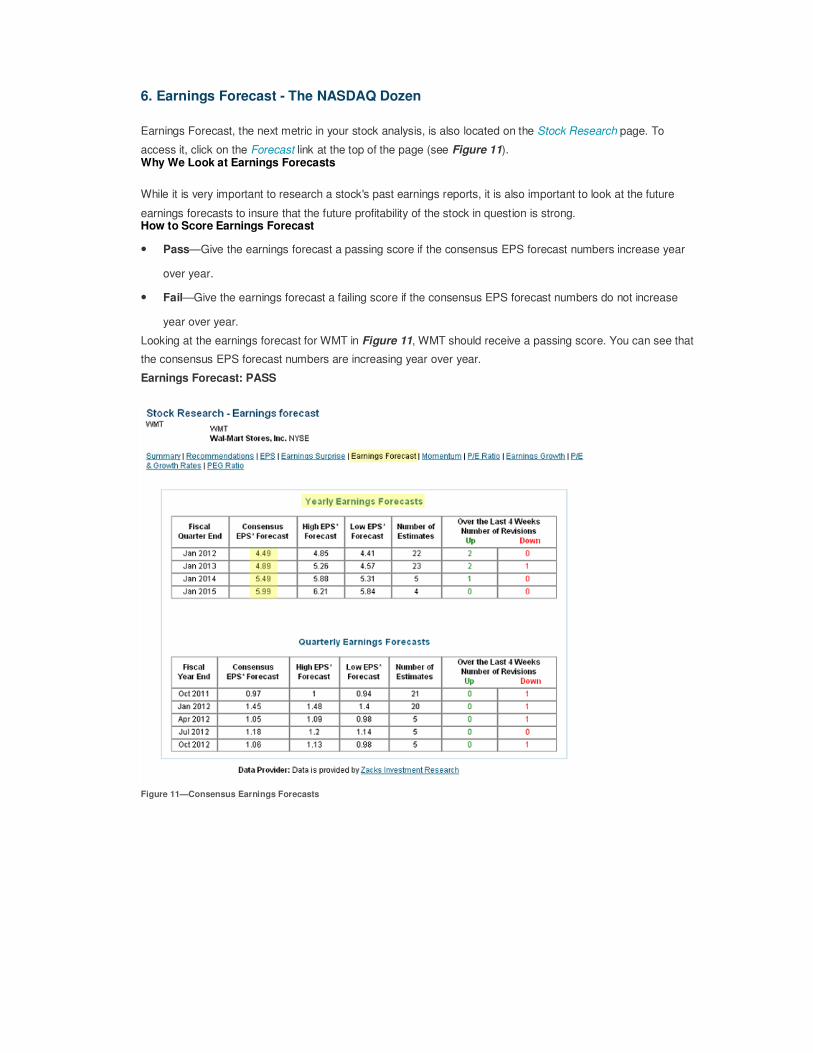
6. Earnings Forecast - The NASDAQ Dozen
Earnings Forecast, the next metric in your stock analysis, is also located on the Stock Research page. To
access it, click on the Forecast link at the top of the page (see Figure 11). Why We Look at Earnings Forecasts
While it is very important to research a stock's past earnings reports, it is also important to look at the future
earnings forecasts to insure that the future profitability of the stock in question is strong. How to Score Earnings Forecast
• Pass—Give the earnings forecast a passing score if the consensus EPS forecast numbers increase year
over year.
• Fail—Give the earnings forecast a failing score if the consensus EPS forecast numbers do not increase
year over year.
Looking at the earnings forecast for WMT in Figure 11, WMT should receive a passing score. You can see that
the consensus EPS forecast numbers are increasing year over year.
Earnings Forecast: PASS
Figure 11—Consensus Earnings Forecasts

7. Earnings Growth - The NASDAQ Dozen
Earnings Growth, the next metric in your stock analysis, is also located on the Stock Research page. To access
it, click on the Earnings Growth link at the top of the page (see Figure 12). Why We Look at Earnings Growth The earnings growth number gives you an idea of how much analysts believe earnings are going to grow per year for the next five years. How to Score Earnings Growth
• Pass—Give earnings growth a passing score if the Long Term 5-year number is greater than 8%.
• Fail—Give earnings growth a failing score if the Long Term 5-year number is less than 8%.
Looking at earnings growth for WMT in Figure 12, WMT should receive a passing score. You can see that the
Long Term 5-year number is greater than 8%.
Earnings Growth: PASS
Figure 12—Forecast Earnings Growth
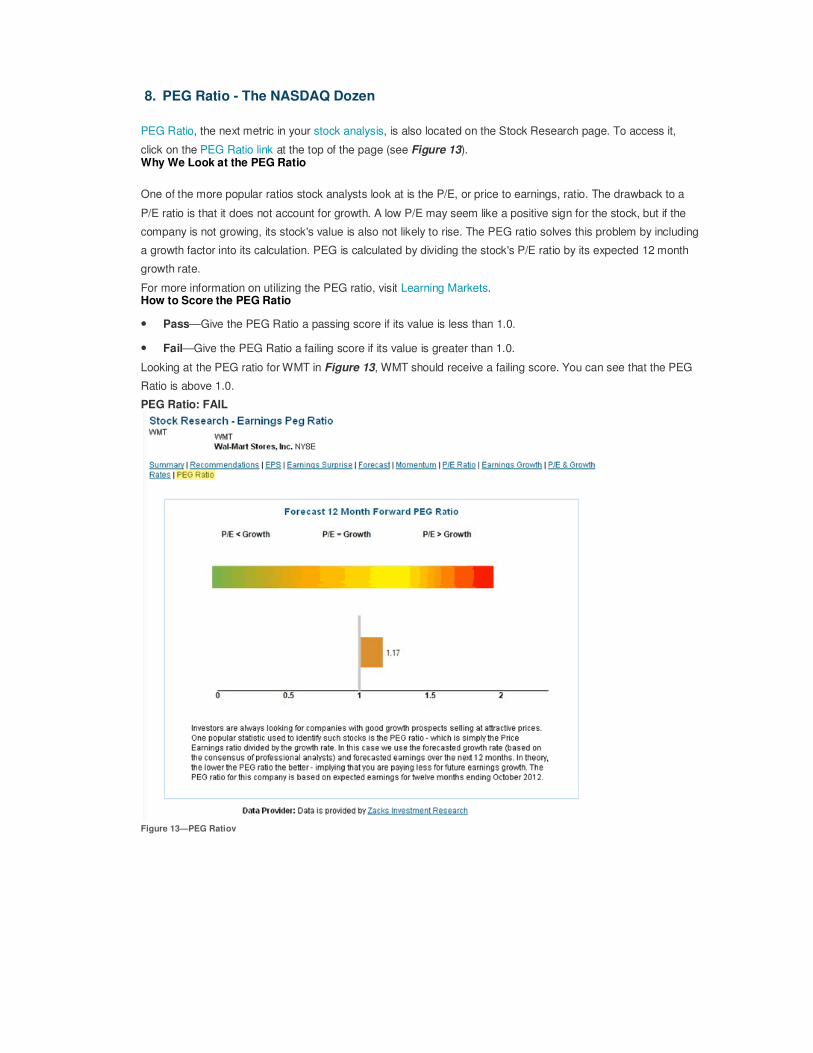
8. PEG Ratio - The NASDAQ Dozen
PEG Ratio, the next metric in your stock analysis, is also located on the Stock Research page. To access it,
click on the PEG Ratio link at the top of the page (see Figure 13). Why We Look at the PEG Ratio
One of the more popular ratios stock analysts look at is the P/E, or price to earnings, ratio. The drawback to a
P/E ratio is that it does not account for growth. A low P/E may seem like a positive sign for the stock, but if the
company is not growing, its stock's value is also not likely to rise. The PEG ratio solves this problem by including
a growth factor into its calculation. PEG is calculated by dividing the stock's P/E ratio by its expected 12 month
growth rate.
For more information on utilizing the PEG ratio, visit Learning Markets. How to Score the PEG Ratio
• Pass—Give the PEG Ratio a passing score if its value is less than 1.0.
• Fail—Give the PEG Ratio a failing score if its value is greater than 1.0.
Looking at the PEG ratio for WMT in Figure 13, WMT should receive a failing score. You can see that the PEG
Ratio is above 1.0.
PEG Ratio: FAIL
Figure 13—PEG Ratiov
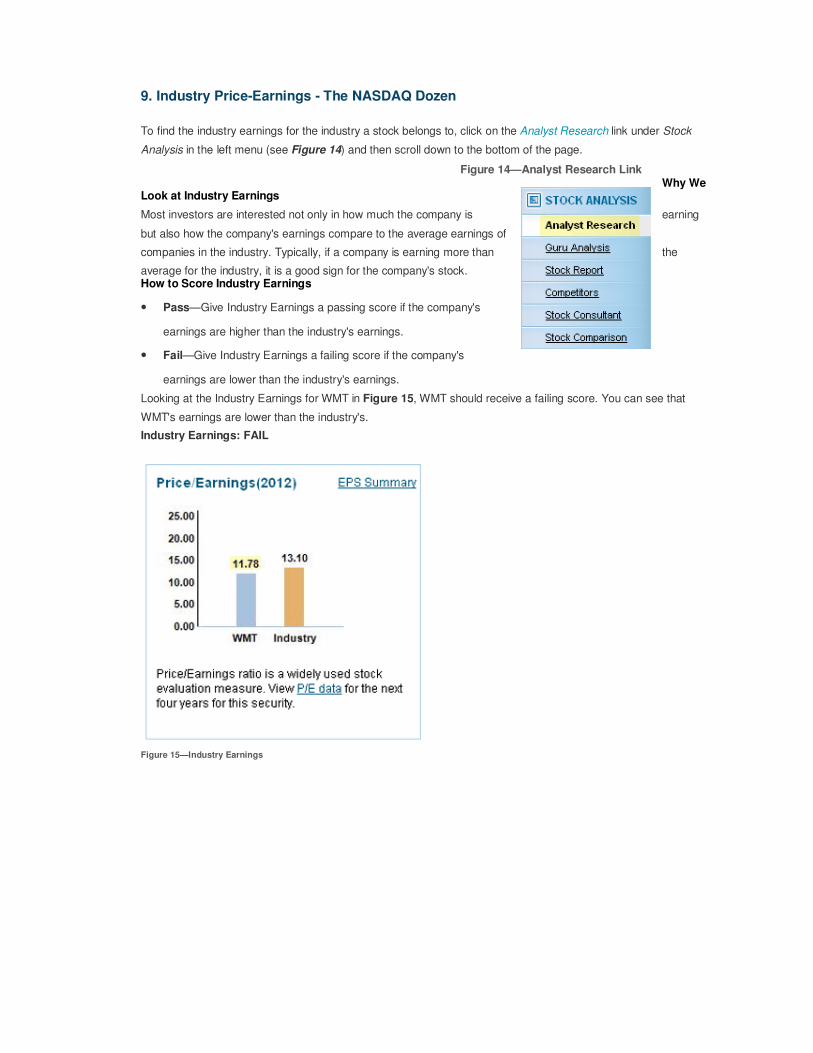
9. Industry Price-Earnings - The NASDAQ Dozen
To find the industry earnings for the industry a stock belongs to, click on the Analyst Research link under Stock
Analysis in the left menu (see Figure 14) and then scroll down to the bottom of the page.
Figure 14—Analyst Research Link
Why We Look at Industry Earnings
Most investors are interested not only in how much the company is earning
but also how the company's earnings compare to the average earnings of
companies in the industry. Typically, if a company is earning more than the
average for the industry, it is a good sign for the company's stock. How to Score Industry Earnings
• Pass—Give Industry Earnings a passing score if the company's
earnings are higher than the industry's earnings.
• Fail—Give Industry Earnings a failing score if the company's
earnings are lower than the industry's earnings.
Looking at the Industry Earnings for WMT in Figure 15, WMT should receive a failing score. You can see that
WMT's earnings are lower than the industry's.
Industry Earnings: FAIL
Figure 15—Industry Earnings
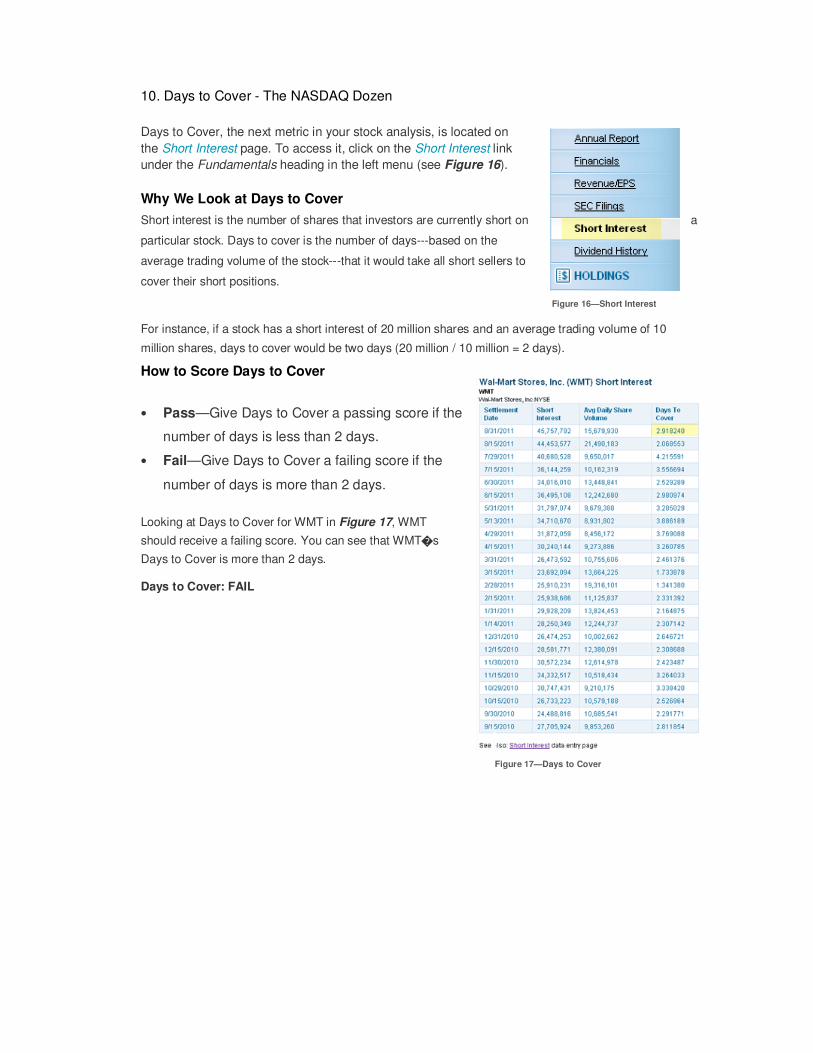
10. Days to Cover - The NASDAQ Dozen
Days to Cover, the next metric in your stock analysis, is located on
the Short Interest page. To access it, click on the Short Interest link
under the Fundamentals heading in the left menu (see Figure 16).
Why We Look at Days to Cover
Short interest is the number of shares that investors are currently short on a
particular stock. Days to cover is the number of days---based on the
average trading volume of the stock---that it would take all short sellers to
cover their short positions.
Figure 16—Short Interest
For instance, if a stock has a short interest of 20 million shares and an average trading volume of 10
million shares, days to cover would be two days (20 million / 10 million = 2 days).
How to Score Days to Cover
• Pass—Give Days to Cover a passing score if the
number of days is less than 2 days.
• Fail—Give Days to Cover a failing score if the
number of days is more than 2 days.
Looking at Days to Cover for WMT in Figure 17, WMT
should receive a failing score. You can see that WMT�s
Days to Cover is more than 2 days.
Days to Cover: FAIL
Figure 17—Days to Cover
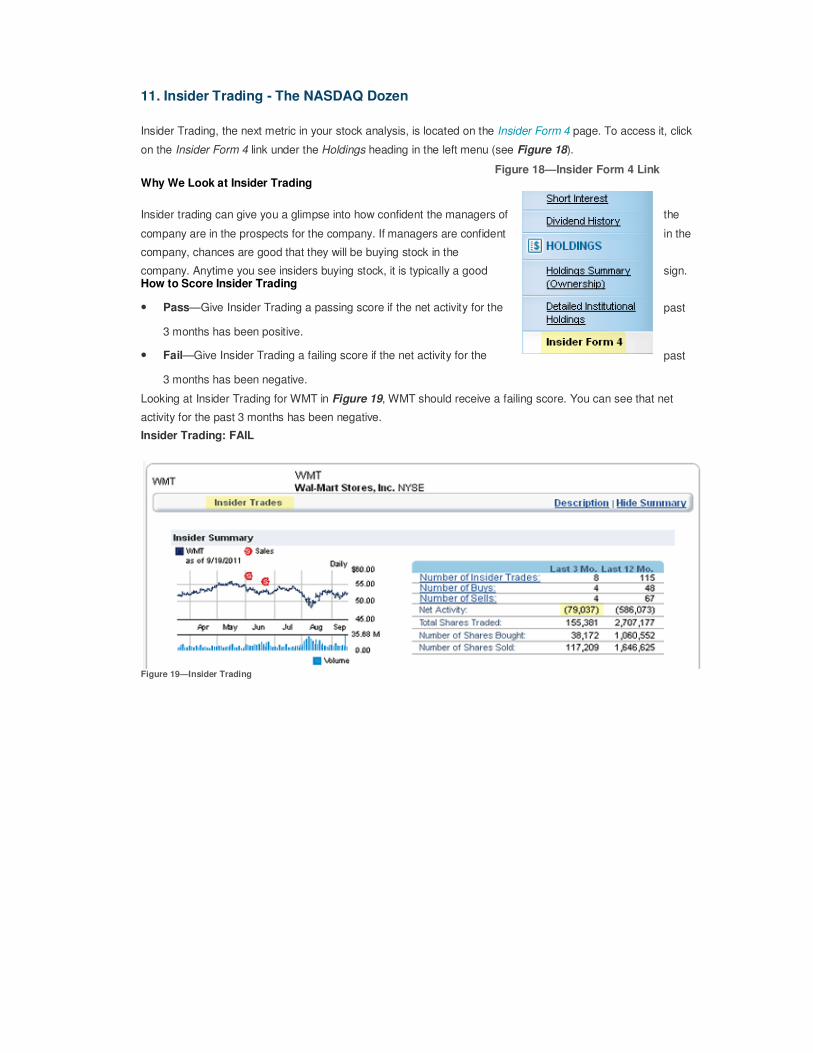
11. Insider Trading - The NASDAQ Dozen
Insider Trading, the next metric in your stock analysis, is located on the Insider Form 4 page. To access it, click
on the Insider Form 4 link under the Holdings heading in the left menu (see Figure 18).
Figure 18—Insider Form 4 Link Why We Look at Insider Trading
Insider trading can give you a glimpse into how confident the managers of the
company are in the prospects for the company. If managers are confident in the
company, chances are good that they will be buying stock in the
company. Anytime you see insiders buying stock, it is typically a good sign. How to Score Insider Trading
• Pass—Give Insider Trading a passing score if the net activity for the past
3 months has been positive.
• Fail—Give Insider Trading a failing score if the net activity for the past
3 months has been negative.
Looking at Insider Trading for WMT in Figure 19, WMT should receive a failing score. You can see that net
activity for the past 3 months has been negative.
Insider Trading: FAIL
Figure 19—Insider Trading
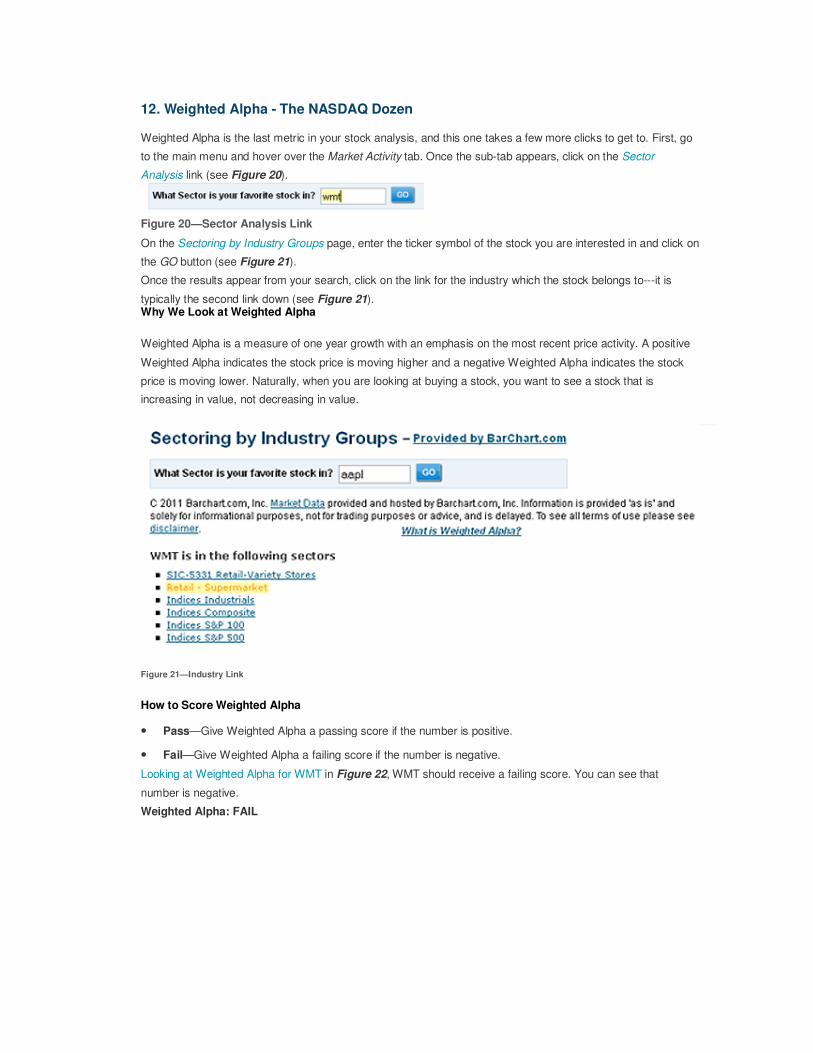
12. Weighted Alpha - The NASDAQ Dozen
Weighted Alpha is the last metric in your stock analysis, and this one takes a few more clicks to get to. First, go
to the main menu and hover over the Market Activity tab. Once the sub-tab appears, click on the Sector
Analysis link (see Figure 20).
Figure 20—Sector Analysis Link
On the Sectoring by Industry Groups page, enter the ticker symbol of the stock you are interested in and click on
the GO button (see Figure 21).
Once the results appear from your search, click on the link for the industry which the stock belongs to---it is
typically the second link down (see Figure 21). Why We Look at Weighted Alpha
Weighted Alpha is a measure of one year growth with an emphasis on the most recent price activity. A positive
Weighted Alpha indicates the stock price is moving higher and a negative Weighted Alpha indicates the stock
price is moving lower. Naturally, when you are looking at buying a stock, you want to see a stock that is
increasing in value, not decreasing in value.
Figure 21—Industry Link How to Score Weighted Alpha
• Pass—Give Weighted Alpha a passing score if the number is positive.
• Fail—Give Weighted Alpha a failing score if the number is negative.
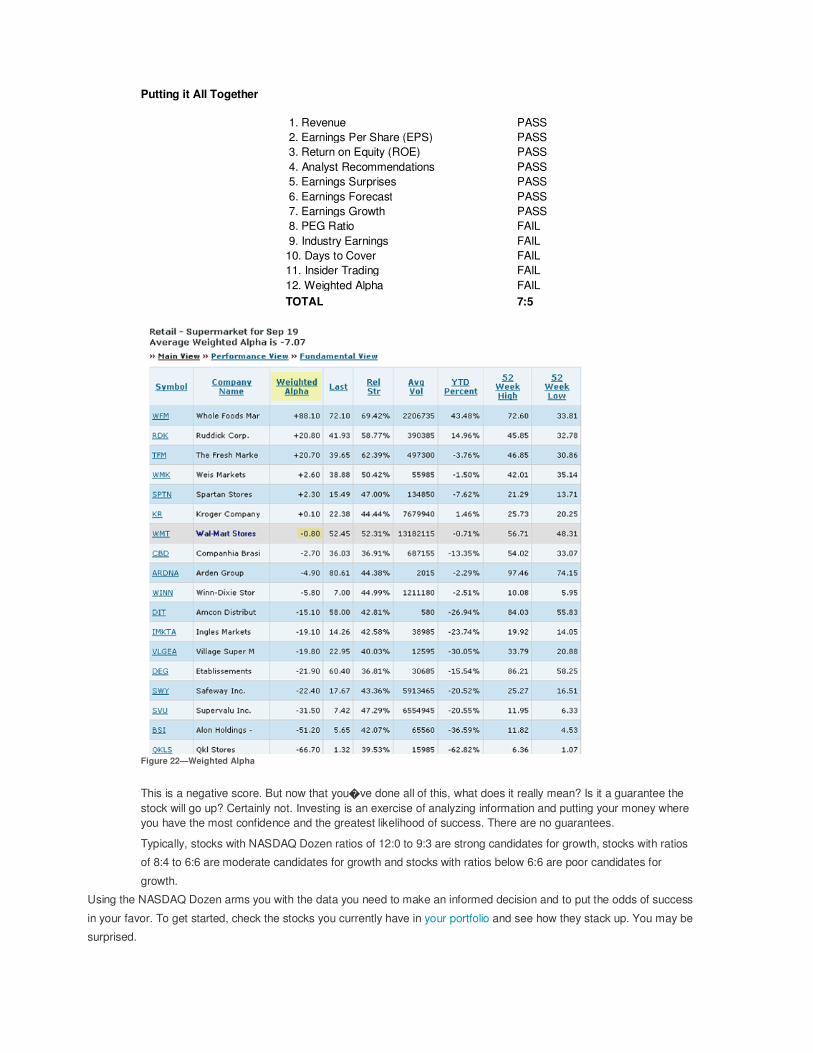
Looking at Weighted Alpha for WMT in Figure 22, WMT should receive a failing score. You can see that
number is negative.
Weighted Alpha: FAIL
Putting it All Together
1. Revenue PASS
2. Earnings Per Share (EPS) PASS
3. Return on Equity (ROE) PASS
4. Analyst Recommendations PASS
5. Earnings Surprises PASS
6. Earnings Forecast PASS
7. Earnings Growth PASS
8. PEG Ratio FAIL
9. Industry Earnings FAIL
10. Days to Cover FAIL
11. Insider Trading FAIL
12. Weighted Alpha FAIL
TOTAL 7:5
Figure 22—Weighted Alpha
This is a negative score. But now that you�ve done all of this, what does it really mean? Is it a guarantee the
stock will go up? Certainly not. Investing is an exercise of analyzing information and putting your money where
you have the most confidence and the greatest likelihood of success. There are no guarantees.
Typically, stocks with NASDAQ Dozen ratios of 12:0 to 9:3 are strong candidates for growth, stocks with ratios
of 8:4 to 6:6 are moderate candidates for growth and stocks with ratios below 6:6 are poor candidates for
growth.
Using the NASDAQ Dozen arms you with the data you need to make an informed decision and to put the odds of success
in your favor. To get started, check the stocks you currently have in your portfolio and see how they stack up. You may be
surprised.