THE MYTH OF INTRINSIC VALUE Daniel Dokhanian
42
THE MYTH OF INTRINSIC VALUE Daniel Dokhanian Submitted to the faculty of the Graduate School of Architecture, Planning, & Preservation in partial fulfillment of the requirements for the degree Masters of Science in the Department of Real Estate, Columbia University May, 2016
Transcript of THE MYTH OF INTRINSIC VALUE Daniel Dokhanian
THE MYTH OF INTRINSIC VALUE
Daniel Dokhanian
Submitted to the faculty of the Graduate School of Architecture, Planning, & Preservation
in partial fulfillment of the requirements for the degree
Masters of Science in the Department of Real Estate,
Columbia University May, 2016

3
ACKNOWLEDGEMENTS
I’d like to express my deepest appreciation to my thesis adviser, Professor Ryan Severino, for the countless hours he offered to help brainstorm ideas and structure this work as well as for allowing me access to the plethora of real estate data from REIS, without which, this work would, quite literally, not have been possible. My sincerest gratitude also goes to those who offered their time and advice to help perfect the analysis with pointed questions and thoughtful feedback. Aby Rosen, RFR Holdings Adam Rose, Rose Associates Adam Schwartz, Angelo Gordon & Co. Alan Epstein, MSD Capital Andrew Cohen, Och-Ziff Barry Chase, Belay Investments Ben Bianchi, Oaktree Capital Management Bob Lowe, Lowe Enterprises Daniel Kwon, Apollo Global Management David Beznos, Dune Real Estate Partners David Kruth, Brooklyn Queens Properties Edward Minskoff, EJM Equities Eli Ungar, Antheus Capital Francis Greenburger, Time Equities Fred Leeds, Fred Leeds Properties Gary Garrabrant, Jaguar Growth Partners Hamid Tabib, Siguler Guff Hesham Ali, Perella Weinberg Jared Halperin, Fir Tree Partners Jason Fox, WP Carey Jason Hart, The Carlyle Group Jason Levine, Westbrook Realty Partners Jason Schreiber, CIM Group Jeff Greene, Florida Sunshine Investments Joel Mayer, Rockwood Capital John Prabhu, Kennedy Wilson Keith Gelb, Rockpoint Group
Ken Senior, HIG Capital Khaled W. Kudsi, Northwood Investors Kip Cyprus, Ocean Development Martin Zieff, Alcion Ventures Michael Rosenfeld, Woodridge Capital Patrice Derrington, Columbia University Patrick Mattson, Kohlberg Kravis Roberts Peter Kalikow, H.J. Kalikow & Company Peter Linneman, the University of Pennsylvania Philip Orosco, Pacshore Partners Pike Aloian, Almanac Realty Advisors Ralph Rosenberg, Kohlberg Kravis Roberts Richard Scott, Loews Corporation Richard Ziman, Rexford Industrial Ron Dickerman, Madison International Realty Ron Lamogntane, Partners Group Ross M. Cowan, Northwood Investors Sam Zell, Equity Group Investments Scott Rechler, RXR Realty Sheldon Adelson, Las Vegas Sands Group Sonny Kalsi, GreenOak Real Estate Stephen Benjamin, The Dermot Company Teddy Karatz, GTIS Partners Thomas Blumenthal, The Baupost Group Thomas Brown, LGT Capital Partners Tyler Williams, Guggenheim Partners
4
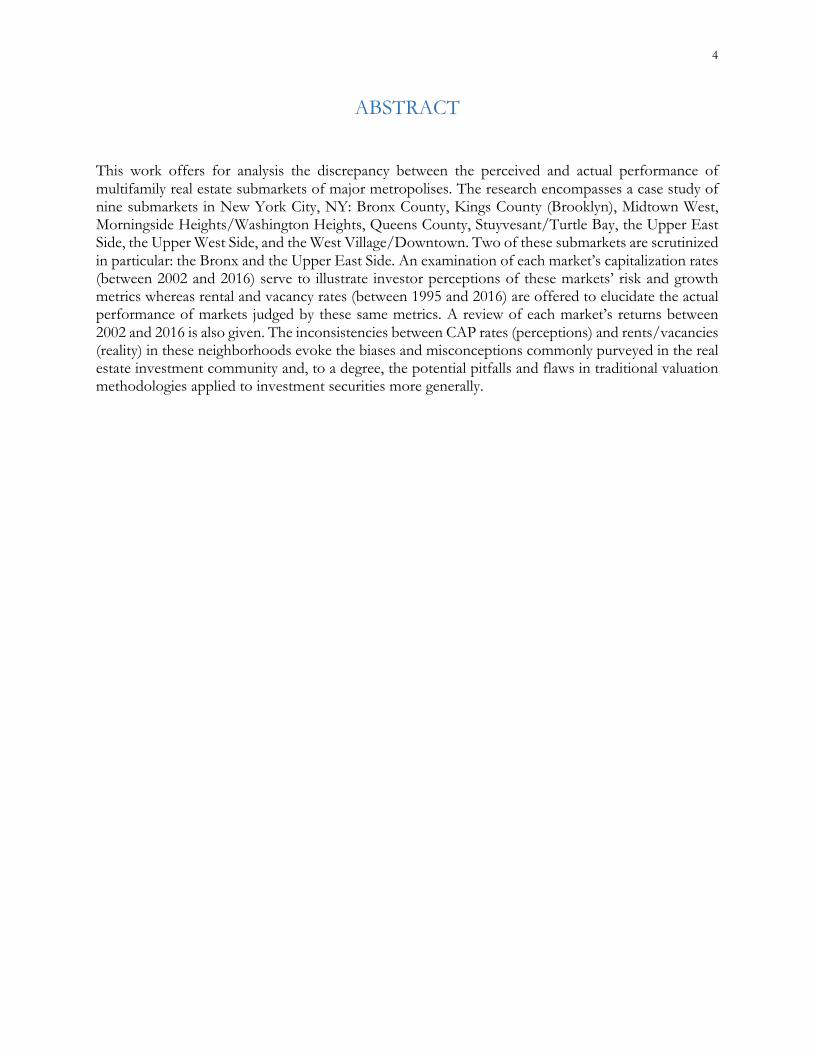
ABSTRACT
This work offers for analysis the discrepancy between the perceived and actual performance of multifamily real estate submarkets of major metropolises. The research encompasses a case study of nine submarkets in New York City, NY: Bronx County, Kings County (Brooklyn), Midtown West, Morningside Heights/Washington Heights, Queens County, Stuyvesant/Turtle Bay, the Upper East Side, the Upper West Side, and the West Village/Downtown. Two of these submarkets are scrutinized in particular: the Bronx and the Upper East Side. An examination of each market’s capitalization rates (between 2002 and 2016) serve to illustrate investor perceptions of these markets’ risk and growth metrics whereas rental and vacancy rates (between 1995 and 2016) are offered to elucidate the actual performance of markets judged by these same metrics. A review of each market’s returns between 2002 and 2016 is also given. The inconsistencies between CAP rates (perceptions) and rents/vacancies (reality) in these neighborhoods evoke the biases and misconceptions commonly purveyed in the real estate investment community and, to a degree, the potential pitfalls and flaws in traditional valuation methodologies applied to investment securities more generally.

5
TABLE OF CONTENTS
ACKNOWLEDGEMENTS ..................................................................................................... 3
ABSTRACT .............................................................................................................................. 4
TABLE OF CONTENTS ........................................................................................................ 5
INTRODUCTION .................................................................................................................. 6
RESEARCH METHODOLOGY ............................................................................................ 8
CAP RATES ............................................................................................................................ 12 Annual CAP Rates .........................................................................................................................................................13 Average CAP Rates .........................................................................................................................................................14 CAP Rate Volatility .......................................................................................................................................................15
RENTAL RATES .................................................................................................................... 16 Annual Rents ...................................................................................................................................................................16 Rent Growth ....................................................................................................................................................................18 Rental Compounded Annual Growth Rates ......................................................................................................................19 Rent Volatility .................................................................................................................................................................21
VACANCY RATES ................................................................................................................. 23 Annual Vacancy Rates ....................................................................................................................................................23 Average Vacancy Rates ....................................................................................................................................................24 Vacancy Rate Volatility ...................................................................................................................................................25
RETURNS ANALYSIS ........................................................................................................... 26 Bronx & Upper East Side Internal Rates of Return ........................................................................................................26 Internal Rates of Return by Hold Length ..........................................................................................................................28 Internal Rate of Return Bifurcation ...................................................................................................................................28
CAP RATES REVISITED ...................................................................................................... 30
CONCLUSIONS: WHY IT ALL MATTERS ........................................................................ 32 Intrinsic Value .................................................................................................................................................................32 Investing vs. Speculating ....................................................................................................................................................36 The Existential Investor ...................................................................................................................................................39
BIBLIOGRAPHY ................................................................................................................... 42

6
INTRODUCTION
In 1997 real estate investor Fred Leeds picked up his phone. “Fred, I have something for you,” said
a broker. “Corner of Wilshire and Union. Meet me there this afternoon.”
Fred, always hungry to expand his portfolio, hopped into his car and drove into the direction of
1990’s Los Angeles No-Man’s-Land: East. Pulling up to the property, he laid his eyes on 9 acres of
proverbial, rotting LA blight: 4 vacant warehouses (if they could still be called that), sprinkled across
a booming bazaar of drug dealing, homelessness, and prostitution. “It’s a development play,” said
the broker, a forced attempt at gilding the neighborhood fungus. “The zoning allows up to 2 million
square feet of mixed-use real estate here.” Fred rolled his eyes, thanked the broker for his time, got
into his car, and drove back towards the Pacific.
But he always tried to keep an open mind, and he soon enough he found himself rethinking his
initial indifference. At the time, the area had no prospects for growth, but did that matter? It was on
Wilshire Boulevard, Los Angeles’ premier arterial thoroughfare named after the eponymous land
developer. “If you graduate dead last in medical school, what do they call you? A doctor. The least
attractive slice of a beach community is still a beach community, and the worst part of Wilshire
Boulevard is still Wilshire Boulevard,” gleams Fred.
Our protagonist did a quick back-of-the envelope analysis. Nestled just west of Downtown LA, the
cross street was in the top quintile for traffic count in all of LA County1, making it one of the
densest corridors in the city. The parcel was being offered for $14 million. Even with moderate
1 http://ladot.lacity.org/node/581

7
construction costs, any landlord would be able to offer rents at a substantial discount to market for a
brand new building, thus ensuring a high occupancy, and still garner a substantial return. When the
broker got back to his office, he saw a fax coming in from Fred. “Draft offer at asking. 30 day
escrow. No contingencies.”
Shortly thereafter, Fred was a proud owner of “the tract of homeless encampments,” his coveted
name for the asset. “Guess how many premium coffee houses there were nearby? None. We got
turned down by Home Depot 4 times for a store. We have at our site a Home Depot; it's their third
or fourth most profitable store in their chain. Our McDonald's is in the top 5% for the company’s
retail store sales. The dirt alone is worth approximately $150 million today.”
Fred has no shortage of these stories, having made a career out of successfully investing in Los
Angeles’ most beleaguered submarkets. His office itself embodies his “turning chicken shit into
chicken salad” investment philosophy: a pristine newly-finished space juxtaposed on the unsavory
Crenshaw Boulevard and freckled with artwork from the now-defunct gaming giant, Atari (“I
bought these pieces for cents on the dollar from one of their corporate offices when the company
went out of business”).
It’d be easy to write Fred’s success off to luck; a maverick, or perhaps even unwitting, cowboy who
chanced upon urban decay prior to the burgeoning grace of modern gentrification. He took high
risk and was awarded his high return, one could say. However, questionable is the belief that an
investment strategy like this can be depended on to generate consistently high and risk-adjusted
returns: there are old pilots, and there are bold pilots; but there are no old, bold pilots.

8
A more fun a theory would be to praise Fred as some genius, a [Michael] Burry-ian eccentric with a
knack for finding value in the singularly unexpected edges of a city. Music to a value investor’s ears
and appeasement to a contrarian’s intellectualism: deals like these are diamonds in the rough,
awarded to those with the stamina to network and endlessly sift through lead to find those golden
nuggets. There’s some merit here: neglect from competitors does bring asset prices down across the
board and creates occasional buying opportunities for those with the patience to look through all to
find some.
But what if Fred’s success in these static, derelict city corners was due to something other than fluke,
asset aberration, or prescient foresight?
--
Fred Leeds’s stories do more than just pique curiosity. They shed light on what opportunities, biases,
risks, and unknowns lie in these ‘unattractive’ submarkets of major cities generally neglected by the
institutional investment community. More than that, they goad on the unsettling reality that these
very submarkets are not nearly as risky, on a fundamental basis, as investors believe them to be,
especially compared against the more glamorous, luxury localities traditionally favored by investors.
RESEARCH METHODOLOGY
To explore these markets and their merit for investment further, this work offers a case study
centered on what is perhaps considered to be one of the most efficient real estate markets in the
United States and thus, by extension, the world: New York, NY. Analyzed in particular are

9
multifamily rental and vacancy rates, going back to the mid-1990s, and capitalization rates, going
back to the early 2000s2. All data contained herein has been provided by research company, REIS®,
Inc. Multifamily was selected as the asset class for this analysis for several reasons, among them:
• The data required for exploration is extant and the most encompassing of any of the major
real estate ‘food groups’.
• In comparison to that of commercial real estate (such as office or retail), the
creditworthiness of the underlying tenants in apartment buildings is relatively uniform across
a submarket, and so location can be isolated as the primary independent variable for the
analysis. For example, a single-tenant building NNN leased for 30 years to a McDonald’s in
Queens will be entrusted with a similar discount rate as would a building with the same
tenant and lease terms in the West Village, which means that the tenant is obscuring the
locational differences in the asset’s risk characteristics. This is much less so the case with
multifamily assets.
• With the typical apartment lease extending 12 months, multifamily rents tend to be marked-
to-market yearly (with the exception here being rent-controlled units), which means in-place
rents consistently reflect what the market demand/supply balance deems them to be.
Analyzed are New York City’s 9 main high-density residential submarkets: Bronx County, Kings
County (Brooklyn), Midtown West, Morningside Heights/Washington Heights, Queens County,
Stuyvesant/Turtle Bay, Upper East Side, Upper West Side, West Village/Downtown. The focus of
this work, however, will be on two of these markets in particular: the Upper East Side and the
Bronx. It’s my intention to prove why the aforementioned realities and perceptions of those realities
2 Included are all unit types and sizes and building classes (i.e. A, B, and C) for buildings with 5 or more units.

10
are, at times, out of sync in these two neighborhoods of NYC. We start off here with how all of
these markets are perceived by the investment community.
--
The valuation or price of any piece of real estate, and for that matter any investable security, is
determined by two variables: income and multiple, that is, the income the building is currently
generating or is projected to produce and the multiple applied to that incumbent or future income.
In other words:
Purchase Price = Net Operating Income CAP Rate
Income, in the form of rental and vacancy rates, is a product of a market’s fundamentals: population
and aggregate job changes, proximity to employment and transportation, etc. (demand) and total
housing stock, new development, zoning restrictions, etc. (supply). The underlying consumer,
apartment tenants, and their relationship with available inventory are the foundation for this figure.
Capitalization rates (real estate’s esoteric analogue for earnings multiple) are also determined by
supply and demand, but in a different marketplace: that of buyers and sellers of real estate assets.
Investors apply CAP rates based on their perceptions of risk and growth for a given asset. Discount
rates, interest rates, the ebbs and flows of capital markets, fear, greed, and all other beliefs are the
driving forces for this number.
CAP rates are a manifestation of opinions of investors (relatively subjective) while rents and
vacancies are that of the interaction of fundamental market characteristics (relatively objective). In a
perfectly efficient market, NOI and cap rates would be highly correlated; as rents in a market are or
are expected to increase and as vacancies are or are projected to decrease, CAP rates should in turn

11
decrease, with the inverse holding true as well. A scenario in which CAP rates move independently
of rent and vacancy changes is indicative of buyers and sellers inaccurately perceiving a market’s
fundamentals. An inefficiency. Risk and return are out of sync, with an overly compressed CAP rate
signaling exuberance and an expanded one, unwarranted despondency. It is on these latter discords
which this work focuses.

12
CAP RATES
The Gordon Growth Model, as applied to real estate, asserts that capitalization rates are determined
by the difference between an asset’s appropriate discount rate, r, a measure of risk, and its projected
growth (or contraction) rate, g (r – g). A higher CAP rate demonstrates a belief in a relatively high r
and a low g, and a lower CAP rate, a lower r and/or a higher g. While practitioners usually don’t
explicitly break down CAP rates when underwriting potential acquisitions, the principles of this
formula are nonetheless implicit in every valuation, with investors gifting lower CAP rates to
markets or buildings that have room for growth in rents, ‘upside’, or a more stable stream of cash
flows, for example.
Below are the multifamily historical CAP rates for the New York submarkets mentioned above
between the years 2002 and 2016.

13
Annual CAP Rates
The Upper West Side is perhaps the most cherished market in New York City among investors
today. At 3.5%, its CAP rate currently stands as the lowest among those of the 9 markets surveyed.
The Upper East Side and Stuyvesant Town trail slightly behind at 3.6% and 3.9%, respectively, and
the West Village/Downtown slightly behind still at 4.2%. Brooklyn at 4.4% and Queens at 4.7% are
in the middle range, while Morningside Heights, the Bronx, and Midtown West all sell at or above
five-and-a-half CAPs. The Bronx also had the highest ever recorded CAP rate during the period,
reaching a peak of 9.2% in 2010.
Bronx County, 5.6%
Kings County, 4.4%
Midtown West, 5.7%
Morningside Heights/Washington
Heights, 5.5%
Queens County, 4.7%
Stuyvesant/Turtle Bay, 3.9%
Upper East Side, 3.6%
Upper West Side, 3.5%
West Village/Downtown, 4.2%
3%
4%
5%
6%
7%
8%
9%
'02 '03 '04 '05 '06 '07 '08 '09 '10 '11 '12 '13 '14 '15 '16
Annual CAP Rates

14
Average CAP Rates
To give a better idea of performance over the entire term, though, below is a simple average of
those same values between 2002 and 2016.
The pecking order for the average CAPs
is very similar to that of the current
CAPs, with the only substantive
difference being Midtown West:
compared to its peer markets, it has a
very high current CAP rate versus a
relatively robust average CAP rate.
As mentioned above, CAP rates are a barometer of investor sentiment, and so, by extension, we can
use the hierarchy to extrapolate how investors perceive each market’s potential risk and growth.
While it would be impossible to bifurcate each CAP rate into two distinct figures for r and g,
educated guesses of this breakdown could be made based on how the fundamentals of that market
perform (attempted below). For now, however, it is sufficient to use the above chart to demonstrate
how investors have been and are thinking. It should come as no surprise, for example, that investors
are and have been more enthusiastic about investment prospects in the Upper West Side, Stuyvesant
Town, and the Upper East Side than they have been about those in Morningside Heights and the
Bronx.
7.1%6.5%
5.8%5.8%5.7%5.6%
5.4%5.2%
5.0%
0.0% 1.0% 2.0% 3.0% 4.0% 5.0% 6.0% 7.0% 8.0%
Bronx CountyMorningside …
Kings CountyQueens County
West Village/DowntownMidtown West
Upper East SideStuyvesant/Turtle Bay
Upper West Side
Average CAP Rates, 2002-2016

15
CAP Rate Volatility
Not only is the Bronx one of the most
punished markets on an average and
current basis, ranking at a 7.1% average
CAP rate, a full 60 basis points higher than
the nearest submarket in the list,
Morningside Heights, but it is also
maltreated in its changes from one year to the next. It’s CAP rate has one of the highest volatility
scores, second only to that of the Upper West Side. CAP rates swing widely from one year to the
next, as investors capriciously embrace and shun the neighborhood. This contrasts with the Upper
East Side’s relatively low volatility in CAP rates throughout the period.
With a general feel for the perceptions, particularly for the Bronx and the Upper East Side, let’s now
examine the reality.
0.0% 5.0% 10.0% 15.0% 20.0% 25.0%
Bronx CountyKings County
Midtown WestMorningside …
Queens CountyStuyvesant/Turtle Bay
Upper East SideUpper West Side
West Village/Downtown
CAP Rate Volatility, 2002-2016

16
RENTAL RATES
The first fundamental metric analyzed are that of rental rates and changes. Below is a graph showing
the annual rents for the above-mentioned submarkets over the years 1995-2016.
Annual Rents
At first glance, the data seems to affirm the CAP rate hierarchy. All submarkets in Manhattan, New
York City’s most populous and prominent borough, both started off and ended off at higher
nominal rental rates. Rents in the Upper West Side outstripped those of the Upper East Side in the
year 2000 to become the highest-priced market in New York and maintained the top spot through
Bronx County, $1,245
Kings County, $2,152
Midtown West, $4,466
Morningside Heights/Washington Heights, $2,462
Queens County, $1,998
Stuyvesant/Turtle Bay, $4,511
Upper East Side, $4,125
Upper West Side, $4,882
West Village/Downtown, $4,296
$0
$500
$1,000
$1,500
$2,000
$2,500
$3,000
$3,500
$4,000
$4,500
$5,000
1995
1996
1997
1998
1999
2000
2001
2002
2003
2004
2005
2006
2007
2008
2009
2010
2011
2012
2013
2014
2015
2016
Annual Rents
17
present day, ending at an average of $4,882 per unit. The Upper East Side, along with
Stuyvesant/Turtle Bay, Midtown West, and the West Village/Downtown all started with and ended
with rankings among the most expensive neighborhoods with rents above $4,000 by 2015. The
markets outside of Manhattan: Brooklyn, Queens, and the Bronx, had the lowest rents, in the sub
$2,500 range by 2016. Morningside Heights was the only exception to Manhattan’s price-gouging
rents, topping out at $2,462 by 2016, but it still beat out its non-Manhattanite counterparts.
At second glance, still nothing provokes much questioning: those same high-flying markets have
steeper rent curves, hinting at an expected faster growth rate.
It is only at a third, more scrupulous ‘glance’ that the data betrays intrigue to the CAP rate data
above: while the steeper rent curves seemingly point to a faster increase in those high-rent
Manhattan markets than those in the Bronx, Queens, Morningside Heights, and Brooklyn, it’s
important to note that the graph is linear. A more substantial total dollar gain, an example being the
West Village’s $2,363 rise compared to Queens’ $1,240 over the twenty-one-year period, does not
necessarily make for a greater percentage increase. The starting point matters.

18
Rent Growth
The above chart controls for the inconsistency by setting all submarket rents to 100 in the year 1995,
allowing for the ups and downs in YOY rent changes to be measured against a uniform starting
point. To take it a step further, below lies a chart ranking the submarkets according to their
compounded annual growth rates, that is, their average, geometric year-over-year rate of growth over
the twenty-one-year period. Although this bite-sized figure is somewhat crude in that it smooths out
the peaks and troughs captured above, it is now more digestible for the targeted analysis.
Bronx County, 1.9x
Kings County, 2.9x
Midtown West, 2.7x
Morningside Heights/Washington Heights, 2.2x
Queens County, 2.6x
Stuyvesant/Turtle Bay, 3x
Upper East Side, 2x
Upper West Side, 2.5x
West Village/Downtown, 2.2x
100
150
200
250
300
350
1995
1996
1997
1998
1999
2000
2001
2002
2003
2004
2005
2006
2007
2008
2009
2010
2011
2012
2013
2014
2015
2016
Rent Growth

19
Rental Compounded Annual Growth Rates
The data becomes far
more interesting when
comparing these
compounded annual
growth figures, with
some conclusions being
intuitive and others,
frustratingly incomprehensible.
The top 6 neighborhoods, Stuyvesant Town/Turtle Bay, Brooklyn, Midtown West, Queens, the
Upper West Side, and Morningside Heights, can all be categorized as growth markets to varying
degrees. In an analogy to equities, these markets could be considered the high-flying biotechnology
startups that experience massive growth in short periods of time. They are parts of Manhattan that
have seen a change of character, gentrification, and were accompanied by the staggering rent growth
associated with such transformations. In the mid-1990’s all of these neighborhoods looked and felt
substantially different than they do today, going from neglected or moderately undesirable to hipster-
cool or moderately desirable today. These are also the markets with CAP rates on the lower end and,
while not in perfect succession, the rent growth figures in these neighborhoods more or less justify
their correspondingly low CAPs. A high g dovetails with a low CAP.
While change is always exciting, this work focuses on the Bronx and the Upper East Side, markets
that have changed little from their initial state when compared to the above-mentioned gentrifying
neighborhoods. In the 90’s, renters deemed and priced the Upper East Side as a luxury district of
3.11%3.37%
3.88%3.89%
4.40%4.72%4.85%
5.28%5.34%
0.0% 1.0% 2.0% 3.0% 4.0% 5.0% 6.0%
Bronx CountyUpper East Side
West Village/DowntownMorningside Heights/Washington …
Upper West SideQueens CountyMidtown WestKings County
Stuyvesant/Turtle Bay
CAGR Rents, 1995-2016

20
the city, while ascribing the Bronx with the diametrically opposed views of cheap and unsightly.
What’s important, though, is that both realities persist today. Bourgeois and unappealing, respectively,
both then and now. By isolating these two submarkets that remain static in character and removing the
confounding variable of gentrification on rent growth, we are able to more effectively hold hostage
the above-broached notion that, all else held equal, luxury markets see more appreciable expansion
in rents than do inexpensive ones.
Investors would be pleased to learn that the market with both the highest average CAP of 7.1% and
the highest current CAP of 5.6%, the Bronx, is also the one with the most sluggish CAGR of 3.11%.
Perceptions indeed are agreeing with reality. However, while comforting, it’s important to note the
other submarket in the bottom rung: the Upper East Side. This market, deified by investors with an
average CAP of 5.4% and a current CAP of 3.6% has only a marginally higher CAGR of 3.37%. It is
incumbent on us to ask: is a twenty-six basis point higher CAGR worth a two-hundred-basis point
lower CAP? The story is only beginning to unfold with doubt being cast on whether markets really
are judged fairly.
21
Rent Volatility
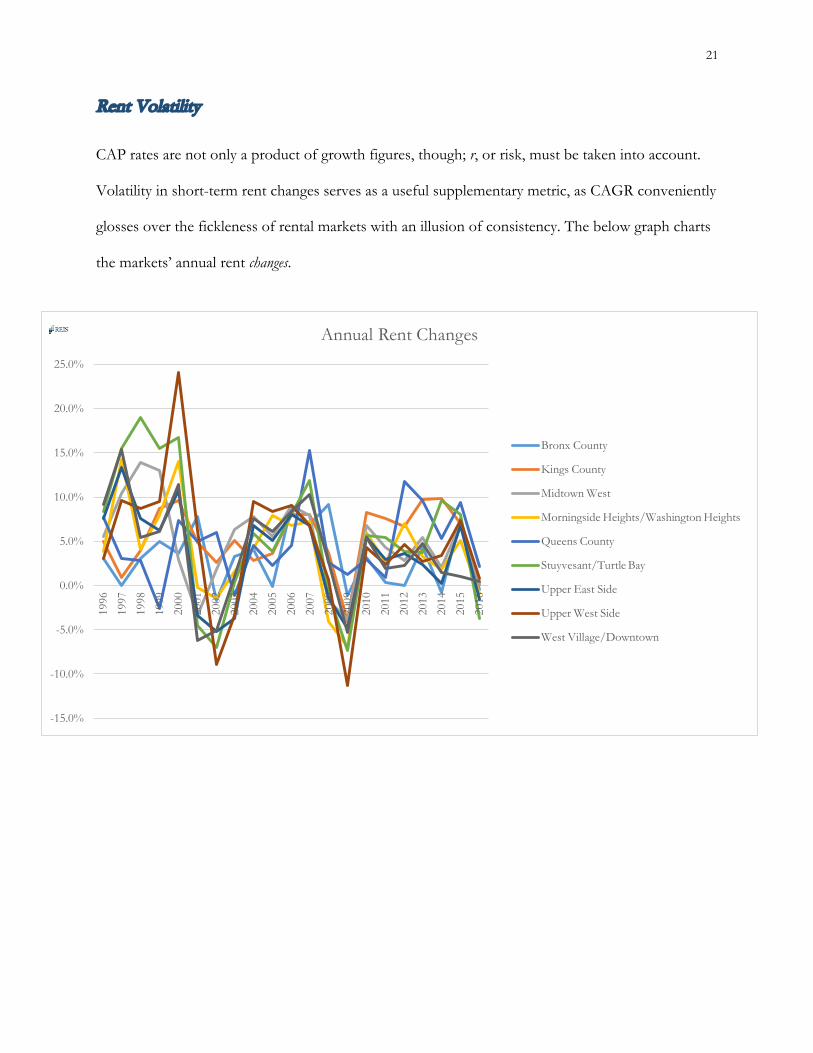
CAP rates are not only a product of growth figures, though; r, or risk, must be taken into account.
Volatility in short-term rent changes serves as a useful supplementary metric, as CAGR conveniently
glosses over the fickleness of rental markets with an illusion of consistency. The below graph charts
the markets’ annual rent changes.
-15.0%
-10.0%
-5.0%
0.0%
5.0%
10.0%
15.0%
20.0%
25.0%
1996
1997
1998
1999
2000
2001
2002
2003
2004
2005
2006
2007
2008
2009
2010
2011
2012
2013
2014
2015
2016
Annual Rent Changes
Bronx County
Kings County
Midtown West
Morningside Heights/Washington Heights
Queens County
Stuyvesant/Turtle Bay
Upper East Side
Upper West Side
West Village/Downtown

22
To synthesize this data further, though, here are graphs on rent change ranges (maximums and
minimums) as well as standard deviations.
Unsurprisingly, the growth markets generally had the most volatility3, which is in line with the theory
that higher growth, and therefore return, goes hand-in-hand with greater risk. But what is again
shocking are those two same submarkets, the Upper East Side and the Bronx. The former had the
greater range of rent changes and the larger standard deviation of the two. In fact, the Bronx’s
metrics turn out to be the most timid out of any market with the dead-last lowest rankings in
standard deviation, at 3.5%, and YOY rent decrease, at 1.7%. While indeed the upside is capped in
the Bronx as well, the market having had the smallest rent increase in any given year, at 9.2%, it is by
any measure fair to call the Bronx the safest market of the nine studied when it comes to YOY rent
movements.
3 Note that these are ranges and standard deviations of rent changes, not of the rents themselves, which rules out the possibility of a high standard deviation being merely a reflection of a consistently high growth rate. The only type of activity that could potentially confound this inference would be if these markets had a consistently positive and geometric (i.e. exponential) rate of growth, which is shown not to be the case by their wide range and erratic fluctuations.
-15.0%-10.0%-5.0%0.0%5.0%
10.0%15.0%20.0%25.0%30.0%
Rent Change Range, 1995-2016
3.5%3.6%
4.8%5.2%
4.3%7.6%
5.3%7.3%
5.5%
0.0% 2.0% 4.0% 6.0% 8.0% 10.0%
Bronx CountyKings County
Midtown WestMorningside …
Queens CountyStuyvesant/Turtle Bay
Upper East SideUpper West Side
West Village/Downtown
Rent Change Standard Deviation, 1995-2016

23
VACANCY RATES
The second fundamental metric analyzed in this work is that of vacancy rates. Vacancy rates can
serve as a measure reciprocal to rent changes of an overall market’s strength or weakness, as they
give a holistic view of the current balance between supply and demand. While the two metrics are
undeniably correlated, vacancy rates perhaps isolate the variable of risk a bit more, whereas rent
changes can incorporate market growth characteristics as well.
Annual Vacancy Rates
Below is each market’s annual vacancy rate between 1995 and 2016:
Bronx County, 1.6%
Kings County, 5.0%
Midtown West, 4.0%
Morningside Heights/Washington Heights,
2.7%
Queens County, 5.3%
Stuyvesant/Turtle Bay, 2.1%
Upper East Side, 1.4%
Upper West Side, 3.3%
West Village/Downtown, 2.0%
0.0%
1.0%
2.0%
3.0%
4.0%
5.0%
6.0%
7.0%
8.0%
9.0%
Annual Vacancy Rates

24
Submarket vacancies vary widely and have moved erratically throughout the period, making it
difficult to discern any meaningful pattern from the raw data. Rather, the below averages provide
some more color to how each market’s vacancies have performed:
Average Vacancy Rates
It’s striking to see how tight a
rental market New York City is,
with average vacancies over a
twenty-one-year period just
barely crossing the 3% threshold
across all nine submarkets. In any
case, just as with the rental data,
the vacancy figures do not fail to shock. Understandably, the growth markets of Brooklyn, Midtown
West, Morningside Heights, Queens, Stuyvesant Town, and the Upper West side all exhibited
average rates above 2%. Higher return came with higher risk. But the Upper East Side, at 1.8%,
exhibited a higher average vacancy rate than did the Bronx, at 1.5%, during this period. More
curious still, the Bronx actually has had the lowest average vacancy rate out of any of the nine
surveyed in New York City. Additionally, the Bronx and the Upper East Side are essentially neck-
and-neck with their current vacancy rates at 1.6% and 1.4%, respectively.
1.5%2.7%
3.0%3.2%
2.7%2.3%
1.8%2.2%
2.8%
0.0% 0.5% 1.0% 1.5% 2.0% 2.5% 3.0% 3.5%
Bronx CountyKings County
Midtown WestMorningside …
Queens CountyStuyvesant/Turtle Bay
Upper East SideUpper West Side
West Village/Downtown
Average Vacancy Rates, 1995-2016

25
Vacancy Rate Volatility
Similar to the CAGR metric, averages can mask unsightly anomalies in data sets, so it isn’t enough to
extrapolate from such metrics alone. But the ranges and standard deviations only further reinforce
the Bronx’s stability:
The Bronx has had the third-lowest minimum vacancy rate at .4% (second only to Stuyvesant Town
and the Upper West Side, both tied at .3%) as well as the lowest maximum vacancy rate at 2.6%, the
latter of which is a full 210 basis points beneath the second lowest figure of 4.7% on the Upper East
Side. It comes as no surprise, then, that the Bronx also has the lowest standard deviation among all
the markets.
0.00%1.00%2.00%3.00%4.00%5.00%6.00%7.00%8.00%9.00%
Bron
x Co
unty
Kin
gs C
ount
y
Mid
tow
n W
est
Mor
ning
side …
Que
ens C
ount
y
Stuy
vesa
nt/T
urtle
Bay
Upp
er E
ast S
ide
Upp
er W
est S
ide
Wes
t …
Vacancy Rate Range, 1995-20160.0% 0.5% 1.0% 1.5% 2.0%
Bronx County
Kings County
Midtown West
Morningside …
Queens County
Stuyvesant/Turtle Bay
Upper East Side
Upper West Side
West Village/Downtown
Vacancy Rate Standard Deviation, 1995-2016

26
RETURNS ANALYSIS
In summary thus far, it’s evident that buyers and sellers have not and do not accurately price real
estate markets in New York City, particularly the Bronx and the Upper East Side. The Bronx is
harshly prescribed significantly higher CAP rates despite safer vacancy rate characteristics, more
stable rent movements, and only a marginally slower rent growth rate. While this analysis might be
intellectually stimulating, a burning question remains: is this purely an academic pursuit, or is there a
real investment opportunity hidden in the numbers? To find out, let’s model it out.
Bronx & Upper East Side Internal Rates of Return
The main metric used to compare the returns across these three markets is the internal rate of return
(IRR). While other measures, such as equity multiple and cash-on-cash, are commonly used as well
to value properties, the IRR, hold period held constant, is an all-encompassing representation of
capital appreciation over time, and, as importantly, factors in the time value of money.4
Below is a graphical representation of the the internal rates of return for the Bronx and the Upper
East Side for all possible hold periods between 2002 and 20165.
4 Used to arrive at the IRR are: historical rent and vacancy rates combined with a uniform 40% expense ratio to constitute a working Net Operating Income. Historical CAP rates are then applied to those numbers to determine acquisition and disposition prices. Taxes are not factored in, as different investors are exposed to different taxation rates, with even some experiencing no tax burden (i.e. state pension funds). 5 Each line is a representation of a market’s performance over several different hold lengths but based on only one acquisition year. Each data point is the IRR that would have been achieved by an asset sold in that year and held since the year at which the line begins. For example, for the Bronx, the longest line represents an asset bought in the market in 2002. The first year that asset could have been sold, 2003, would have resulted in a 23% IRR, the next year, 2004, a 31% IRR, and so on. The next-longest line represents an asset bought in 2003 and sold in 2004 at a 40% IRR, in 2005 at a 29% IRR, and so on. There are 104 total combinations throughout this period.

27
Bought in 2003 and sold in 2004 Bought in 2002 and sold in 2003
23%
31%27%
24%22% 21%
16%14% 15%
13% 14% 14% 15% 15%
40%
29%
24%21% 21%
14%12%
14%12% 12% 13% 14% 14%
19%17% 15% 16%
9%7%
10%8% 8% 9% 11% 11%
15% 13%15%
6%4%
8%6% 7% 8%
10% 10%12%15%
3%1%
6%4% 5% 7%
9% 9%
19%
-1% -3%
5%2%
4%6%
9% 9%
-19%
-13%
0%-2%
1%4%
7% 8%
-6%
13%
5%8%
10%13% 13%
37%
12%14%
16%19% 18%
-11%
2%
8%
14% 14%
18%21%
25%22%23%
29%
24%
36%
24%
13% 13%
-30%
-20%
-10%
0%
10%
20%
30%
40%
2002 2003 2004 2005 2006 2007 2008 2009 2010 2011 2012 2013 2014 2015 2016
Inte
rnal
Rat
e of
Ret
urn
Hold Length & Year of Disposition
IRR Comparison: The Bronx
2%
16% 17%21% 20% 20%
15% 14% 15% 14% 15% 15% 14% 15%
33%
26%29%
26% 25%
18% 16% 17% 16% 17% 17% 16% 16%20%
28%24% 23%
14% 13% 14% 13% 15% 15% 14% 14%
36%
26% 24%
13% 11% 13% 12% 14% 14% 13% 14%16%
18%
5% 5%8% 8%
10% 11% 10% 11%
21% 21%
-1%1%
6% 6%9% 10% 9% 10%
-19%
-8%
1% 2%7% 8% 8% 9%
6%
14%11%
15% 15% 14% 14%
23%
15%19% 18%
16% 16%
6% 6%
16% 16%14% 14%
28%
21%
17% 17%15%
11%13%
7%
13%
18% 18%
-30%
-20%
-10%
0%
10%
20%
30%
40%
2002 2003 2004 2005 2006 2007 2008 2009 2010 2011 2012 2013 2014 2015 2016
Inte
rnal
Rat
e of
Ret
urn
Hold Length & Year of Disposition
IRR Comparison: The Upper East Side

28
Internal Rates of Return by Hold Length
To many an investor’s relief, the Upper East Side outperformed the Bronx swimmingly throughout
the fourteen years studied. Here is the same data, averaged out and synthesized by hold length6:
Across the 104
combinations, the
Upper East Side
averaged a 14.2% IRR
whereas the Bronx, a
12.2%, with the former
beating the latter in 12
out of the 14 hold
length possibilities.
Internal Rate of Return Bifurcation
In light of the fundamentals of each submarket (rents and vacancies) challenging investor
convictions (CAP rates) in these submarkets, why is it that the Upper East Side is such a better
investment than the Bronx? The first conclusion to leap for would be ascribing the bound to the
higher rental CAGR showcased above: 3.11% vs. 3.37%. However, a twenty-six-basis-point stronger
rent growth on the UES could hardly justify such a great spread in IRR. We also know that it can’t
be due to vacancy rates, since the Bronx had both lower average and (most of the time) annual
figures in this regard. This thus rules out the income (NOI) variable as the primary cause for the
difference in the formula, Price = NOI/CAP rate, leaving us with CAP rates as the remaining
6 The ‘sample size’ for each hold period is inversely proportional to the number of years in that period. For example, there are fourteen 1-year-hold data points, thirteen 2-year-hold data points, and so on. The average is for all data points, with each hold period given equal weight.
12.2%14.2%
0.0%2.0%4.0%6.0%8.0%
10.0%12.0%14.0%16.0%18.0%
1 2 3 4 5 6 7 8 9 10 11 12 13 14
Inte
rnal
Rat
e of
Ret
urn
Hold Length
Average Investment Returns by Hold Length, 2002-2016
The Bronx
The Bronx Average
Upper East Side
Upper East Side Average

29
variable. The below graph of the IRRs in each market bifurcated by cash flow and gain (that is, how
much of the IRR is due to cash flow and how much, to capital gains), helps to clarify.
The Bronx gets the
lion’s share of its return
from cash flow (74%),
whereas the Upper East
Side, the inverse (24%),
indicating that the
Upper East Side’s
greater IRR is due to an
increase in asset price. And, since the rents and vacancies in the markets have not been too
dissimilar, it must be that the buoyant asset values on the Upper East Side are due to CAP rate
change and not NOI change.
The Bronx Average, 74%
Upper East Side Average, 24%
0.0%10.0%20.0%30.0%40.0%50.0%60.0%70.0%80.0%90.0%
100.0%
1 2 3 4 5 6 7 8 9 10 11 12 13 14
% o
f IRR
from
Cas
h Fl
ow
Hold Length
% Return from Cash Flow by Hold Length, 2002-2016
30
CAP RATES REVISITED
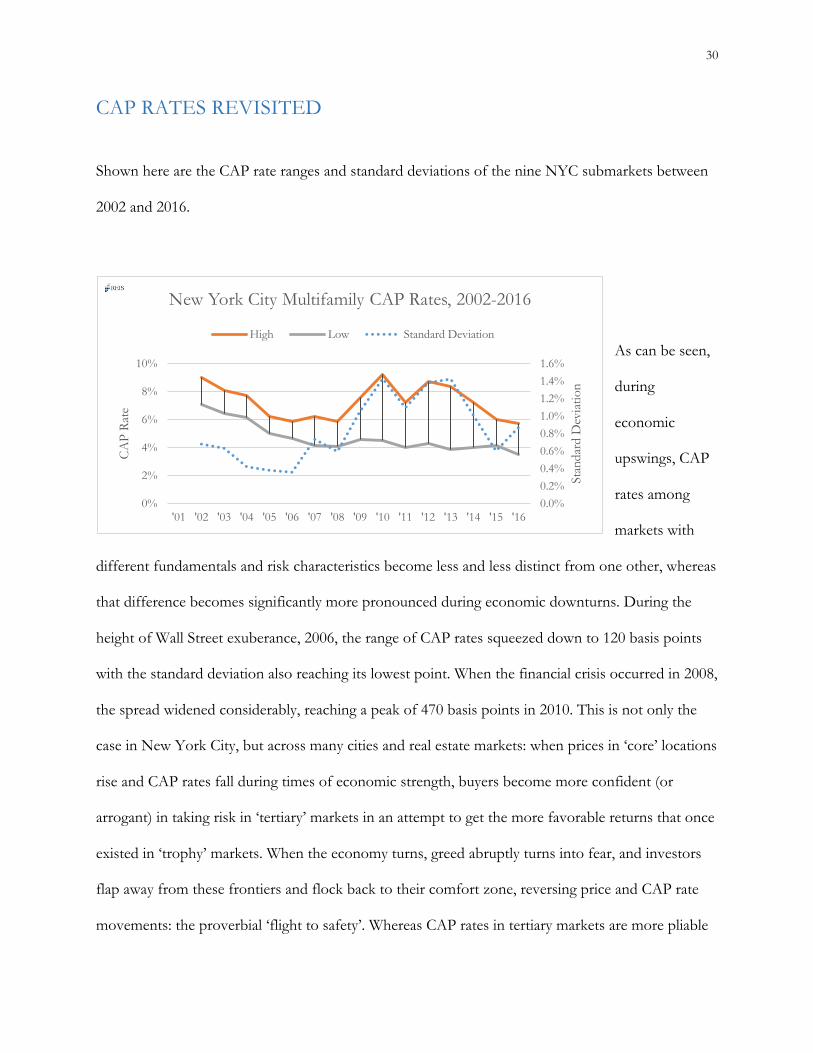
Shown here are the CAP rate ranges and standard deviations of the nine NYC submarkets between
2002 and 2016.
As can be seen,
during
economic
upswings, CAP
rates among
markets with
different fundamentals and risk characteristics become less and less distinct from one other, whereas
that difference becomes significantly more pronounced during economic downturns. During the
height of Wall Street exuberance, 2006, the range of CAP rates squeezed down to 120 basis points
with the standard deviation also reaching its lowest point. When the financial crisis occurred in 2008,
the spread widened considerably, reaching a peak of 470 basis points in 2010. This is not only the
case in New York City, but across many cities and real estate markets: when prices in ‘core’ locations
rise and CAP rates fall during times of economic strength, buyers become more confident (or
arrogant) in taking risk in ‘tertiary’ markets in an attempt to get the more favorable returns that once
existed in ‘trophy’ markets. When the economy turns, greed abruptly turns into fear, and investors
flap away from these frontiers and flock back to their comfort zone, reversing price and CAP rate
movements: the proverbial ‘flight to safety’. Whereas CAP rates in tertiary markets are more pliable
0.0%0.2%0.4%0.6%0.8%1.0%1.2%1.4%1.6%
0%
2%
4%
6%
8%
10%
'01 '02 '03 '04 '05 '06 '07 '08 '09 '10 '11 '12 '13 '14 '15 '16
Stan
dard
Dev
iatio
n
CA
P Ra
te
New York City Multifamily CAP Rates, 2002-2016
High Low Standard Deviation
31
across financial and economic cycles, core market CAP rates maintain stability more-or-less
indefinitely.
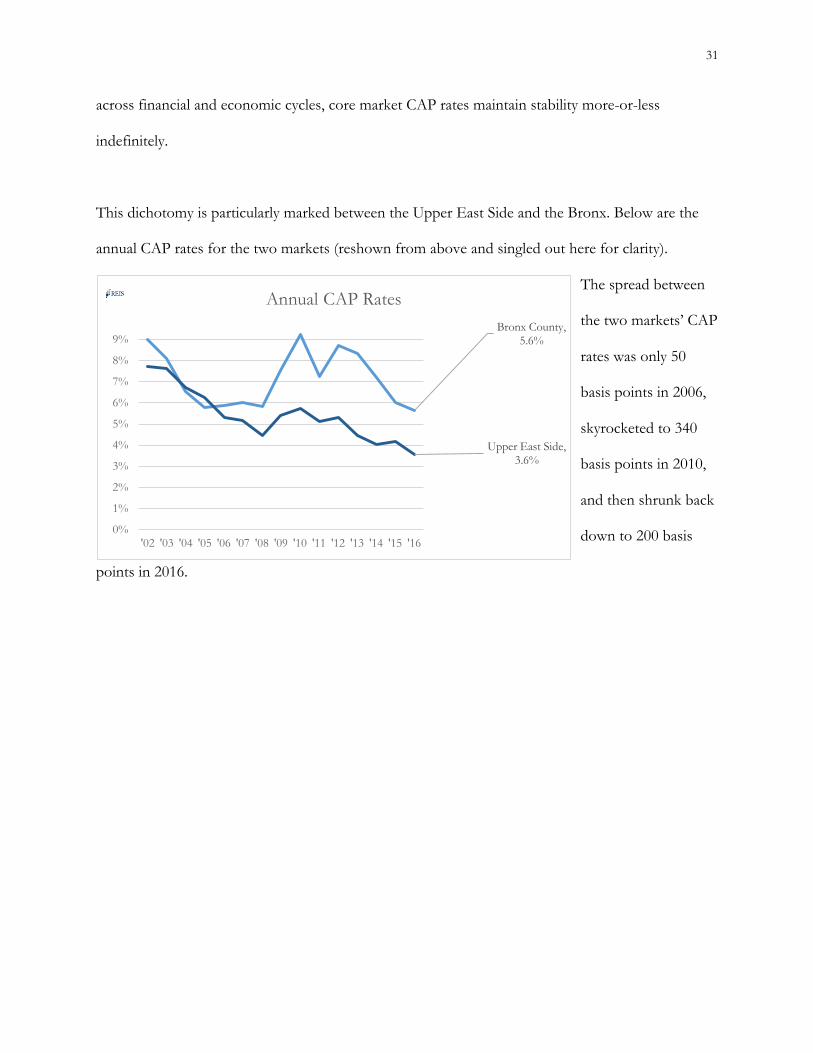
This dichotomy is particularly marked between the Upper East Side and the Bronx. Below are the
annual CAP rates for the two markets (reshown from above and singled out here for clarity).
The spread between
the two markets’ CAP
rates was only 50
basis points in 2006,
skyrocketed to 340
basis points in 2010,
and then shrunk back
down to 200 basis
points in 2016.
Bronx County, 5.6%
Upper East Side, 3.6%
0%
1%
2%
3%
4%
5%
6%
7%
8%
9%
'02 '03 '04 '05 '06 '07 '08 '09 '10 '11 '12 '13 '14 '15 '16
Annual CAP Rates

32
CONCLUSIONS: WHY IT ALL MATTERS
To echo what’s been established already, real estate values are determined by two variables: income
and multiple. The income component of the Bronx, in the form of rents and vacancies, is shown to
have very little appreciable difference in growth and, better yet, superior risk (volatility)
characteristics to those of the Upper East Side. However, the investment returns for the Upper East
Side beat out those for the Bronx relatively consistently, and that is due to the Upper East Side’s
CAP rate reliability. If this is the case, the primary driver of return in the Upper East Side, a core
market, has little to do with the actual fundamentals of that market, the supply and demand
characteristics of housing and the underlying tenants it serves, but more to do with the supply and
demand attributes of capital markets and asset buyers and sellers.
While this case study is limited to New York and the few submarkets within it, broader conclusions
can be drawn upon real estate investing as well as on investing theories more generally.
--
Intrinsic Value
“That painting cost $60,000 10 years ago. I could sell it today for $600,000. The illusion has become real. And the more real it becomes, the more desperately they want it. Capitalism at its finest.” -Gordon Gekko, Wall Street
Many long-term investors today employ some form of ‘fundamental analysis’ in valuing assets,
which is a methodology for making investment decisions based on the asset’s underlying
characteristics as a cash-flow-generating company/stock/bond/piece of real estate/etc. More

33
specifically, fundamental analysis advocates estimating and discounting an asset’s future net cash
flows back to the present using an appropriate discount rate, thus incorporating both the time value
of money as well as risk into the valuation of any security. Examples of these include the Capital
Asset Pricing Model, the Discount Dividend/Gordon Growth Model, and the Arbitrage Pricing
Theory, among others. All fundamental analyses have as a cornerstone the concept of ‘intrinsic
value’, perhaps most plainly cemented by John Burr Williams in his 1938 text, The Theory of Investment
Value, which is the value or price of the security derived from this method. For example, a dividend-
less stock projected to be worth $40 in 3 years would have an intrinsic value of approximately $30
today at a discount rate of 10%.
In this form of analysis, the discount rate is crucial in determining intrinsic value, and it is entailed
that this number should be matched perfectly with the risk of the asset in question: a higher
projected volatility/risk of loss should be accompanied by a higher discount rate, thereby reducing
the estimated value of the asset today.
Champions of the Efficient Market Hypothesis, a theoretical framework for how the market
functions developed by Eugene Fama, posit that market prices at all times accurately reflect the
underlying security’s intrinsic value. That is, market participants are rational and incorporate
information nigh-instantaneously and accurately into buying and selling decisions, thrusting prices to
equilibrium risk-return ratios. No investor will find a moment when price diverges from intrinsic
value.
Students of the school of Value Investing, an investment paradigm or ‘style’, on the other hand,
counter this hypothesis with the criticism that market participants, while perhaps prompt in reacting

34
to new information, are neither rational nor accurate when incorporating that information into
security prices; at least not all of the time. Perhaps prices reflect intrinsic value most of the time, but
in rare instances, they don’t. And it is in these rare instances when price diverges from value that the
value investor has an opportunity to profit from an inefficiency by buying when the price dips below
value, and selling when the market realizes its error and adjusts the price accordingly (assuming a
long position). The value investor is thus a heretic to the efficient market gods and instead
proselytizes a mostly efficient market: intrinsic value may diverge from market value in the short term
on some securities, but it will return to it eventually or in the long term.
intrinsic |inˈtrinzik, -sik| adjective belonging naturally; inherent, innate, inborn, congenital, connate, natural
value |ˈvalyo ͞o| noun the regard that something is held to deserve; the importance, worth, or usefulness of something
While value investors and efficient market theorists disagree on whether and when market prices
coincide with value, they both agree that the concept of intrinsic value does in fact have merit and
that it exists as the one ‘true’ value of a security: it is inherent to the asset; a ‘correct’ or ‘real’ value,
determined by a discount rate that places a perfect premium over the risk free rate; not attributed
externally but rather determined by the fundamental risk of the asset and the ‘natural laws’ of
finance. Benjamin Graham, the godfather of value investing, alludes to this reverence for the
supremacy of intrinsic value: “You are neither right nor wrong because the crowd disagrees with
you. You are right because your data and reasoning are right.”
Phil Fisher, more associated with the school of Growth Investing, also writes in his investment
classic, Common Stocks and Uncommon Profits:
“A change in net income, a change in a company’s management, appearance of a new invention or a new discovery, a change in interest rates or tax laws… All these influences have one thing in common. They are real occurrences in the world about us. They are actions which have happened or are about to happen. Now we come to a very different type

35
of price influence. This is a change which is purely psychological. Nothing has changed in the outside or economic world at all. The great majority of the financial community merely look upon the same circumstances from a different viewpoint than before. As a result of this changed way of appraising the same set of basic facts, they make a changed appraisal of the price or the price-earnings ratio they will pay for the same shares. These are fads and styles in the stock market just as there are in women’s clothes.”7
Our study on NYC multifamily markets calls this presumption of intrinsic value’s “correctness” into
question, however. Recall that, compared against the Upper East Side, the Bronx has better vacancy
and similar rent metrics, but higher CAP rates throughout the period studied. CAP rates in the
Bronx haven’t just been higher on an average, but also almost consistently on an annual basis
between 2002 and 2014 (the exceptions being in 2004 and 2005, when the Bronx had CAP rates just
20 basis points and 40 basis points lower than the UES, respectively). In other words, despite their
similar risk and growth characteristics, they are priced differently by investors. There are only two
possible explanations for this hypocrisy: assets in the Bronx have intrinsic values that prices simply
never meet or the method used to arrive at intrinsic value for assets in the Bronx is different from
that which is used for those in the Upper East Side. If the latter explanation be the apt one, how can
two cash-flowing assets be valued by different standards? Investment science has no place for Janus-
faced valuation methodologies. And in the former case, one might ask, what’s the point of a metric
that never coincides with price? Would it not just be some hollow academic calculation, unavailing
to any practitioner who values investment results over vague philosophies of value itself? William
Strong of Equinox Partners describes the importance of mostly efficient markets in an interview he
gave to the Heilbrunn Center for Graham and Dodd Investing at Columbia University:
Graham & Doddsville: Given the fact that the [company you had invested in] had been growing but that [its] stock was flat until approximately a year ago, was it frustrating as an investor? Strong: It’s a two-sided coin. If you have a perfectly efficient market, where business values are always reflective of business fundamentals, then we are out of business. If you have a perfectly imperfect market, where the stock market never reflects fundamentals, then we
7 (Fisher, 155-156)

36
are out of business. Markets generally value fundamentals properly. Our job is to find exceptions to this and take advantage of it. This is what value investing is all about.8
I opt for this latter explanation of the Bronx, outlined by Strong. It is a perfectly imperfect market,
inefficient and underpriced (or the Upper East Side, inefficient and overpriced), and it stays that way
indefinitely. The intrinsic value is indeed there, however the value investor’s cherished ‘reversion to
the mean’ never happens. There is nothing novel about markets that perform as such. Benjamin
Graham, in his magnum opus, The Intelligent Investor, admitted that his strategy of “determine intrinsic
value, buy below it, wait for the market to agree” doesn’t apply universally:
Secondary issues, for the most part, do fluctuate about a central level which is well below their fair value [and]… if most secondary issues tend to be undervalued, what reason has the investor to believe that he can profit from such a situation? For if it persists indefinitely, will he not always be in the same market position as when he bought the issue?9 While small companies may… be undervalued for similar reasons, and in many cases may later increase their earnings and share price, they entail a risk of… protracted neglect by the market in spite of better earnings.10
Graham’s ‘secondary issues’ are analogous to submarkets of major MSAs like the Bronx which
suffer from ‘protracted neglect by the market in spite of better earnings’.
Investing vs. Speculating
Value investors pride themselves on basing their underwriting on fundamental analysis as opposed
to on ‘speculation’. Seth Klarman in his Wall Street cult classic, Margin of Safety, distinguishes
between the two:
Assets and securities can often be characterized as either investments or speculations. The distinction is not clear to most people. Both investments and speculations can be bought and
8 https://www8.gsb.columbia.edu/sites/valueinvesting/files/files/Graham%20%26%20Doddsville%20-%20Issue%2014%20-%20Winter%202012.pdf 9 (Graham, 172-177) 10 (Graham, 163)

37
sold. Both typically fluctuate in price and can thus appear to generate investment returns. But there is one critical difference: investments throw off cash flow for the benefit of the owners; speculations do not. The return to the owners of speculations depends exclusively on the vagaries of the resale market… Stocks and bonds go up and down in price, as do Monets and Mickey Mantle rookie cards, but there should be no confusion as to which are the true investments. Collectibles, such as art, antiques, rare coins, and baseball cards, are not investments, but rank speculations… Investments, even very long-term investments like newly planted timber properties, will eventually throw off cash flow. A machine makes widgets that are marketed, a building is occupied by tenants who pay rent, and trees on a timber property are eventually harvested and sold. By contrast, collectibles throw off no cash flow; the only cash they can generate is from their eventual sale… The apparent value of collectibles is based on circular reasoning: people buy because others have recently bought. This has the effect of bidding up prices, which attracts publicity and creates the illusion of attractive returns. Such logic can fail at any time.11
Klarman’s overarching opinion is that the difference between investments and speculations is found
in the asset’s main driver of value: true investment worth is rooted in the consumer marketplace
whereas that of speculations, in the capital marketplace. The former is depicted as being grounded in
reality, echoing the abstraction of ‘intrinsic value’ as being the ‘real’ or ‘true’ value, whereas the latter,
in a more capricious and flimsy ‘sardine can’12 market. But, as shown above, the Upper East Side
gains the majority of its return from that same ‘resale’ market and, more importantly, does so safely
across financial ccycles, defying the notion that this source of profit is a shaky one.
Howard Marks, of Oaktree Capital Management, calls attention to a subtle nuance in one of his
quarterly investment memos (emphasis added):
In short, there are two primary elements in superior investing: • seeing some quality that others don’t see or appreciate (and that isn’t reflected in the
price), and • having it turn out to be true (or at least accepted by the market).13
11 (Klarman, 7-8) 12 “There is the old story about the market craze in sardine trading when the sardines disappeared from their traditional waters in Monterey, California. The commodity traders bid them up and the price of a can of sardines soared. One day a buyer decided to treat himself to an expensive meal and actually opened a can and started eating. He immediately became ill and told the seller the sardines were no good. The seller said, “You don’t understand. These are not eating sardines, they are trading sardines.” (Klarman, 5) 13 (Marks, 2007)
38
Or at least accepted by the market. Understandably, the two outcomes of ‘truth’ or ‘acceptance by
market’ are used somewhat interchangeably, since, for all intents and purposes, that’s all that matters
to an investor. A harmony in target price and market price is all that is needed for financial profit,
regardless of whether it’s rooted in truth or mere mob mentality. However, the line between
objectivity (true value) and subjectivity (ascribed value) is blurred; intrinsic value and market price
are much more interrelated than is purported by traditional value investing lore. Certain markets
tend to behave more in line with George Soros’s paradigm of price behavior (as influenced by his
mentor, philosopher Karl Popper), reflexivity:
In situations that have thinking participants, there is a two-way interaction between the participants’ thinking and the situation in which they participate. On the one hand, participants seek to understand reality; on the other, they seek to bring about a desired outcome. I call the interference between the two functions “reflexivity”… a feedback loop between the participants’ understanding and the situation in which they participate… Financial markets… operate with a prevailing bias, but the bias can actually validate itself by influencing not only market prices but also the so-called fundamentals that market prices are supposed to reflect… This is how reflexivity gives rise to initially self-fulfilling… prophesies.14
Seth Klarman also readily accepts Soros’s model as applicable in some circumstances:
Reflexivity is a minor factor in the valuation of most securities most of the time, but occasionally it becomes important. This phenomenon is a wild card, a valuation factor not determined by business fundamentals but rather by the financial markets themselves.15
A self-fulfilling prophecy is a befitting description for the phenomenon in the Bronx: the market is
deemed risky for a reason that has nothing to do with the fundamentals (i.e. fear of illiquidity, biases
and stigmas, fear of getting mugged on a property tour, or ‘noise’, as statisticians might call it). This
perception leads to higher CAP rates and less asset liquidity. Since these characteristics are indeed
real risks, buyers are hesitant to invest in the assets, which in turn keep CAP rates high and liquidity
14 (Soros, 2-6) 15 (Klarman, 137)

39
low. Therefore, perceived risk leads to real risk, and unwarrantedly high CAP rates leads to
deservedly high CAP rates. And thus, market price movements are an important component of intrinsic
value and not merely a reflection of it. Economic science is not physical science. “Predictions of the
return of Halley’s comet do not influence its orbit,” writes sociologist Robert Merton in Social Theory
and Social Structure. But by inducing a bank run, “the rumoured insolvency of [fictional] Millingville’s
bank did affect the actual outcome. The prophecy of collapse led to its own fulfilment.”16
The Existential Investor
Klarman further footnotes his definition of investments as those which throw off a stream of cash
flow with another exception:
The only possible exceptions to [the] cash flow test are precious metals, such as gold, which is a widely recognized store of value; throughout history, for instance, the value of an ounce of gold has been roughly equivalent to the cost of a fine men's suit. Other precious metals and gems have a less-established value than gold but might be considered by some to be a similar type of holding.17
Klarman admits that while gold is indeed a store of value, it provides no cash flow and has no
underlying consumer or fundamental demand. Its value stems from the same source that provides
value for speculative investments: the ‘resale’ marketplace for buyers and sellers of the asset itself.
There was a time when gold had utility as a currency due to many of its unique characteristics as a
metal: it is pure, noncorrosive, distinct in color, easy to meld, impossible to produce (at the time),
difficult to counterfeit, and extremely rare. But with modern day’s utilization of fiat currencies, gold
16 (Merton, 477) 17 (Klarman, 31)
40
as a form of legal tender is obsolete. Inexplicably, though, it is still a valuable commodity. Warren Buffet
commented on the oddity in a speech given at Harvard in 1998:
Gold gets dug out of the ground in Africa, or some place. Then we melt it down, dig another hole, bury it again and pay people to stand around guarding it. It has no utility. Anyone watching from Mars would be scratching their head.18
My contention is not that real estate and other financial securities have no utility. It is obvious that
apartments do indeed have a use, as they have an underlying consumer. But, as is shown when
comparing the Upper East Side to the Bronx, the line between stocks, real estate, gold, and art is
much more nebulous than both efficient market theorists and value investors would like to believe.
The returns derived from investments in them are based, in some cases, on the same notion that
gives utility-less gold or art their value: a desire for them to be valuable. It’s worth what we want it to
be worth. “Owning a trophy hotel is like owning art,” one real estate investor told me. While some
investors deplore buyers and sellers who rely on the herd mentality to make their investment
decisions, they too depend on that same herd to see their investments to a successful conclusion.
Isolationist contrarianism must capitulate to the reality that, in the end, their fellow market
participants have as significant an impact on their investments as do the underlying fundamentals of
the investments themselves.
--
The Bronx has been shown to have similar growth characteristics and superior risk characteristics to
those of the Upper East Side, yet CAP rates have consistently not reflected this. While an analysis of
Manhattan multifamily assets can by no means extend universally to all financial securities, the
18 (Mortished, 2003)

41
inefficiency among some of the different markets can exhibit the spirit of some of the myths and
misconceptions propounded by the investment community. Although Graham and other value
investors maintain the preeminence of fundamental analysis in spite of the above-outlined
shortcomings, I argue that this methodology of valuation is called into question because of these
imperfections. If intrinsic value never coincides with market price, it’s debatable whether it’s useful
as an investment metric for those in search of an above-market risk-adjusted return, or if it even exists
beyond an idealist’s theory. Terms like “relative”, “subjective”, or even “extrinsic” are more apt than
the word ‘intrinsic’, since ‘intrinsic value’, as has been shown here, is an oxymoron.
An economics professor and his student are strolling down the street. They come upon a $100 bill
lying on the ground, and as the student reaches down to pick it up, the economist says, “Don’t
bother – if it were a genuine $100 bill, someone would have already picked it up.”
If there were $100 lying on a Bronx street corner, perhaps it’d be best to leave it there. Nobody
would accept a $100 bill that no one would accept.

42
BIBLIOGRAPHY Baghdasaryan, A., Jaspan, J., DeBartolo, M., Hedstrom, J., Lubel, J. (Editors). (2012, Winter). Retrieved from Heilbrunn Center for Graham & Dodd Investing website https://www8.gsb.columbia.edu/sites/valueinvesting/files/files/Graham%20%26%20Doddsville%20-%20Issue%2014%20-%20Winter%202012.pdf Fisher, P.A. (1958). Common Stocks & Uncommon Profits. New York, NY: Harper & Brothers. Graham, B. (1949). The Intelligent Investor. New York, NY: Harper & Brothers. Klarman, S.A. (1991). Margin of Safety. New York, NY: HarperCollins. Los Angeles Department of Transportation. (2016). Historical Count Data. Retrieved from LA DOT website http://ladot.lacity.org/node/581 Marks, H. (2007, April 26). Everyone Knows. Memos from Howard Marks. Retrieved from https://www.oaktreecapital.com/docs/default-source/memos/2007-04-26-everyone-knows.pdf?sfvrsn=2 Merton, R.K. (1968). Social Theory and Social Structure. New York, NY: Free Press. Mortished, Carl. (2003). Demand for Global Listing Helps to Put New Gloss on Gold. The Times (UK), Business Section. Retrieved from http://www.thetimes.co.uk/tto/business/article2121913.ece Soros, G. (1987). Alchemy of Finance. Hoboken, NJ: John Wiley & Sons. Stone, O. (Director) & Pressman, E.R. (Producer). (1987). Wall Street. United States: American Entertainment Partners & Amercent Films. Williams, J.B. (1938). The Theory of Investment Value. Cambridge, MA: Harvard University Press.