The Myth of Dynastic Wealth: The Rich Get Poorer Myth of Dynastic Wealth: The Rich Get Poorer ......
39
The Myth of Dynastic Wealth: The Rich Get Poorer Robert Arnott, William Bernstein, and Lillian Wu Thomas Piketty’s Capital in the Twenty-First Century rocketed to the top of the best-seller lists the moment it was published in 2013, and remained there for months. While this feat is quite remarkable for a weighty tome on economics, it’s no mystery why Piketty’s mag- num opus created such a sensation; it is clearly articulated, is acces- sible to the non-economist, and contains a trove of historical insights. We believe Piketty’s core message is provably flawed on several lev- els, as a result of fundamental and avoidable errors in his basic assump- tions. 1 He begins with the sensible presumption that the return on invested capital, r, exceeds macroeconomic growth, g, as must be true in any healthy economy. But from this near-tautology, he moves on to presume that wealthy families will grow ever richer over future gener- ations, leading to a society dominated by unearned, hereditary wealth. Alas, this logic holds true only if the wealthy never dissipate their wealth through spending, charitable giving, taxation, ill-advised invest- ments, and splitting bequests among multiple heirs. As individuals, and Cato Journal, Volume 35, No. 3 (Fall 2015). Copyright © Cato Institute. All rights reserved. Robert Arnott is Chairman of Research Affiliates, LLC; William Bernstein is co- principal of Efficient Frontier Advisors; and Lillian Wu is a Research Analyst at Research Affiliates, LLC. 1 In addition to the lively debate about Piketty’s core message, there has been vigorous discussion of the data sources used by Piketty where some have challenged the valid- ity of data in Piketty’s book. See Feldstein (2014), London (2014), and Reynolds (2014) for more discussion on the subject. We do not engage this topic here. 447
Transcript of The Myth of Dynastic Wealth: The Rich Get Poorer Myth of Dynastic Wealth: The Rich Get Poorer ......

The Myth of Dynastic Wealth:The Rich Get Poorer
Robert Arnott, William Bernstein,and Lillian Wu
Thomas Piketty’s Capital in the Twenty-First Century rocketed tothe top of the best-seller lists the moment it was published in 2013,and remained there for months. While this feat is quite remarkablefor a weighty tome on economics, it’s no mystery why Piketty’s mag-num opus created such a sensation; it is clearly articulated, is acces-sible to the non-economist, and contains a trove of historical insights.We believe Piketty’s core message is provably flawed on several lev-
els, as a result of fundamental and avoidable errors in his basic assump-tions.1 He begins with the sensible presumption that the return oninvested capital, r, exceeds macroeconomic growth, g, as must be truein any healthy economy. But from this near-tautology, he moves on topresume that wealthy families will grow ever richer over future gener-ations, leading to a society dominated by unearned, hereditary wealth.Alas, this logic holds true only if the wealthy never dissipate theirwealth through spending, charitable giving, taxation, ill-advised invest-ments, and splitting bequests among multiple heirs. As individuals, and
Cato Journal, Volume 35, No. 3 (Fall 2015). Copyright © Cato Institute. Allrights reserved.Robert Arnott is Chairman of Research Affiliates, LLC; William Bernstein is co-
principal of Efficient Frontier Advisors; and Lillian Wu is a Research Analyst atResearch Affiliates, LLC.
1In addition to the lively debate about Piketty’s core message, there has been vigorousdiscussion of the data sources used by Piketty where some have challenged the valid-ity of data in Piketty’s book. See Feldstein (2014), London (2014), and Reynolds(2014) for more discussion on the subject. We do not engage this topic here.
447
57496_ch01.qxd:19016_Cato 9/21/15 1:34 PM Page 447

448
Cato Journal
as families, the rich generally do not get richer: after a fortune is firstbuilt, the rich often get relentlessly and inexorably poorer.The evidence Piketty uses in support of his thesis is largely
anecdotal, drawn from the novels of Austen and Balzac, and from thecurrent fortunes of Bill Gates and Liliane Bettencourt. If Piketty isright, where are the current hyper-wealthy descendants of past entrepreneurial dynasties—the Astors, Vanderbilts, Carnegies,Rockefellers, Mellons, and Gettys? Almost to a man (or woman) theyare absent from the realms of the super-affluent. Our evidence—used to refute Piketty’s argument—is empirical, drawn from therapid rotation of the hyper-wealthy through the ranks of the Forbes400, and suggests that, at any given time, half or more of the collec-tive worth of the hyper-wealthy is first-generation earned wealth, notinherited wealth.The originators of great wealth are one-in-a-million geniuses; their
innovation, invention, and single-minded entrepreneurial focus cre-ate myriad jobs and productivity enhancements for society at large.They create wealth for society, from which they draw wealth forthemselves. In contrast, the descendants of the hyper-wealthy rarelyhave that same one-in-a-million genius. Bettencourt, cited by Piketty,is a clear exception. Typically, we find that descendants halve theirinherited wealth—relative to the growth of per capita GDP—every20 years or less, without any additional assistance from Piketty’sredistribution prescription.Dynastic wealth accumulation is simply a myth. The reality is that
each generation spawns its own entrepreneurs who create vast pools ofentirely new wealth, and enjoy their share of it, displacing many of thepreceding generations’ entrepreneurial wealth creators. Today, themassive fortunes of the 19th century are largely depleted and almost allof the fortunes generated just a half-century ago are also gone. Do wereally want to stifle entrepreneurialism, invention, and innovation in aneffort to accelerate the already-rapid process of wealth redistribution?
Piketty’s Core ThesisThe central thesis of Piketty’s book is his prediction that the problem
of unequal wealth distribution will worsen in the 21st century, furtherexacerbating the economic divisions between society’s haves and have-nots. This is where his biases lead him astray. We agree that inequalityin wealth distribution has intensified in the recent past, but we disputePiketty’s rationale for its source and its persistence, as well as his
57496_ch01.qxd:19016_Cato 9/21/15 1:34 PM Page 448

449
Myth of Dynastic Wealth
contention that it is a problem in need of fixing. Piketty devotes thelargest portion of his book to a treasure trove of historical and geograph-ical time-series on income and wealth distributions. Curiously, how-ever, he ignores his own data, basing his predictions and prescriptionsprimarily on what he calls the two “fundamental laws of capitalism.”The first “law” states that capital’s contribution to national income,
denoted as �, can be expressed as
(1) � � r�
where r is the return on capital and � is the capital-to-income ratio,a measure of the capital intensity in a given society. This relationshipis intuitively obvious; if a nation’s capital is 600 percent of nationalincome (or the equivalent of six years of national income), and if thereal return on that capital is 5 percent, then the portion of nationalincome earned from capital will be 30 percent.The classical estimate of capital’s contribution to national income
is 10 percent to 15 percent. Piketty’s estimate of � is higher, for tworeasons. First, his definition of capital is very broad, including notonly investment capital, but also productive industrial assets, realestate, and even public assets, such as highways and national parks.Second, and more importantly, Piketty’s approximation of r, whileperhaps correct in the distant past, is irrelevant in today’s low-yieldworld—but more on that later.Although Piketty’s first fundamental law is self-evident (it is, after
all, purely a definition), his second “law” is less intuitive. The ratio ofcapital to income, �, is defined by:
(2) � � s/g
where s is the savings rate and g the real growth rate of the aggregateeconomy. For example, with a savings rate of 12 percent and an eco-nomic growth rate of 2 percent a year, long-run capital accumulationwill eventually expand to 600 percent of national income. The higherthe savings rate and/or the lower the labor force growth and/or thelower the productivity growth, the higher the �. The equationexpresses a dynamic whose consequences can play out over decades.The relationships represented in Piketty’s second law have impor-
tant implications in a world of slower macroeconomic growth. Ourresearch, and the research of many others, suggests that future economic growth will slow considerably due to two demographicheadwinds. First, labor force growth in the developed world
57496_ch01.qxd:19016_Cato 9/21/15 1:34 PM Page 449

2One of the authors has closely studied the impact of demography on GDPgrowth and on capital market returns; our work suggests that these demographicpressures will serve to reduce both growth and asset class returns. In Arnott andChaves (2012), the relative impact of demography is more stark for asset classreturns than for GDP growth. Therefore, we reject the conclusions that Pikettydraws from his anecdotal evidence. However, we should acknowledge that thepending demographic changes are wildly “out of sample”: they represent demo-graphic profiles never seen in human history, so these demographic shifts mayplay out in surprising ways. Models based on past data will be unreliable guidesto the future.3The net savings rate is savings net of capital depreciation and depletion.
has already slowed sharply, even reversing in some developedeconomies. Second, the global labor force is aging. Because produc-tivity growth occurs at a much faster pace for young adults than formature adults who are approaching peak levels of productivity, anolder workforce means fewer productivity gains. A slowdown in pro-ductivity growth is already underway in the developed world, and itis only a matter of time—roughly one generation—before the emerg-ing economies suffer the same fate: sooner in China and Russia, laterin India. If growth is halved, then, ceteris paribus, aggregate capitalmust double as a multiple of income, unless r falls even furtherthan g, either as a consequence of demographic pressures or in par-allel with demographic shifts.2
Over the last 125 years or so, the global capital-to-income ratio,�, has ranged between a low of about 200 percent following the dev-astation wrought by two world wars and a global depression, andtoday’s high of roughly 600 percent, the level also reached duringthe belle époque, or robber baron, period of the late 19th century.Piketty asserts � is going even higher from here, to 700 percent bythe year 2100.3 His claim is based on his estimates of the factors of�—economic growth and the savings rate. He forecasts that annualreal growth in global output will decline by half from the current3.0 percent to 1.5 percent in the second half of the 21st century. Weagree with his expectations of slower growth. But we have to dis-agree with his net savings rate assumption of a constant 10 percent.Is his presumption of a fixed savings rate not a rather heroic assump-tion, given the objective evidence of recent decades?In Piketty’s eyes such a high capital-to-income ratio is cause for
alarm. Why so? Piketty is repelled by a high � because a society’stotal capital, or wealth, is almost always much more unevenly distrib-uted than its income, and a record-high � means a larger pool of
Cato Journal
450
57496_ch01.qxd:19016_Cato 9/21/15 1:34 PM Page 450

4Piketty admits that rmay have fallen and acknowledges that the more capital wethrow at something, the lower its marginal return. But he returns to the idea of a5 percent real return repeatedly, as if it’s a quasi-constant. It’s nowhere near thattoday, and has been at that level only at extreme market lows in recent decades(Arnott and Bernstein 2002).
wealth will soon be disproportionately enjoyed by the wealthiestmembers of society. By way of example, Piketty posits that in 2010the share of earned income of the top 1 percent of American work-ers was 17.4 percent, whereas the top wealthiest 1 percent owned a33.8 percent share of total societal wealth.Elementary finance, though, tells us that this matters little: A dou-
bling of capital wealth due merely to a doubling of valuation, and soto a doubling of the concentration of capital, leaves these 1 percenterswith no increase in the income earned on their capital. Incredibly, inPiketty’s narrative, the return on capital, r, is insensitive to wealthaccumulation, so capital’s contribution to income, �, is largely drivenby the capital-to-income ratio, � (Piketty 2014: 206).4 Indeed, to thoseof us who manage investments, it evokes incredulity to assert that, ifthe return on capital were halved, a concurrent doubling of � wouldnot change the respective rewards to labor and capital. In fact, in ourview, these precise realignments in rewards can almost entirelyexplain the growing wealth inequality of the past 30 years.If slower demographic growth coupled with slower productivity
growth would not reduce the return on capital, then Piketty wouldbe correct that an increasing gap between capital returns andgrowth (r � g) would feed directly into a society’s wealth inequality.Because g has been falling in developed nations, Piketty fears thatwealth inequality may grow to dangerous levels. His fear—shared byOccupy Wall Street and similar groups—is one manifestation of aperceived widening of the social divide. The increasing attentiongiven to this fear and the socioeconomic agendas fueled by it wereimportant catalysts for our decision to pursue the research we pres-ent here, into the objective evidence for or against Piketty’s dynasticwealth narrative.This fear seems to us based on an invalid counterfactual. In fact,
slower growth will affect the return on capital; this is a core assump-tion in modern finance, amply supported by empirical evidence.Having mentioned Piketty’s ideological bias, we must now come
clean about our own. One of us (Arnott) is a free-market libertarian
Myth of Dynastic Wealth
451
57496_ch01.qxd:19016_Cato 9/21/15 1:34 PM Page 451

5In 1997, one of us posed the question, “In the 2,001 years since the supposeddate of the birth of Christ, if one had invested a single dollar [1/350th of an ounceof gold at that time] at 5 percent compounded real return, how much wealthwould one now possess?” The answer was that this investor would now own asphere of gold larger than the earth’s orbit around the sun, growing at nearly10,000 miles in diameter per day. While earning 5 percent real return may bepossible, growing wealth intergenerationally at that rate, over long spans of time,is clearly impossible (Arnott and Bernstein 1997).
and a reluctant Republican, the second (Bernstein) is a registeredDemocrat who is quite comfortable with a vigorous government rolein many economic spheres, and the third (Wu) is a centristRepublican and Berkeley graduate born in communist China. Mostwould acknowledge the moral imperative of a humane response topoverty, which requires some economically efficient redistributionfrom the haves to the have-nots. The tension is, as always, betweendoing too little to help those who cannot help themselves and doingso much that inadequate incentive remains to properly reward inno-vation, invention, hard work, and entrepreneurial risk-bearing, orworse, an incentive to do nothing.In addition, we believe a secondary tension exists between volun-
tary redistribution (charity) and involuntary redistribution (entitle-ment programs). At the risk of being provocative, the differencebetween Ayn Rand and Karl Marx can be distilled down to theirrespective definitions of the optimal amount of, and the central gov-ernment’s role in, redistribution.
What “r – g” Can Investors Expect?To his credit, Piketty recognizes that classical theory mandates that,
as societal wealth increases, the return on capital, r,must fall as a resultof supply and demand pressures as well as the decreasing return tomarginal capital investment. And there he stops. But r also falls for atleast two other reasons. First, increased longevity decreases investors’impatience for immediate consumption and increases their need toprepare for distant future consumption. Second, in recent centuries,the cost of intermediation has tumbled, increasing the attractivenessof, and decreasing the liquidity premium for, capital assets.These are not small points. Piketty repeatedly references a 5 per-
cent rate of return on land and government bonds, as described inthe 19th-century novels of Balzac and Austen, almost as if it were aphysical constant.5 Only one reference to Homer and Sylla’s (2005)
Cato Journal
452
57496_ch01.qxd:19016_Cato 9/21/15 1:34 PM Page 452

encyclopedic A History of Interest Rates, the go-to source for theserious observer of the evolution of capital returns over the broadsweep of history, appears in Piketty’s tome. He makes no mention atall of the contemporary work of Philippe Jorion and WilliamGoetzmann (1999); William Schwert (1990a, 1990b); John Campbelland Robert Shiller (1989); or Elroy Dimson, Paul Marsh, and MikeStaunton (2002) regarding realized returns in the 19th, 20th, andearly 21st centuries.Had he paid attention to these sources, Piketty would have
noticed that over the past five millennia r has fallen from near triple-digit rates to the dramatically less than 5 percent rate of today. JaneAusten’s heroes and heroines may have feasted on 5 percent consols,but already by the end of the 19th century that rate had fallen to2 percent. In a world of fiat currencies, the modern equivalent ofAusten’s consol is the inflation-linked bond (in the United States,these bonds are called TIPS). At the present time, if the issuer hasnegligible risk of default, ultra-long TIPS typically yield approxi-mately 1 percent.Another oversight is Piketty’s disregard for the fact that past
returns on stocks and other real assets, especially in recent decades,have benefited immensely from rising valuation multiples and fallingyields. As with bonds, rising valuation multiples and falling yields inequities, real estate, and other assets deliver higher current returns inexchange for lower future returns. As already mentioned, this hasbeen the key, and generally overlooked, driver of the growing wealthgap in recent decades: financial assets are owned by the wealthy. Asvaluation multiples soar and yields tumble, the liquidation value ofthe assets of the wealthy soars, but their forward-looking returns onthose assets tumble. This bears repeating yet again: If PE ratios dou-ble and dividend yields fall by half, the objective spread between thewealth of the affluent and the general public seems to have doubled,but the sustainable long-term spending on those assets has notchanged by one iota. The gap in spendable wealth is unaltered.Piketty ignores the current landscape of expected real stock and
bond returns, and he presumes that the affluent can readily find 5percent real returns on passive investments. Really? Five percent?We wish! With stocks priced to generate a real return of about 3 per-cent (at this writing, a 1.8 percent dividend yield in the United States.plus, if the last century is a guide, a 1.3 percent growth of real per-share dividends), and 10-year Treasury bonds offering a near-zero
Myth of Dynastic Wealth
453
57496_ch01.qxd:19016_Cato 9/21/15 1:34 PM Page 453

454
Cato Journal
real return, an overall portfolio r of 2 percent seems optimistic forthose who conventionally invest in mainstream stocks and bonds,even assuming they pay no taxes or fees.6 Piketty’s dissociation fromreal-world capital market returns becomes most obvious when hetakes the 5 percent rent-to-purchase-price ratio of Paris flats as pres-ent-day confirmation of this value of r, as if French landlords areabsolved from paying property taxes and utilities, let alone anyexpenses for renovations and maintenance.In both our and Piketty’s views, g has been falling for long-term
secular reasons that are unlikely to reverse. And to the seriousobserver of forward-looking capital market return expectations, r hasfallen even further and faster,7 contributing hugely to capital marketinvestors’ recent lofty returns, raising the value of capital assets, andaggravating the soaring wealth inequality that so troubles Piketty andmany others. If U.S. stocks were trading at the same dividend yieldor Shiller P/E ratio as they were in 1982, the inaugural year of theForbes 400, the S&P 500 Index would be trading at around 600 as ofthis writing, not 2,000, and wealth inequality would be correspond-ingly less impressive.
What of Piketty’s Static Savings Rate?A constant and positive net savings rate implies that the capital
accumulation in any given economy, net of capital depreciation anddepletion, is equal to a constant fraction of the national income everysingle year. Therefore, when economic growth slows drastically,Piketty’s second fundamental law could require up to 100 percent ofthe national income to be devoted to investment in order to maintainhis assumption of a constant and positive net savings rate. This levelof capital reallocation is without historical precedent, and we hope
6Arnott and Bernstein (2002) showed that annual real dividend growth in theUnited States, for broad market portfolios, has averaged less than 1 percent peryear over the past 200 years. Bernstein and Arnott (2003) showed that the U.S.growth rate of 1.3 percent per annum since 1900 was on the high end of theglobal range.7Piketty argues that r is not sensitive to changes in g due to the high (greaterthan 1) elasticity of substitution between capital and labor; an assumption whichnot only conflicts with the vast body of economic theory, but also, as Acemogluand Robinson (2015) point out, lacks empirical support. Rognlie (2014) shows thegap between r and g is likely to shrink when using standard empirical estimatesof elasticity.
57496_ch01.qxd:19016_Cato 9/21/15 1:34 PM Page 454
455
Myth of Dynastic Wealth
even Piketty’s most fervent enthusiasts would agree that it is implau-sible. Certainly, U.S. history over the past half-century suggests thata static savings rate is not realistic, as Figure 1 shows. As labor forcelongevity has increased, economic growth has slowed, and relianceon entitlement programs has grown, savings have inexorablydeclined—albeit with a meaningful savings rate “reset” in the wakeof the 2008 global financial crisis.We are not the only researchers who have challenged Piketty’s
presumption of a static savings rate. Rognlie (2014) suggests that thenet savings rate, s, is unlikely to be exogenous and invariant tochanges in the growth rate, g. Krusell and Smith (2014) derived netsavings rate formulations based on neoclassical growth models. Theirformulation shows that the net savings rate varies positively with thegrowth rate, and when the growth rate falls to zero, the net savingsrate has to be zero.Piketty further claims that the combination of a constant and pos-
itive savings rate and a declining economic growth rate will cause thecapital-to-income ratio, �, to explode, leading to increasingly unequal
FIGURE 1U.S. Savings Rate as a Percentage of Income,
1960–2014, Smoothed
Source: Research Affiliates based on Federal Reserve Bank of St. Louis,FRED Database.
0%
2%
4%
6%
8%
10%
12%
14%
1960 1965 1970 1975 1980 1985 1990 1995 2000 2005 2010
U.S.
Sav
ings R
ate
57496_ch01.qxd:19016_Cato 9/21/15 1:34 PM Page 455

wealth distribution. But if the net savings rate declines when growthdeteriorates—as history shows it is apt to do—the capital-to-incomeratio could just as easily shrink as rise. We shall soon see that Piketty’sprognostications of soaring dynastic wealth concentration cannot andwill not come to pass.
The Implausibility of Positive Dynastic rWe are impressed with Piketty’s data on the growing inequality of
wealth ownership. No thoughtful observer of socioeconomic devel-opments could disagree that today’s wealthiest 1 percent have alarger share of the pie, across much of the developed world, than theaffluent of past decades. A powerful bull market in equities since1975 will have this effect and the reciprocal effect of lowering the rthat those assets can produce in the future.Piketty is mistaken to extrapolate this inequality into a hereditary,
dynastic social structure. He justifies his contention with a singledeeply flawed argument: the widening gap between real return oncapital, r, and real economic growth, g. Over the last four decades,realized real returns have been outsized, due to that self-same mas-sive bull market, but forward-looking returns have tumbled for thevery same reason. As two of us observed (Arnott and Bernstein 2002),there is an immense difference between short-term realized returns,heavily influenced by changing valuation multiples, and long-termexpected returns, which is the r that matters in Piketty’s world.Piketty ignores the fact that rising asset prices benefit those who ownthe assets—the rich—at the cost of sharply lower future real returns.Let’s examine his assumption of lofty intergenerational r leading todynastic wealth concentration.Piketty sensibly points out that investors will invest if they can rea-
sonably expect r greater than g, though extended periods in whichrealized returns fall short of economic growth pepper the historicalrecord. Piketty neglects to specify that the r that matters, in order fordynastic wealth to accumulate, is the r net of taxes, spending, divisionamong heirs, charitable giving, and other methods of depletion. Hiserror in this regard is both trivial in its flagrancy and profound in itsimportance.Lucky indeed was the sensible consol investor of the 19th century
who benefited from a gold standard and zero inflation, never need-ing to spend principal. Before the Industrial Revolution, the
Cato Journal
456
57496_ch01.qxd:19016_Cato 9/21/15 1:34 PM Page 456

pronounced gap between return on capital (at times, 5 percent,though not without default risk) and real economic growth (on aver-age, approximately 0 percent) allowed an investor to live comfortablyon investment income and to pass uneroded wealth—tax-free,even—typically to the first-born son. But today the situation ismarkedly different. Wealth suffers many indignities, by which it israpidly and unceremoniously depleted.Piketty turns a blind eye to this reality when he focuses his argu-
ment for an explosion of inherited, dynastic wealth on the more than10-fold increase between 1990 and 2010 in the real fortunes of twobillionaires, Bill Gates and heiress Liliane Bettencourt. Reading suchfolderol made us want to place an emergency call to the cherry- picking police.8 Is it not possible that the ability of Gates andBettencourt’s father to accumulate wealth was due to extraordinarybusiness acumen, which brought widely sought new products to mil-lions of customers?And Piketty—seemingly ignoring the ebullience in the financial
markets over these two decades—counts the 10-fold increase inGates’ and Bettencourt’s wealth as net savings even though it waslargely due to rising valuations. Does Piketty really believe that the22.9 percent annualized return of Microsoft over the 20-year period(or even the 8.5 percent annualized return of the CRSP U.S. TotalMarket Index over the same period) is in any way indicative of thefuture return on capital and hence of the future return on the accu-mulated wealth of the top 1 percent?Very rare indeed is the family whose growing fortune is due to a
positive savings rate—that is, the ability to accumulate further capi-tal on their own. Take, as a counterexample, the Vanderbilt family.When the family converged for a reunion at Vanderbilt University in1973, not one millionaire could be found among the 120 heirs andheiresses in attendance. So much for the descendants of CorneliusVanderbilt, the richest man in the world less than a century before.Had Piketty managed money for rich clients, he would understandwhy the downward trajectory of the Vanderbilt fortune is a far morecommon scenario for multigenerational wealth.
8Even more curious is the choice of Gates to support the alarming growth ofwealth dynasties, because Gates’ heirs will be much less wealthy than he. Gateshas announced he will be giving away most of his wealth.
Myth of Dynastic Wealth
457
57496_ch01.qxd:19016_Cato 9/21/15 1:34 PM Page 457

Impediments to dynastic wealth have always existed. Today,they are legion. So, how is dynastic wealth eroded? Let us countthe ways:
1. Low Security Returns. As previously mentioned, the 5 percentreal return estimate that Piketty repeatedly references is, espe-cially today, quite optimistic. Piketty believes that advancedmoney management tools, such as hedge funds, alternativeinvestments, and private equity, will enable the elite to garnerreturns higher than those available to the huddled massesinvested in their pitiful index funds.An entrepreneur through innovation, invention, and risk-
bearing in a wealth-creating business may have a shot at ele-vated returns, but an average arm’s-length investment inmainstream stocks, bonds, and REITs—the modern equiva-lents of Piketty’s consols and real estate—offers no realisticprospects of beating, by much, the returns that mom-and-popinvestors can earn.The hyper-wealthy, in our experience, can outperform
mainly by avoiding the fad-chasing behavior of the masses,rather than seeking lofty returns from unconventional meth-ods. A willingness to pursue modest return increments isoften short-circuited by the very fact that these opportuni-ties are uncomfortable when they are most likely to be prof-itable. Those who believe otherwise generally fall prey toknaves and do not remain hyper-wealthy for very long.
2. Investment Expenses. The brokerage and real estate manage-ment fees paid by Austen’s and Balzac’s characters areunknown to us, but we do know that today’s wealthy pay a nicechunk of change to bank trust companies, “wealth manage-ment” experts, estate attorneys, and the like—a lot of fingersare constantly dipping into the wealth pie.
3. Income and Capital Gains Taxes. Taxes on income and capitalgains were not levied to any significant degree during the19th century, but they consume a large fraction of pretax realreturn today. The modern investor is even taxed on the inflationcomponent of return, an indignity that Balzac’s and Austen’scharacters could not have imagined.
4. Performance Chasing and Poor Investment Decisions. Thissource of wealth erosion is nothing new. As documented by
Cato Journal
458

Charles Mackay in the 19th century, neither wealth nor intel-ligence confers protection against foolish investment deci-sions (Kinnel 2005, 2014).9
5. Charitable Giving. Encouraged by the tax benefits associatedwith donating wealth, charitable giving has become a competi-tive sport amongst the hyper-wealthy.
6. Hedonic Readjustment Borne on Technological Progress.Productivity growth and human nature mandate that a returnon wealth equal to inflation is not adequate. How many of uswould be happy with the median standard of living from a cen-tury or even a half-century ago?
7. Breeding.Our intensive first-hand research inescapably supportsthe idea that people like to breed. Piketty’s beloved Austen andBalzac characters certainly were fruitful and they multiplied,compelling each successive generation to watch as its comfortable£1,000 annual income was halved or worse, unless, of course,another family’s income stream could be appropriated throughmarriage. We observe that today’s affluent continue to breed, sothat each generation’s fortune should approximately halve.10
8. Estate Taxes. In contrast to Piketty’s gilded era, present-dayestate taxes exact a substantial toll on family wealth, that is, if amodern plutocrat would even dare to award his or her undi-luted estate to progeny.
9. Costly Estate and Tax Battles. Rather than the novels of Austenand Balzac, Piketty would have benefited from readingDickens’ Bleak House, which describes how legal fees inex-orably consumed a patrimony. It bears mention that tax author-ities pay special attention to the wealthy, pursuing perceived taxinfractions at great expense (in time, money, and distractionfrom their task of earning more taxable income) to the affluent.
9In his seminal white paper, Kinnel (2005) showed that U.S. mutual fund time-weighted returns beat the mutual funds’ dollar-weighted returns (actually enjoyedby the funds’ investors) by an average of 2.8 percent a year due largely to investors’passion for chasing past winners and shunning recent losers. A 2014 study by JPMorgan and Dalbar Inc. suggests that the average investor earned 2.5 percent from1994 to 2013 versus 9.2 percent for the S&P 500 and 5.7 percent for bonds, suggest-ing a 5 percent annual shortfall relative to a 60/40 portfolio. Some have challengedthe methodology, hence the results. But we know of no studies that fail to show ashortfall.10Even in Japan, South Korea, and Singapore where fertility rates are around 1.3,a 25 percent dilution in wealth in every generation is to be expected.
Myth of Dynastic Wealth
459
57496_ch01.qxd:19016_Cato 9/21/15 1:34 PM Page 459

We applaud the successful pursuit of tax abuse, but we hear lessabout the abusive pursuit of legitimate tax management.
10. Spending. And lest we forget, heirs spend—sometimes a lot.
Suppose Piketty is right and the elite can, indeed, earn a 5 percentreal return on their invested assets. If each of the aforementioned10 factors costs an average of just 1 percent a year of return, the“dynastic” r, or retained r, is minus 5 percent. This force cuts real networth in half every 14 years and closer to 70 percent over each gen-eration. As we shall see, this is the norm among the hyper-wealthy.In our collective experience, among mere multimillionaires, an aver-age cost of 2 percent or more—per factor each year—is closer to thetruth, in which case hereditary wealth evaporates faster than a pud-dle in the Sahara.11
We can think of no better metaphor for the evaporation and gen-erational fissuring of hereditary wealth than the sorry fate of theRokeby estate, currently occupied by the tenth and eleventh genera-tions of Astor heirs who are scattered among the complex’s rabbitwarren of shabby apartments and whose “occupations” includeorganic farming, puppet making, and memoir writing. The career ofthe estate’s current patriarch, Richard Aldrich, educated at JohnsHopkins and Harvard, was summed up by his younger brotherthusly: “You’ve never worked a day in your life” (Aldrich 2013: 51;Green 2013). A small trust fund, coupled with paying boarders anddocumentary producers, provides for a semblance of upkeep, but thegrounds have likely seen their last generation of Astors.This rapid fading of hereditary wealth corresponds, more or less,
to what we’ve observed on the front lines of money management. Amajority of our clients acquired their wealth the old-fashioned way,building wealth through innovation, invention, and business acumen.Whereas a substantial minority did inherit, in no case was that wealthtransmitted beyond two generations. Some of our clients’ offspringwill wind up in “the 1 percent,” but very few of their grandchildrenwill. Let’s turn from Piketty’s (and our own) anecdotal evidence tothe empirical evidence found in the evolution of the many vast for-tunes of the Forbes 400.
11This is one area where the hyper-wealthy do have an advantage. A family with$20 million of inherited wealth can dissipate it in no time at all. A family with$1 billion or more would need to work much, much harder to waste it all in adecade or two!
Cato Journal
460
57496_ch01.qxd:19016_Cato 9/21/15 1:34 PM Page 460
The Forbes 400As Piketty points out, the Forbes 400 list is far from a perfect
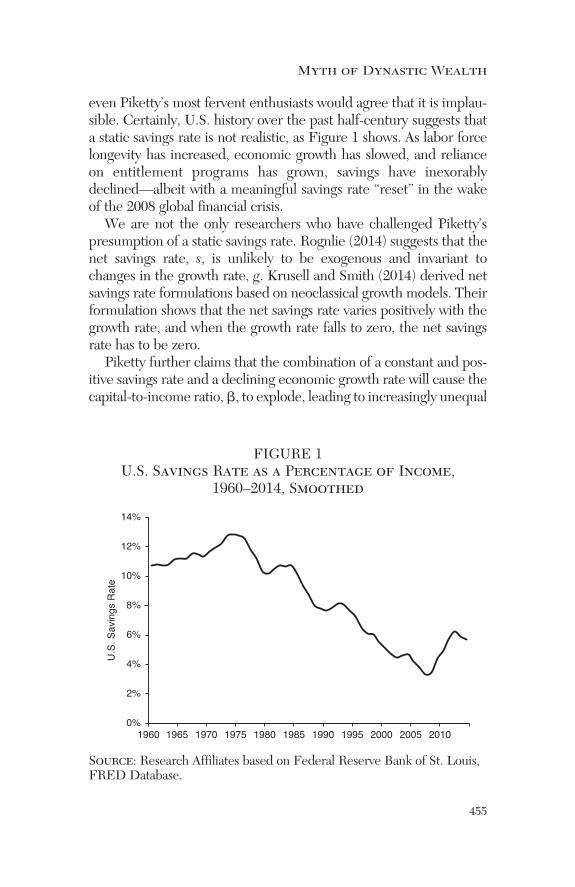
measure of the wealth accumulation of society’s most affluent;nonetheless, Piketty references the list to demonstrate how wealthconcentration has increased over the last three decades. According toForbes 400 data, the share of billionaires’ private wealth has risenfrom 0.4 percent in 1987 to 1.5 percent in 2012 (Piketty 2014:432–36). Piketty sees the growth in the threshold for extreme wealthand naively assumes that it’s the same people getting richer; nothingcould be further from the truth.Figure 2 illustrates how the wealth cutoff—in both nominal terms
and in 2014 dollars—for the Forbes 400 has steadily risen since thelist began in 1982. Achieving membership in the Forbes 400 in itsinaugural year required an estimated net worth of $75 million; in2014, a net worth of $1.5 billion was needed to make the cut. Evennet of inflation, the price of admission rose 8-fold over the 32 yearssince the list has been published.The Forbes 400 contains slightly more than one one-millionth of
the U.S. population. We can thus normalize these results for popula-tion growth, to a constant share of the U.S. population.12 In 1982,when the U.S. population totaled 231 million, Stephen Bechtel, witha net worth of $200 million ($498 million in 2014 dollars), ranked231st on the list. He, and everyone above him on the list, can be con-sidered the one-in-a-million. In 2014, when the U.S. population hadreached 318 million, Ray Lee Hunt ranked 318th on the list, boast-ing a net worth of $5.9 billion. In real terms, the price of admissionto one-in-a-million status rose 12-fold, from 1982 to 2014.This observation is not inconsistent with Piketty’s more formal,
and inclusive, data. But are the hyper-wealthy one-in-a-million get-ting richer? Yes and no. As a class, they are. The top line on the graphin Figure 2 documents their progress: their wealth rose from 13,800times U.S. per capita GDP in 1982 to 108,000 times U.S. per capitaGDP in 2014.13 But the 32 years of the list’s existence encompass the
12Of course, the list includes considerably more than one in a million, as almostall of the Forbes 400 represent the wealth of a family, not of an individual.13One should be careful not to fall into the trap of thinking this means that, if themembers of the one-in-a-million group have wealth that exceeds per capita GDP100,000-fold, they have one-tenth of the wealth. This is a comparison of wealth withGDP, roughly akin to comparing net worth with income.
Myth of Dynastic Wealth
461
57496_ch01.qxd:19016_Cato 9/21/15 1:34 PM Page 461

largest equity bull market (1982–2000) and the largest bond bullmarket (1982–2012, and perhaps beyond) in U.S. capital markets his-tory. Greater wealth concentration over this period was a direct con-sequence of this dual stock-bond bull market and goes hand-in-handwith a plunge in forward-looking r, the return on invested capital.When an individual makes a sufficiently noteworthy contribution
to society—whether by invention, innovation, or entrepreneurialrisk-bearing—and it hoists them into the Forbes 400, only monu-mental continuing achievement keeps them there. Idlers, even if inthe past they were hard-working, highly competent people whoplayed a brilliant hand, will not linger long on the list. Their wealthdissipates into society at large.Piketty dismisses the accuracy and validity of the Forbes 400 (and
other lists that rank the wealthy) because the super-affluent do not
FIGURE 2The Rich Get Richer:
The Growing Wealth of the Forbes 400
Source: Research Affiliates based on data from Forbes and GlobalFinancial Data.
Cato Journal
462
Cutoff Net Worth (Nominal)Cutoff Net Worth (in 2014 dollars)Top 0.0001% Net Worth Value (Nominal)Top 0.0001% Net Worth Value (in 2014 dollars)Top 0.0001% Net Worth, Relative to Real perCapita GDP (RHS)
$75
$1,520
$187
$498
$5,900
13,800x
108,000x
500
2,000
8,000
32,000
128,000
$50
$200
$800
$3,200
$12,800
1982 1986 1990 1994 1998 2002 2006 2010 2014
Top
0.00
01%
Net
Wor
th,
as M
ultipl
e of
Per
Cap
ita G
DP
Cuto
ff Ne
t Wor
th,
Top
0.00
01%
Net
Wor
th ($
Milli
on)
57496_ch01.qxd:19016_Cato 9/21/15 1:34 PM Page 462

advertise and verify the true amount of their wealth. It’s a fair cri-tique. However, it’s equally fair to note that the hyper-wealthy arenot that hard to find. Granted, the 1982 version of the list is suspect;the first effort will have missed many wealthy families.14 But we canreasonably assume that the accuracy of the list has improved witheach passing year. Forbes and others will do their level best tounearth those who are secretive about their fortunes. Once found,these wealthy individuals are easy to track; consequently, their fadingfortunes, the central feature of our analysis, are easy to document.If dynastic wealth accumulation were a valid phenomenon, we
would expect little change in the composition of the Forbes rosterfrom year to year. Instead, we find huge turnover in the names on thelist: only 34 names on the inaugural 1982 list remain on the 2014 list,and only 24 names have appeared on all 33 lists.15 However, as JohnMaynard Keynes succinctly noted, “In the long run we are all dead.”Wealth, as entitling as it may be in other respects, does not offer ameans of escape from this general rule. The average age of the orig-inal 1982 Forbes listee was 62. Many passed on—and passed on theirwealth—long before 2014.So, let’s look at descendants, those with the same surname and
women who retain the surname as a middle name, except for thosewho are clearly unrelated.16 The 2014 list includes elites and/or theirdescendants from 69 inaugural families, of whom only 36 inauguralfamilies from 1982 have consistently made all subsequent lists. Theinaugural descendants’ aggregate wealth is equal to 39 percent of
14Forbes’ first effort to compile the list was demonstrably incomplete, but notbadly so. Figure 2 shows that the change in the wealth cutoff for admission to thelist had its biggest year-over-year jump in 1983, yet surprisingly few of the largestfortunes were actually missed in 1982. The main oversight would appear to be theBass family, with collective wealth of $2.5 billion in 1983 (split five ways); fol-lowed by the Koch family, with just over $1 billion; and the Milliken and Fordfamilies, each with $790 million to $900 million (split three or four ways). It’s safeto assume that they would all have made the 1982 cut had they not been “flyingunder the radar.”15Some debut elite were dropped from the list in certain years and reappearedin later years; therefore the number of “all-time survivors” will be less than the34 remaining debut elite as of 2014. It also bears mention that mortality ensuresthat none of the debut elite will be on the 2082 list, so our assessment includingheirs is more relevant.16This method will obviously miss a modest number who marry into different lastnames and do not retain the family name as a middle name (as is common prac-tice in America’s elite families).
Myth of Dynastic Wealth
463
57496_ch01.qxd:19016_Cato 9/21/15 1:34 PM Page 463

the total wealth represented on the 2014 list, implying that the other61 percent is “new wealth”—fortunes newly created in the past32 years.17 Figure 3 traces the erosion of the 1982 Forbes 400 fromsubsequent lists. The top line shows the proportion of the aggregatewealth held by the inaugural elite and their progeny who remainedon the list in the years between 1982 and 2014. The solid line showsthe number of the inaugural elite and their heirs who remained onthe list in subsequent years.The first-year erosion of 1982 wealth was aberrantly large: 10 per-
cent versus an average of about 4 percent. This would seem to
FIGURE 3Erosion of the 1982 Forbes 400Wealth Share in
Subsequent Lists
Source: Research Affiliates based on data from Forbes.
17Note that some family members know best to take the money and spend it,while some are gifted in creating new wealth with their share of the family for-tune. Therefore, attributing 61 percent of wealth to “new wealth” could be anunderestimate.
Cato Journal
464
% of Wealth held by Debut Elite
% of Staying Debut Elites + Their Family Members, out of the 400 listees% of Staying Debut Elite, out of the 400 listees% of Wealth held by Debut Elite + Their Family Members
0%
39%
28%
15%
9%
20%
40%
60%
80%
100%
1982198
3198
4198
5198
6198
7198
8198
9199
0199
1199
2199
3199
4199
5199
6199
7199
8199
9200
0200
1200
2200
3200
4200
5200
6200
7200
8200
9201
0201
1201
2201
3201
4
57496_ch01.qxd:19016_Cato 9/21/15 1:34 PM Page 464

suggest that 10 percent of the wealth on the 1983 list was newlyminted in a single year. If instead the true new wealth in 1983 was4 percent, the same as the average year, it would indicate that thesleuths at Forbes may have missed a handful of hyper-wealthy in1982, roughly 6 percent of total Forbes 400 wealth. That’s not a badmiss for the first try. It suggests that maybe the cutoff in 1982 shouldhave been around $100 million, not $75 million.The same pattern of wealth erosion, or “fall from grace,” that we
saw in Figure 3 has repeated itself throughout the history of thelist, as shown in Figure 4. The chart plots the percentage share ofthe Forbes 400 wealth held by surviving members (i.e., thoseremaining on the list) and their families in each year the list hasbeen compiled. The fall from grace is essentially identical to thepattern established in 1982, with one extreme exception. Aroundthe peak of the tech bubble in 1999 and 2000, many prior listeessuddenly and dramatically fell off the list as dozens of newly
FIGURE 4Erosion of the 1982–2013 Forbes 400Wealth Share in
Subsequent Lists
Source: Research Affiliates based on data from Forbes.
Myth of Dynastic Wealth
465
30%
100%
90%
80%
70%
60%
50%
40%
30%
100%
90%
80%
70%
60%
50%
40%
19861982 1990 1994 1998 2002 2006 2010
t+2Start
t+4 t+6 t+8 t+10t+12t+14t+16t+18t+20t+22t+24t+26t+28t+30t+32
Average
2014
57496_ch01.qxd:19016_Cato 9/21/15 1:34 PM Page 465

minted tech billionaires surged on. When the tech bubble burstand the tech billionaires’ wealth collapsed, some of the old-moneyhyper-wealthy reappeared.If we average across all of the years, we find a remarkably stable
relationship, as shown in the heavy dashed line in Figure 4, whichties to the time scale on the top of the graph. Each cohort ofForbes 400 families owns less than half of all Forbes 400 wealthjust 23 years later, on average. This does not mean that the hyper-wealthy are losing 3 percent of their wealth every year. It meansthat the existing and established hyper-wealthy are displaced bynewcomers at a rate of 3 percent of their collective wealth, eachand every year. Half of the wealth of the 2014 Forbes 400 has beennewly created in one generation.Yes, the rich have (collectively, not individually) been getting
richer, but not for the reasons that Piketty rues. The reason the richare getting richer is a combination of the newly rich creating wealth,matching the old wealth in each generation, while the older rich—over the 32-year span that we analyze—have benefited from thelargest bull market in history, with rising valuations as a consequenceof falling future yields on capital. Capital is worth more in partbecause it earns less. Falling yields deliver rising valuation multiplesand rising asset prices.We can use these same data to examine with surprising precision
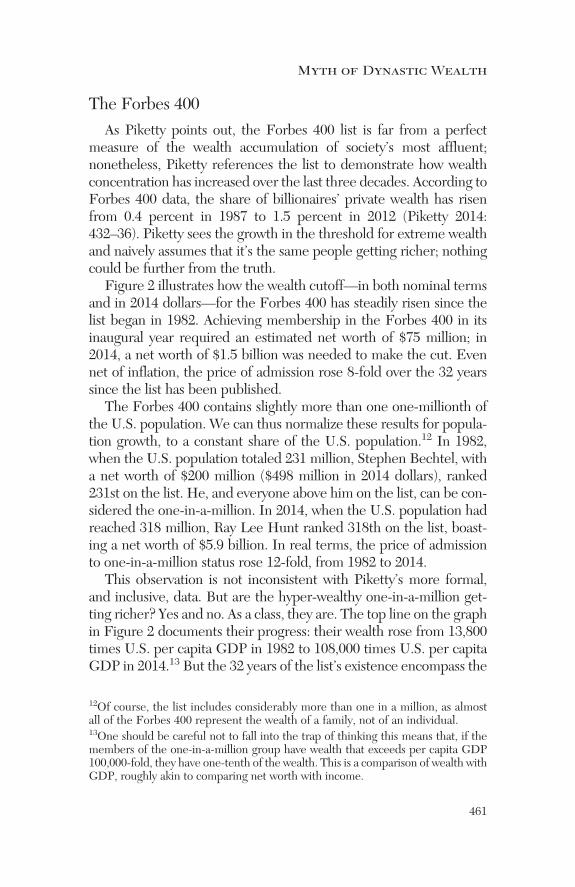
how quickly the rich get richer. Consider Figure 5, which comparesthe growth of wealth from 1982 to 2014 of a passive 60/40 investor tothe growth of wealth of the list’s surviving debut elite and familymembers as well as to the best case and likely case of the debut eliteand their families.Suppose the typical Forbes 400 family in 1982 had put their for-
tune into a passive portfolio, invested 60 percent in the S&P 500 and40 percent in the Barclays Aggregate (formerly Lehman Aggregate)Bond Index.18 The top line in Figure 5 traces the return trajectory ofthe 60/40 portfolio. Since mid-1982, bond yields have tumbled from
18Forbes estimates wealth as of August of the previous year, so we’re using aJuly 31 “fiscal year” to measure the 60/40 performance. This presumably hasparticular relevance for families whose wealth is measured in publicly tradedstock holdings. Results are not materially different if we use calendar years,but the correlation of 60/40 returns with changes in average family wealth,for the surviving families, soars from 0.19 to 0.73 when we use this peculiarfiscal year.
Cato Journal
466
57496_ch01.qxd:19016_Cato 9/21/15 1:34 PM Page 466
the mid-teens to just over 2 percent and stock market valuations havesoared from 16 years’ worth of dividends (a yield of 6.3 percent) to52 years’ worth of dividends (a yield of 1.9 percent), delivering an11.0 percent annualized real return over the 32-year period theForbes 400 has been in existence. With compounding and—pleasehumor us, as this appears to be Piketty’s assumption—withoutspending and taxes, every $100 million of starting wealth would havegrown 28-fold, to nearly $2.8 billion. Such is the impact of a secularbull market.The handful of 2014 survivors from the inaugural 1982 list—just
69 families—did less well, growing their wealth 13-fold as depictedby the solid line in Figure 5. We can think of these 69 surviving fam-ilies as the Forbes 400 analogues of Gates and Bettencourt, cited as
Myth of Dynastic Wealth
467
FIGURE 5Comparative Return Series:
Forbes 400Wealth Accumulation vs. 60/40 Strategy
Source: Research Affiliates based on data from Forbes and IbbotsonAssociates.
Growth of Wealth, Passive 60/40 InvestorGrowth of Wealth, Surviving “Debut Elite” & Family Growth of Wealth, Best Case, All “Debut Elite” & Family Growth of Wealth, Likely Case, All “Debut Elite” & Family
$ M
illion
s
1982
1984
1986
1988
1990
1992
1994
1996
1998
2000
2002
2004
2006
2008
2010
2012
2014
$100
$200
$400
$800
$1,600
$3,200
57496_ch01.qxd:19016_Cato 9/21/15 1:34 PM Page 467

typical by Piketty. The growth in the wealth of these 69 familiesfrom 1982 to 2014 was a consequence of entrepreneurial venturessupplemented by additional innovations and inventions, not a resultof clipping coupons. Over this period, these families are still led bythe visionaries who created the wealth in the first place. After thevisionary is gone, the progeny typically cannot fill his or her shoes,and, absent the founding entrepreneur, the family fortune inevitablyevaporates.We take two approaches to defining the wealth erosion of the
77 percent of the 297 inaugural Forbes 400 families who no longerappear on the 2014 list. An analysis of their fates is enlightening.One approach, the “best case” approach, is to truncate a family’swealth at the cutoff point for the first year in which the family didnot make the list, as if they missed being included in the list by justa dollar. The second approach, a more relevant “likely case” result,is to assign each family a return on wealth, in the year they exited theForbes 400, that matches the average return on wealth of the fami-lies who lost ground in that year. These rates of return, products asthey are of the real world, reflect the ravages of spending and taxes.For any family that failed to remain in the 400, either of these out-comes can be included through the year of the family’s departureand ignored thereafter.When the 77 percent of non-surviving families are counted
in the calculation of the growth of wealth, we find a less-than-impressive result, especially relative to the 28-fold growth thata passive 60/40 investor could have achieved. The growth inwealth of the full roster—the 23 percent who survived andenjoyed a 13-fold growth in wealth and the 77 percent who felloff the list—suggests a “best possible” average outcome of a7-fold increase in wealth and a “most likely” average outcome ofa 6-fold increase in wealth over the 32 years, shown respectivelyby the two bottom lines in Figure 5.Net of spending and taxes, the most likely scenario equates to a
5.9 percent average annual growth in wealth, about 5.1 percent peryear less than the return earned by the 60/40 investor who faces notax or spending obligations, a return that Piketty presumes is so easyto beat. True, the 11 percent annualized return of the 60/40 portfo-lio exceeds Piketty’s hypothetical norm for the hyper-wealthy, but itwas earned in the context of the greatest secular bull market in liq-uid stock and bond markets in world history. And it occurred in the
Cato Journal
468
57496_ch01.qxd:19016_Cato 9/21/15 1:34 PM Page 468

19A comparison is even more extreme with the S&P 500, which transformed each$100 into just over $4,000 in 32 years, if there was no spending or taxes. Even ifall of the income is spent, if a Forbes 400 centi-millionaire in 1982, ranked 229th,simply invested in the S&P 500, such wealth in 2014 would be $1.8 billion, grow-ing 18-fold (nearly 6-fold net of inflation), and the investor would have enjoyedover $400 million in pretax spending in the interim. This is even better thanresults for the “surviving elite and family” (13-fold) and starkly better than theoverall average for the “debut elite and family” (6-fold). So much for the superiorinvestment acumen of the super-wealthy.20We broadened the definition of inherited wealth by assuming all family mem-bers of the elite (for example, those who have the same last name) have inheriteda portion of the family fortune. This has obvious “Type 1” errors, missing thoseheirs who lose the last name, and “Type 2” errors, failing to credit next-generationentrepreneurs for their own successes, if they happened to also be descendants ofwealth.
context of the greatest decline in forward-looking real capital mar-ket yields in world history.19
What does the 5 percent return shortfall relative to passive60/40 investor (11 percent minus 5.9 percent) mean? It representsthe annual wealth transfer from the hyper-wealthy to society atlarge—a direct consequence of their spending, charitable giving,paying taxes, and so forth. There is a vigorous debate about theextent to which efforts to accelerate this redistribution reduce theincentives for the next generation of entrepreneurs, inventors, andinnovators to step in and achieve their own fortunes, and in sodoing create their own productivity marvels, technologicaladvances, and legions of new jobs. Redistributionists should becareful of what they wish for.What of Piketty’s thesis that inherited wealth is on the march? At
least in the United States, the opposite seems true, even with a con-servative definition of inherited wealth.20 Indeed, with each passinggeneration, the 4 percent wealth erosion is, if anything, accelerating.Over the past 32 years, an average of just 26 percent of new-
comers’ wealth, representing an average of just 1.5 percent of theaggregate wealth of the 400 families, was inherited; much of thiswealth was subsequently dissipated. Since 2005, in terms of head-count, the silver spoon crowd has comprised just 10 percent of thenewcomers and just 15 percent of the newcomers’ wealth in theForbes 400. Further, a large part of the already meager accumula-tion of inherited Forbes 400 assets was likely due to the historicallyhigh stock and bond returns of the past three decades. Going for-ward, it is likely to be even less impressive.
Myth of Dynastic Wealth
469
57496_ch01.qxd:19016_Cato 9/21/15 1:34 PM Page 469

470
Cato Journal
It bears repeating: we do not dispute the growing concentration ofprivate wealth in the coffers of the wealthiest 1 percent. We do contestPiketty’s explanation of why it is happening. Were this development aresult of unearned investment returns and dynastic accumulation, aspostulated by Piketty, all three of us, even with our diverse political ori-entations, would be alarmed. But even allowing for the imperfectionsin the compilation of the Forbes 400, the transitory nature of the listclearly demonstrates that wealth accumulation is not primarily a prod-uct of inheritance. Rather, the accumulation is largely due to entrepre-neurial activity and is redistributed within society at a measurable4 percent annualized pace. Thus, we view the increasing pace ofwealth concentration as being of much less serious societal concern.Some of the Forbes 400 are building great fortunes. They cannot
easily do so without creating greater wealth for society at large. Therest are presumably dissipating great fortunes—recycling them backto society at large—through spending and giving. It is not unreason-able to ask: What part of this picture needs fixing?
Where Are the Astors, the Vanderbilts, the Rockefellers?Another test that the Forbes 400 data allow us to perform—albeit
with gaping statistical flaws—is an examination of the legendary for-tunes of yesteryear. The Forbes 400 list confirms that the Vanderbiltanecdote is more relevant to the transient nature of fortune thanPiketty’s reliance on the more recent fortunes of Gates or Bettencourt.Gates’ wealth is estimated at approximately half of 1 percent of thenation’s GDP. That’s impressive. At least eight such fortunes were cre-ated in the 19th century, those of Stephen Girard, Stephen VanRensselaer, John Jacob Astor, Cornelius Vanderbilt, AlexanderStewart, Jay Gould, Frederick Weyerhaeuser, and Andrew Carnegie.Not one has descendants listed in any of the Forbes 400 lists.The Rockefellers, who achieved supreme wealth early in the 20th
century, scored 13 seats on the 1982 Forbes debut list, with collectivewealth of $7 billion in inflation-adjusted 2014 dollars. As of 2014,only one Rockefeller (David Rockefeller, who turned 100 in June2015) remains, with a net worth of about $3 billion.21 The du Ponts,
21This figure is less than half of the wealth the family collectively owned back in1982, and only about 1 percent of his grandfather’s (John D. Rockefeller) wealthin real terms—according to Wikipedia—three-quarters of a century ago.
57496_ch01.qxd:19016_Cato 9/21/15 1:34 PM Page 470
471
Myth of Dynastic Wealth
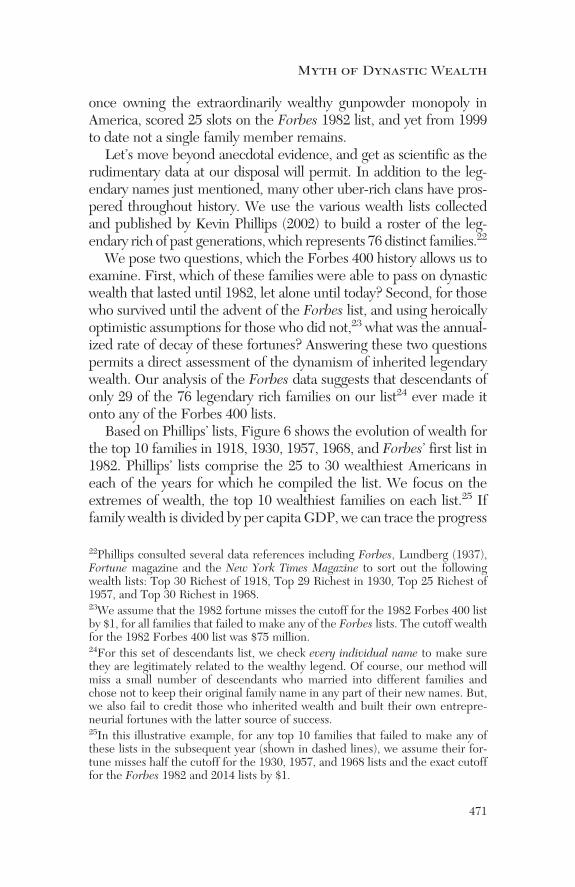
once owning the extraordinarily wealthy gunpowder monopoly inAmerica, scored 25 slots on the Forbes 1982 list, and yet from 1999to date not a single family member remains.Let’s move beyond anecdotal evidence, and get as scientific as the
rudimentary data at our disposal will permit. In addition to the leg-endary names just mentioned, many other uber-rich clans have pros-pered throughout history. We use the various wealth lists collectedand published by Kevin Phillips (2002) to build a roster of the leg-endary rich of past generations, which represents 76 distinct families.22
We pose two questions, which the Forbes 400 history allows us toexamine. First, which of these families were able to pass on dynasticwealth that lasted until 1982, let alone until today? Second, for thosewho survived until the advent of the Forbes list, and using heroicallyoptimistic assumptions for those who did not,23 what was the annual-ized rate of decay of these fortunes? Answering these two questionspermits a direct assessment of the dynamism of inherited legendarywealth. Our analysis of the Forbes data suggests that descendants ofonly 29 of the 76 legendary rich families on our list24 ever made itonto any of the Forbes 400 lists.Based on Phillips’ lists, Figure 6 shows the evolution of wealth for
the top 10 families in 1918, 1930, 1957, 1968, and Forbes’ first list in1982. Phillips’ lists comprise the 25 to 30 wealthiest Americans ineach of the years for which he compiled the list. We focus on theextremes of wealth, the top 10 wealthiest families on each list.25 Iffamily wealth is divided by per capita GDP, we can trace the progress
22Phillips consulted several data references including Forbes, Lundberg (1937),Fortune magazine and the New York Times Magazine to sort out the followingwealth lists: Top 30 Richest of 1918, Top 29 Richest in 1930, Top 25 Richest of1957, and Top 30 Richest in 1968.23We assume that the 1982 fortune misses the cutoff for the 1982 Forbes 400 listby $1, for all families that failed to make any of the Forbes lists. The cutoff wealthfor the 1982 Forbes 400 list was $75 million.24For this set of descendants list, we check every individual name to make surethey are legitimately related to the wealthy legend. Of course, our method willmiss a small number of descendants who married into different families andchose not to keep their original family name in any part of their new names. But,we also fail to credit those who inherited wealth and built their own entrepre-neurial fortunes with the latter source of success.25In this illustrative example, for any top 10 families that failed to make any ofthese lists in the subsequent year (shown in dashed lines), we assume their for-tune misses half the cutoff for the 1930, 1957, and 1968 lists and the exact cutofffor the Forbes 1982 and 2014 lists by $1.
57496_ch01.qxd:19016_Cato 9/21/15 1:34 PM Page 471

472
Cato Journal
of these families relative to the average American; an upward-slopingline means that the elite family is becoming richer faster than theaverage American. It turns out that situation is very rare.The wealthiest man in the world in 1918 was John David
Rockefeller, with an estimated net worth of $1.35 billion. This was awhopping 2 percent of the U.S. GDP of $70 billion at that time,nearly two million times our per capita GDP, at a time when thenation was the most prosperous in the world. An equivalent share ofU.S. GDP today would translate into a fortune of over $300 billion.The expression “rich as a Rockefeller” had real meaning in 1918.Are the Rockefellers of today richer than the Rockefellers of
1918? In nominal dollar terms, yes. But a 2014 dollar is not the equiv-alent of a 1918 dollar. Adjusting for growth in per capita GDP, asshown in Figure 6, the Rockefeller family, represented by the soleremaining family member who makes the Forbes 400 list in 2014,David Rockefeller, has fallen from nearly two million times per capita
FIGURE 6Sustainability of Intergenerational Wealth,
Evolution of Top 10 Lists (1918–2014)Family Wealth Relative to Per Capita GDP
Source: Research Affiliates based on data from Kevin Phillips and Forbes.
50
100
200
400
800
1,600
3,200
50
100
200
400
800
1,600
3,200
1910
1920
1930
1940
1950
1960
1970
1980
1990
2000
2010
2020
Fam
ily W
ealth
, in T
hous
ands
of T
imes
Per
Cap
ita G
DP
Fam
ily W
ealth
, in T
hous
ands
of T
imes
Per
Cap
ita G
DP
RockefellerFamily
Mellon
Hunt
Walton
2014 Top 10
Top 10 in 1982Average for
Top 10 Familiesin 1918
Top 10 in 1968
Top 10 in 1957Top 10 in 1930
57496_ch01.qxd:19016_Cato 9/21/15 1:34 PM Page 472

473
Myth of Dynastic Wealth
GDP to 51,000 times per capita GDP. That’s still awfully wealthy,but it represents a 97 percent erosion in wealth measured relative tothe prosperity of the average American. This works out to 3.6 percenterosion in Rockefeller family wealth, relative to the averageAmerican, year after year from 1918 to 2014.As we write this, the Rockefeller family is vacating their space in
the Rockefeller Center. Writing in the New York Times, reporterSam Roberts opined, “While there was one John D., there are nowhundreds of Rockefellers. So in a sizzling real estate market, eventhe Rockefeller family must worry about the rent” (Roberts 2014).Second wealthiest in 1918? Andrew Carnegie’s colleague, Henry
Frick. Following his death in 1919, his family fell clear off the top 30list by the time of the 1930 list. A few decades on, who remembersthe Fricks except aficionados of the Frick Collection museum inNew York City? Rounding out the 1918 top 10 list were the familiesof Carnegie, Baker, Harkness, Armour, Ford, Vanderbilt, Green,and Harriman. Most of us are familiar with the Fords, Carnegies,Harrimans, and Vanderbilts, but many would be hard pressed toidentify the Bakers, Harknesses, Greens, and even Armours.As it happens, by 1930—on the heels of the Roaring Twenties,
no less—5 of the 1918 top 10 elite families had lost so much oftheir wealth that they did not rank in even the top 30 of the 1930list of ultra-wealthy. By 2014, only David Rockefeller remained onthe Forbes 400, to represent all of the wealthiest families inAmerica in 1918. Even he was far removed from the top 10, top30, or even top 100.The change in the average wealth of all families in the top 10
roster of 1918 is represented by the line (solid and dotted) at thebottom left of Figure 6.26 While the average wealth of the familieshad diminished slightly by 1930, even with the monumental bullmarket of the 1920s, the dashed line shows that subsequentdecades were far less kind, as wealth declined precipitously com-pared to the growing wealth of the average American measured inper capita GDP.For the top 10 families of 1930, by the time the next top 10 list was
compiled in 1957, only 3 of the families were wealthier (in notionalterms), 7 were poorer, and 5 had lost so much net worth they had
26We use a geometric average of wealth for 1918 and 1930 for these families, sothat the one or two families at the top of the list do not dominate the average.
57496_ch01.qxd:19016_Cato 9/21/15 1:34 PM Page 473

474
Cato Journal
dropped out of the top 25. Net of inflation, the average family hadlost five-sixths of its wealth. In the years from 1957 to 1968, thewealthy seem to have fared better, but only in notional terms. Only 3of the 1957 top 10 families failed to make the top 30 in 1968, whilethe other 7 families on the 1957 list had achieved higher nominalwealth by 1968. But, net of inflation, the average family lost ground,relative to the average American by about 40 percent. The top 10families in 1968 exhibited a similar pattern, with a gradual decreasein nominal value and—in a period of rising inflation—a plunge inboth real value and relative to U.S. per capita GDP.Finally, 8 of the top 10 elite from 1982 still remain on the 400 list,
and 6 families remain in the top 10. From 1982 to 2014, the 1982top 10 elite families’ growth in wealth has uncharacteristically keptpace with—not exceeded—the average American’s income growth,as measured by per capita GDP. This relatively robust survival of the1982 top 10 list was helped considerably by an unprecedented 32-year bull market for stocks and bonds, which came at the cost ofa corresponding crash in r, the forward-looking return on capital.Another way to examine the dynamism of legendary wealth is to
observe how fast it has fallen in past generations. Piketty’s corethesis is that the rich know how to get richer. If they do, our evi-dence would suggest that they’re not trying. For the 10 wealthiestfamilies of 1918, the average erosion of wealth relative to the pros-perity of the average American was 5.3 percent a year between1918 and their disappearance from subsequent top 10 lists, sug-gesting a half-life in relative wealth of 13 years. The average wealtherosion for the 10 wealthiest families of 1930, 1957, and 1968, untilthey were last evident on any list, was 6.6 percent, 5.3 percent, and8.7 percent, respectively.27 These figures correspond to a half-lifeof wealth—the length of time it takes for half of the family fortuneto be redistributed within society through taxation, spending, andcharitable giving—of 10 years, 13 years, and (remarkably) 8 years,respectively.Let’s now examine the 1982–2014 time span covered by the
Forbes 400 survey. In expanding the survey from 30 families to 400,we find the coattails of once-great wealth. Consider Henry Frick, thesecond wealthiest man in the world in 1918, whose fortune of
27These numbers were estimated using the same method and assumptions weused in Table 1 so as to ensure consistency across analysis.
57496_ch01.qxd:19016_Cato 9/21/15 1:34 PM Page 474
475
Myth of Dynastic Wealth
$225 million faded fast, so fast that his heirs were off the top 30 listby 1930. His granddaughter, Helen Clay Frick, with $150 million,the entry level of wealth for the 1984 list, just managed to make thelist that year, the last time a Frick descendant appeared. During the66 years from 1918 to 1984, in which one-third of the notional valueof the Frick fortune was dissipated into society at large, U.S. percapita GDP rose 20-fold from $743 in 1918 to $14,707 in 1984.Relative to the average American’s economic progress, the Frick for-tune shrunk by 97 percent, the same magnitude of decay theRockefeller family experienced, albeit in 30 fewer years.The attentive will note that the Walton family registers the
top rank on the 2014 Forbes 400. Not Bill Gates? No. We’relooking at families. The Walton family collectively has wealth of$140 billion, according to the data sleuths at Forbes. The Kochfamily ranks second with $87 billion. Gates falters into thirdplace with a mere $80 billion, and the Mars family ranks fourthwith its $69 billion chocolate empire. By inventing a mass distri-bution model that offers deeply discounted pricing to the mid-dle and lower-middle classes, by dint of slashing the cost ofevery step in the process of bringing product to the end con-sumer, it would seem that Sam Walton fostered the closest thingwe now have to a dynasty.28 Our data suggest that it will not lastmany generations, but it is an impressive accomplishment.Our next analysis illustrates the dynamism of inherited legendary
wealth after the originators of wealth are gone. While alive, thefounders of great wealth typically continue to build their fortunes,but the progeny of the wealth originator generally do not share his orher one-in-a-million talent and are unable to generate similar levelsof new wealth.Table 1 tallies the wealth erosion of the 25 to 30 families on each
of the Phillips lists. Fueled by the doubling of valuation levels in theimmense bull market of the 1920s, the average growth in wealth ofthe ultra-rich, from 1918 to 1930, slightly outpaced the incomegrowth of the average American by an annualized 1.9 percent. Asthe progeny of the ultra-rich assumed the reins, the wealth dissipated. By the time the families disappeared from Phillips’ lists
28We leave it to the pundits on the left and the right to argue over this interest-ing tidbit that seems to have gone largely unnoticed. We find it interesting thatthe left finds the Walmart business model so deeply offensive, when the cus-tomers are the main beneficiaries of that business model, and those customers areoften the working poor.
57496_ch01.qxd:19016_Cato 9/21/15 1:34 PM Page 475

476
Cato Journal
(or by 2014 for the single exception that did not), the annualized rateof wealth erosion was around 4 percent a year. For the newer hyper-rich families included on Phillips’ lists of 1930, 1957, and 1968,respectively, the pace of erosion accelerated. Compare, for example,as shown in Table 1, the erosion in wealth relative to U.S. per capitaGDP of 6.2 percent and 5.7 percent in 1982 and 2014, respectively,for the families on the 1930 list with the 9.7 percent and 7.8 percentrates of erosion for the families on the 1968 list. Perhaps the lessonsof the Great Depression, freshly etched into the psyches of the prog-eny of the “Class of 1918,” called for a frugality forgotten by latergenerations. It bears repeating that these rates of wealth erosion arebased on best-case assumptions about end-point wealth when fami-lies disappear from our radar screen.The legendary wealth of the robber barons was steadily replaced
through the 20th century by the fortunes of the nouveau riche. Asshown in Table 2, two-thirds of the wealth of the top 30 families in1930 was still owned by families on the 1918 list. This means thatone-third of the 1930 wealth was new, created by new entrepreneurs,innovators, and employers of legions, such as Andrew Mellon, on hisway to becoming the wealthiest man in the world, and the descen-dants of Samuel du Pont de Nemours, on their way to building theeighth-largest fortune in the nation a half-century later. By 1957, onlyone-third of the wealth of the top 25 families was owned by those
TABLE 1Annualized Average Growth in Wealth Relative
to Per Capita GDP Growth
List Year Wealth Erosion, Relative to PCGDP, through Year
1930 1957 1968 1982 2014
1918 1.9% �2.7% �2.5% �4.2% �4.0%1930 �6.0% �4.7% �6.2% �5.7%1957 �4.7% �6.6% �5.5%1968 �9.7% �7.8%
Note: Ending wealth for dropouts is assumed to be half the cutoff for the1930–68 lists, and exactly the cutoff for the Forbes 400 lists.Source: Research Affiliates based on data from Kevin Phillips and Forbes.
57496_ch01.qxd:19016_Cato 9/21/15 1:34 PM Page 476

477
Myth of Dynastic Wealth
TABLE 2Share of Wealth on Later “Top 30” List
List Year Share of Wealth in Later “Top 30” List, through Year
1930 1957 1968 1982 2014
1918 66% 33% 16% 5% 0%1930 57% 39% 6% 0%1957 69% 33% 0%1968 39% 8%
Note: For Forbes lists (1982 and 2014), this table shows the share of thetop 30 wealth owned by descendants of legendary wealth. If they are onthe 400 list but not in the top 30, they count as zero.Source: Research Affiliates based on data from Kevin Phillips and Forbes.
from the 1918 list, and by 1968, a half-century later, the fraction hadfallen to one-sixth. By 2014, none of the top 30 fortunes in the UnitedStates was owned by a descendant from the 1918 list, nor any descen-dants of the 1930 or 1957 lists.The rotation in the top 30 lists, documented in Table 3, seems to
average 4–6 percent a year since 1968, considerably faster than in theprevious half-century. This suggests that every generation breeds anew generation of super-entrepreneurs and super- innovators whoachieve great success, in most cases by advancing society’s wealthalongside their own. As they pass on, and pass wealth on to thenext generations, that wealth is returned to society through taxes,
TABLE 3Implied Annual Rotation in Top Ranks of Wealth
List Year Annual Rotation in “Top 30” Wealth, through Year
1930 1957 1968 1982 2014
1918 �3.4% �2.8% �3.6% �4.7% �4.7%1930 �1.7% �2.1% �5.3% �5.3%1957 �3.4% �4.3% �4.3%1968 �6.5% �4.4%
Source: Research Affiliates based on data from Kevin Phillips and Forbes.
57496_ch01.qxd:19016_Cato 9/21/15 1:34 PM Page 477

charitable gifts, and spending. Dynastic wealth creation, apart fromoccasional examples in which one additional generation producesone additional round of growth, simply does not exist. Subsequentgenerations cannot even keep pace with the average American’sprosperity as measured by per capita GDP growth.Figure 7 traces the decay of the legendary wealth of the families
on the 1918, 1930, 1957, and 1968 Phillips lists during the 32 yearsspanned by the Forbes 400 list. The dashed line shows the numberof descendants of the legendary rich as a percentage of the 400 onthe Forbes list in successive years. The solid line shows the proportion of the aggregate wealth held by the privileged children oflegendary wealth with the passage of time. The rate of decay indynastic wealth, relative to the creation of new wealth by new elite,
478
Cato Journal
FIGURE 7The Erosion of Inherited Legendary Wealth
Source: Research Affiliates based on data from Kevin Phillips and Forbes.
% of Wealth Held by Descendants of the Legendary Rich% of Descendants of the Legendary Rich, out of the 400 listeesExpon. (% of Wealth Held by Descendants of the Legendary Rich)
30%
5% 4%
26%
22%
0%
6%
12%
18%
24%
1982
1986
1990
1994
1998
2002
2006
2010
2014
57496_ch01.qxd:19016_Cato 9/21/15 1:34 PM Page 478

479
Myth of Dynastic Wealth
averages 5.4 percent a year. This rate of decay compares to the over-all decay of wealth for Forbes 400 members of 3 percent a year whenmeasured relative to the aggregate wealth of the list. Those whoinherit wealth dissipate it faster than the wealth creators.
Rags to Riches and Back Again in Three GenerationsOur final test looks at the dynamism of the wealth erosion by gen-
erations. Do the second and third generations dissipate inheritedwealth faster than those who create the wealth in the first place? Wefind that the ancient Chinese proverb “wealth does not pass threegenerations” is demonstrably accurate. We focus on “the Richest ofthe Rich”—those listed as the top 30 wealthiest individuals in Forbes400 lists from 1982 to 2013. This is partly for consistency with theearlier lists from Phillips, which spanned 25 to 30 ultra-wealthy indi-viduals or families, and partly because it is challenging to track downprecisely which generation an individual represents.29
We can track the erosion of wealth of members of the top 30, par-titioned into the three generations, averaged across all of the years, aslong as they are alive and remain anywhere on the Forbes 400 list,whether they are on the top 30 or not.30 Figure 8 shows that, amongtop 30 hyper-wealthy, if they are first-generation creators of thewealth, their share of Forbes 400 wealth erodes very slowly in subse-quent years, falling by barely one-fourth in a quarter century. For thesecond generation, wealth is halved in 24 years, and in just 11 yearsfor the third generation. Relative to the rapid rotation of wealth in theForbes 400, the first, second, and third generations lose ground at anaverage rate of 1.1 percent, 3.2 percent, and 6 percent, respectively.
29It’s labor-intensive to assess whether someone on the Forbes list was the origi-nator of the wealth, or second generation, or third generation, or later. Becausethe earlier lists from Kevin Phillips included up to 30 individuals or families, weopted to focus on the top 30 on each of the Forbes lists, so that we could gaugethe individual’s correct generation. In the very few instances that we could notconfirm genealogy through Wikipedia and other sources, we assume that a top 30Forbes elite is second generation if the family name, but not the indi vidual’sname, was first seen in 1957 or 1968, or any of the prior Forbes top 30 lists, andthird generation if the family name was first seen in 1918 or 1930.30We aggregate the sole fourth generation example, who made the Forbes top 30exactly once, with the third generation.
57496_ch01.qxd:19016_Cato 9/21/15 1:34 PM Page 479

480
Cato Journal
Figure 9 further demonstrates the fallacy of Piketty’s narrative.Collective second-generation wealth from the early 1980s throughthe early 1990s was sometimes just as large as collective first- generation wealth, as a share of top 30 wealth. No more. In recentyears, first-generation wealth—wealth earned by creating productsthat people want and jobs that people need—has comprised over70 percent of the top 30 wealth list, while second-generation andthird-generation wealth has comprised less than 30 percent andabout 2 percent, respectively. Dynasties? By the third generation,they’re in free fall. In the history of mankind, no great wealth has everescaped the eventual “fall from grace.”The founder of a fortune possesses a one-in-a-million talent. His
or her progeny, most particularly after the second generation, areunlikely to inherit the same highly attuned business acumen. Absentsuch genius, the challenge of growing, much less maintaining, thefamily fortune, buffeted by the headwinds of taxes and the machina-tions of competitors, regulators, and others who want to take marketshare or expropriate the wealth outright, is a near impossibility.
FIGURE 8Average Erosion of Top 30Wealth, by Generations
Source: Research Affiliates based on data from Kevin Phillips and Forbes.
First GenerationSecond GenerationThird Generation
100%
0%
25%
50%
75%
Start
t+32
t+28
t+24
t+20
t+16
t+12t+8t+4
Med
ian O
utco
me,
Gro
wth
in Ne
t Wor
th,
Relat
ive to
For
bes 4
00 A
vera
ge
57496_ch01.qxd:19016_Cato 9/21/15 1:34 PM Page 480

481
Myth of Dynastic Wealth
The Cause of Income InequalityIf there’s a “sleeper” in Capital in the 21st Century, it has to do
with the sources of income inequality, not wealth inequality. As wehave seen, there’s a rapidly rotating cast of entrepreneurs in the ranksof the hyper-wealthy, with old money dissipating surprisingly quicklyas new fortunes are created. If we hasten this process, we hasten theinevitable: great wealth is recycled into the macroeconomy with ahalf-life of a generation or less. If we adopt policies aimed to acceler-ate the redistribution of wealth and, in so doing, trigger an unin-tended consequence by lessening the incentives forentrepreneurialism, innovation, and invention, the costs may be muchlarger than the “benefits” wrought by the small marginal increase inthe already vigorous redistributive process that we document.That said, there is a concurrent—and not unrelated—hollowing
out of the opportunity set for the unskilled worker, for the marginallyskilled worker, and perhaps soon for the moderately and significantlyskilled worker. In theory, it is a good thing if society can produce the
Source: Research Affiliates based on data from Kevin Phillips and Forbes.
FIGURE 9Average Share of Top 30Wealth, by Generations
First GenerationSecond GenerationThird Generation and Beyond
80%
0%
20%
40%
60%
1982
2014
2010
2006
2002
1998
1994
1990
1986
% o
f Tot
al W
ealth
57496_ch01.qxd:19016_Cato 9/21/15 1:34 PM Page 481

482
Cato Journal
same goods and services with less effort, as a consequence of technological innovation, setting the stage for rising efficiency andtime- leveraging productivity enhancements. But how is that bountyto be shared? Back to Ayn Rand versus Karl Marx: Societies mustdecide with care how to allow the benefits to spread throughout society without eroding the incentives that drive these innovations inthe first place.Corporate executives make up nearly three-fifths of the top
0.1 percent of the income pie. Even more remarkably, as the shareof national income going to this group quadrupled over the past quarter-century—from 2 percent to 8 percent—fully 70 percent ofthe rise accrued to corporate executives (Bakija, Cole, and Heim2012). Income is now a path to the Forbes 400. We have no qualmsabout paying entrepreneurial rewards (i.e., vast compensation) toexecutives who create substantial wealth for their shareholders orwho facilitate path-breaking innovations and entrepreneurial growth.None of the authors would begrudge the well-earned billions of
Steve Jobs and countless other visionaries who have profited frominspirational leaps that have bettered the lives of millions, nor toexecutives who do the same. But an abundance of research shows little correlation between executive compensation and shareholderwealth creation (let alone societal wealth creation). Nine-figure compensation packages are so routine they only draw notice whenthe recipients simultaneously run their companies into the ground,as was the case with Enron, Global Crossing, Lehman Brothers,Tyco, and myriad others. It’s difficult for an entrepreneur to becomea billionaire, in share wealth, while running a failing business. Howcan even mediocre corporate executives take so much of the pie?Bertrand and Mullainathan (2001) cleverly disentangled skill from
luck by examining situations in which earnings changes could be rea-sonably ascribed to luck (say, a fortuitous change in commodityprices or exchange rates). They found that, on average, CEOs wererewarded just as much for “lucky” earnings as for “skillful” earnings.The authors postulate what they term the “skimming” hypothesis:“When the firm is doing well, shareholders are less likely to notice alarge pay package.” A governance linkage is also evident: The smallerthe board, the more insiders on it, and the longer tenured the CEO,the more flagrant “pay for luck” becomes, while the presence of largeshareholders on the board serves to inhibit skimming. Perhaps share-holders should be more attentive to governance?
57496_ch01.qxd:19016_Cato 9/21/15 1:34 PM Page 482

483
Myth of Dynastic Wealth
Conclusion
When great wealth is achieved through entrepreneurialism, inno-vation, and invention, society benefits, jobs are created, and lifebecomes easier and better. For generations, this process has fueledAmerican exceptionalism. When great income is achieved throughentrepreneurialism, innovation, and invention, society again benefitsfor the same reasons. We find it puzzling that Piketty underplayedwhat even he recognizes as the major driver of growing Americanincome inequality: the massive appropriation of the wealth of corpo-rations by their executives. When it is objectively deserved, terrific;when it is not, it siphons resources out of the macroeconomy and hol-lows out the opportunity set for the populace at large.A second driver of the “politics of envy” is the perception—and
reality—that children of privilege get a head start on becoming theelite of the future, usurping the potential opportunity of others inthe population to become the next Henry Ford or Steve Jobs. Eachof us—libertarian, centrist Republican, and centrist Democrat—would be thrilled to find a way to double or triple the number offuture entrepreneurs and innovators by granting those who are notborn into privilege a similar opportunity to blossom. We have dif-ferent views on whether government is more likely to play a posi-tive or negative role in such an endeavor if empowered to do so. Weall recognize that the next Bill Gates is unlikely to emerge fromsqualid poverty, and we agree on the benefits to society if that weremore plausible. We all agree that the hollowing out of the middleclass is real and is a serious problem, which is better addressed byimproving opportunities for the have-nots to better their lot than byaggressively redistributing from the haves. It is well beyond thescope of this article, however, to propose answers to society’s chal-lenges as they relate to bettering the opportunity set for the middleclass and for the poor.Instead of focusing on access to opportunity, Piketty focuses on
a deeply flawed narrative of dynastic wealth, while overlooking thefact that most immense pools of wealth are first generation, newlycreated by those who have also just created great wealth for society, and ignoring the fact that the wealthy, especially after thisfirst generation, are masters at redistributing—or, to be morefrank, dissipating—their own wealth. When someone has achievedmonumental success, it’s tempting to encourage redistribution.
57496_ch01.qxd:19016_Cato 9/21/15 1:34 PM Page 483

484
Cato Journal
When someone has inherited wealth, earned by a previous gener-ation, or has built great wealth from lofty income without havingthemselves built a great business, envy or a sense of fairness maylead some to say, “Let’s redistribute it.” Dare we forget the trivialfact that “fairness” is subjective?The point of this research is that, whether we are governed by
acolytes of Ayn Rand or Karl Marx, redistribution will occur, no mat-ter what policies are pursued. The only question is whether, in aneffort to accelerate the process, we stifle the innovation and entre-preneurial spirit that achieves great wealth by creating great societalwealth,which as we have shown will be redistributed into the macro-economy with surprising speed, by the wealthy and their offspring.
ReferencesAcemoglu, D., and Robinson, J. A. (2015) “The Rise and Decline ofGeneral Laws of Capitalism.” Journal of Economic Perspectives29 (1): 3–28.
Aldrich, A. (2013) The Astor Orphan: A Memoir. New York: HarperCollins.
Arnott, R. D., and Bernstein, P. (1997) “Bull Market? Bear Market?”Journal of Portfolio Management 24 (1): 26–29.
Arnott, R. D., and Chaves, D. B. (2012) “Demographic Changes,Financial Markets, and the Economy.” Financial Analysts Journal68 (1): 23–46.
(2002) “What Risk Premium Is ‘Normal’?” FinancialAnalysts Journal 58 (2): 64–85.
Bakija, J.; Cole, A.; and Heim, B. T. (2012) “Jobs and Income Growthof Top Earners and the Causes of Changing Income Inequality:Evidence from U.S. Tax Return Data.” Working Paper: web.williams.edu/Economics/wp/BakijaColeHeimJobsIncomeGrowthTopEarners.pdf.
Bernstein, W. J., and Arnott, R. D. (2003) “Earnings Growth: TheTwo Percent Dilution.” Financial Analysts Journal 59 (5): 47–55.
Bertrand, M., and Mullainathan, S. (2001) “Are CEOs Rewarded forLuck? The Ones without Principals Are.” Quarterly Journal ofEconomics 116 (3): 901–32.
Campbell, J. Y., and Shiller, R. J. (1989) “Stock Prices, Earnings, andExpected Dividends.” In R. J. Shiller, Market Volatility. Cambridge,Mass.: MIT Press.
57496_ch01.qxd:19016_Cato 9/21/15 1:34 PM Page 484

485
Myth of Dynastic Wealth
Dimson, E.; Marsh, P.; and Staunton, M. (2002) Triumph of theOptimists: 101 Years of Global Investment Returns. Princeton,N.J.: Princeton University Press.
Feldstein, M. (2014) “Piketty’s Numbers Don’t Add Up.” Wall StreetJournal (14 May).
Green, P. (2013) “The House Inherited Them.” New York Times (10 July).Homer, S., and Sylla, R. (2005) A History of Interest Rates. 4th ed.Hoboken, N. J.: Wiley Finance.
Jorion, P., and Goetzmann, W. (1999) “Global Stock Returns in theTwentieth Century.” Journal of Finance 54 (3): 953–80.
Kinnel, R. (2005) “Mind the Gap: How Good Funds Can Yield BadResults.”Morningstar FundInvestor (July).
(2014) “Mind the Gap 2014.” Morningstar Fund Spy(February).
Krusell, P., and Smith, A. (2014) “Is Piketty’s ‘Second Law of Capitalism’Fundamental?” Working Paper: aida.wss.yale.edu/smith/piketty1.pdf.
London, R. A. (2014) “Inequality: A Piketty Problem?” The Economist(24 May).
Lundberg, F. (1937) “America’s 60 Families.” New York: TheVanguard Press.
Phillips, K. (2002) Wealth and Democracy: A Political History of theAmerican Rich. New York City: Broadway Books.
Piketty, T. (2014) Capital in the Twenty-First Century. Cambridge,Mass.: Harvard University Press.
Reynolds, A. (2014) “Why Piketty’s Wealth Data Are Worthless.”Wall Street Journal (9 July).
Roberts, S. (2014) “Why Are the Rockefellers Moving from 30 Rock?‘We Got a Deal.’” New York Times (23 November).
Rognlie, M. (2014) “A Note on Piketty and Diminishing Returnsto Capital.” Working Paper: www.mit.edu/~mrognlie/piketty_diminishing_returns.pdf.
Schwert, G. W. (1990a) “Indexes of United States Stock Prices from1802 to 1987.” Journal of Business 63 (3): 399–426.
(1990b) “Stock Returns and Real Activity: A Century ofEvidence.” Journal of Finance 45 (4): 1237–57.
57496_ch01.qxd:19016_Cato 9/21/15 1:34 PM Page 485