The Mystery of the Non-Linear Increase in Cache SER
47
The Mystery of the Non-Linear Increase in Cache SER April 15, 2009 Shubu Mukherjee Principal Engineer Director, SPEARS Group Intel Massachusetts, Inc. IEEE Fellow Adjunct Professor at Indian Institute of Technology, Kanpur Joint work with: Vinod Ambrose, Arijit Biswas, Leo Chan, Aamer Jaleel, Athanasios Papathanasiou, Mike Plaster, Charlie Recchia, Norbert Seifert
Transcript of The Mystery of the Non-Linear Increase in Cache SER

The Mystery of the Non-Linear Increase in Cache SER
April 15, 2009
Shubu MukherjeePrincipal Engineer
Director, SPEARS Group
Intel Massachusetts, Inc.
IEEE Fellow
Adjunct Professor at Indian Institute of Technology, Kanpur
Joint work with:
Vinod Ambrose, Arijit Biswas, Leo Chan, Aamer Jaleel, AthanasiosPapathanasiou, Mike Plaster, Charlie Recchia, Norbert Seifert

2
What is a Soft Error?
Neutron or Alpha Particle Strike Changes State of a Single Bit
0
Error is transient, bit is not permanently damaged.
No known feasible shielding or process technology
eliminates this problem completely
1

3
Cosmic Ray Strikes: Evidence & ReactionPublicly disclosed examples
• Error logs in large servers, E. Normand, “Single Event Upset at Ground Level,” IEEE Trans. on Nucl Sci, Vol. 43, No. 6, Dec 1996.
• Sun Microsystems found cosmic ray strikes on L2 cache with defective error protection caused Sun’s flagship servers to suddenly and mysteriously crash, R. Baumann, IRPS Tutorial on SER, 2000.
• Cypress Semiconductor reported in 2004 a single soft error brought a billion-dollar automotive factory to a halt once a month, Ziegler & Puchner, “SER – History, Trends, and Challenges,” Cypress, 2004.
Typical server system data corruption targets 1000 years MTBF
• Very hard to achieve this goal in a cost-effective way
• Bossen, 2002 IRPS Workshop Talk
Server processors beginning to protect latches
• 80% of 200k latches protected with parity in 130 nm Fujitsu SPARC
• Uncore latches radiation-hardened in Intel’s 65nm Tukwila processor

4
Evolution of a Product Team’s Psyche
Shock
“SER is the crabgrass in the lawn of computer design”
Denial
“We will do the SER work two months before tapeout”
Anger
“Our reliability target is too ambitious”
Acceptance
“You can deny physics only for so long”

5
Strike on a bit (e.g., in register file)
Bit

6
Strike on a bit (e.g., in register file)
Bit
Read?
Bit has error
protection?
yes no
benign faultno error

7
Strike on a bit (e.g., in register file)
Bit
Read?
Bit has error
protection?
yes no
detection &
correctionno no error
benign faultno error
detection only
affects program
outcome?
affects program
outcome?

8
Strike on a bit (e.g., in register file)
Bit
Read?
Bit has error
protection?
yes no
detection &
correctionno no error
benign faultno error
detection only
affects program
outcome?
True DUE False DUE
yes no
affects program
outcome?
benign faultno error
SDC
yes no
SDC = Silent Data Corruption, DUE = Detected Unrecoverable Error

9
The Mystery: Cache SER Increases Non-Linearly with Cache Size
Observations in the field showed a higher than expected rate of both correctable ECC events on the L1 Cache Data and uncorrectable Parity events on the L1 Cache Tags
• Parity events are the biggest concern since these cause system halts (DUE)
Intuition based on average behavior indicated cache error rate increases linearly with cache size (2x increase in SER for a 2x increase in cache size)
• However, empirical data indicated a 5x to 10x error rate increase as cache size doubled across a variety of CPUs.

10
The Investigation
The Detectives: Vinod Ambrose, Arijit Biswas, Leo Chan, Aamer Jaleel, Shubu Mukherjee, Athanasios Papathanasiou, Mike Plaster, Charlie Recchia, Norbert Seifert
• Suspects
• Clues & Leads
• Re-enacting the Crime
• The Smoking Gun
• Putting it all Together
• Book ‘em Dan-o
• Conclusions

11
Suspects – Potential Causes of the SER Increase
Electrical Issues
• Load line / power supply issue
• Circuit-level issue related to increased RC on word/bit lines
Design Issues
• Differences in SRAM cell design
• Differences in SRAM cell layout / decap density
Manufacturing Issues
• Process technology effects
Logical Issues
• Workload-based AVF effects
• AVF = probability a bit flip results in user-visible error

12
The Investigation
• Suspects
• Clues & Leads
• Re-enacting the Crime
• The Smoking Gun
• Putting it all Together
• Book ‘em Dan-o
• Conclusions

13
Clues & Leads – The Shakedown
Design sources check on design / layout issues
• SRAM cell design and layout identical between small and large cache parts
Manufacturing sources check on process issues
• No process tweaks or optical shrinks between small and large cache parts
Circuit design sources check parasitic RC issues
• SRAM cell SER insulated from parasitic RC effects of longer bit/word lines
• Parasitic RC on larger cache is not an issue
�Sources eliminate circuit, design, layout & process

14
Clues & Leads –“Elementary my dear Watson”
“…when you have eliminated the impossible, whatever remains, however improbable, must be the truth “–Sir Arthur Conan Doyle
�Logical issues is the only remaining suspect, but how do we prove that workload-related AVF effects are the culprit?
Recall: AVF = probability a bit flip results in user-visible error
AVF = probability that a bit is necessary for Architecturally Correct Execution (ACE)

15
Architecturally Correct Execution (ACE)
Dynamically
Dead
Instruction
ACE path requires only a subset of values to flow correctly through the program’s data flow graph (and the machine)
Anything else (un-ACE path) can be derated away
Most bits of an un-ACE instruction do not affect program output
Program Input
Program Outputs

16
Mapping ACE & un-ACE Instructions to the Instruction Queue
Instruction Queue Data Array
Architectural un-ACE Micro-architectural un-ACE
AVF = fraction of cycles a bit contains ACE state= fraction of ACE bits in IQ in an average cycle
ACE
instIdleNOPs Prefetch
Wrong-
Path
Inst
SER & AVF are properties of a bit so ACEness must be mapped to the bit level

17
T = 3 ACE% = 0/4T = 2 ACE% = 1/4
Computing AVF of a Structure
AVF = fraction of cycles a bit contains ACE state
T = 1 ACE% = 2/4
Average number of ACE bits in a cycleAverage number of ACE bits in a cycle
Total number of bits in the structureTotal number of bits in the structure=
T = 4 ACE% = 3/4( 2 + 1 + 0 + 3 ) / 4( 2 + 1 + 0 + 3 ) / 4
44=

18
The Hypothesis
Similar SER increase seen on specific CPUs for correctable & uncorrectable cache errors
• Correctable errors come from cache data (ECC-protected)
• Uncorrectable errors come from cache tags/status (parity-protected)– Writeback cache Tags are only ACE for dirty cache lines (clean
lines are correctable by invalidate-refetch)
Hypothesis: As the cache size increases, average residency of cache lines increase
• Average # of ACE bits in a cycle increase as a result
• For tags, only dirty line residency is ACE
One obvious indicator of increased cache residency is the # of cache misses

19
Why can Cache Misses be an Indicator of AVF?
� AVF increases can be inversely related to # of cache misses
• # of cache misses as a function of cache size is a property of the workload’s memory footprint
• As the workload’s data and instruction set fit into the cache, number of misses will decrease significantly, increasing the AVF by reducing the unACE time
• This workload-based cache miss phenomenon occurs independent of underlying architecture
• We observed this phenomenon in our AVF computation work for address-based structures for the Data TLB and L1 cache• Observed worst case increases of ~100x

20
Example of Cache Misses Affecting Cache Data AVFMain concept: Time from last ACE Read to next Fill (post-eviction) is unACE
Read A
ACE
Fill A
Read ATime = 0
2x Cache
No Cache Miss
Access fills a different cache
line (not this one)
Un-ACE
ACE
Fill A
Read ATime = 0
Access causes Cache Miss
Fills this cache line
1x Cache
Un-ACE
Read A Fill A
ACE Un-ACE
Fill B
May be ACE or Un-ACE
depending on accesses to B

21
Example of Cache Misses Affecting Cache Tag AVFMain concept: Time from first Write to Evict (Write-back) is ACE
End of Program
Write-back data
Un-ACE
Fill
WriteTime = 0
2x Cache
No Cache Miss
Access fills a different cache
line (not this one)
ACE
Fill
Time = 0
Access causes Cache Miss
Fills this cache line and causes
early Write-back of data
1x Cache
ACE Un-ACEACEUn-ACE
Write

22
The Investigation
• Suspects
• Clues & Leads
• Re-enacting the Crime
• The Smoking Gun
• Putting it all Together
• Book ‘em Dan-o
• Conclusions

23
How do we prove our hypothesis?
Choosing the tools and methodology
Proton beam experiment is conducted to re-create the workload effect
• Target systems are irradiated by accelerated proton beam
• Target workloads are running on target systems while they are irradiated
• Incidence of Detected Unrecoverable Errors (DUE) are counted
Choosing the systems and benchmarks
Systems(Chose 2 CPUs with the exact same core design but different size cache sizes: 1 MB and 2 MB size L2 caches)
• Target system 1: Processor 1X (1 MB)
• Target system 2: Processor 2x (2 MB)
Benchmarks
• Target workload 1: art (Spec2000)
• Target workload 2: libquantum (Spec2006)
• Target workload 3: swim (Spec2000)

24
3 workloads were specifically chosen to test the cache miss hypothesis
artSpec2000
Has large changechange in #misses between 1 and 2 MB
LibquantumSpec 2006
SwimSpec2000
Have no change in #misses between1 and 2 MB
Workload Cache Miss Profiles
1 MB 2 MB
Expect art to show a large increase in AVFExpect libquantum & swim may show little to no change in AVF

25
The Investigation
• Suspects
• Clues & Leads
• Re-enacting the Crime
• The Smoking Gun
• Putting it all Together
• Book ‘em Dan-o
• Conclusions

26
The Smoking Gun
• Art & Swim show a ~4x increase in SER• Libquantum shows negligibe increase in SER
AVF can cause a non-linear increase in SERAll failures are DUE so we focus on Tags
1.2Libquantum
3.87Swim
4.25Art
DUE SER Ratio: (Processor 2x / Processor 1x)
Benchmark

27
Putting it all Together
Tools of the Trade
• VTUNE™ software used to verify modeled cache miss behavior– VTUNE provides a SW interface to HW performance
counters
• AVF simulation studies– L1 cache AVF studies indicate that up to 100x SER increase
for a 2x cache size increase is possible
– Indicated possible scenarios for non-linear AVF increase
• Cache study simulations– Provided architecture-independent cache access statistics
for the 3 benchmarks

28
Explaining the Data: Art
1/33Write-backs
1/3Read Misses
1/4Write Misses
1.56Dirty Reads
1/6MPKI
Ratio: 2X / 1X
Vtune™SimulationArt showed a ~4X SER
increase from 1X to 2X
From 1X to 2X:Dirty Reads increasedMisses decreasedWritebacks decreased
These are all indications of significant increases in the residency time of dirty lines as cache size increases
Measurement results for art show the expected SER increase

29
Explaining the Data: Libquantum & Swim
1.00
1/1.16
1
0.98
1
SwimRatio:2X / 1X
1.01Write-backs
1/1.14Read Misses
1Write Misses
1.06Dirty Reads
1MPKI
LibquantumRatio: 2X / 1X
Vtune™SimulationSwim showed a ~4X
SER increase from 1X to 2X
Libquantum showed a negligible difference in SER
From 1X to 2X:Dirty Reads are similarMisses are similarWritebacks are similar
So why do we see an SER increase in Swim but not Libquantum?
Both were expected to show no increase

30
Swim: Strided Cache Access Patterns
Time
Swim has a higher AVF due to strided access pattern
• Strided access patterns “step” through memory

31
Libquantum: Random Cache Access Patterns
Time
Libquantum has a more random access pattern & no cache locality (99% miss rate for 1MB & 2MB)

32
Strided Cache Access Example
Strided cache access pattern can increase dirty residency times with cache size while keeping event counts and ratios the same
Assume: 2 reads for every write, strided reads and writes
Read1 Read1
Total Dirty Residency Time0 0
Small Cache Large Cache
T=0
CleanDirty
Total Number of Misses1 1

33
Strided Cache Access Example
Strided cache access pattern can increase dirty residency times with cache size while keeping event counts and ratios the same
Assume: 2 reads for every write, strided reads and writes
Read2 Read2
Total Dirty Residency Time0 0
Small Cache Large Cache
T=1
CleanDirty
Total Number of Misses2 2

34
Strided Cache Access Example
Strided cache access pattern can increase dirty residency times with cache size while keeping event counts and ratios the same
Assume: 2 reads for every write, strided reads and writes
1* 1*Write1 Write1
Total Dirty Residency Time1 1
Small Cache Large Cache
T=2* Numbers represent
cumulative dirty cycles
CleanDirty
Total Number of Misses2 2

35
Strided Cache Access Example
Strided cache access pattern can increase dirty residency times with cache size while keeping event counts and ratios the same
Assume: 2 reads for every write, strided reads and writes
2* 2*
Read3 Read3
Total Dirty Residency Time2 2
Small Cache Large Cache
T=3
CleanDirty
Total Number of Misses3 3
* Numbers represent cumulative dirty cycles

36
Strided Cache Access Example
Strided cache access pattern can increase dirty residency times with cache size while keeping event counts and ratios the same
Assume: 2 reads for every write, strided reads and writes
3* 3*
Read4 Read4
Total Dirty Residency Time3 3
Small Cache Large Cache
T=4
CleanDirty
Total Number of Misses4 4
* Numbers represent cumulative dirty cycles

37
Strided Cache Access Example
Strided cache access pattern can increase dirty residency times with cache size while keeping event counts and ratios the same
Assume: 2 reads for every write, strided reads and writes
4*1*
4*1*Write2 Write2
Total Dirty Residency Time5 5
Small Cache Large Cache
T=5
CleanDirty
Total Number of Misses4 4
* Numbers represent cumulative dirty cycles

38
Strided Cache Access Example
Strided cache access pattern can increase dirty residency times with cache size while keeping event counts and ratios the same
Assume: 2 reads for every write, strided reads and writes
4*2*
5*2*
Read5
Read5
Total Dirty Residency Time6 7
Small Cache Large Cache
T=6
Read5 wraps aroundand evicts address 1
CleanDirty
Total Number of Misses5 5
* Numbers represent cumulative dirty cycles

39
Strided Cache Access Example
Strided cache access pattern can increase dirty residency times with cache size while keeping event counts and ratios the same
Assume: 2 reads for every write, strided reads and writes
4*2*
6*3*Read6
Read6
Total Dirty Residency Time6 9
Small Cache Large Cache
T=7
Read6 wraps aroundand evicts address 2
CleanDirty
Total Number of Misses6 6
* Numbers represent cumulative dirty cycles

40
Strided Cache Access Example
Strided cache access pattern can increase dirty residency times with cache size while keeping event counts and ratios the same
Assume: 2 reads for every write, strided reads and writes
4*2*1*
7*4*1*Write3 Write3
Total Dirty Residency Time7 12
Small Cache Large Cache
T=8
CleanDirty
Total Number of Misses6 6
* Numbers represent cumulative dirty cycles
41
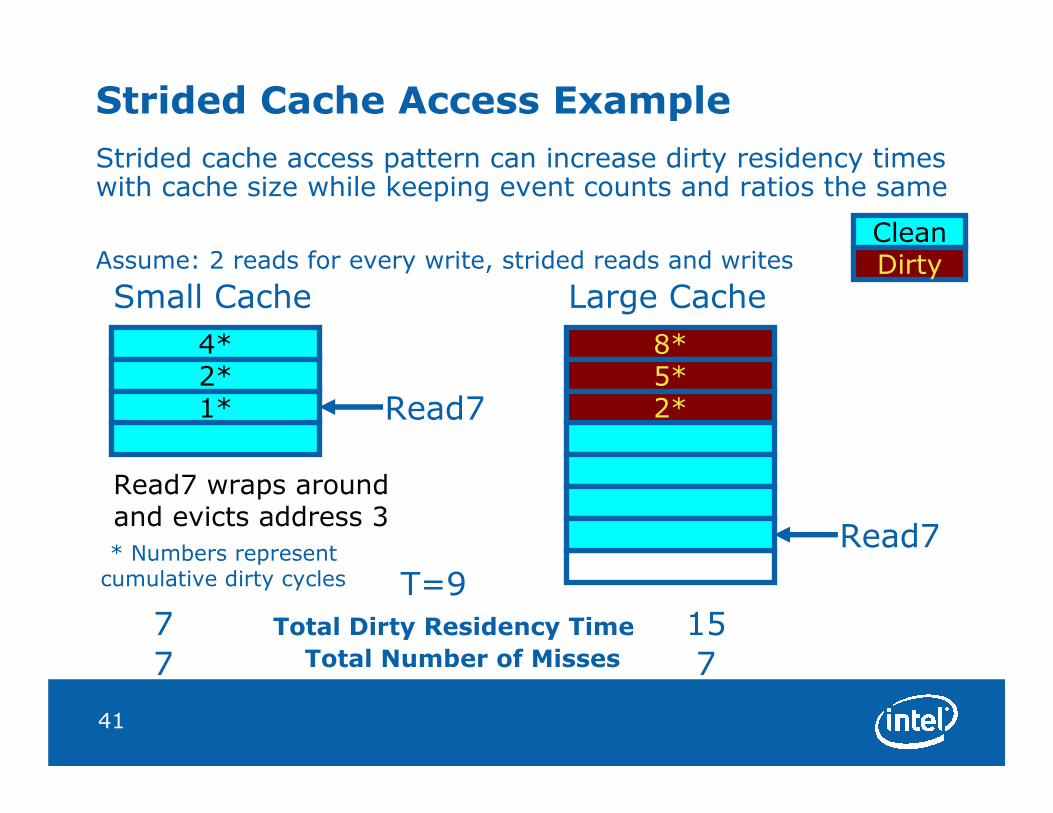
Strided Cache Access Example
Strided cache access pattern can increase dirty residency times with cache size while keeping event counts and ratios the same
Assume: 2 reads for every write, strided reads and writes
4*2*1*
8*5*2*Read7
Read7
Total Dirty Residency Time7 15
Small Cache Large Cache
T=9
Read7 wraps aroundand evicts address 3
CleanDirty
Total Number of Misses7 7
* Numbers represent cumulative dirty cycles

42
Strided Cache Access Example
Strided cache access pattern can increase dirty residency times with cache size while keeping event counts and ratios the same
Assume: 2 reads for every write, strided reads and writes
4*2*1*
9*6*3*
Read8
Read8
Total Dirty Residency Time7 18
Small Cache Large Cache
T=10
Read8 wraps aroundand evicts address 4
CleanDirty
Total Number of Misses8 8
* Numbers represent cumulative dirty cycles

43
Strided Cache Access Example
Strided cache access pattern can increase dirty residency times with cache size while keeping event counts and ratios the same
Assume: 2 reads for every write, strided reads and writes
4*2*
1*1*
10*7*
1*4*
Write4 Write4
Total Dirty Residency Time8 22
Small Cache Large Cache
T=11
CleanDirty
Total Number of Misses10 9
* Numbers represent cumulative dirty cycles

44
Cache Stride Example
Cache stride pattern caused a ~3x increase in dirty residency
• No dirty reads in either case
• Same # of writebacks since all dirty lines will be written back at the end of the program
• # of misses are roughly the same
• Different Read/Write ratios and strides will affect the rate of SER increase
– Swim has a 4:1 ratio of loads:stores

45
The Investigation
• Suspects
• Clues & Leads
• Re-enacting the Crime
• The Smoking Gun
• Putting it all Together
• Book ‘em Dan-o
• Conclusions

46
Book ‘em Dan-o
1.23.874.85MPTF
1/33
1/3
1/4
1.56
1/6
ArtRatio: 2X / 1X
1.01
1/1.14
1
1.06
1
Libquantum Ratio: 2X / 1X
1.00
1/1.16
1
0.98
1
SwimRatio: 2X / 1X
Write-backs
Read Misses
Write Misses
Dirty Reads
MPKI
Vtune™SimulationProton Beam
Art sees a ~4x increase in SER due to dirty residency time increases brought on by lower miss rates
Swim sees a ~4x increase in SER due to dirty residency time increases brought on by a strided access pattern

47
Conclusions
SER can scale non-linearly due to AVF
• Driven by workload-based cache behavior
• Tag AVF driven by residency time of dirty lines
– Decreasing miss rates (Art)
– Strided access patterns (Swim)
What can we do to account for this behavior?
• Recognize and accept that cache AVF behavior is based on residency times of valid lines (dirty lines for tag AVF)
• Provide recovery (correction) of cache errors (e.g. ECC) thereby reducing cache tag DUE to zero
• Increased SER seen on 2X processor was still within spec. Rather, the SER seen on the 1X processor was significantly under spec.