The Murray Ohio Manufacturing Company Presented by: Vincent, Shaoying, Mary, Yuting, and Feny.
36
The Murray Ohio Manufacturing Company Presented by: Vincent, Shaoying, Mary, Yuting, and Feny
-
Upload
cheyanne-cayson -
Category
Documents
-
view
222 -
download
0
Transcript of The Murray Ohio Manufacturing Company Presented by: Vincent, Shaoying, Mary, Yuting, and Feny.

The Murray Ohio Manufacturing Company
Presented by:
Vincent, Shaoying, Mary, Yuting, and Feny

Agenda
Strategy Analysis Accounting Analysis Financial Analysis Prospective Analysis Conclusion Subsequent Developments
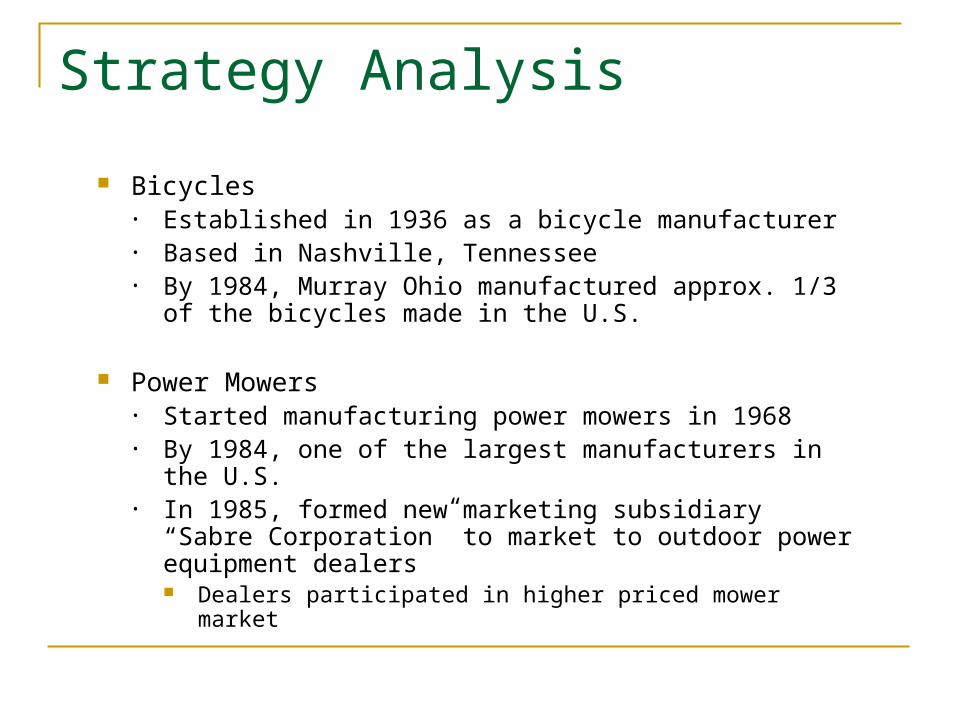
Strategy Analysis
Bicycles• Established in 1936 as a bicycle manufacturer• Based in Nashville, Tennessee• By 1984, Murray Ohio manufactured approx. 1/3 of the
bicycles made in the U.S.
Power Mowers• Started manufacturing power mowers in 1968• By 1984, one of the largest manufacturers in the U.S.• In 1985, formed new marketing subsidiary “Sabre
Corporation” to market to outdoor power equipment dealers Dealers participated in higher priced mower market
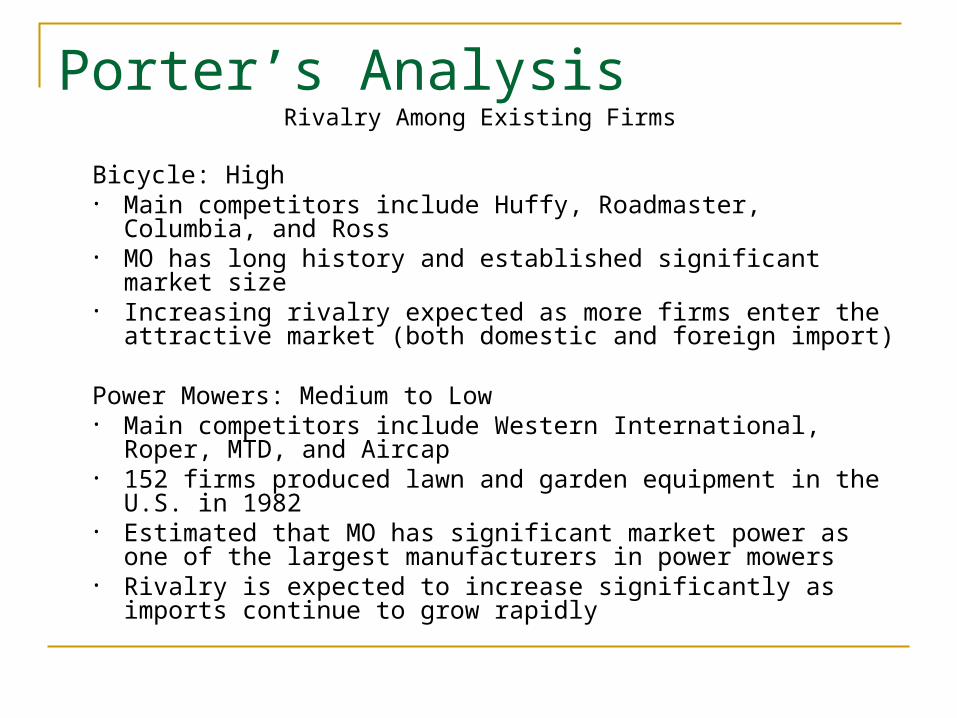
Porter’s AnalysisRivalry Among Existing Firms
Bicycle: High• Main competitors include Huffy, Roadmaster, Columbia, and
Ross • MO has long history and established significant market size• Increasing rivalry expected as more firms enter the attractive
market (both domestic and foreign import)
Power Mowers: Medium to Low • Main competitors include Western International, Roper, MTD,
and Aircap • 152 firms produced lawn and garden equipment in the U.S. in
1982• Estimated that MO has significant market power as one of the
largest manufacturers in power mowers• Rivalry is expected to increase significantly as imports continue
to grow rapidly
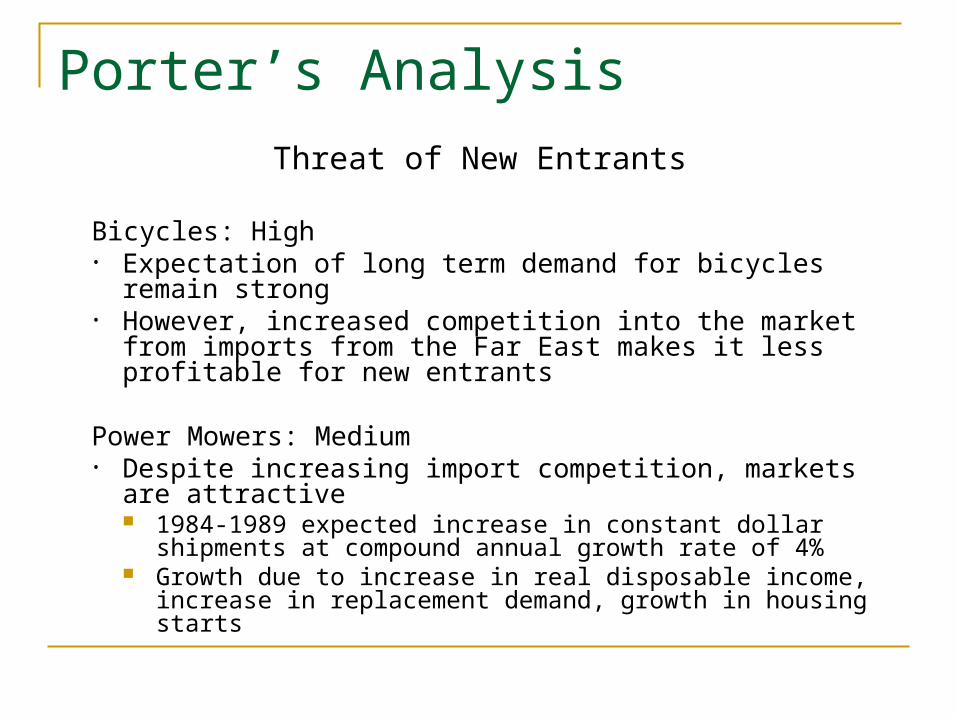
Porter’s Analysis
Threat of New Entrants
Bicycles: High• Expectation of long term demand for bicycles remain strong• However, increased competition into the market from
imports from the Far East makes it less profitable for new entrants
Power Mowers: Medium• Despite increasing import competition, markets are
attractive 1984-1989 expected increase in constant dollar shipments at
compound annual growth rate of 4% Growth due to increase in real disposable income, increase in
replacement demand, growth in housing starts
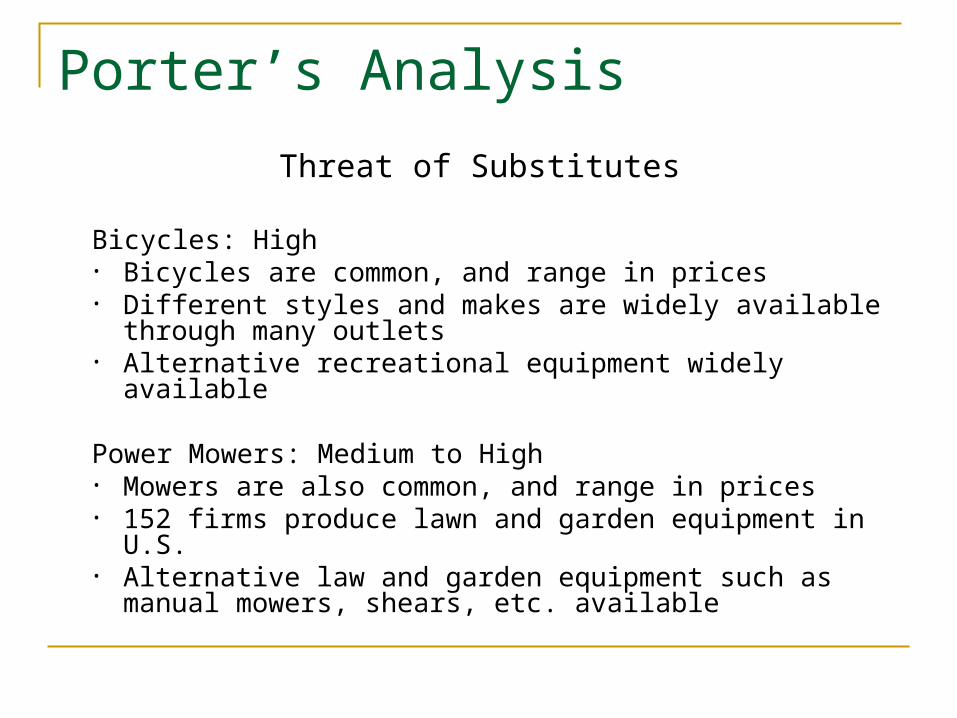
Porter’s Analysis
Threat of Substitutes
Bicycles: High• Bicycles are common, and range in prices• Different styles and makes are widely available through
many outlets• Alternative recreational equipment widely available
Power Mowers: Medium to High• Mowers are also common, and range in prices• 152 firms produce lawn and garden equipment in U.S.• Alternative law and garden equipment such as manual
mowers, shears, etc. available
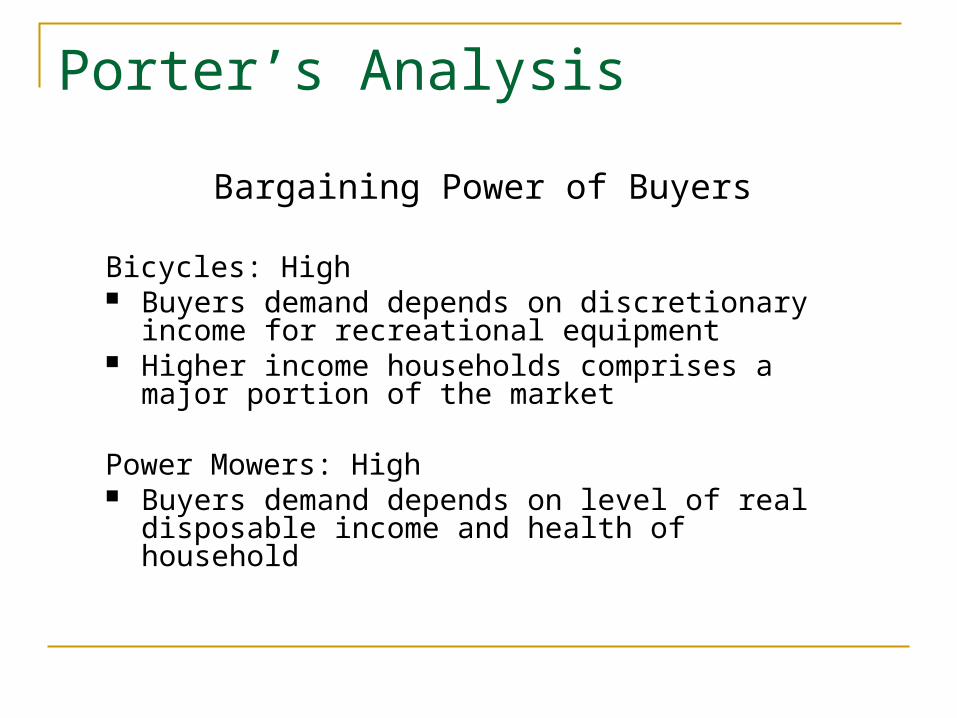
Porter’s Analysis
Bargaining Power of Buyers
Bicycles: High Buyers demand depends on discretionary income for
recreational equipment Higher income households comprises a major portion
of the market
Power Mowers: High Buyers demand depends on level of real disposable
income and health of household
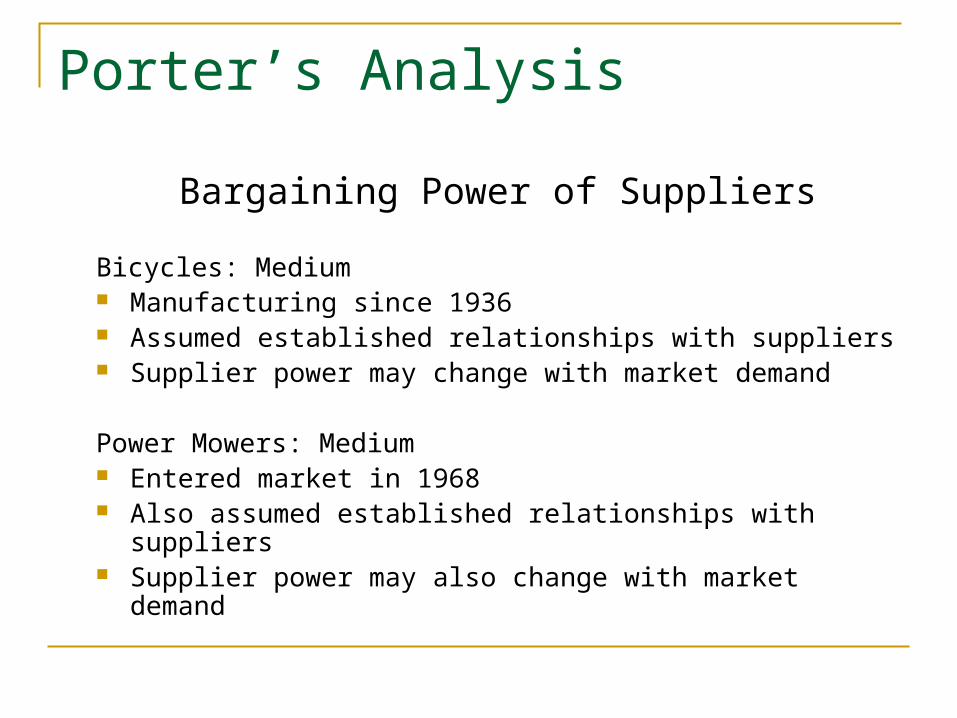
Porter’s Analysis
Bargaining Power of Suppliers
Bicycles: Medium Manufacturing since 1936 Assumed established relationships with suppliers Supplier power may change with market demand
Power Mowers: Medium Entered market in 1968 Also assumed established relationships with suppliers Supplier power may also change with market demand
Porter’s Analysis
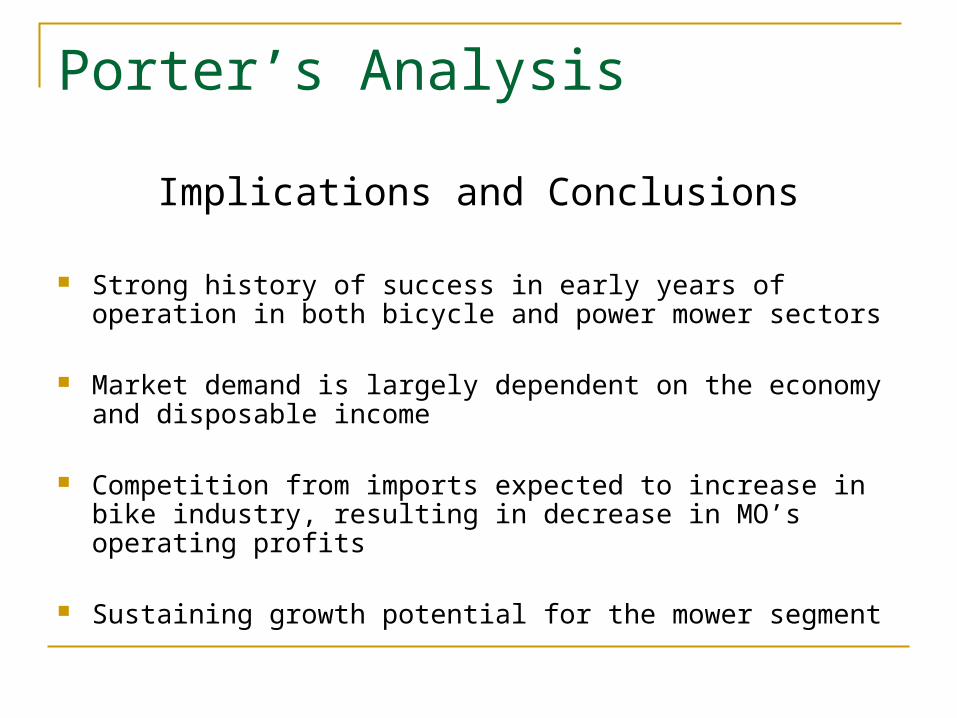
Implications and Conclusions
Strong history of success in early years of operation in both bicycle and power mower sectors
Market demand is largely dependent on the economy and disposable income
Competition from imports expected to increase in bike industry, resulting in decrease in MO’s operating profits
Sustaining growth potential for the mower segment
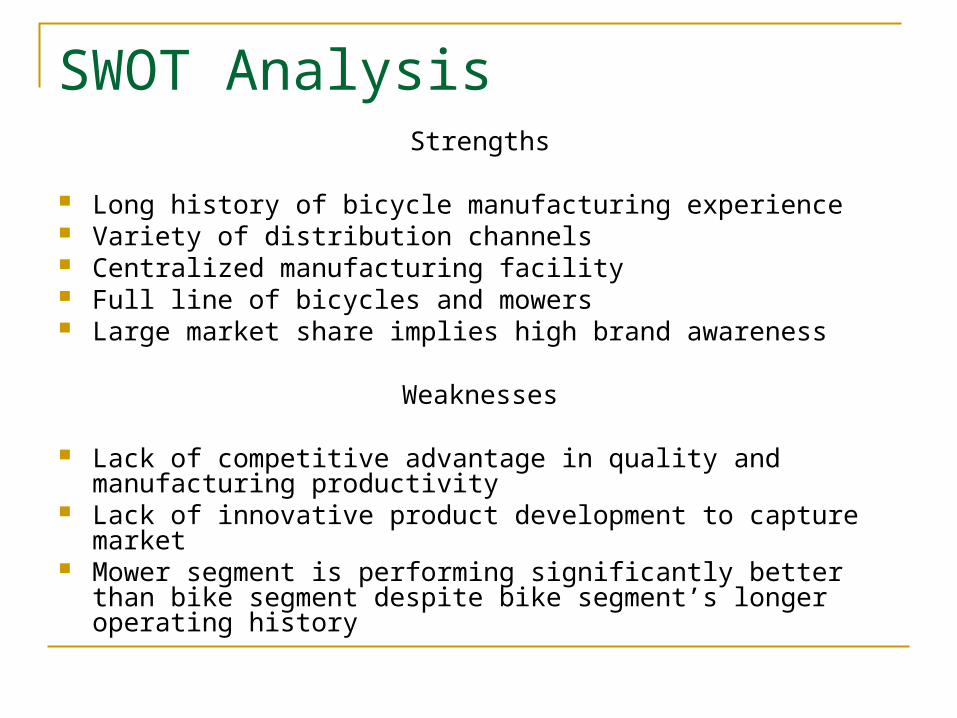
SWOT AnalysisStrengths
Long history of bicycle manufacturing experience Variety of distribution channels Centralized manufacturing facility Full line of bicycles and mowers Large market share implies high brand awareness
Weaknesses
Lack of competitive advantage in quality and manufacturing productivity
Lack of innovative product development to capture market Mower segment is performing significantly better than bike
segment despite bike segment’s longer operating history
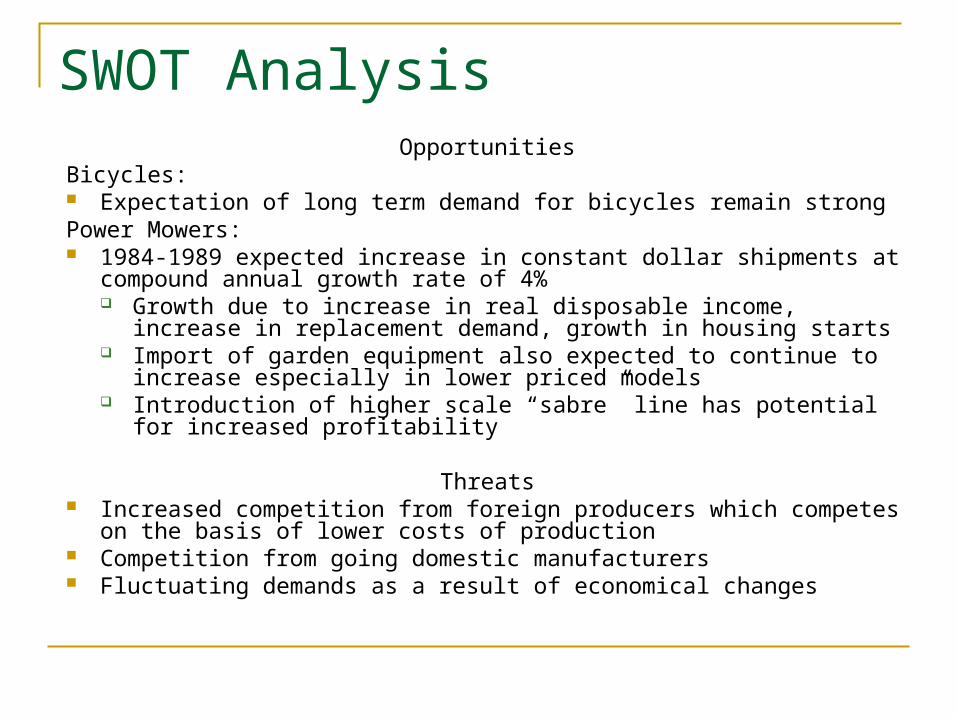
SWOT AnalysisOpportunities
Bicycles: Expectation of long term demand for bicycles remain strongPower Mowers: 1984-1989 expected increase in constant dollar shipments at compound
annual growth rate of 4% Growth due to increase in real disposable income, increase in
replacement demand, growth in housing starts Import of garden equipment also expected to continue to increase
especially in lower priced models Introduction of higher scale “sabre” line has potential for increased
profitability
Threats Increased competition from foreign producers which competes on the basis
of lower costs of production Competition from going domestic manufacturers Fluctuating demands as a result of economical changes
SWOT Analysis
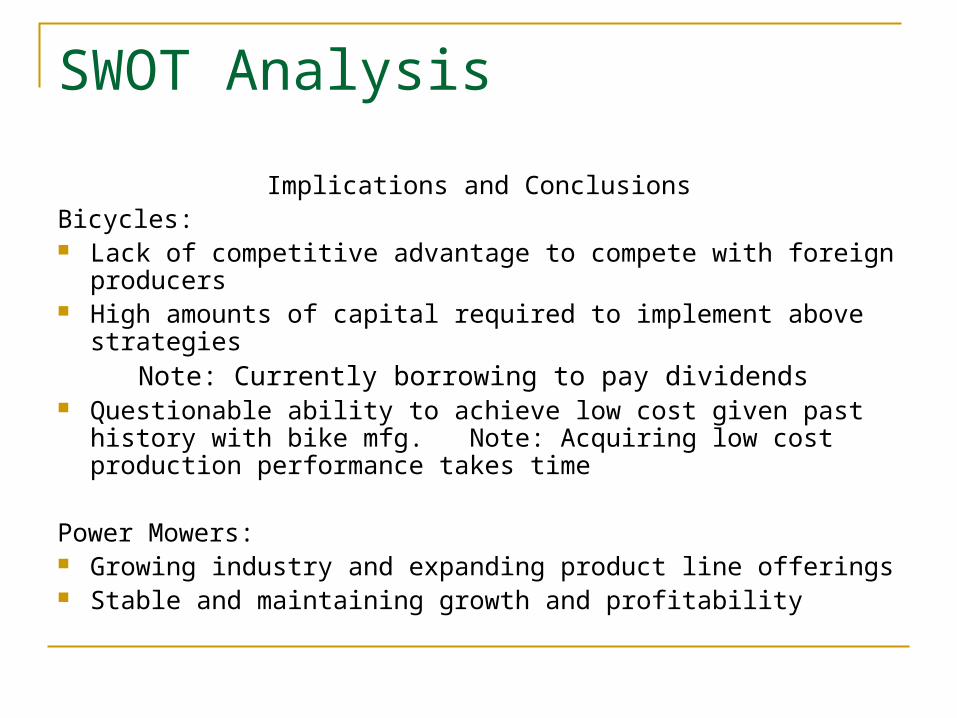
Implications and ConclusionsBicycles: Lack of competitive advantage to compete with foreign producers High amounts of capital required to implement above strategies
Note: Currently borrowing to pay dividends Questionable ability to achieve low cost given past history with
bike mfg. Note: Acquiring low cost production performance takes time
Power Mowers: Growing industry and expanding product line offerings Stable and maintaining growth and profitability
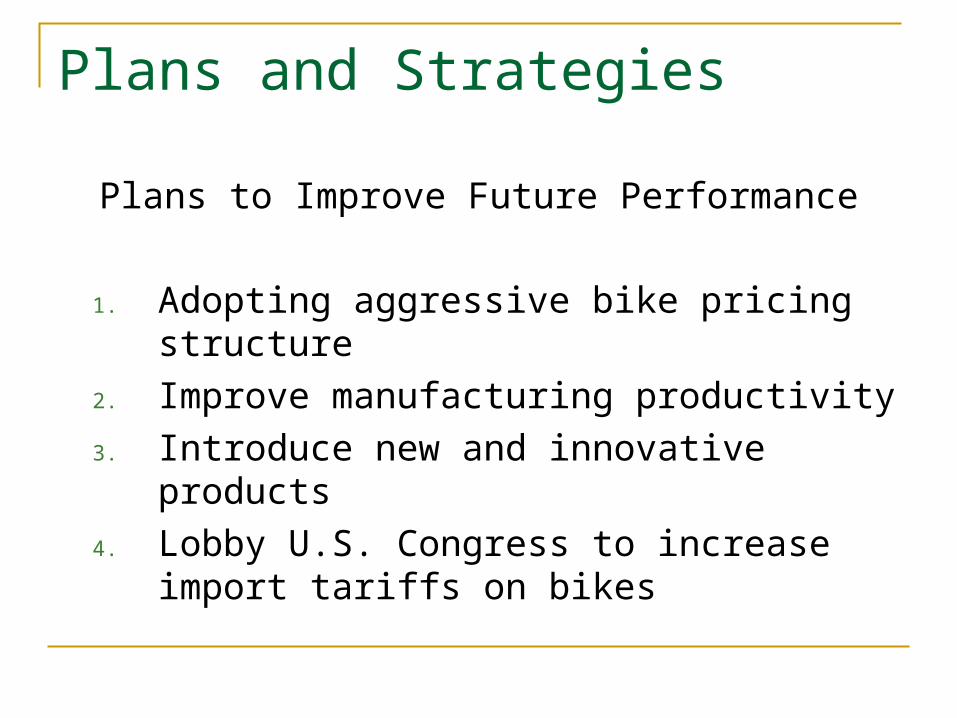
Plans and Strategies
Plans to Improve Future Performance
1. Adopting aggressive bike pricing structure
2. Improve manufacturing productivity
3. Introduce new and innovative products
4. Lobby U.S. Congress to increase import tariffs on bikes

Case Discussion 1
Based on the new proposed strategy, can the company improve their sales for bicycles and power mowers? Yes, why? No, why
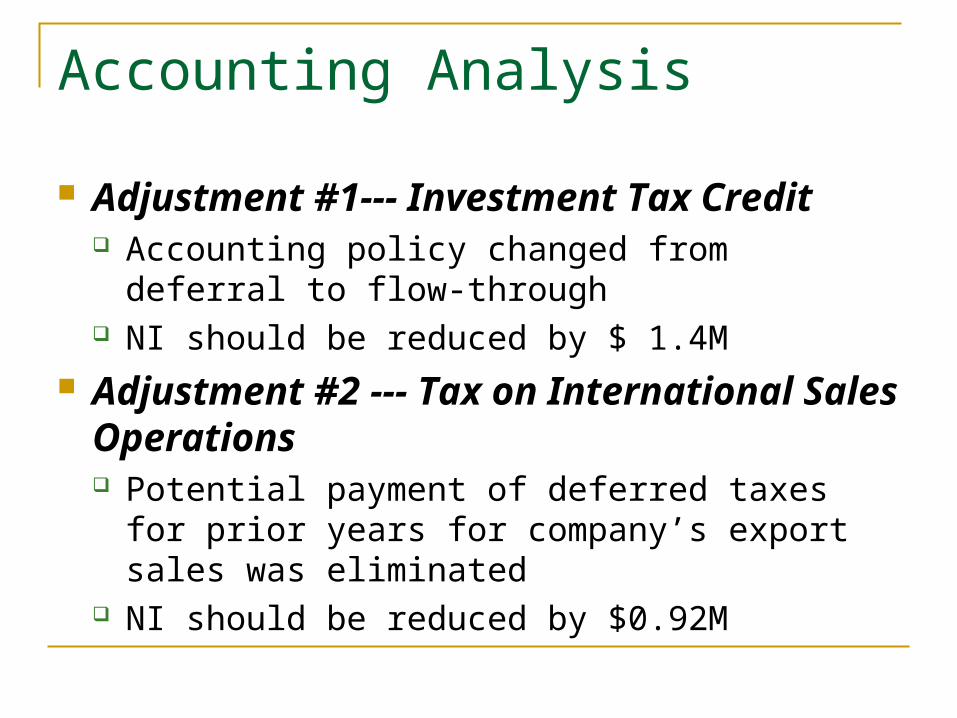
Accounting Analysis
Adjustment #1--- Investment Tax Credit Accounting policy changed from deferral to flow-
through NI should be reduced by $ 1.4M
Adjustment #2 --- Tax on International Sales Operations Potential payment of deferred taxes for prior years
for company’s export sales was eliminated NI should be reduced by $0.92M
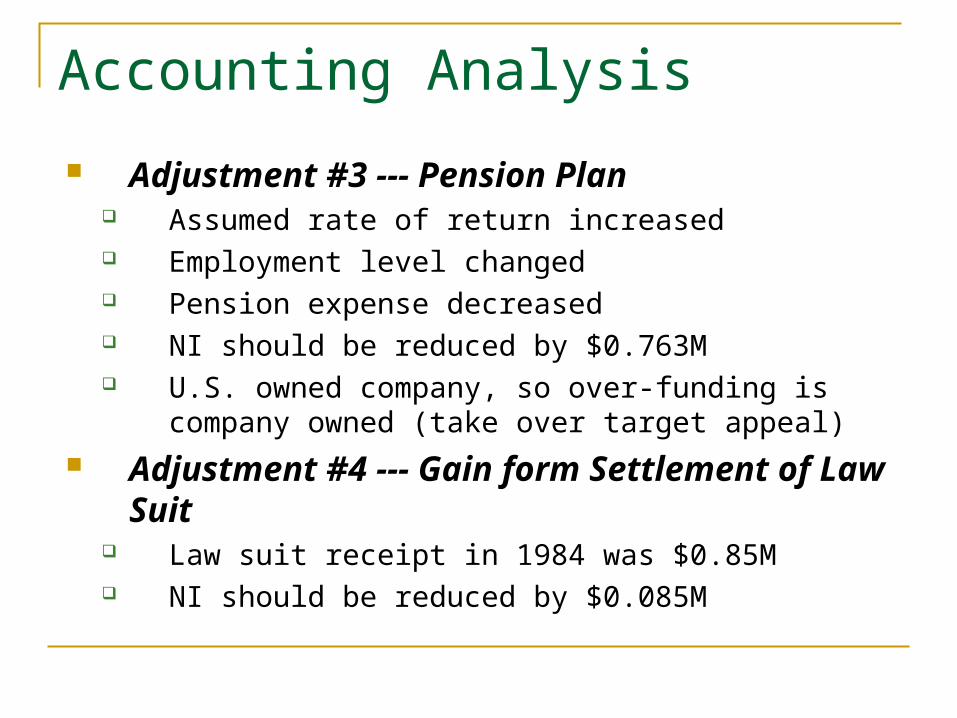
Accounting Analysis
Adjustment #3 --- Pension Plan Assumed rate of return increased Employment level changed Pension expense decreased NI should be reduced by $0.763M U.S. owned company, so over-funding is company
owned (take over target appeal) Adjustment #4 --- Gain form Settlement of Law
Suit Law suit receipt in 1984 was $0.85M NI should be reduced by $0.085M
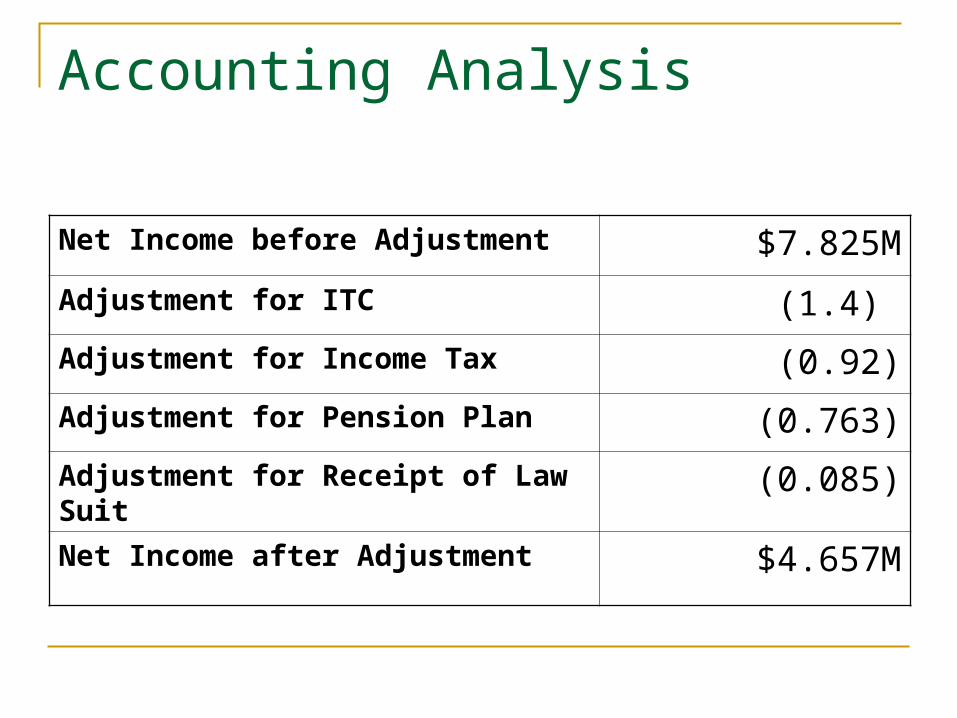
Accounting Analysis
Net Income before Adjustment $7.825M
Adjustment for ITC (1.4)
Adjustment for Income Tax (0.92)
Adjustment for Pension Plan (0.763)
Adjustment for Receipt of Law Suit (0.085)
Net Income after Adjustment $4.657M
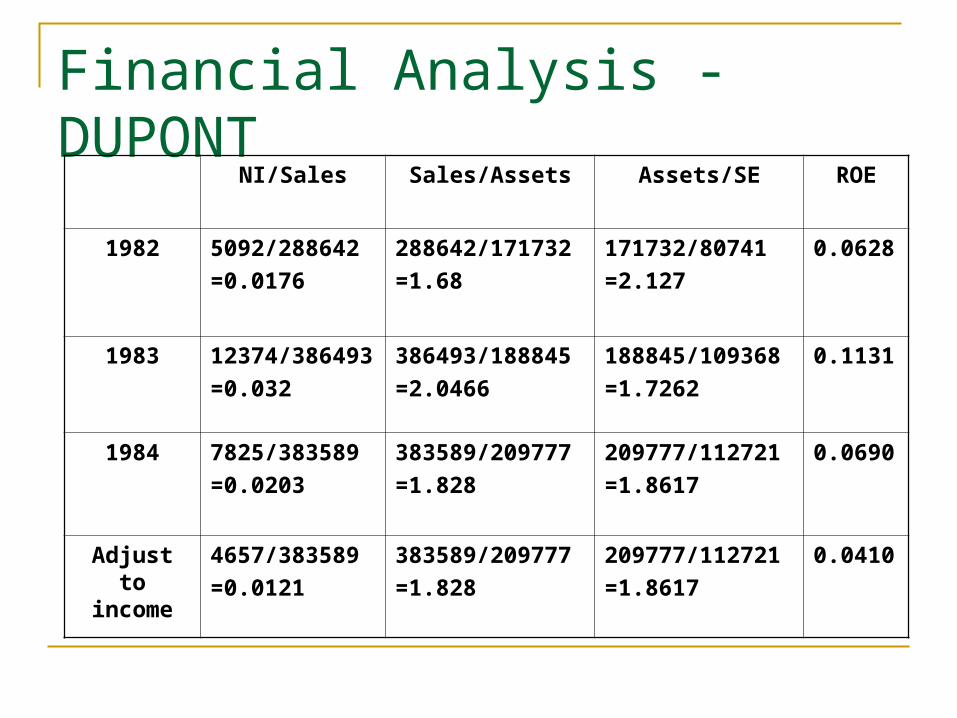
Financial Analysis - DUPONT
NI/Sales Sales/Assets Assets/SE ROE
1982 5092/288642
=0.0176
288642/171732
=1.68
171732/80741
=2.127
0.0628
1983 12374/386493
=0.032
386493/188845
=2.0466
188845/109368
=1.7262
0.1131
1984 7825/383589
=0.0203
383589/209777
=1.828
209777/112721
=1.8617
0.0690
Adjust to income
4657/383589
=0.0121
383589/209777
=1.828
209777/112721
=1.8617
0.0410
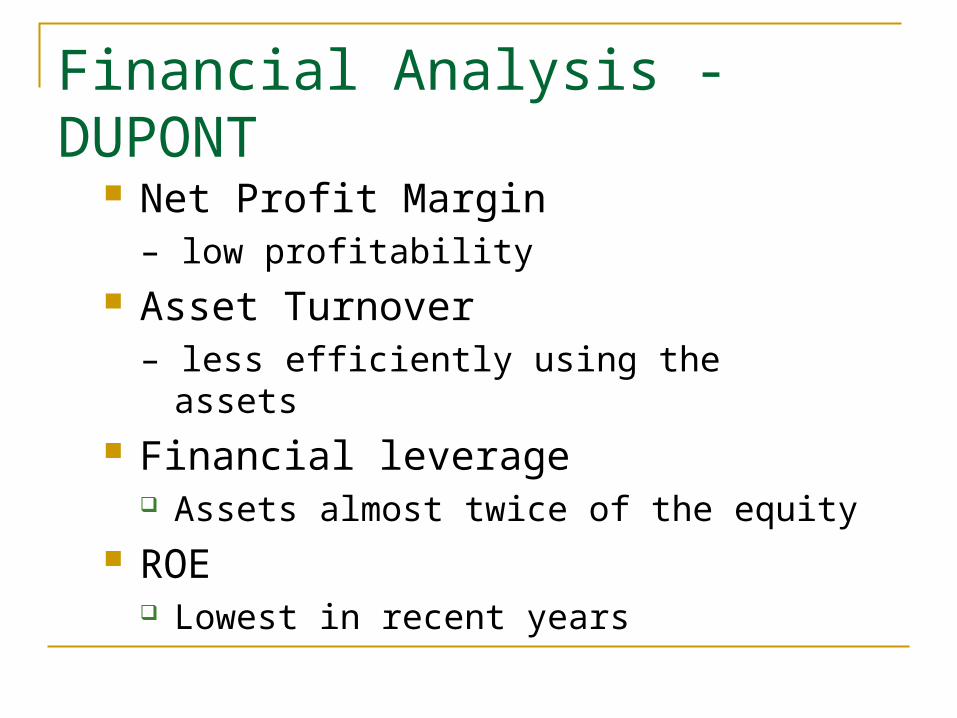
Financial Analysis - DUPONT
Net Profit Margin – low profitability
Asset Turnover – less efficiently using the assets
Financial leverage Assets almost twice of the equity
ROE Lowest in recent years
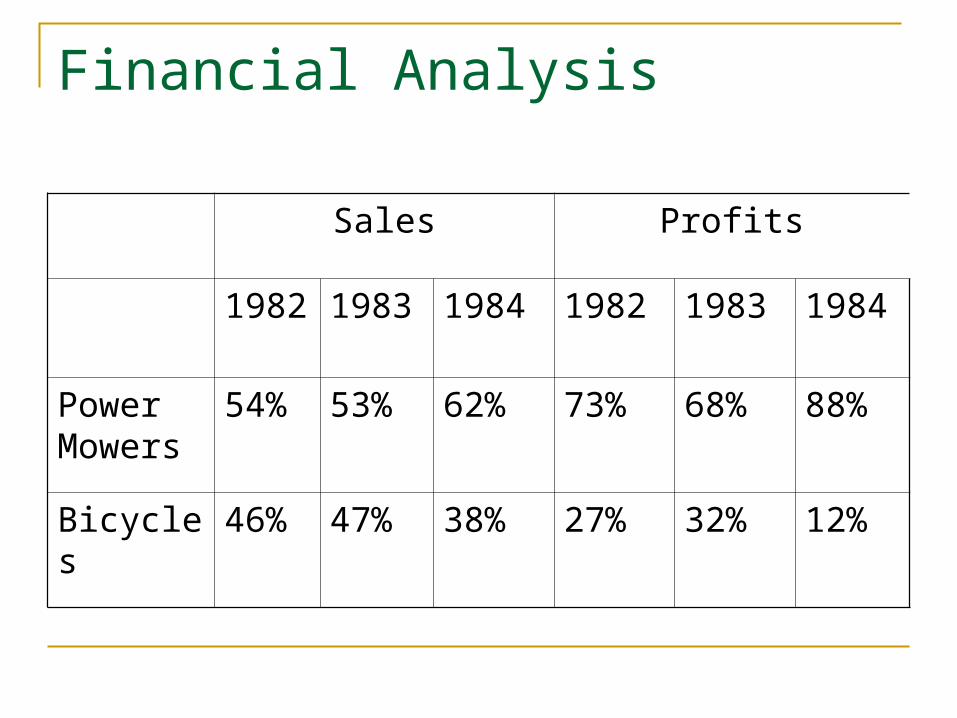
Financial Analysis
Sales Profits
1982 1983 1984 1982 1983 1984
Power Mowers
54% 53% 62% 73% 68% 88%
Bicycles 46% 47% 38% 27% 32% 12%
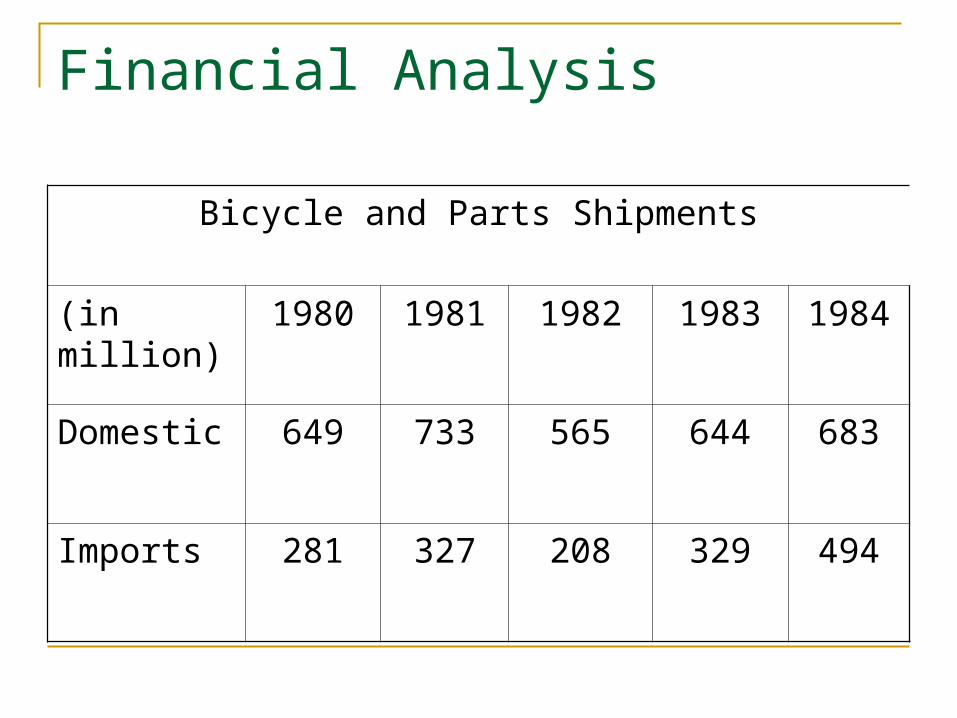
Financial Analysis
Bicycle and Parts Shipments
(in million) 1980 1981 1982 1983 1984
Domestic 649 733 565 644 683
Imports 281 327 208 329 494
Financial Analysis
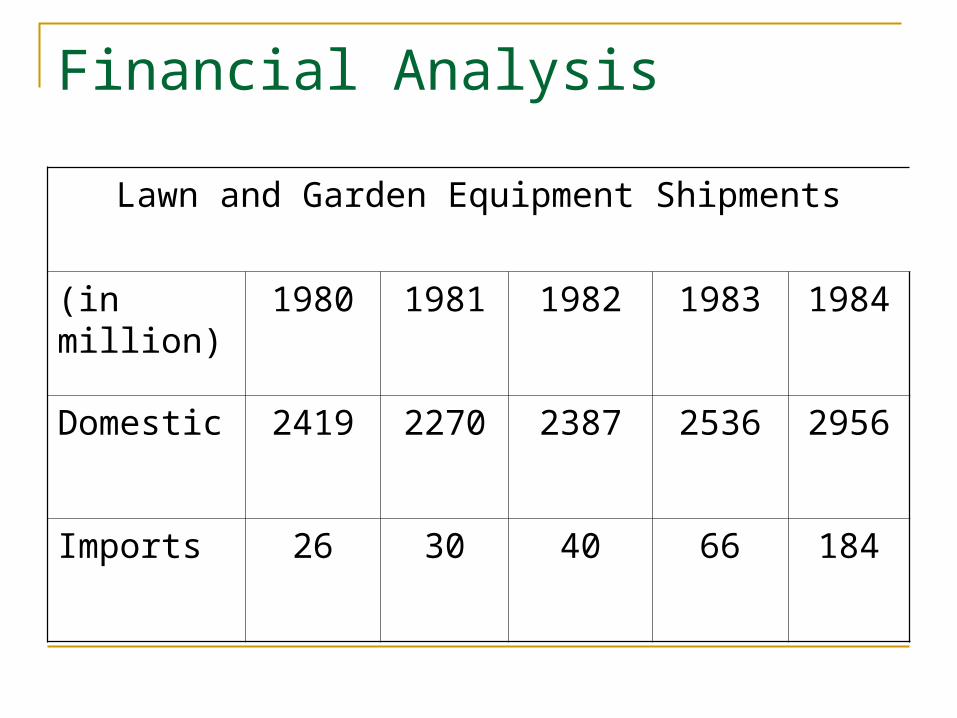
Lawn and Garden Equipment Shipments
(in million) 1980 1981 1982 1983 1984
Domestic 2419 2270 2387 2536 2956
Imports 26 30 40 66 184
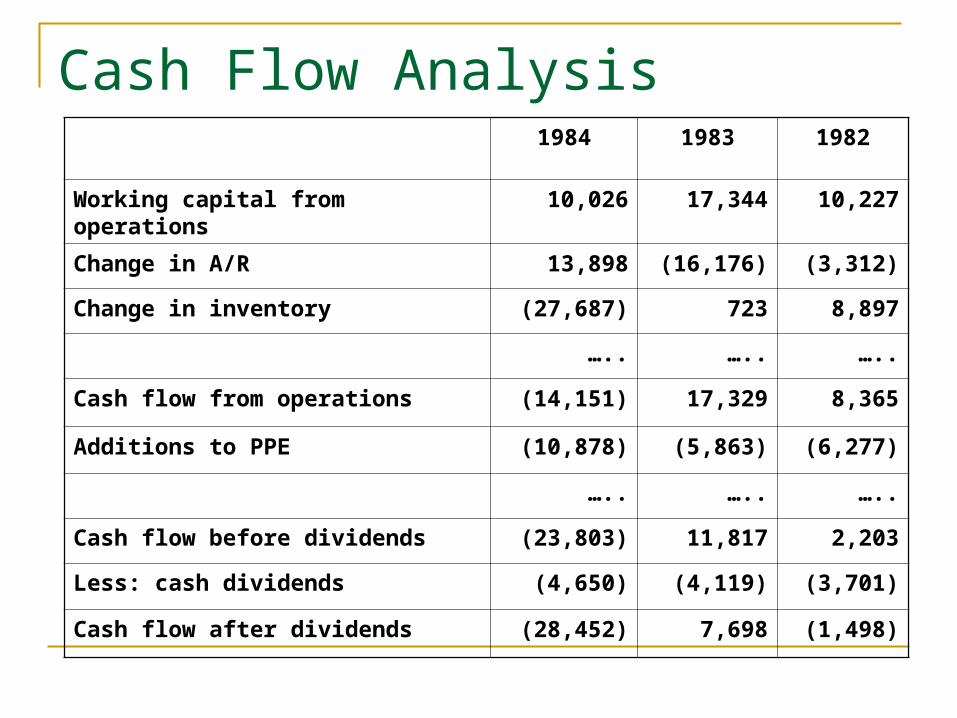
Cash Flow Analysis1984 1983 1982
Working capital from operations 10,026 17,344 10,227
Change in A/R 13,898 (16,176) (3,312)
Change in inventory (27,687) 723 8,897
….. ….. …..
Cash flow from operations (14,151) 17,329 8,365
Additions to PPE (10,878) (5,863) (6,277)
….. ….. …..
Cash flow before dividends (23,803) 11,817 2,203
Less: cash dividends (4,650) (4,119) (3,701)
Cash flow after dividends (28,452) 7,698 (1,498)

Class Discussion 2
As security analysts: Would you keep the company’s stock under the
equity income fund? Would you keep a different equity portfolio? Would you consider to sell it?
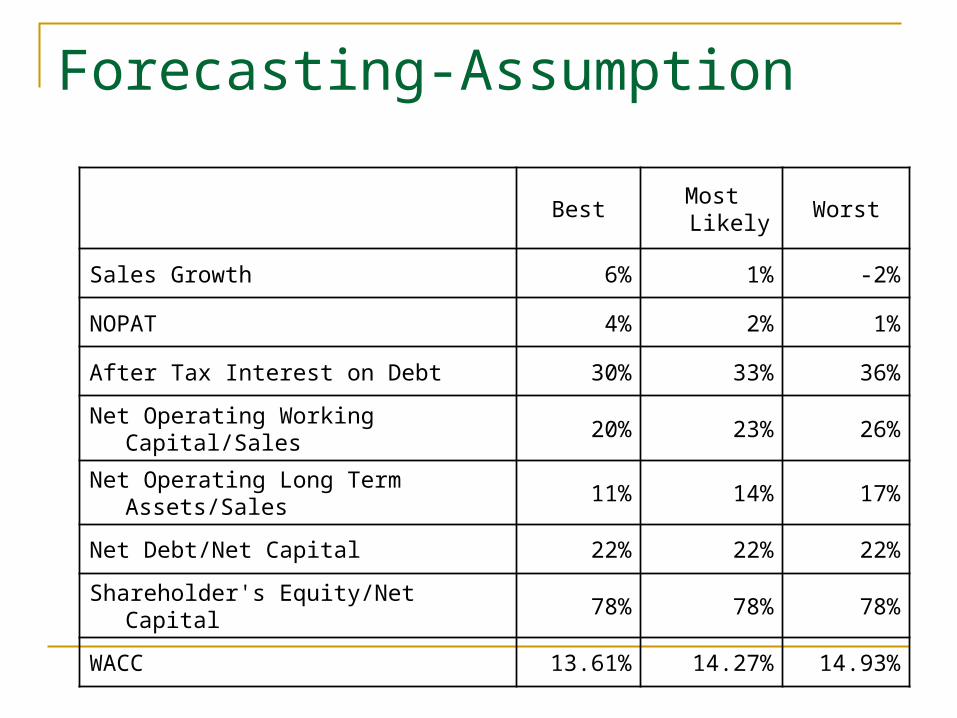
Forecasting-Assumption
BestMost Likely
Worst
Sales Growth 6% 1% -2%
NOPAT 4% 2% 1%
After Tax Interest on Debt 30% 33% 36%
Net Operating Working Capital/Sales
20% 23% 26%
Net Operating Long Term Assets/Sales
11% 14% 17%
Net Debt/Net Capital 22% 22% 22%
Shareholder's Equity/Net Capital 78% 78% 78%
WACC 13.61% 14.27% 14.93%
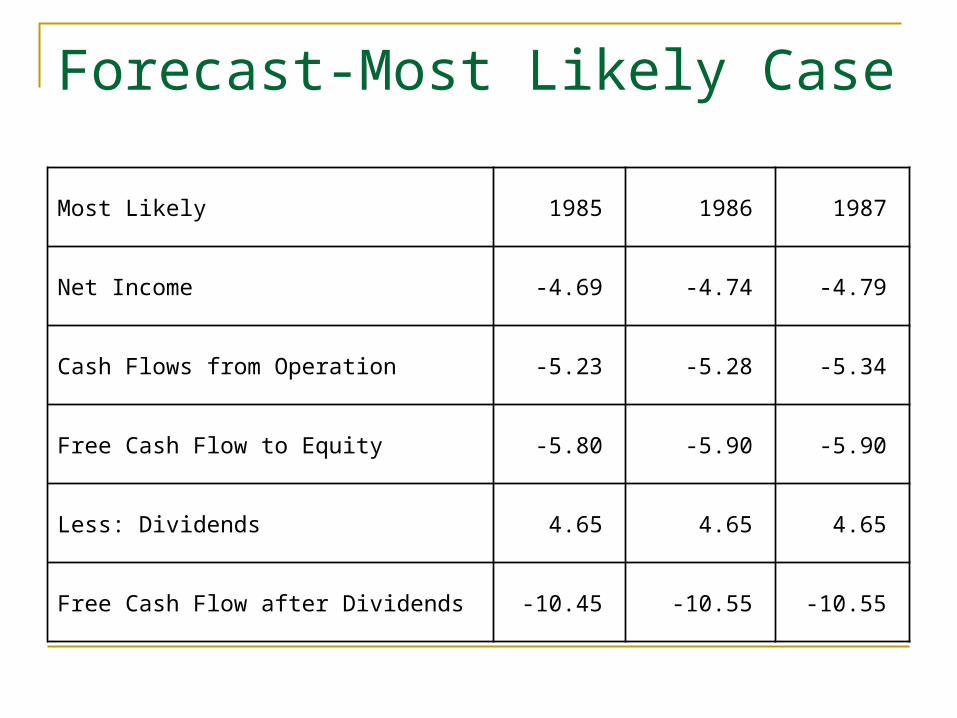
Forecast-Most Likely Case
Most Likely 1985 1986 1987
Net Income -4.69 -4.74 -4.79
Cash Flows from Operation -5.23 -5.28 -5.34
Free Cash Flow to Equity -5.80 -5.90 -5.90
Less: Dividends 4.65 4.65 4.65
Free Cash Flow after Dividends -10.45 -10.55 -10.55
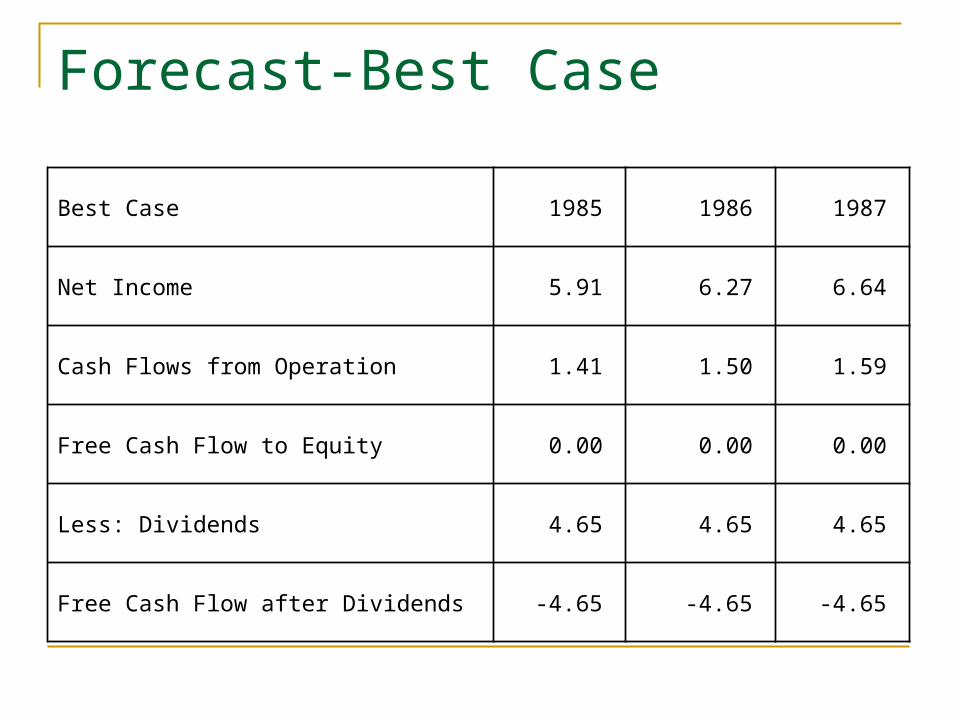
Forecast-Best Case
Best Case 1985 1986 1987
Net Income 5.91 6.27 6.64
Cash Flows from Operation 1.41 1.50 1.59
Free Cash Flow to Equity 0.00 0.00 0.00
Less: Dividends 4.65 4.65 4.65
Free Cash Flow after Dividends -4.65 -4.65 -4.65
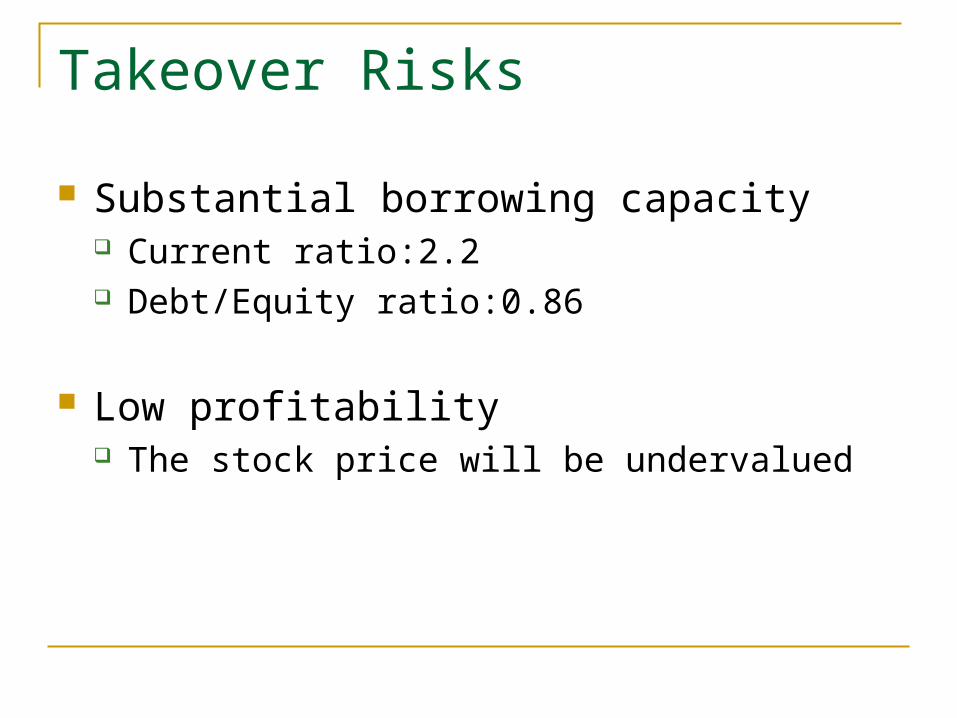
Takeover Risks
Substantial borrowing capacity Current ratio:2.2 Debt/Equity ratio:0.86
Low profitability The stock price will be undervalued
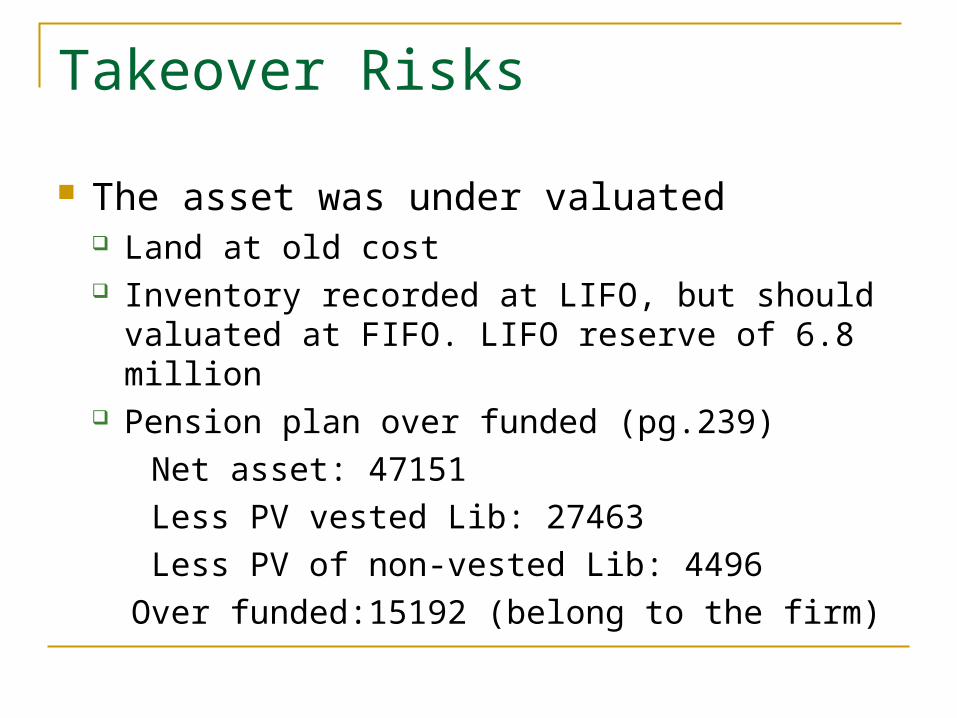
Takeover Risks
The asset was under valuated Land at old cost Inventory recorded at LIFO, but should valuated at
FIFO. LIFO reserve of 6.8 million Pension plan over funded (pg.239)
Net asset: 47151
Less PV vested Lib: 27463
Less PV of non-vested Lib: 4496
Over funded:15192 (belong to the firm)
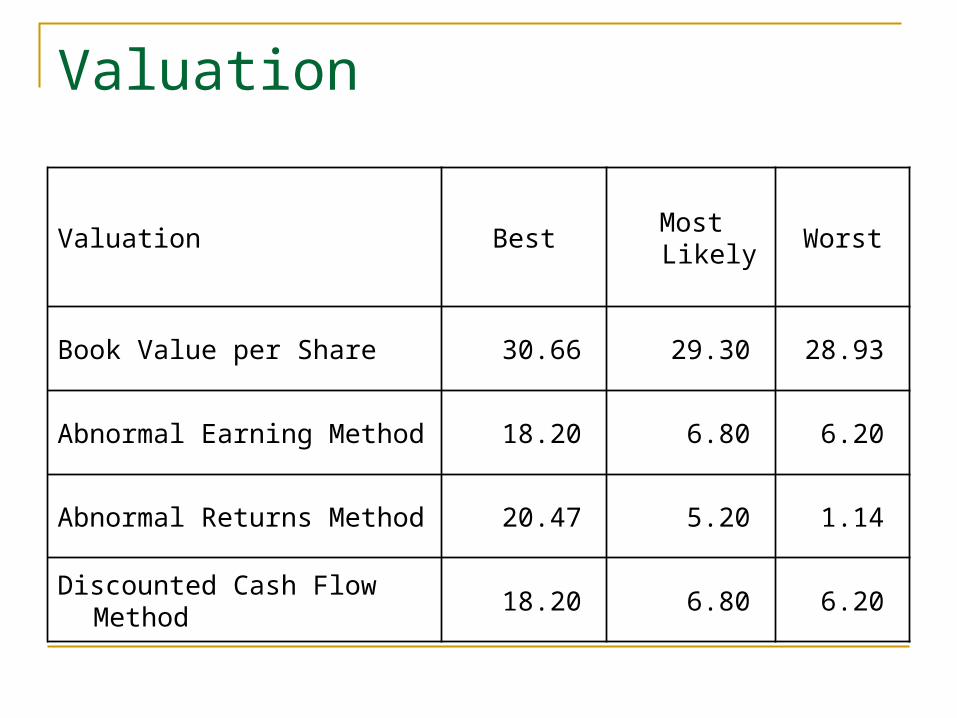
Valuation
Valuation BestMost Likely
Worst
Book Value per Share 30.66 29.30 28.93
Abnormal Earning Method 18.20 6.80 6.20
Abnormal Returns Method 20.47 5.20 1.14
Discounted Cash Flow Method
18.20 6.80 6.20
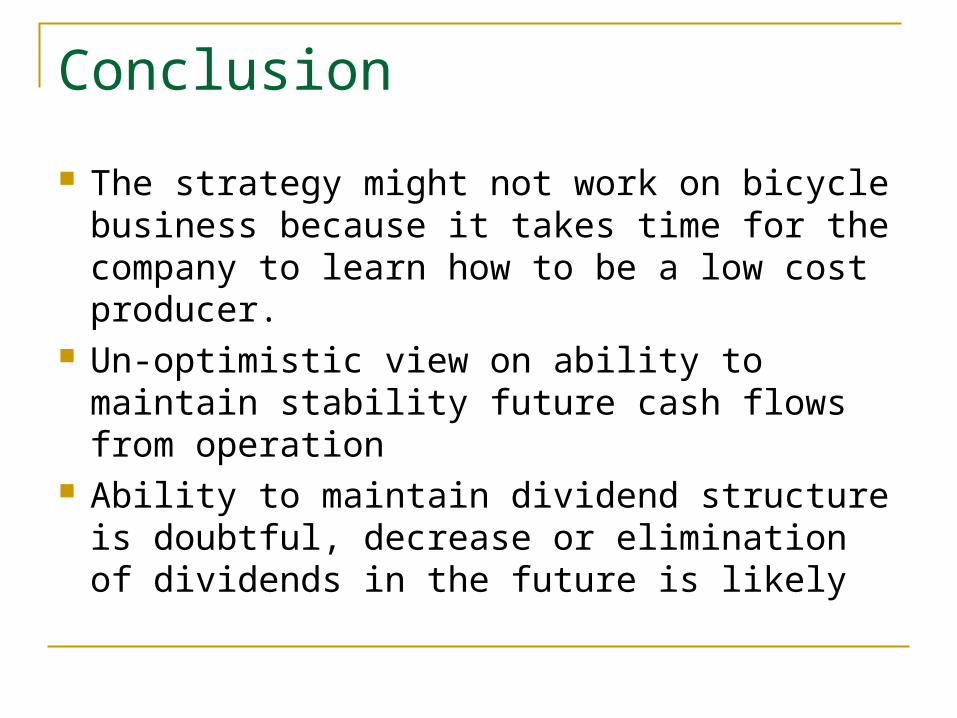
Conclusion
The strategy might not work on bicycle business because it takes time for the company to learn how to be a low cost producer.
Un-optimistic view on ability to maintain stability future cash flows from operation
Ability to maintain dividend structure is doubtful, decrease or elimination of dividends in the future is likely
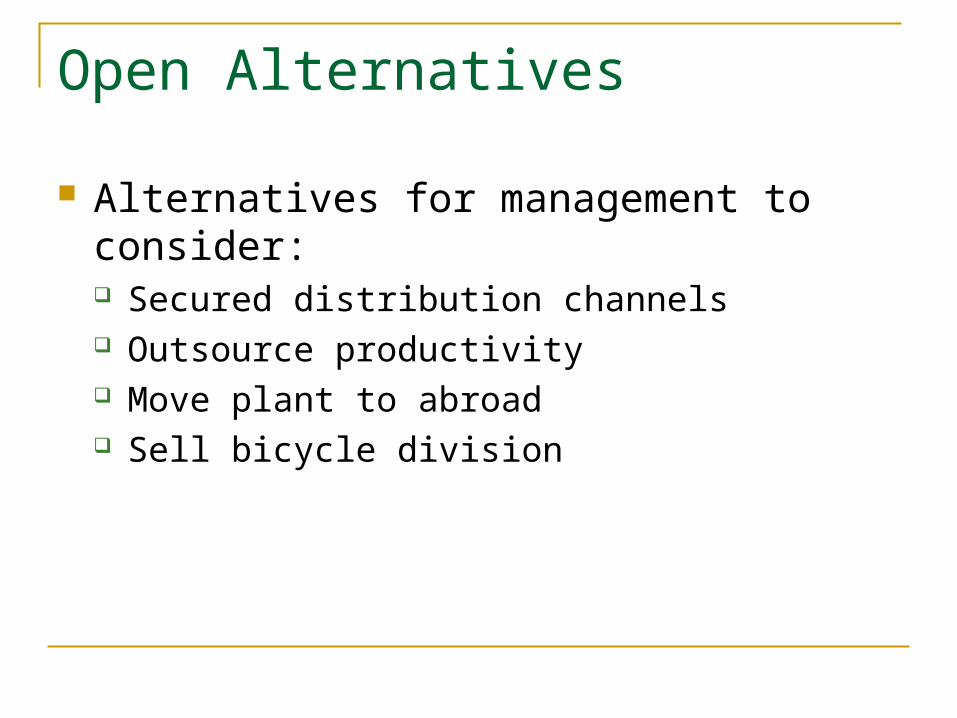
Open Alternatives
Alternatives for management to consider: Secured distribution channels Outsource productivity Move plant to abroad Sell bicycle division
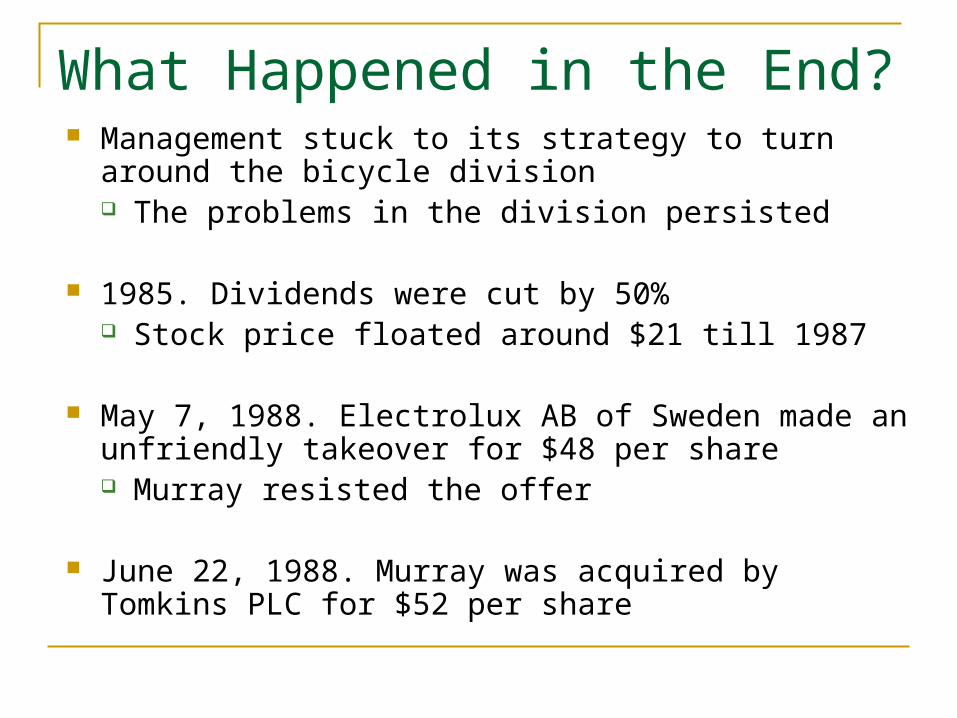
What Happened in the End? Management stuck to its strategy to turn around the
bicycle division The problems in the division persisted
1985. Dividends were cut by 50% Stock price floated around $21 till 1987
May 7, 1988. Electrolux AB of Sweden made an unfriendly takeover for $48 per share Murray resisted the offer
June 22, 1988. Murray was acquired by Tomkins PLC for $52 per share
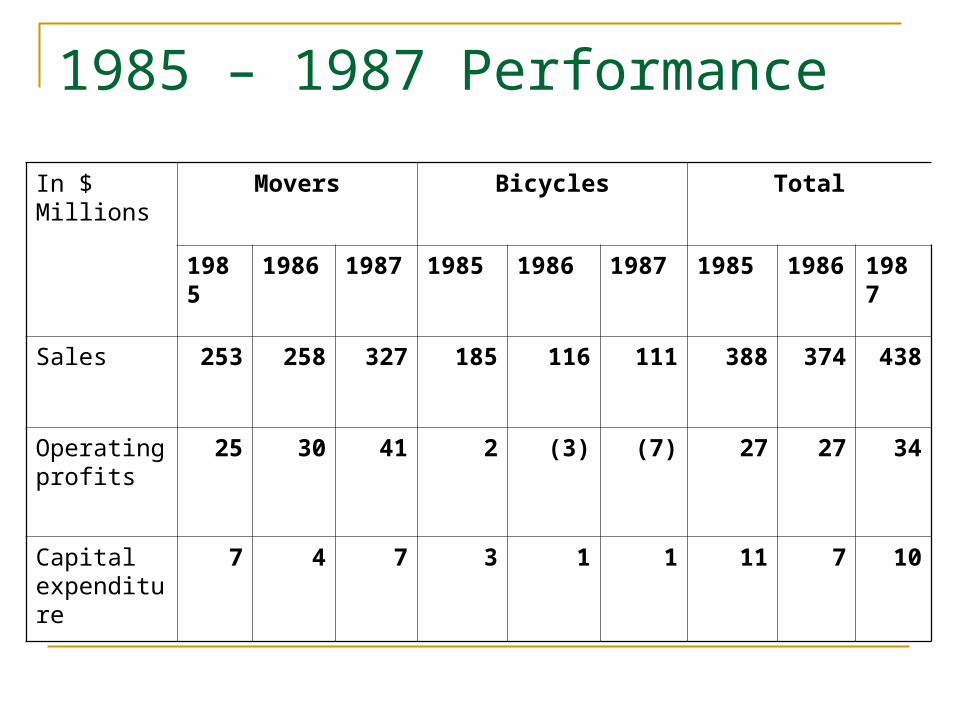
1985 – 1987 Performance
In $ Millions Movers Bicycles Total
1985 1986 1987 1985 1986 1987 1985 1986 1987
Sales 253 258 327 185 116 111 388 374 438
Operating profits
25 30 41 2 (3) (7) 27 27 34
Capital expenditure
7 4 7 3 1 1 11 7 10
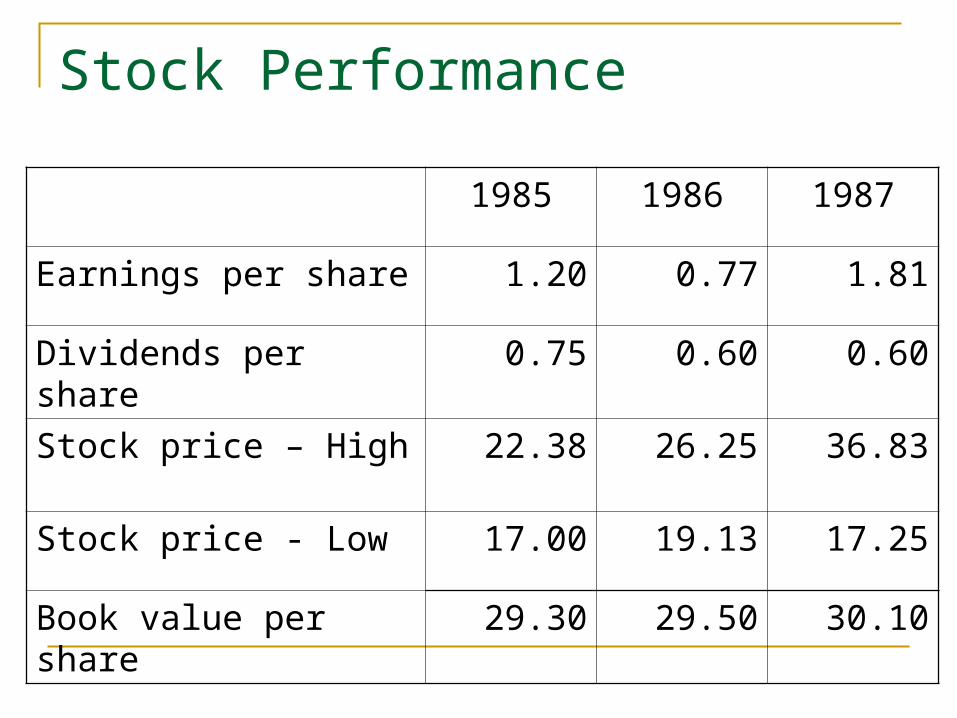
Stock Performance
1985 1986 1987
Earnings per share 1.20 0.77 1.81
Dividends per share 0.75 0.60 0.60
Stock price – High 22.38 26.25 36.83
Stock price - Low 17.00 19.13 17.25
Book value per share 29.30 29.50 30.10

QUESTION?