The multiple time scales of sleep dynamics as a challenge...
18
Phil. Trans. R. Soc. A (2011) 369, 3884–3901 doi:10.1098/rsta.2011.0082 The multiple time scales of sleep dynamics as a challenge for modelling the sleeping brain BY ECKEHARD OLBRICH 1, *, JENS CHRISTIAN CLAUSSEN 2 AND PETER ACHERMANN 3 1 Max Planck Institute for Mathematics in the Sciences, Inselstraße 22, 04103 Leipzig, Germany 2 Institute for Neuro- and Bioinformatics, University of Lübeck, Ratzeburger Allee 160, 23562 Lübeck, Germany 3 Institute of Pharmacology and Toxicology, University of Zurich, Winterthurerstrasse 190, 8057 Zurich, Switzerland A particular property of the sleeping brain is that it exhibits dynamics on very different time scales ranging from the typical sleep oscillations such as sleep spindles and slow waves that can be observed in electroencephalogram (EEG) segments of several seconds duration over the transitions between the different sleep stages on a time scale of minutes to the dynamical processes involved in sleep regulation with typical time constants in the range of hours. There is an increasing body of work on mathematical and computational models addressing these different dynamics, however, usually considering only processes on a single time scale. In this paper, we review and present a new analysis of the dynamics of human sleep EEG at the different time scales and relate the findings to recent modelling efforts pointing out both the achievements and remaining challenges. Keywords: sleep oscillations; sleep stages; sleep regulation 1. Introduction Sleep is a reversible, periodical state of quiescence and altered consciousness that is more than the absence of being awake—it is an active state that is regulated. The sleeping brain may be considered as a complex dynamical system that is largely independent of external stimulation. Despite the scarcity of external input it shows a rich repertoire of internally generated dynamic patterns and transitions between states. The brain oscillations observed during sleep are complex and span multiple time and spatial scales. Typical changes in the pattern of the electroencephalogram (EEG) serve to discriminate sleep and waking. A first, coarse partitioning is the distinction between wakefulness, rapid eye movement (REM) sleep and non-REM (NREM) sleep. Sleep appears to be a global phenomenon. Nevertheless, distinct brain regions (cortical and subcortical) are involved in its generation and regulation. For a recent review of important brain structures and neurotransmitter systems relevant for sleep, see Mignot [1]. *Author for correspondence ([email protected]). One contribution of 11 to a Theme Issue ‘The complexity of sleep’. This journal is © 2011 The Royal Society 3884 on June 14, 2018 http://rsta.royalsocietypublishing.org/ Downloaded from
Transcript of The multiple time scales of sleep dynamics as a challenge...
Phil. Trans. R. Soc. A (2011) 369, 3884–3901doi:10.1098/rsta.2011.0082
The multiple time scales of sleep dynamics as achallenge for modelling the sleeping brain
BY ECKEHARD OLBRICH1,*, JENS CHRISTIAN CLAUSSEN2
AND PETER ACHERMANN3
1Max Planck Institute for Mathematics in the Sciences, Inselstraße 22,04103 Leipzig, Germany
2Institute for Neuro- and Bioinformatics, University of Lübeck, RatzeburgerAllee 160, 23562 Lübeck, Germany
3Institute of Pharmacology and Toxicology, University of Zurich,Winterthurerstrasse 190, 8057 Zurich, Switzerland
A particular property of the sleeping brain is that it exhibits dynamics on very differenttime scales ranging from the typical sleep oscillations such as sleep spindles and slowwaves that can be observed in electroencephalogram (EEG) segments of several secondsduration over the transitions between the different sleep stages on a time scale of minutesto the dynamical processes involved in sleep regulation with typical time constants in therange of hours. There is an increasing body of work on mathematical and computationalmodels addressing these different dynamics, however, usually considering only processeson a single time scale. In this paper, we review and present a new analysis of the dynamicsof human sleep EEG at the different time scales and relate the findings to recent modellingefforts pointing out both the achievements and remaining challenges.
Keywords: sleep oscillations; sleep stages; sleep regulation
1. Introduction
Sleep is a reversible, periodical state of quiescence and altered consciousness thatis more than the absence of being awake—it is an active state that is regulated.The sleeping brain may be considered as a complex dynamical system that islargely independent of external stimulation. Despite the scarcity of external inputit shows a rich repertoire of internally generated dynamic patterns and transitionsbetween states. The brain oscillations observed during sleep are complex andspan multiple time and spatial scales. Typical changes in the pattern of theelectroencephalogram (EEG) serve to discriminate sleep and waking. A first,coarse partitioning is the distinction between wakefulness, rapid eye movement(REM) sleep and non-REM (NREM) sleep.
Sleep appears to be a global phenomenon. Nevertheless, distinct brain regions(cortical and subcortical) are involved in its generation and regulation. Fora recent review of important brain structures and neurotransmitter systemsrelevant for sleep, see Mignot [1].*Author for correspondence ([email protected]).
One contribution of 11 to a Theme Issue ‘The complexity of sleep’.
This journal is © 2011 The Royal Society3884
on June 14, 2018http://rsta.royalsocietypublishing.org/Downloaded from

Multiple time scales of sleep dynamics 3885
275.05 275.10 275.15 275.20 275.25 275.30−100
0
100E
EG
(μV
)f (
Hz)
275.00 275.05 275.10 275.15 275.20 275.25 275.300
10
20
f (H
z)
0 50 100 150 200 250 300 350 400 450
510152025
0 50 100 150 200 250 300 350 400 4504321
REMW
MT
t (min)
(a)
(b)
(c)
(d )
Figure 1. (a) 20 s epoch of EEG data (derivation C3A2) of stage 2 sleep. (b) Colour-codedspectrogram estimated using AR(8) models on overlapping 1 s segments (warmer colours denotehigher power). (c) Spectrogram of the whole night estimated using AR(16) models on non-overlapping 20 s epochs. The black bar denotes the 20 s epoch illustrated in (a,b). (d) Hypnogram:MT, movement time; W, waking; REM, REM sleep; 1–4, NREM sleep stages 1–4.
Table 1. Different time scales of sleep dynamics.
≈ 24 h circadian rhythms and sleep homeostasis≈ 90–100 min ultradian process, cyclic alternation between NREM and REM sleepseconds to minutes transitions between sleep stagesseconds temporal organization of sleep oscillations, e.g. periodic occurrence of
sleep spindles (4 s), cyclic alternating patterns (CAPs)� 1 s slow oscillations, cyclic alteration between ‘up’ (high firing rate) and
‘down’ (no firing) states0.05–1 s (1–20 Hz) typical sleep oscillations: delta oscillations, sleep spindles, alpha and
theta oscillations
Models of the sleeping brain and its dynamics address processes at differentlevels from the microscopic (cellular) level to the macroscopic (systemic) level andat different time scales from the millisecond or second range up to hours or days.
Phil. Trans. R. Soc. A (2011)
on June 14, 2018http://rsta.royalsocietypublishing.org/Downloaded from
3886 E. Olbrich et al.
A compact overview on current models is provided by Achermann & Borbély[2]. So far, no model covers all the various aspects. The actual challenge formodelling is to come up with models that integrate the processes on the differenttime scales.
In this paper, we will focus on the particular problem that the sleepingbrain exhibits dynamics on very different time scales ranging from themillisecond (channel opening and closing) to hours or days (sleep–wakebehaviour). A rough overview of the time scales considered in this paper isprovided in table 1. On a time scale of hours to days the transitions betweensleep and waking are determined by the interaction of a circadian process(endogenous clock) and homeostatically regulated sleep pressure S [2]. Onan even longer time scale of months and years sleep–wake patterns undergodevelopmental changes: e.g. from polyphasic sleep–wake patterns in babies toconsolidated single sleep episodes in adults to napping behaviour in elderlypeople.
An additional ultradian process controls the cyclic alternation between NREMand REM sleep with a typical ‘period’ between 90 and 100 min. NREM sleepcan be further differentiated into light and deep sleep that are usually scored on20–30 s epochs [3,4].
A typical feature of the sleeping brain, most pronounced in deep sleep, is theso-called ‘slow oscillation’. The slow oscillation reflects slow membrane potentialfluctuations of cortical neurons, which alternate between depolarized up-states(neuronal activity) and hyperpolarized down-states (neuronal silence) on a timescale between 0.5 and 2 s. It gives rise to the slow waves observed in deep sleep andK-complexes in light sleep [5,6]. Other typical sleep oscillations exhibit frequenciesbetween 2 and 20 Hz such as sleep spindles with a frequency of 11–16 Hz. At anintermediate time scale between the occurrence of sleep oscillations and sleepstage transitions some authors have proposed an additional process leading toan alternation between phasic and tonic activity, the so-called cyclic alternatingpattern (CAP) [7].
The different time scales are not independent. Sleep stages, for instance,are defined with respect to the occurrence of certain oscillatory patterns [3,4],like slow waves for the definition of NREM sleep stages 3 and 4 or N3. Thus,stage changes are intimately linked with changes in oscillatory activity. Figure 1illustrates fluctuations of EEG power spectra with a temporal resolution ofseconds related to the occurrence of the sleep spindles and changes of EEG powerspectra with a resolution of 20 s reflecting transitions between sleep stages and inparticular between NREM and REM sleep.
In the following, we will review the dynamics on the different time scales andtheir interaction in more detail and will present new analyses. Baseline data(sleep from 23.00 to 07.00 h) of a selective REM sleep deprivation study [8] wereanalysed. Eight healthy young men participated in the study, which consistedof two sessions of nine consecutive nights. In each session, an adaptation nightwas followed by two baseline nights and six experimental nights. The two sessionswere 28 days apart, except for one subject with only 23 days between the sessions.Prior to baseline nights, subjects were engaged in their usual daily activitiesand were not allowed to nap which was verified by actigraphic recordings. TheEEG derivation C3A2 was analysed (sampling rate 128 Hz) and sleep stages werevisually scored according to standard criteria [3].
Phil. Trans. R. Soc. A (2011)
on June 14, 2018http://rsta.royalsocietypublishing.org/Downloaded from

Multiple time scales of sleep dynamics 3887
2. Sleep oscillations
Oscillatory activity in the EEG is considered to be an emergent property ofthe thalamocortical system with the specific patterns and dominant frequenciesof these activities depending on the functional state of the brain [9]. Duringsleep this oscillatory activity can be roughly divided into delta (0.5–4.5 Hz), theta(4.5–8 Hz) and alpha oscillations (8–11 Hz) and sleep spindles (11–16 Hz). Not allof the typical patterns in human sleep EEG are complete oscillations becausethey may consist only of single half waves. Examples are ‘vertex sharp waves’,K-complexes or the so-called ‘slow oscillation’. Nevertheless, these eventscontribute essentially to power in the delta frequency range. However, during fullblown deep sleep, slow oscillations may become an almost continuous oscillation.The occurrence of these oscillatory patterns is used to distinguish between thedifferent sleep stages. A usual way to detect these oscillatory patterns in theEEG was, and to some extent still is the visual inspection of the data. The moststraightforward way to detect events automatically is to apply band pass filtersto the EEG according to the aforementioned frequency bands and then use athreshold criterion regarding the amplitude (e.g. through a Hilbert transform) ofthe activity to detect the corresponding oscillatory activity. The disadvantage ofsuch an approach is that the frequency bands and thus also the correspondingoscillations have to be defined in advance and therefore it is difficult to deal withindividual differences or temporal changes of frequencies.
An alternative approach that does not rely on predefined frequency bands wasproposed by Olbrich & Achermann [10] and is based on autoregressive (AR)modelling of short (1 s) overlapping EEG segments. The AR(p) model
x(tn) =p∑
i=1
aix(tn−i) + e(tn) (2.1)
linearly predicts x(tn) based on previous measurements with e(tn) denoting theresidual errors. Frequencies fk = fk/(2pDt) and damping coefficients gk = 1/tk =−Dt−1 ln rk , where Dt = tn − tn−1 denotes the sampling interval, are estimatedfrom the poles zk of the AR model which correspond to the eigenmodes of theestimated linear system:
zp −p∑
k=1
akzp−k =p∏
k=1
(z − zk) zk = rkeifk . (2.2)
The order p of the model determines the maximum number of poles zk . An ARmodel of order 8 (AR(8) model) was applied and thus the EEG was modelledas a superposition of maximal four stochastically driven harmonic oscillatorswith damping and frequency varying in time. Oscillatory events were detectedwhenever the damping constant at one or more frequencies was below a predefinedthreshold. A detailed description of the algorithm and its application to humansleep EEG data is provided in Olbrich & Achermann [10]. Figure 2a showsall the detected events in a baseline night as black dots superimposed on thespectrogram. The frequency distribution of the events in figure 2b demonstratesthat the events were mainly grouped in three distinct frequency bands, the delta,alpha and spindle bands.
Phil. Trans. R. Soc. A (2011)
on June 14, 2018http://rsta.royalsocietypublishing.org/Downloaded from

3888 E. Olbrich et al.
f (H
z)
0
5
10
15
20
0 50 100 150 200 250 300 350 400 4504321
REMW
MT
t (min)
0 100 200number of events
(a)
(c)
(b)
Figure 2. (a) Spectrogram and superimposed oscillatory events (black dots) of a baseline night.(b) Distribution of event frequencies. (c) Hypnogram (for further details, see figure 1).
A known mechanism responsible for the generation of oscillations in modelsof neural systems is the interaction between two populations of excitatory andinhibitory neurons, first studied by Wilson & Cowan [11] and later proposed asa model for the generation of alpha oscillations by Lopes da Silva et al. [12]. Forstrong enough excitatory–excitatory and excitatory–inhibitory couplings thesemodels exhibit a Hopf bifurcation related to oscillatory activity. Neural fieldmodels (NFMs) such as the one of Robinson et al. [13] describe sleep oscillationssuch as sleep spindles and delta oscillations as resonances near Hopf bifurcations.NFMs are often analysed in the form of ordinary differential equations drivenby white noise. If one considers the stationary (fixed point) solution of thedeterministic part, the effect of small perturbations can be studied by consideringa linear approximation of the model around this fixed point, leading to a structurethat can be mapped to a linear time series model. If the Hopf bifurcation isapproached the damping of the corresponding resonance decreases and reacheszero at the bifurcation. The closer the state of the system is to the bifurcation,the more pronounced the resulting oscillation in the EEG. Applying the abovedescribed algorithm to detect oscillatory events to a simple model system ofcoupled excitatory and inhibitory neurons revealed that it is possible to detectchanges of the eigenmodes of the network resulting from slow parameter changesof the network [14].
(a) Sleep spindles
One prominent sleep oscillation in humans is the sleep spindle. Human sleepspindles are oscillations in the frequency range between 11 and 16 Hz, ideallywith a waxing and waning amplitude which resulted in the term ‘spindle’. Theirhighest incidence is during stage 2 sleep. The occurrence of sleep spindles is one
Phil. Trans. R. Soc. A (2011)
on June 14, 2018http://rsta.royalsocietypublishing.org/Downloaded from

Multiple time scales of sleep dynamics 3889
of the defining features of NREM sleep stage 2 according to Rechtschaffen &Kales [3] and Iber et al. [4]. The spindle density increases in the course of a night[10,15]. This temporal evolution is, in part, owing to a circadian modulation ofspindle characteristics [16]. Slow and fast spindles are often distinguished withslow spindles having frequencies between 11 and 12 Hz and fast ones between 12and 16 Hz, typically resulting in two corresponding peaks in the power spectrum ofthe EEG [17]. Not all subjects, however, show dual peaks in the power spectrumbetween 11 and 16 Hz. Moreover, the spindle frequencies vary across the nightas a function of sleep depth; they are slower in deep sleep [10] and show largeinter-individual differences [17] (see also §4a). Sleep spindles are generated in thethalamus by the interaction between thalamic reticular inhibitory neurons andexcitatory cortico-thalamic neurons that project to the cortex [18].
(b) Non-rapid eye movement sleep alpha
In the older literature [19], a third type of sleep spindle was described withan even lower frequency (10 Hz). In the more recent literature, this oscillatoryactivity is denoted as alpha activity because its frequency is in the range of alphaactivity observed in awake subjects resting with closed eyes. In the following,we use the term NREM sleep alpha in order to distinguish the alpha activityduring sleep from waking. In a large study comprising 260 subjects only 15 percent showed clear NREM sleep alpha activity [20]. It is also referred to as alpha–delta pattern [21]. This alpha–delta pattern occurred mostly in the first half of thenight with its highest incidence during deep sleep [10]. This activity should not beconfused with isolated alpha oscillations that are considered as arousal response[20]. Furthermore, NREM sleep alpha activity shows a homeostatic response, i.e.it is increased after sleep deprivation [22]. In the all-night spectrogram in figure 1and in the events of figure 2 this activity is evident in the first two NREM sleepepisodes with a frequency slightly larger than 10 Hz. This is in contrast withawake alpha activity, seen at the beginning of the recording and approximately420 min into the recording, which is below 10 Hz.
(c) Slow waves, slow and delta oscillations and K-complexes
Slow waves represent one of the most salient features of the EEG during NREMsleep and reflect sleep intensity. They encompass the frequency range of 0.5–4.5 Hzand were commonly subdivided into slow oscillations (<1 Hz) and delta activity(1–4.5 Hz). Furthermore, K-complexes, a hallmark of stage 2 sleep, contribute tothe activity observed in the delta range.
Slow oscillations in the NREM sleep EEG result from slow membrane potentialfluctuations of cortical neurons, which alternate between depolarized up-states(neuronal activity) and hyperpolarized down-states (neuronal silence). They werefirst described in the thalamocortical system of anaesthetized cats [23,24] andlater in humans [5,25]. Slow oscillations are generally thought to originate fromcortical networks. However, Crunelli & Hughes [26] argued that slow oscillationswere emergent properties of cortico-thalamocortical networks, in particular,resulting from a dynamic interplay of cortical, thalamocortical and reticularoscillators [27]. Bazhenov et al. [28] demonstrated that non-homogeneity inextracellular media in a network model may contribute to the generation of slowoscillations.
Phil. Trans. R. Soc. A (2011)
on June 14, 2018http://rsta.royalsocietypublishing.org/Downloaded from
3890 E. Olbrich et al.
There is no physiological evidence to draw a sharp border at 1.0 Hz. However,power in the low delta range only partially showed homeostatic behaviour. Inparticular, power less than 2 Hz does not decline from the first to the secondNREM sleep episode [25,29] and was not increased after sleep deprivation [22].These observations raised the question as to whether slow oscillations are essentialfor sleep homeostasis.
During sleep stages in which slow waves are predominant, and in the first twoNREM sleep episodes, power density spectra showed a peak at 0.7–0.8 Hz [25]indicative of slow oscillations. Negative half-waves predominantly seem to reflectdown states [30]. Increased sleep pressure resulted in a redistribution of half-waves between 0.5 and 2 Hz: the number of half-waves per minute was reducedbelow 0.9 Hz while they were increased above 1.2 Hz. EEG power was increasedabove 1 Hz only [31]. These findings indicate that slow oscillations contribute tosleep homeostasis and may explain the missing homeostatic response in the powerspectrum less than 2 Hz.
Next to slow oscillations, faster delta oscillations (1–4.5 Hz) are observed inthe EEG. Their origin is unclear and they may originate in the cortex and in thethalamus [2,32]. In particular, the cortical components are not yet understood.With respect to the functional role of slow oscillations and faster delta activityno clear distinction between these two activities is made in the literature.
Also the contribution of K-complexes is an important issue that needs to betaken into account. They represent a salient feature of stage 2 sleep with a waveform similar to the slow waves that occur during slow wave sleep. They may bothbe generated by similar physiological mechanisms [5,33] with the K-complexesbeing the precursors of slow waves [6].
3. The temporal organization of sleep oscillations
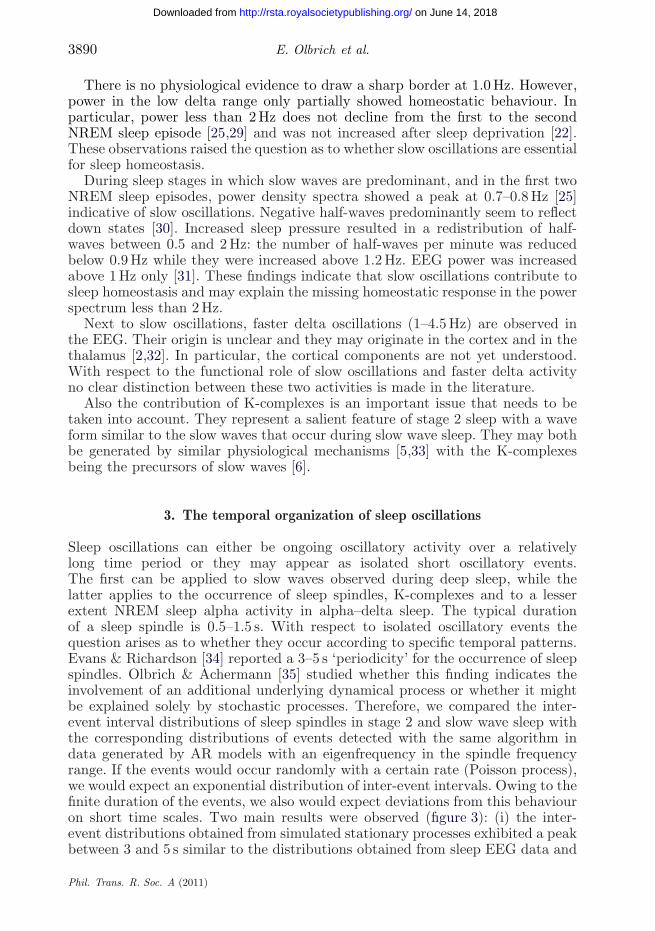
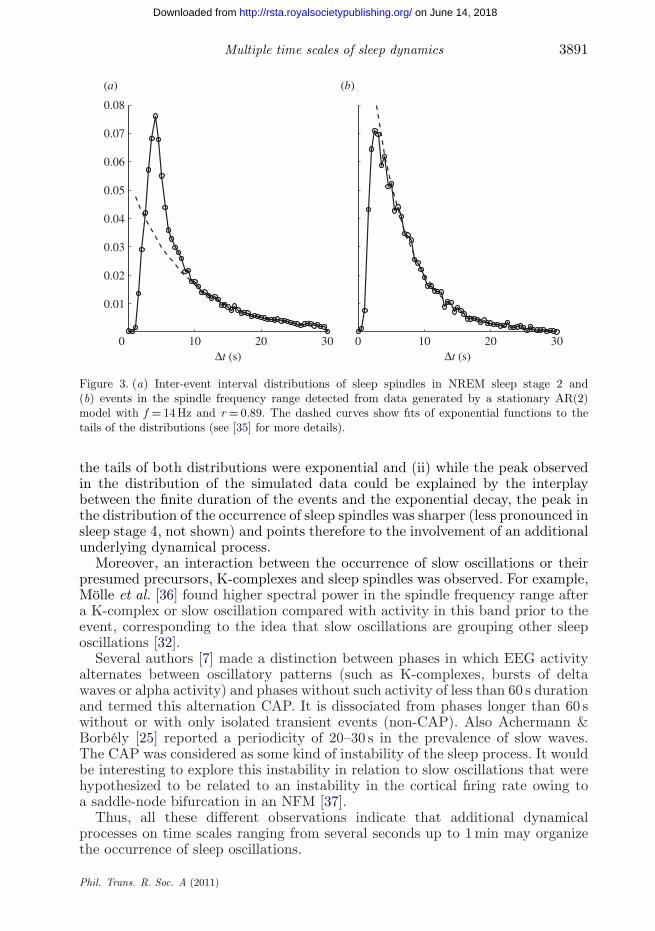
Sleep oscillations can either be ongoing oscillatory activity over a relativelylong time period or they may appear as isolated short oscillatory events.The first can be applied to slow waves observed during deep sleep, while thelatter applies to the occurrence of sleep spindles, K-complexes and to a lesserextent NREM sleep alpha activity in alpha–delta sleep. The typical durationof a sleep spindle is 0.5–1.5 s. With respect to isolated oscillatory events thequestion arises as to whether they occur according to specific temporal patterns.Evans & Richardson [34] reported a 3–5 s ‘periodicity’ for the occurrence of sleepspindles. Olbrich & Achermann [35] studied whether this finding indicates theinvolvement of an additional underlying dynamical process or whether it mightbe explained solely by stochastic processes. Therefore, we compared the inter-event interval distributions of sleep spindles in stage 2 and slow wave sleep withthe corresponding distributions of events detected with the same algorithm indata generated by AR models with an eigenfrequency in the spindle frequencyrange. If the events would occur randomly with a certain rate (Poisson process),we would expect an exponential distribution of inter-event intervals. Owing to thefinite duration of the events, we also would expect deviations from this behaviouron short time scales. Two main results were observed (figure 3): (i) the inter-event distributions obtained from simulated stationary processes exhibited a peakbetween 3 and 5 s similar to the distributions obtained from sleep EEG data and
Phil. Trans. R. Soc. A (2011)
on June 14, 2018http://rsta.royalsocietypublishing.org/Downloaded from
Multiple time scales of sleep dynamics 3891
0 10 20 30Δt (s)
10 20 300
0.01
0.02
0.03
0.04
0.05
0.06
0.07
0.08
Δt (s)
(a) (b)
Figure 3. (a) Inter-event interval distributions of sleep spindles in NREM sleep stage 2 and(b) events in the spindle frequency range detected from data generated by a stationary AR(2)model with f = 14 Hz and r = 0.89. The dashed curves show fits of exponential functions to thetails of the distributions (see [35] for more details).
the tails of both distributions were exponential and (ii) while the peak observedin the distribution of the simulated data could be explained by the interplaybetween the finite duration of the events and the exponential decay, the peak inthe distribution of the occurrence of sleep spindles was sharper (less pronounced insleep stage 4, not shown) and points therefore to the involvement of an additionalunderlying dynamical process.
Moreover, an interaction between the occurrence of slow oscillations or theirpresumed precursors, K-complexes and sleep spindles was observed. For example,Mölle et al. [36] found higher spectral power in the spindle frequency range aftera K-complex or slow oscillation compared with activity in this band prior to theevent, corresponding to the idea that slow oscillations are grouping other sleeposcillations [32].
Several authors [7] made a distinction between phases in which EEG activityalternates between oscillatory patterns (such as K-complexes, bursts of deltawaves or alpha activity) and phases without such activity of less than 60 s durationand termed this alternation CAP. It is dissociated from phases longer than 60 swithout or with only isolated transient events (non-CAP). Also Achermann &Borbély [25] reported a periodicity of 20–30 s in the prevalence of slow waves.The CAP was considered as some kind of instability of the sleep process. It wouldbe interesting to explore this instability in relation to slow oscillations that werehypothesized to be related to an instability in the cortical firing rate owing toa saddle-node bifurcation in an NFM [37].
Thus, all these different observations indicate that additional dynamicalprocesses on time scales ranging from several seconds up to 1 min may organizethe occurrence of sleep oscillations.
Phil. Trans. R. Soc. A (2011)
on June 14, 2018http://rsta.royalsocietypublishing.org/Downloaded from

3892 E. Olbrich et al.
4. Sleep stages and sleep stage transitions
In §2, we argued that the EEG activity on short time scales of less than 1 scan be parametrized using linear models and that these models also describemost sleep oscillations, with the exception perhaps of slow oscillations. Theparameters of these linear models can be interpreted as frequencies and dampingsof stochastically driven oscillators. These oscillators can be related to sleeposcillations on the one hand and to resonances of the underlying neural fields onthe other hand. The dynamics on the slower time scales therefore corresponds totime dependent changes of these frequencies and dampings. The 4 s ‘periodicity’of the sleep spindle occurrence, for instance, could be related to a correspondingmodulation of the damping of the spindle oscillator. Although conceptuallyappealing there is a problem with this approach: the activity of all oscillatorsmay not be visible concurrently. Distinguishing fast and slow sleep spindles, alphaoscillations, fast and slow delta oscillations and probably also theta oscillationswould require one to assume at least six oscillators, which are usually not all visi-ble at the same time. Therefore, a linear model fitted to a short segment of EEGwill reveal only one or two of these oscillators, while the properties of the otheroscillators cannot be determined from the fitted model. Therefore, the dampingsand frequencies of the ‘sleep oscillators’ are practically not useful as features tostudy their dynamics on slower time scales. An alternative that contains basicallythe same information as the parameters of the linear models but provides easyto use feature vectors is the power spectrum estimated on short segments.
In order to study correlations between neighbouring frequency bins, weperformed principal component analysis (PCA; see also [38] for a relatedapproach).
(a) Principal component analysis
PCA applied to the logarithm of power density spectra during a night is asystematic way to explore the all-night dynamics in the sleep EEG including thesleep stage transitions. In particular, it provides a first estimation of the dimensionof the state space needed to describe the slow dynamics by asking how manyprincipal components are necessary to explain, for instance, a certain fraction ofthe variance of the signal. As feature vectors we used the logarithm of the powerdensity spectra between 0.25 and 64 Hz estimated on non-overlapping 4 or 20 sepochs, respectively, with a 0.25 Hz resolution. Figure 4a(i) shows the variances ofthe first 30 principal components. There were two dominant components and threeor four additional components for the 4 or 20 s epochs, respectively, until variancechanges in a gradual manner. Thus, one could conclude that the space spannedby these spectral feature vectors contains at most six meaningful dimensions.Although the other principal components contain still an important part ofthe total variance, this variance is almost frequency independent (figure 4a(ii)),and therefore, these components might be considered as representing mainlybackground noise.
The principal components are characterized by their ‘loadings’ and ‘scores’.The ‘loadings’ show to what extent the single frequency bins contribute to oneparticular component and the time-dependent ‘scores’ show how much a singlecomponent contributes to the power spectrum at the different time points.
Phil. Trans. R. Soc. A (2011)
on June 14, 2018http://rsta.royalsocietypublishing.org/Downloaded from

Multiple time scales of sleep dynamics 3893
10 20 300
10
1
102
103(a)
(b)
(i)
(ii)
(iii)
(iv)
(v)
component
vari
ance
0 10 20 301.0
1.5
2.0
2.5
3.0
3.5
f (Hz)
vari
ance
0 50
0
0.05
0.10
f (Hz)
0 200 400−50
0
50
100
0 50
0
0.1
0.2
f (Hz)
0 200 400−20
0
20
0 50−0.2
0
0.2
f (Hz)
0 200 400−20
0
20
0 200 4004321
REMW
MT
t (min)0 200 400
t (min)0 200 400
t (min)
−0.10
0.10.20.3 VP05 VP08 VP11 VP13
0 10 20−0.1
00.10.20.3 VP15
f (Hz)0 10 20
VP16
f (Hz)0 10 20
f (Hz)
VP18
0 10 20f (Hz)
VP20
Figure 4. (a) PCA applied to power density spectra estimated with a 0.25 Hz resolution on 4 s(blue) and 20 s (red) epochs, respectively of a baseline night (subject VP05). (i) Variances ofthe first 30 principal components. (ii) Frequency resolved variances of all components (solid) andwithout the first six components (dashed-dotted). Loadings (iii) and scores (iv) of the first threeprincipal components with the largest variance. Black curves: moving average of the scores over4 min. (v) Hypnogram based on 20 s epochs (see figure 1 for details). (b) Loadings of the secondlargest principal component in eight subjects. Each panel illustrates superimposed the loadingsdetermined in four baseline nights of each subject.
We found no qualitative difference between the results of the analysis basedon 4 and 20 s epochs, except for larger fluctuations observed in the scores ofthe first three principal components for the 4 s epochs (figure 4). The loadingsof the first principal component are more than 0.05 for frequencies f > 20 Hz,except the 50 Hz line frequency. The scores indicate that this first componentreflects mainly artefacts and possibly arousals, which may be useful for automated
Phil. Trans. R. Soc. A (2011)
on June 14, 2018http://rsta.royalsocietypublishing.org/Downloaded from

3894 E. Olbrich et al.
artefact identification and removal. The second principal component showedhighest correlations both with sleep stages and with slow-wave activity (SWA).Interestingly, both spindle and delta power entered with the same sign into thisloading. This means that this component reflects positively correlated changesin these two frequency bands. By contrast, the third component represents anti-correlated changes between spindle and delta power, as indicated by its loading.
The loadings were relatively stable over different nights of a single person,but differed between persons as illustrated for the second principal component infigure 4b. This result was not unexpected because average power spectra showedtrait-like features [39] as do the histograms of the oscillatory events [10].
The black lines in figure 4a(iv) represent moving averages with a slidingwindow 4 min in duration. The fluctuations around this average represent, atleast partially, the processes described in §3. They also illustrate the difficulty inusing spectral band power directly as a feature for sleep stage classification. Inorder to overcome this difficulty, a better understanding of the dynamics on theseintermediate time scales is necessary. One needs to keep in mind, however, thatsleep stages are not defined solely on the basis of the EEG.
(b) Sleep stages and sleep states
Typical changes in the pattern of the EEG in conjunction with eye movements(EOG) and muscle tone (EMG) serve to discriminate sleep and waking. Meanamplitudes of the EEG, EOG and EMG (high pass filter at approx. 10 Hz) can bedetermined based on the standard deviation (s.d.) of the signals of consecutive 20or 30 s epochs (scoring epoch; mean amplitude = √
2 s.d.). The ratio of EOG/EEGprovides a simple measure for the occurrence of eye movements. High values ofthe EOG/EEG ratio, in combination with low EMG amplitude, are typical forREM sleep episodes. High values of the ratio are also caused by eye movementsduring waking [40].
Standard rules for scoring the vigilance states in humans were established in1968 by Rechtschaffen & Kales [3] and recently revised by Iber et al. [4]. Theserules define sleep on fixed epoch lengths (20 or 30 s [3]; 30 s [4]). Classically, threebasic vigilance states—waking, NREM sleep and REM sleep—are dissociated.NREM sleep is further subdivided into stages 1–4 [3] or N1–N3 [4], with stages3 and 4 or N3 considered as slow-wave sleep or deep sleep. REM sleep exhibitsREMs, which occur phasically under the closed eyelids in conjunction with aloss of muscle tone. Furthermore, autonomic nervous activity shows increasedvariations during REM sleep that are manifested by fluctuations in heart rate,blood pressure and respiration, as well as by penile erections.
Conventional sleep scoring, however, is inadequate for a quantitative EEGanalysis, because the sleep stages are based on rather general and arbitrarycriteria and do not reflect gradual changes occurring on a finer time scale. EEGvariables are increasingly assessed by computer-aided methods of signal analysis(e.g. spectrogram shown in figure 1, spectral power in specific frequency bands,detection of oscillatory events and PCA).
This raises the question of whether the changes occurring during sleep shouldbe modelled as gradual changes or whether a distinction between ‘macro’ and‘micro’ states is needed. The classical hypnogram (figure 1) might reflect themacro structure while the occurrence of spindles, arousals, etc., could reflect the
Phil. Trans. R. Soc. A (2011)
on June 14, 2018http://rsta.royalsocietypublishing.org/Downloaded from

Multiple time scales of sleep dynamics 3895
micro structure. Obviously, the transition from wakefulness to sleep and viceversa, and the transitions between NREM and REM sleep are state changes.Saper and co-workers [41,42] have proposed a ‘putative flipflop’ for wake–sleep aswell as for NREM–REM sleep transitions (see also [43]).
(c) Micro-architecture of sleep
Sleep regulation ensures that sleep states are self-sustained at a time scaleof minutes to hours. Nevertheless, deviations in both directions may occur.During wakefulness, consciousness may be lost for a few seconds, as microsleepevents occur with increasing sleep pressure resulting in a significant risk foraccidents [44]. On the other hand, sleep may be disrupted by short intervalsof electrophysiologically identified wakefulness.
Traditionally, sleep interruptions are quantified by the total or average sleepfragmentation, defined as the cumulative duration of interruptions, normalizedby the total length of the investigated time interval. Awakenings occur morefrequently towards the end of a night [45]. In such an analysis, however, few longinterruptions result in the same percentage of sleep fragmentation as frequentshort interruptions, but have quite a different impact on sleep quality andrecovery. This shortcoming can be overcome by looking at the distributionstatistics of the duration of sleep and wake bouts. Such distributions were recentlyinvestigated in humans [46] and in mice, rats and cats [47]. These studies reportedin all four species two different distributions for sleep and wake bouts. Sleep boutsfollowed an exponential decay as a function of bout duration, whereas wake boutsby contrast showed a power-law decay over two decades. Lo et al. [46] proposeda phenomenological diffusion model in which the sleep stage range was bounded,and the wake stage range was unbounded with a restoring force correspondingto a logarithmic potential. Apart from the case of a vanishing force (resulting ina power-law distribution with exponent 1/2) this is the only choice of force thatgenerated a power law in this class of diffusion models.
Lo et al. reported a decay exponent of 2.3 for the power-law decay of wakedurations in humans [46,47] and similar values for other mammals. A powerlaw implies the absence of a characteristic time scale. While the sleep boutdistribution (in humans) showed an exponential decay of about 22 min (basedon 30 s scoring epochs), such a time scale was absent in the distribution of wakebout duration.
In our own dataset scored based on 20 s epochs, we observed similar results(figure 5). In total, 1050 wake intervals were observed. We confirm the exponentialdecay of the sleep bout durations and observe a decay (based on 20 s scoringintervals) of 14.5 min. According to Lo et al. [47], the decay is dependent onthe duration of the scoring interval. This dependence is approximately linearfor longer scoring intervals. If we apply the scaling resulting from fig. 3c inLo et al. [47] we arrive at a correction by a factor of 1.5. Thus, our results areconsistent with the 22 min decay reported by Lo et al. [47]. However, one has tokeep in mind that these decay time scales depend not only on scoring intervallength, species and age, but also on the scoring method applied.
As far as the size of our dataset allows one to conclude, the wake distributionswere consistent with a power-law decay with an exponent of −2.83 ± 0.15(corresponding to −1.83 for the cumulative distribution). In a double logarithmic
Phil. Trans. R. Soc. A (2011)
on June 14, 2018http://rsta.royalsocietypublishing.org/Downloaded from

3896 E. Olbrich et al.
1 10 100bout duration/20s
1
10
100
1000cu
mul
ativ
e hi
stog
ram
100 200 300bout duration/20s
(a) (b)
Figure 5. Cumulative histograms of wake (dashed curves, squares) and sleep (solid curves, crosses)bout durations during 8 h of sleep plotted on (a) a double logarithmic and (b) semilogarithmicscale. Data of four nights of eight healthy subjects were pooled.
plot (figure 5a), the wake bout durations were close to a power law, whereasa power law of the sleep bout durations had to be rejected. Similarly, thesemilogarithmic plot (figure 5b) confirmed an exponential decay of sleep boutduration, whereas the wake bout durations did not have an exponential character.How such a pronounced difference between the power-law and exponentialdistribution could be explained with a physiology-based model still remains anopen question.
(d) Age dependence of the wake bout distribution
Lo et al. [46,47] found that the power laws describe wake bout durations ofhealthy adult mammals in four species well. However, deviations are expectedin the case of sleep disorders, under the influence of drugs, and also as afunction of age. An interesting study in developing rats [48] showed a clearage dependence in wake and sleep bout distributions: for both distributions ashift towards longer time intervals was found. The distribution of sleep boutduration remained exponential during the investigated age period, whereas thewake bout distribution was exponential in young rats and exhibited a power-lawdistribution in adult rats [48]. This observation has an important implication formodelling sleep regulation: mechanisms stabilizing wake and sleep states changeas a function of age. Such a stabilization seems absent in newborns. Furtherinvestigations are needed in particular at advanced age where sleep fragmentationis increased.
5. Sleep regulation
Three distinct processes underlie sleep regulation at the systemic (phenomeno-logical) level: (i) a homeostatic process (process S), whose level is a functionof prior sleep and waking; (ii) sleep is also modulated by a circadian process(process C), a clock-like mechanism that is independent of prior sleep and waking;and (iii) an ultradian process occurs within sleep reflected in the cyclic alternationof the two basic sleep states—NREM and REM sleep.
Phil. Trans. R. Soc. A (2011)
on June 14, 2018http://rsta.royalsocietypublishing.org/Downloaded from

Multiple time scales of sleep dynamics 3897
‘Sleep homeostasis’ [2] refers to the sleep–wake dependent aspect of sleepregulation. Homeostatic mechanisms counteract deviations from an average‘reference level’ of sleep. Thus, sleep propensity or sleep pressure is augmentedwhen sleep is curtailed or absent, and reduced in response to excess sleep.
The pioneering studies of Blake & Gerard [49] revealed that both the arousalthreshold and the predominance of slow waves in the EEG are high in the initialpart of sleep and then decrease progressively. The occurrence of slow waves inthe EEG is quantified by SWA (spectral power in the 0.75–4.5 Hz range), oneof the most important functional EEG parameters. Sleep intensity, measured bySWA, is a central part of the concept of sleep homeostasis. The compensationof a sleep deficit occurs mainly by an increase in sleep intensity rather thanby the prolongation of sleep duration owing to constraints of the circadianprocess.
SWA shows a decline in the course of sleep that can be approximated by anexponential decrease across consecutive NREM sleep episodes. The level of SWAat sleep onset increases in a saturating exponential way reflecting the durationof prior wakefulness [50,51]. Thus, the homeostatic process S is modelled withan exponential decline during sleep and a saturating exponential increase duringwakefulness.
Slow components in the sleep EEG are thought to underlie the restorativefunction of sleep. Tononi & Cirelli [52,53] hypothesized that slow oscillations andSWA are reflecting synaptic homeostasis and postulated that synaptic strengthis high at the beginning of the night, owing to plastic processes occurringduring wakefulness and decreases by means of synaptic downscaling during sleep.Simulations with a large-scale model of the thalamo-cortical system [54] revealedthat a decrease in cortical synaptic strength was sufficient to account for thedecline in SWA during sleep [55].
The two-process model [51,56] postulates that the homeostatic process Sinteracts with a circadian process (process C) that is independent of sleep andwaking and is generated in the suprachismatic nuclei. Process S is assumed tovary between an upper and a lower threshold that are both modulated by a singlecircadian process. Simulations with this model accounted for diverse phenomenasuch as recovery from sleep deprivation, circadian phase dependence of sleepduration, sleep during shift work, sleep fragmentation during continuous bed restand internal desynchronization in the absence of time cues [51].
In a later version of the model [57], the change of process S, and not its level,was assumed to be proportional to the momentary level of SWA. The elaboratedmodel addressed not only the global changes of SWA as represented by processS, but also its time course within NREM sleep episodes. However, REM sleepregulation was not addressed and the occurrence of REM sleep episodes wasgoverned by an external process. In general, a close fit was obtained between thesimulated and empirical SWA data and their time course and the occurrence oflate SWA peaks during extended sleep could be simulated. The model was recentlyapplied to simulate sleep in narcoleptic patients [58] and Zavada et al. [59] usedthe model approach to investigate spatial aspects of sleep homeostasis.
Rempe et al. [60] proposed a mathematical model of neuronal substratesunderlying sleep–wake regulation. They included NREM–REM sleep alterationsbased on a previously proposed flip-flop concept [41,42]. Similarly, a modelof the sleep–wake dynamics was proposed by Phillips & Robinson [61] and
Phil. Trans. R. Soc. A (2011)
on June 14, 2018http://rsta.royalsocietypublishing.org/Downloaded from
3898 E. Olbrich et al.
Robinson et al. [43] with emphasis on the ascending arousal system wherecircadian and homeostatic influences were integrated. They did not includethe ultradian alternation of NREM and REM sleep. Postnova et al. [62]proposed a model in which the homeostatic process is determined by theneuropeptide hypocretin/orexin, a co-transmitter of the lateral hypothalamus.Hypocretin/orexin neurons are silent during sleep and active during wakefulness.During wakefulness synaptic efficacy of hypocretin/orexin declines as a resultof the ongoing firing and recovers during sleep. They demonstrated that thesehomeostatic changes can account for typical alterations of sleep–wake transitions.These approaches have a conceptual resemblance to the two-process model. Theirhomeostatic component rises (declines) during waking and declines (increases)during sleep. In these models, the homeostatic component, however, has nolink to neuronal substrates generating slow waves and is thus not relatedto SWA.
Further models with various degrees of complexity have been proposed. Anoverview on current models of sleep mechanisms is provided in Achermann &Borbély [2].
6. Summary and outlook
In this paper, we presented and discussed the dynamics exhibited by the sleepingbrain on different time scales as revealed through time series analysis of the humansleep EEG. Furthermore, we highlighted the challenges of modelling sleep ondifferent time scales. For short time scales (e.g. sleep oscillations) and longer ones(e.g. sleep regulation) there exist satisfactory phenomenological, time series andphysiology-based models which, however, still can be improved. In particular, theconnection between these two time scales needs further elaboration. Furthermore,we raised the question of whether SWA is the correct and only physiologicalmarker for modelling sleep pressure or if other frequency bands also need tobe considered. The loadings of the second largest principal component revealedby the PCA indicate that changes in delta, alpha and partially spindle activitymight reflect the same regulatory process. Moreover, SWA reflects at least twophysiological processes, the slow oscillation (<1 Hz) and fast delta oscillations(1–4.5 Hz), and the relationship between the slow oscillations and SWA is acomplex one, i.e. higher SWA does not necessarily mean more or higher amplitudeslow oscillations [31].
Compared with the time scales of sleep oscillations and sleep regulationmuch less is known about the intermediate time scales with phenomena suchas the ‘spindle periodicity’, the CAP or sleep stage changes. At this time scale,further efforts from both time series analysis and physiological modelling areneeded. Also the cycling alternation between NREM and REM sleep and theoccurrence of short waking episodes (arousals) within a sleep episode deservefurther investigations. The ultimate aim should be to develop a model coveringthe major time scales and being based on a sufficiently detailed biological basis.
We thank Dr Leila Tarokh for comments on the manuscript. The work was supportedby the Swiss National Science Foundation (grant 320030-130766 to P.A.), by the DeutscheForschungsgemeinschaft (DFG) through SFB-654-A8 and Graduate School of Computing inMedicine and Life Science (to J.C.C.).
Phil. Trans. R. Soc. A (2011)
on June 14, 2018http://rsta.royalsocietypublishing.org/Downloaded from

Multiple time scales of sleep dynamics 3899
References
1 Mignot, E. 2008 Why we sleep: the temporal organization of recovery. PLoS Biol. 6, e106.(doi:10.1371/journal.pbio.0060106)
2 Achermann, P. & Borbély, A. A. 2011 Sleep homeostasis and models of sleep regulation. InPrinciples and practice of sleep medicine (ed. M. H. Kryger), 5th edn. Philadelphia, PA: ElsevierSaunders.
3 Rechtschaffen, A. & Kales, A. (eds) 1968 A manual of standardized terminology, techniques andscoring system for sleep stages of human subjects. Washington, DC: Public Health Service, USGovernment Printing Office.
4 Iber, C., Ancoli-Israel, S., Chesson, A. & Quan, S. 2007 The AASM manual for the scoring ofsleep and associated events: rules, terminology and technical specifications, 1st edn. Westchester,NY: American Academy of Sleep Medicine.
5 Amzica, F. & Steriade, M. 1997 The K-complex: its slow (<1 Hz) rhythmicity and relation todelta waves. Neurology 49, 952–959.
6 De Gennaro, L., Ferrara, M. & Bertini, M. 2000 The spontaneous K-complex during stage2 sleep: is it the ‘forerunner’ of delta waves? Neurosci. Lett. 291, 41–43. (doi:10.1016/S0304-3940(00)01366-5)
7 Terzano, M. G. et al. 2001 Atlas, rules, and recording techniques for the scoring of cyclicalternating pattern (CAP) in human sleep. Sleep Med. 2, 537–553. (doi:10.1016/S1389-9457(01)00149-6)
8 Endo, T., Roth, C., Landolt, H.-P., Werth, E., Aeschbach, D., Achermann, P. & Borbély, A. A.1998 Selective REM sleep deprivation in humans: effects on sleep and sleep EEG. Am. J.Physiol. 274, R1186–R1194.
9 Timofeev, I. & Bazhenov, M. 2005 Mechanisms and biological role of thalamocorticaloscillations. In Trends in chronobiology research (ed. F. Colombus), pp. 1–47. Hauppauge, NY:Nova Science Publishers, Inc.
10 Olbrich, E. & Achermann, P. 2005 Analysis of oscillatory patterns in the human sleep EEG usinga novel detection algorithm. J. Sleep Res. 14, 337–346. (doi:10.1111/j.1365-2869.2005.00475.x)
11 Wilson, H. R. & Cowan, J. D. 1972 Excitatory and inhibitory interactions in localizedpopulations of model neurons. Biophys. J. 12, 1–24. (doi:10.1016/S0006-3495(72)86068-5)
12 Lopes da Silva, F. H., Hoeks, A., Smith, A. & Zetterberg, L. 1974 Model of brain rhythmicactivity. Kybernetik 15, 27–37. (doi:10.1007/BF00270757)
13 Robinson, P. A., Rennie, C. J. & Rowe, D. L. 2002 Dynamics of large-scale brain activity innormal arousal states and epileptic seizures. Phys. Rev. E 65, 041924. (doi:10.1103/PhysRevE.65.041924)
14 Olbrich, E. & Wennekers, T. 2007 Dynamics of parameters of neurophysiological models fromphenomenological EEG modeling. Neurocomputing 70, 1848–1852. (doi:10.1016/j.neucom.2006.10.108)
15 Aeschbach, D. & Borbély, A. A. 1993 All-night dynamics of the human sleep EEG. J. SleepRes. 2, 70–81. (doi:10.1111/j.1365-2869.1993.tb00065.x)
16 Wei, H. G., Riel, E., Czeisler, C. A. & Dijk, D. J. 1999 Attenuated amplitude of circadian andsleep-dependent modulation of electroencephalographic sleep spindle characteristics in elderlyhuman subjects. Neurosci. Lett. 260, 29–32. (doi:10.1016/S0304-3940(98)00851-9)
17 Werth, E., Achermann, P., Dijk, D. J. & Borbély, A. A. 1997 Spindle frequency activity inthe sleep EEG: individual differences and topographic distribution. Electroencephalogr. Clin.Neurophysiol. 103, 535–542. (doi:10.1016/S0013-4694(97)00070-9)
18 Steriade, M. 2003 The corticothalamic system in sleep. Front. Biosci. 8, d878–d899.(doi:10.2741/1043)
19 Gibbs, F. A. & Gibbs, E. L. 1950 Atlas of encephalography, vol. 1. Methodology and controls,ch. 8, p. 92. Reading, MA: Addison-Wesley Co., Inc.
20 Scheuler, W., Rappelsberger, P., Pastelak-Price, C., Kubicki, S. & Petsche, H. 1993 Alphaactivity of NREM sleep. In Basic mechanisms of the EEG (eds S. Zschocke & E.-J. Speckmann),pp. 183–214. Boston, MA: Birkhäuser.
Phil. Trans. R. Soc. A (2011)
on June 14, 2018http://rsta.royalsocietypublishing.org/Downloaded from

3900 E. Olbrich et al.
21 Pivik, R. T. & Harman, K. 1995 A reconceptualization of EEG alpha activity as an index ofarousal during sleep: all alpha activity is not equal. J. Sleep Res. 4, 131–137. (doi:10.1111/j.1365-2869.1995.tb00161.x)
22 Borbély, A. A., Baumann, F., Brandeis, D., Strauch, I. & Lehman, D. 1981 Sleep deprivation:effect on sleep stages and EEG power density in man. Electroencephalogr. Clin. Neurophysiol.51, 483–495. (doi:10.1016/0013-4694(81)90225-X)
23 Steriade, M., McCormick, D. A. & Sejnowski, T. J. 1993 Thalamocortical oscillations in thesleeping and aroused brain. Science 262, 679–685. (doi:10.1126/science.8235588)
24 Steriade, M., Nuez, A. & Amzica, F. 1993 A novel slow (<1 Hz) oscillation of neocortical neuronsin vivo: depolarizing and hyperpolarizing components. J. Neurosci. 13, 3252–3265.
25 Achermann, P. & Borbély, A. A. 1997 Low-frequency (< 1 Hz) oscillations in the human sleepelectroencephalogram. Neuroscience 81, 213–222. (doi:10.1016/S0306-4522(97)00186-3)
26 Crunelli, V. & Hughes, S. W. 2010 The slow (< 1 Hz) rhythm of non-REM sleep: a dialoguebetween three cardinal oscillators. Nat. Neurosci. 13, 9–17. (doi:10.1038/nn.2445)
27 Crunelli, V., Errington, A. C., Hughes, S. W. & Tóth, T. I. 2011 The thalamic low-threshold Ca2+ potential: a key determinant of the local and global dynamics of the slow(<1 Hz) sleep oscillation in thalamocortical networks. Phil. Trans. R. Soc. A 369, 3820–3839.(doi:10.1098/rsta.2011.0126)
28 Bazhenov, M., Lonjers, P., Skorheim, S., Bedard, C. & Destexhe, A. 2011 Non-homogeneousextracellular resistivity affects the current-source density profiles of up–down state oscillations.Phil. Trans. R. Soc. A 369, 3802–3819. (doi:10.1098/rsta.2011.0119)
29 Campbell, G. I., Higgins, M. L., Darchia, N. & Feinberg, I. 2006 Homeostatic behaviorof fast Fourier transform power in very low frequency non-rapid eye movement humanelectroencephalogram. Neuroscience 140, 1395–1399. (doi:10.1016/j.neuroscience.2006.03.005)
30 Vyazovskiy, V. V., Olcese, U., Lazimy, Y. M., Faraguna, U., Esser, S. K., Williams, J. C.,Cirelli, C. & Tononi, G. 2009 Cortical firing and sleep homeostasis. Neuron 63, 865–878.(doi:10.1016/j.neuron.2009.08.024)
31 Bersagliere, A. & Achermann, P. 2010 Slow oscillations in human non-rapid eye movementsleep electroencephalogram: effects of increased sleep pressure. J. Sleep Res. 19, 228–237.(doi:10.1111/j.1365-2869.2009.00775.x)
32 Steriade, M. 2006 Grouping of brain rhythms in corticothalamic systems. Neuroscience 137,1087–1106. (doi:10.1016/j.neuroscience.2005.10.029)
33 Cash, S. S. et al. 2009 The human K-complex represents an isolated cortical down-state. Science324, 1084–1087. (doi:10.1126/science.1169626)
34 Evans, M. B. & Richardson, N. E. 1995 Demonstration of a 3–5 s periodicity betweenspindle bursts in NREM sleep in man. J. Sleep Res. 4, 196–197. (doi:10.1111/j.1365-2869.1995.tb00169.x)
35 Olbrich, E. & Achermann, P. 2008 Analysis of the temporal organization of sleep spindles inthe human sleep EEG using a phenomenological modeling approach. J. Biol. Phys. 34, 241–249.(doi:10.1007/s10867-008-9078-z)
36 Mölle, M., Marshall, L., Gais, S. & Born, J. 2002 Grouping of spindle activity during slowoscillations in human non-rapid eye movement sleep. J. Neurosci. 22, 10 941–10 947.
37 Wilson, M., Steyn-Ross, D., Sleigh, J., Steyn-Ross, M., Wilcocks, L. & Gillies, I. 2006 TheK-complex and slow oscillation in terms of a mean-field cortical model. J. Comput. Neurosci.21, 243–257. (doi:10.1007/s10827-006-7948-6)
38 Putilov, A. A. 2011 Prospects of using electroencephalographic signatures of thechronoregulatory processes for meaningful, parsimonious and quantitative description of thesleep–wake sub-states. Biol. Rhythm Res. 42, 181–207. (doi:10.1080/09291016.2010.491248)
39 Buckelmüller, J., Landolt, H.-P., Stassen, H. H. & Achermann, P. 2006 Trait-like individualdifferences in the human sleep electroencephalogram. Neuroscience 138, 351–356. (doi:10.1016/j.neuroscience.2005.11.005)
40 Achermann, P. 2006 Sleep. In Wiley encyclopedia of biomedical engineering (ed. M. Akay).New York, NY: John Wiley & Sons, Inc. (doi:10.1002/9780471740360.ebs1096)
41 Saper, C. B., Chou, T. C. & Scammell, T. E. 2001 The sleep switch: hypothalamic control ofsleep and wakefulness. Trends Neurosci. 24, 726–731. (doi:10.1016/S0166-2236(00)02002-6)
Phil. Trans. R. Soc. A (2011)
on June 14, 2018http://rsta.royalsocietypublishing.org/Downloaded from

Multiple time scales of sleep dynamics 3901
42 Lu, J., Sherman, D., Devor, M. & Saper, C. B. 2006 A putative flip-flop switch for control ofREM sleep. Nature 441, 589–594. (doi:10.1038/nature04767)
43 Robinson, P. A., Phillips, A. J. K., Fulcher, B. D., Puckeridge, M. & Roberts, J. A.2011 Quantitative modelling of sleep dynamics. Phil. Trans. R. Soc. A 369, 3840–3854.(doi:10.1098/rsta.2011.0120)
44 Horne, J. & Reyner, L. 1999 Vehicle accidents related to sleep: a review. Occup. Environ. Med.56, 289–294. (doi:10.1136/oem.56.5.289)
45 Halasz, P. 1998 Hierarchy of micro-arousals and the microstructure of sleep. Clin. Neurophysiol.28, 461–475. (doi:10.1016/S0987-7053(99)80016-1)
46 Lo, C.-C., Amaral, L. A. N., Havlin, S., Ivanov, P. C., Penzel, T., Peter, J.-H. & Stanley, H. E.2002 Dynamics of sleep–wake transitions during sleep. Europhys. Lett. 57, 625. (doi:10.1209/epl/i2002-00508-7)
47 Lo, C.-C., Chou, T., Penzel, T., Scammell, T. E., Strecker, R. E., Stanley, H. E. & Ivanov, P. C.2004 Common scale-invariant patterns of sleep–wake transitions across mammalian species.Proc. Natl Acad. Sci. USA 101, 17 545–17 548. (doi:10.1073/pnas.0408242101)
48 Blumberg, M. S., Seelke, A. M. H., Lowen, S. B. & Karlsson, K. A. E. 2005 Dynamicsof sleep–wake cyclicity in developing rats. Proc. Natl Acad. Sci. USA 102, 14 860–14 864.(doi:10.1073/pnas.0506340102)
49 Blake, H. & Gerard, W. R. 1937 Brain potentials during sleep. Am. J. Physiol. 119, 692–703.50 Dijk, J. D., Beersma, G. M. D. & Daan, S. 1987 EEG power density during nap sleep: reflection
of an hourglass measuring the duration of prior wakefulness. J. Biol. Rhythms 2, 207–219.(doi:10.1177/074873048700200304)
51 Daan, S., Beersma, G. M. D. & Borbély, A. A. 1984 Timing of human sleep: recovery processgated by a circadian pacemaker. Am. J. Physiol. 246, R161–R178.
52 Tononi, G. & Cirelli, C. 2003 Sleep and synaptic homeostasis: a hypothesis. Brain Res. Bull.62, 143–150. (doi:10.1016/j.brainresbull.2003.09.004)
53 Tononi, G. & Cirelli, C. 2006 Sleep function and synaptic homeostasis. Sleep Med. Rev. 10,49–62. (doi:10.1016/j.smrv.2005.05.002)
54 Hill, S. & Tononi, G. 2005 Modeling sleep and wakefulness in the thalamocortical system.J. Neurophysiol. 93, 1671–1698. (doi:10.1152/jn.00915.2004)
55 Esser, S. K., Hill, S. L. & Tononi, G. 2007 Sleep homeostasis and cortical synchronization: I.Modeling the effects of synaptic strength on sleep slow waves. Sleep 30, 1617–1630.
56 Borbély, A. A. 1982 A two process model of sleep regulation. Hum. Neurobiol. 1, 195–204.57 Achermann, P., Dijk, D. J., Brunner, D. P. & Borbély, A. A. 1993 A model of human sleep
homeostasis based on EEG slow-wave activity: quantitative comparison of data and simulations.Brain Res. Bull. 31, 97–113. (doi:10.1016/0361-9230(93)90016-5)
58 Ferrillo, F., Donadio, S., Carli, F., Garbarino, S. & Nobili, L. 2007 A model-based approach tohomeostatic and ultradian aspects of nocturnal sleep structure in narcolepsy. Sleep 30, 157–165.
59 Zavada, A., Strijkstra, A. M., Boerema, A. S., Daan, S. & Beersma, D. G. M. 2009 Evidencefor differential human slow-wave activity regulation across the brain. J. Sleep Res. 18, 3–10.(doi:10.1111/j.1365-2869.2008.00696.x)
60 Rempe, M. J., Best, J. & Terman, D. 2010 A mathematical model of the sleep/wake cycle.J. Math. Biol. 60, 615–644. (doi:10.1007/s00285-009-0276-5)
61 Phillips, A. J. K. & Robinson, P. A. 2007 A quantitative model of sleep–wake dynamics basedon the physiology of the brainstem ascending arousal system. J. Biol. Rhythms 22, 167–179.(doi:10.1177/0748730406297512)
62 Postnova, S., Voigt, K. & Braun, H. A. 2009 A mathematical model of homeostatic regulationof sleep–wake cycles by hypocretin/orexin. J. Biol. Rhythms 24, 523–535. (doi:10.1177/0748730409346655)
Phil. Trans. R. Soc. A (2011)
on June 14, 2018http://rsta.royalsocietypublishing.org/Downloaded from